The Optimization of the Location and Capacity of Reactive Power Generation Units, Using a Hybrid Genetic Algorithm Incorporated by the Bus Impedance Power-Flow Calculation Method
Abstract
1. Introduction
1.1. Contributions and Impacts of This Study
- (1)
- A GA that optimizes the location and capacity of RPG units with an objective function (which minimizes variation in voltage, the installation cost of RPG units, and losses), equal and unequal constraints, and varying demands is proposed.
- (2)
- The proposed GA has an integrated bus impedance matrix power flow calculation method that models tap-changing transformers.
- (3)
- Case studies performed with IEEE 14-, 30-, and 57-bus test systems demonstrate the validity of the proposed GA.
1.2. Structure of This Paper
2. Bus Impedance Power Flow Method
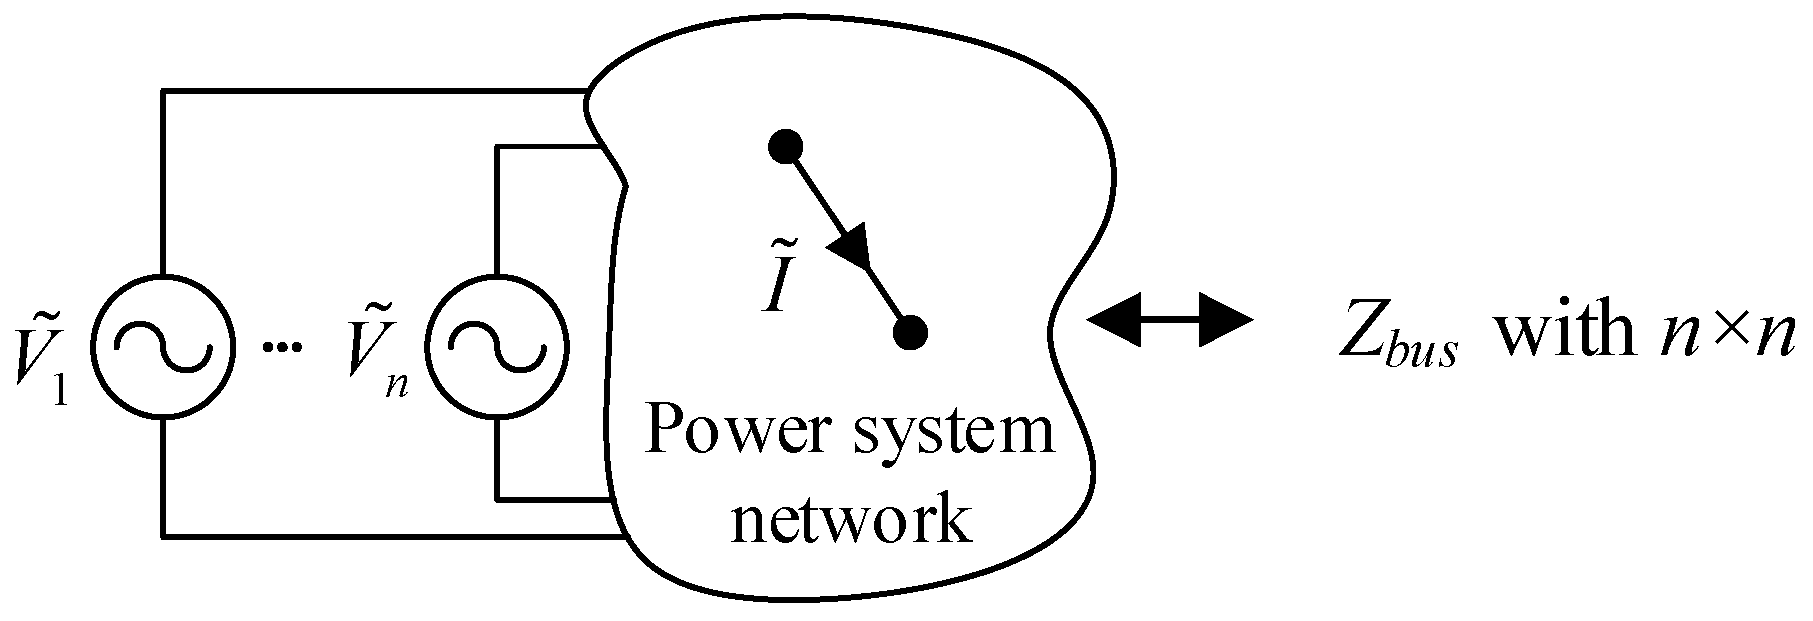
2.1. Bus Impedance Matrix
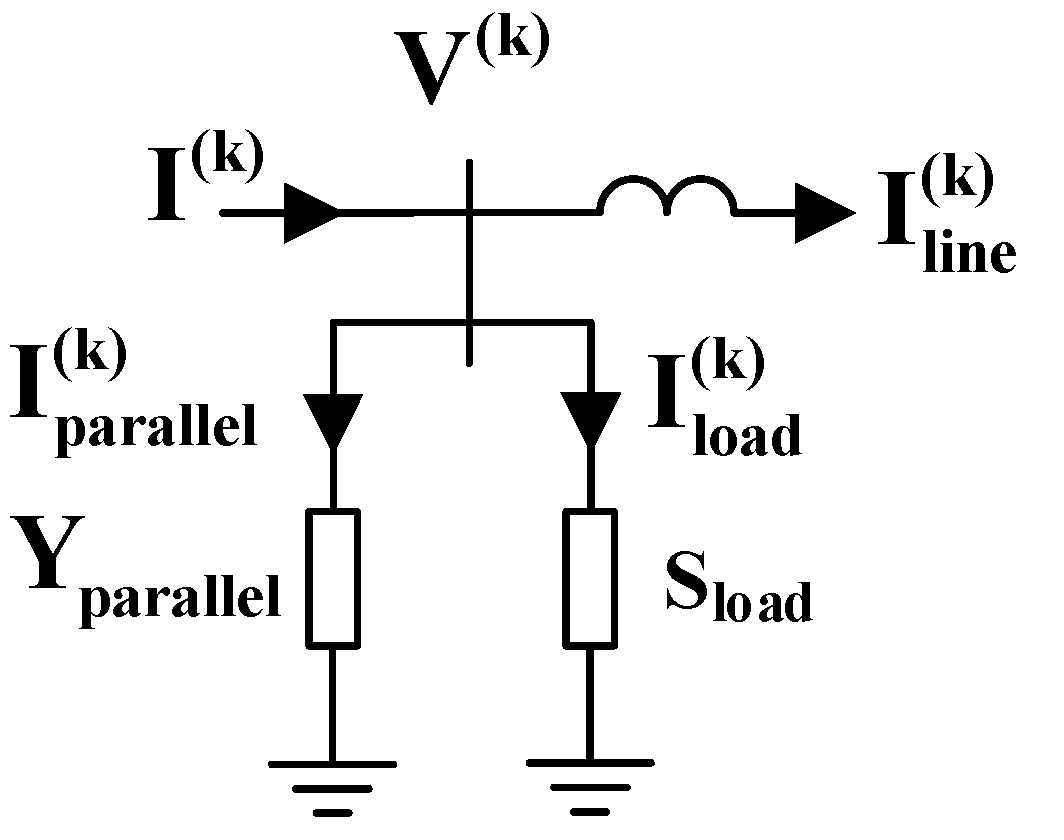
2.2. Iterative Current Injection Method
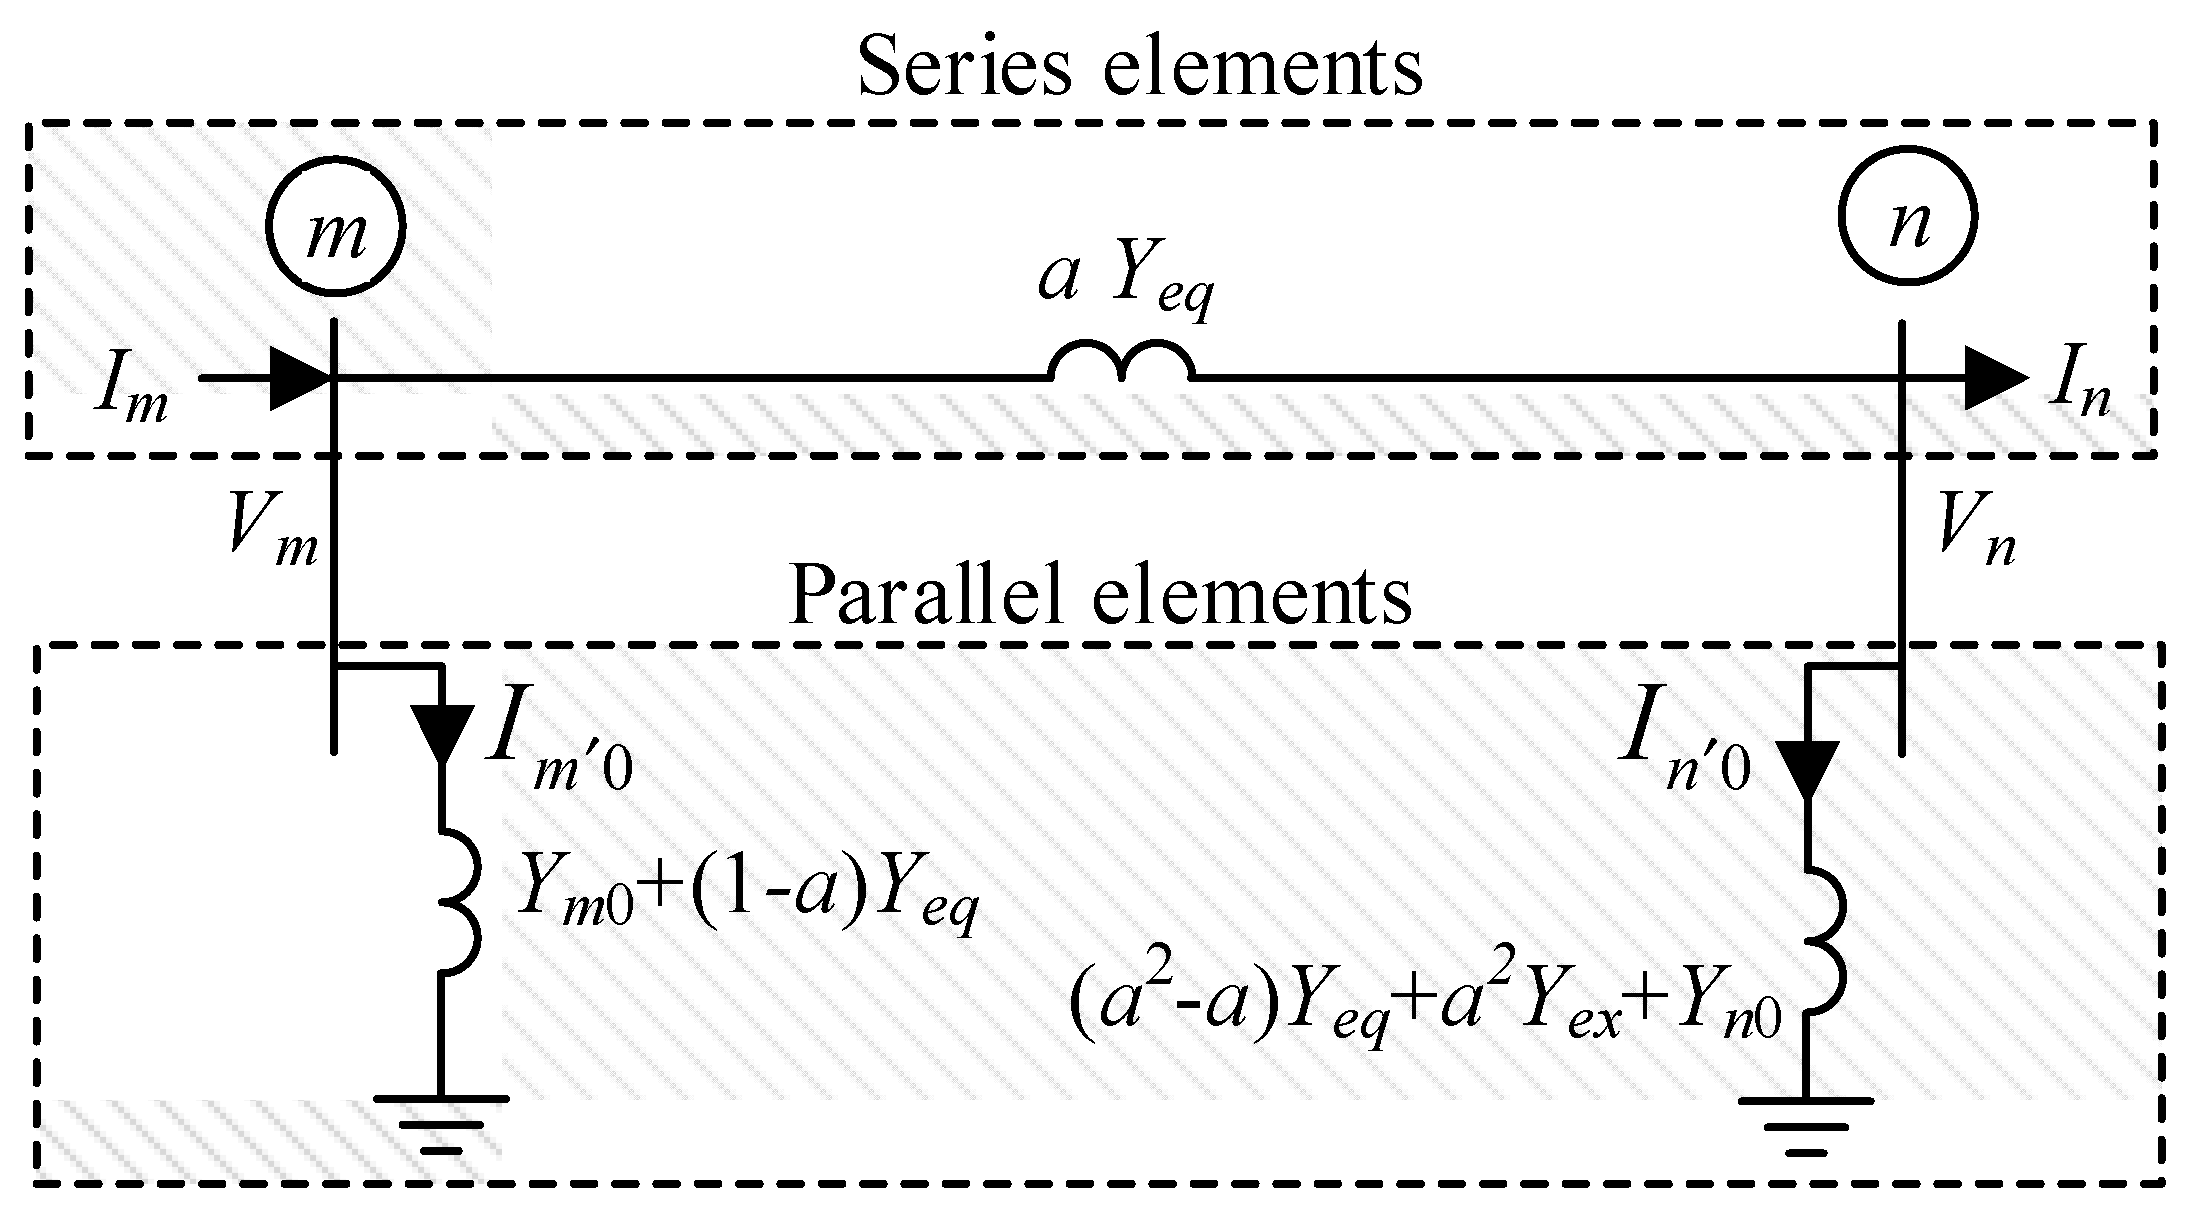
2.3. Tap-Changing Transformer Model
3. Genetic Algorithm
3.1. Objective Function
3.2. Optimization Variables
- (1)
- Capacity: the capacity of an RPG unit is optimally determined with the following constraint.
- (2)
- Location: RPG units can be connected to any bus, except the slack bus.
- (3)
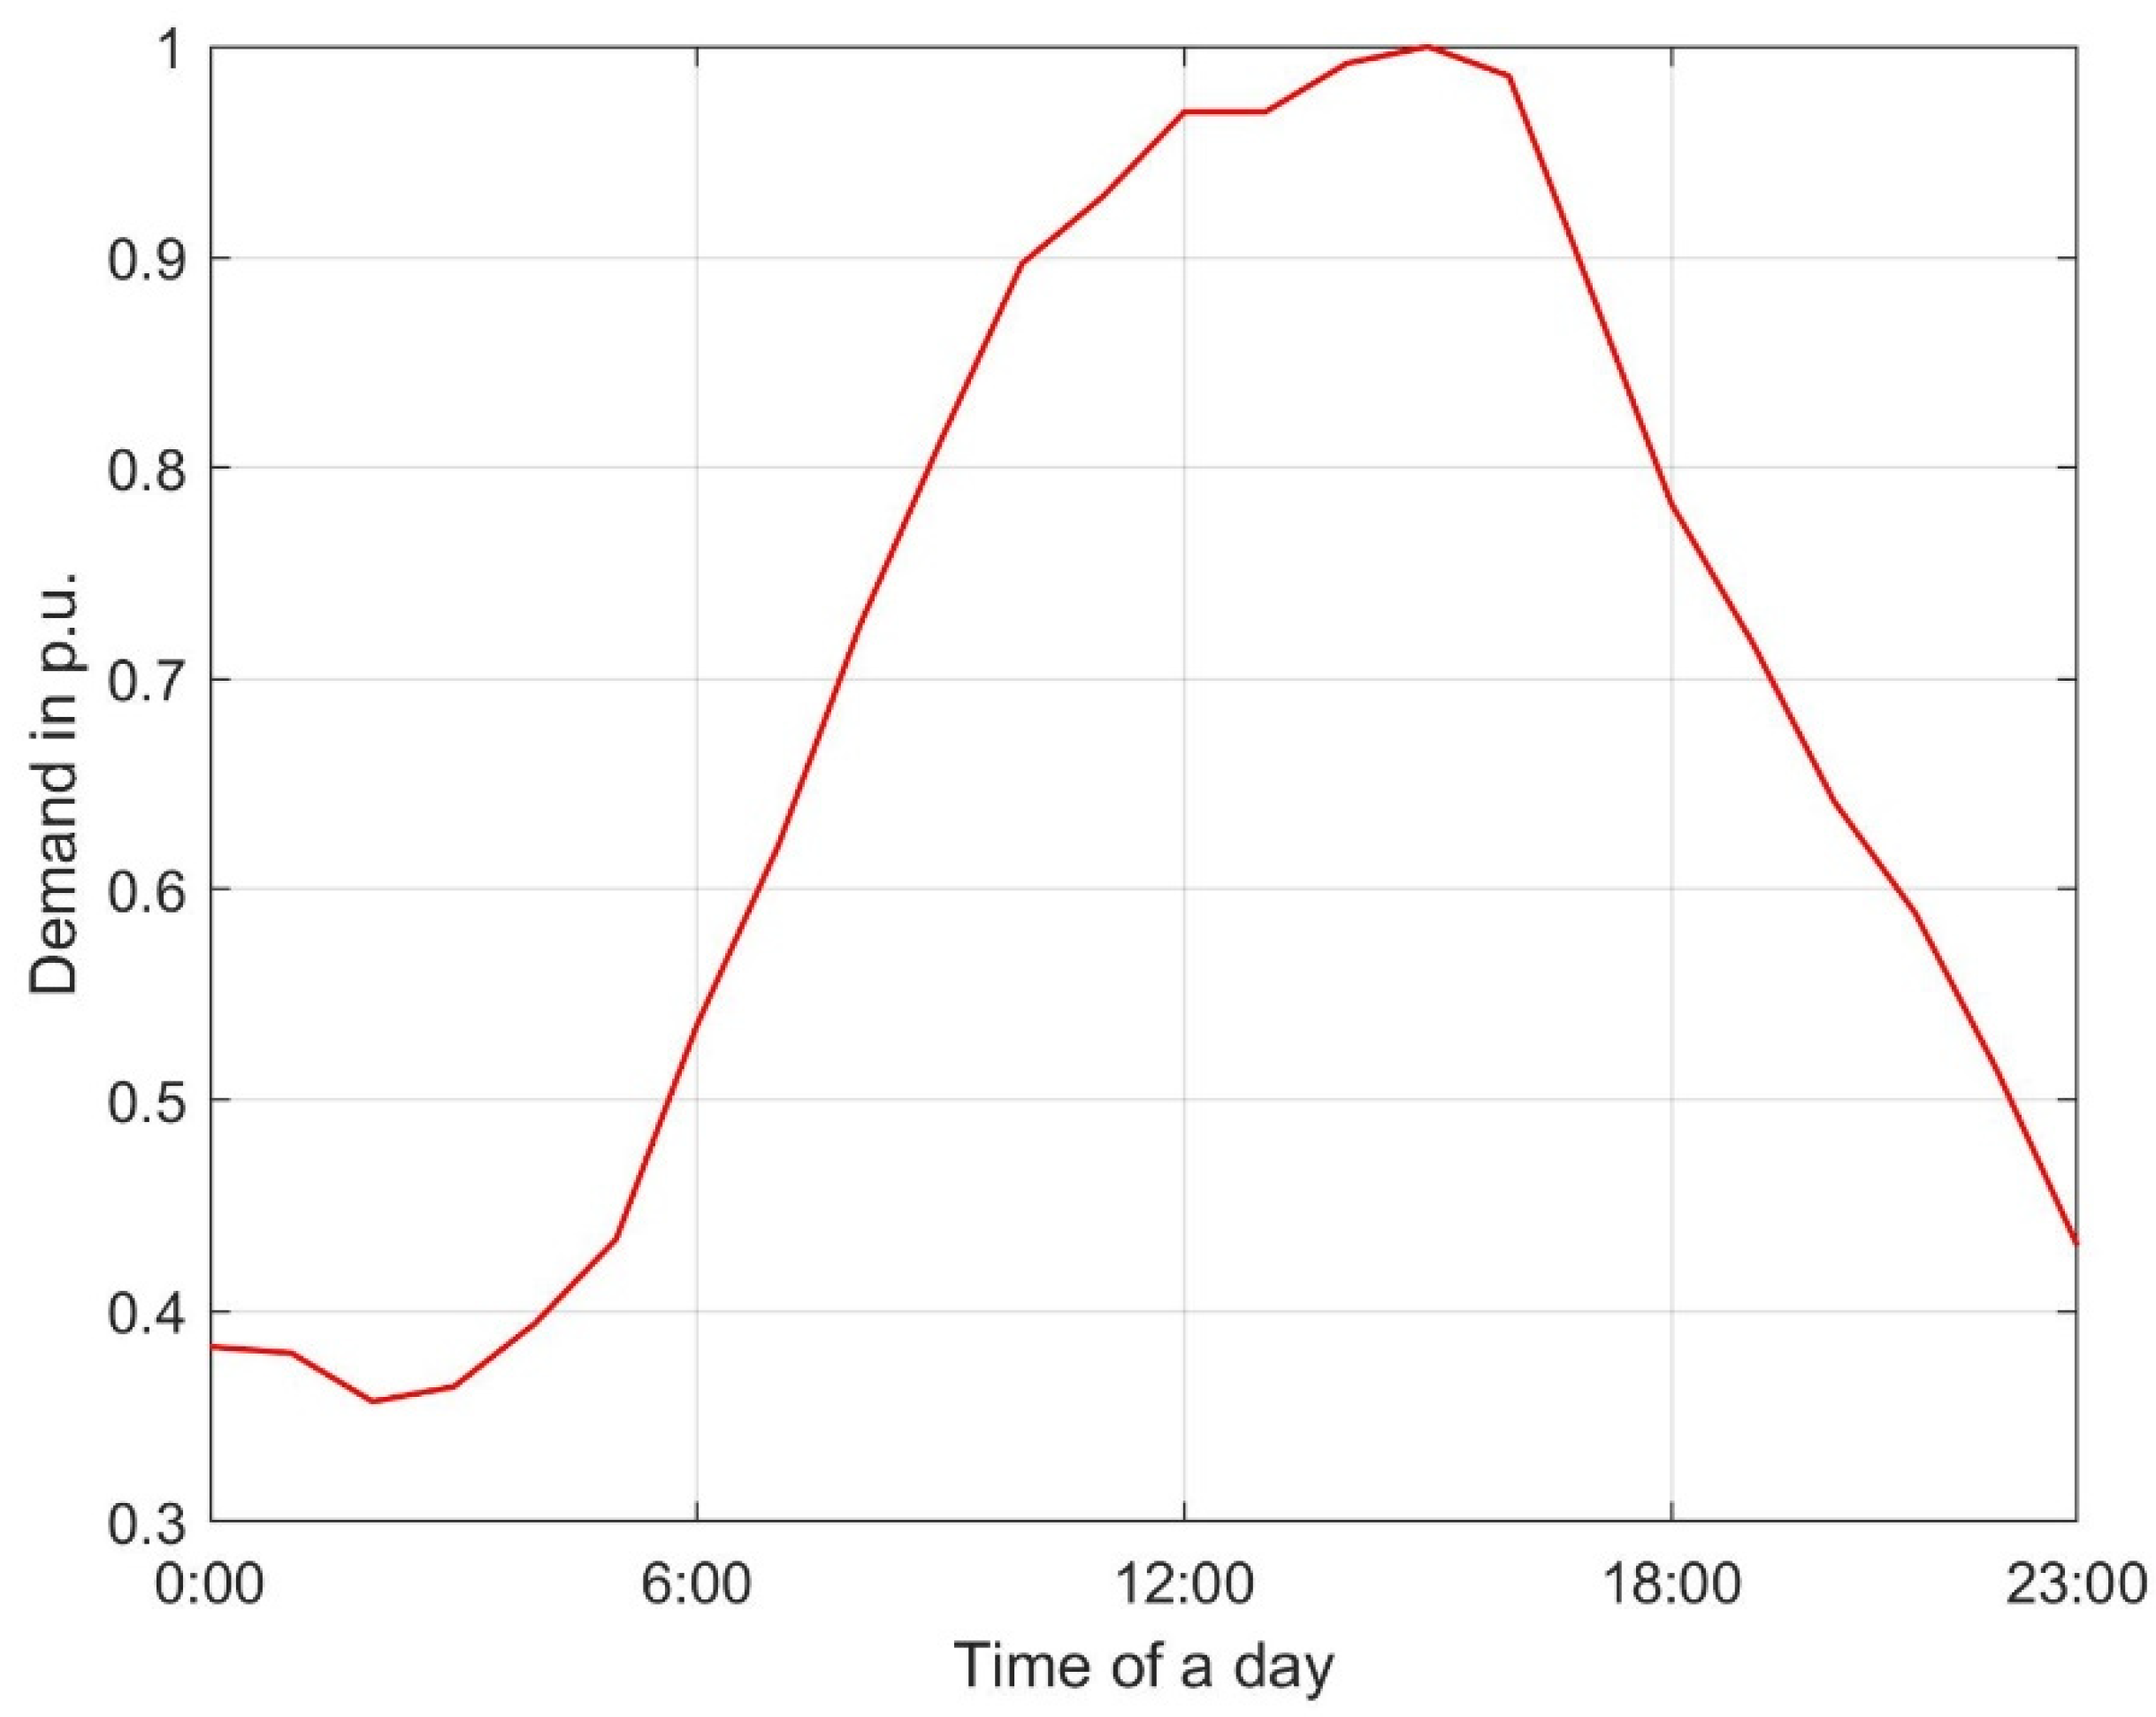
- Demand: the optimization of RPG units should take continuously varying demands into account during the optimization period. Thus, this study collected the typical load profile data in Figure 5 from [41]. The data show a peak demand of 1.0 p.u. at 15:00, and a load factor of 0.68. These data are used as input for GA.
3.3. Genetic Algorithm
- (1)
- Initialization: the GA initializes offspring members of the first generation with uniform random numbers. The offspring, O, is defined bywhere A = { ai | ai is a bus, excluding a slack bus } and Smax represents maximum capacity.
- (2)
- Fitness and reproduction: the objective function (14) calculates a fitness score for each offspring member. A normalized geometric ranking selection scheme is used [42]. A lower geometric rank (Ri) means a lower objective function value. Each slot size of a scaled roulette wheel is calculated bywhere p is the probability that produces the fittest offspring, and Pi is the probability of the slot size of the scaled roulette wheel.Subsequently, the GA distributes random numbers to the scaled roulette wheel’s slots, according to slot size (probability), and reproduces offspring members according to the number of random numbers that belong to each slot. This means that offspring with higher fitness in their objective function have a higher selection probability.
- (3)
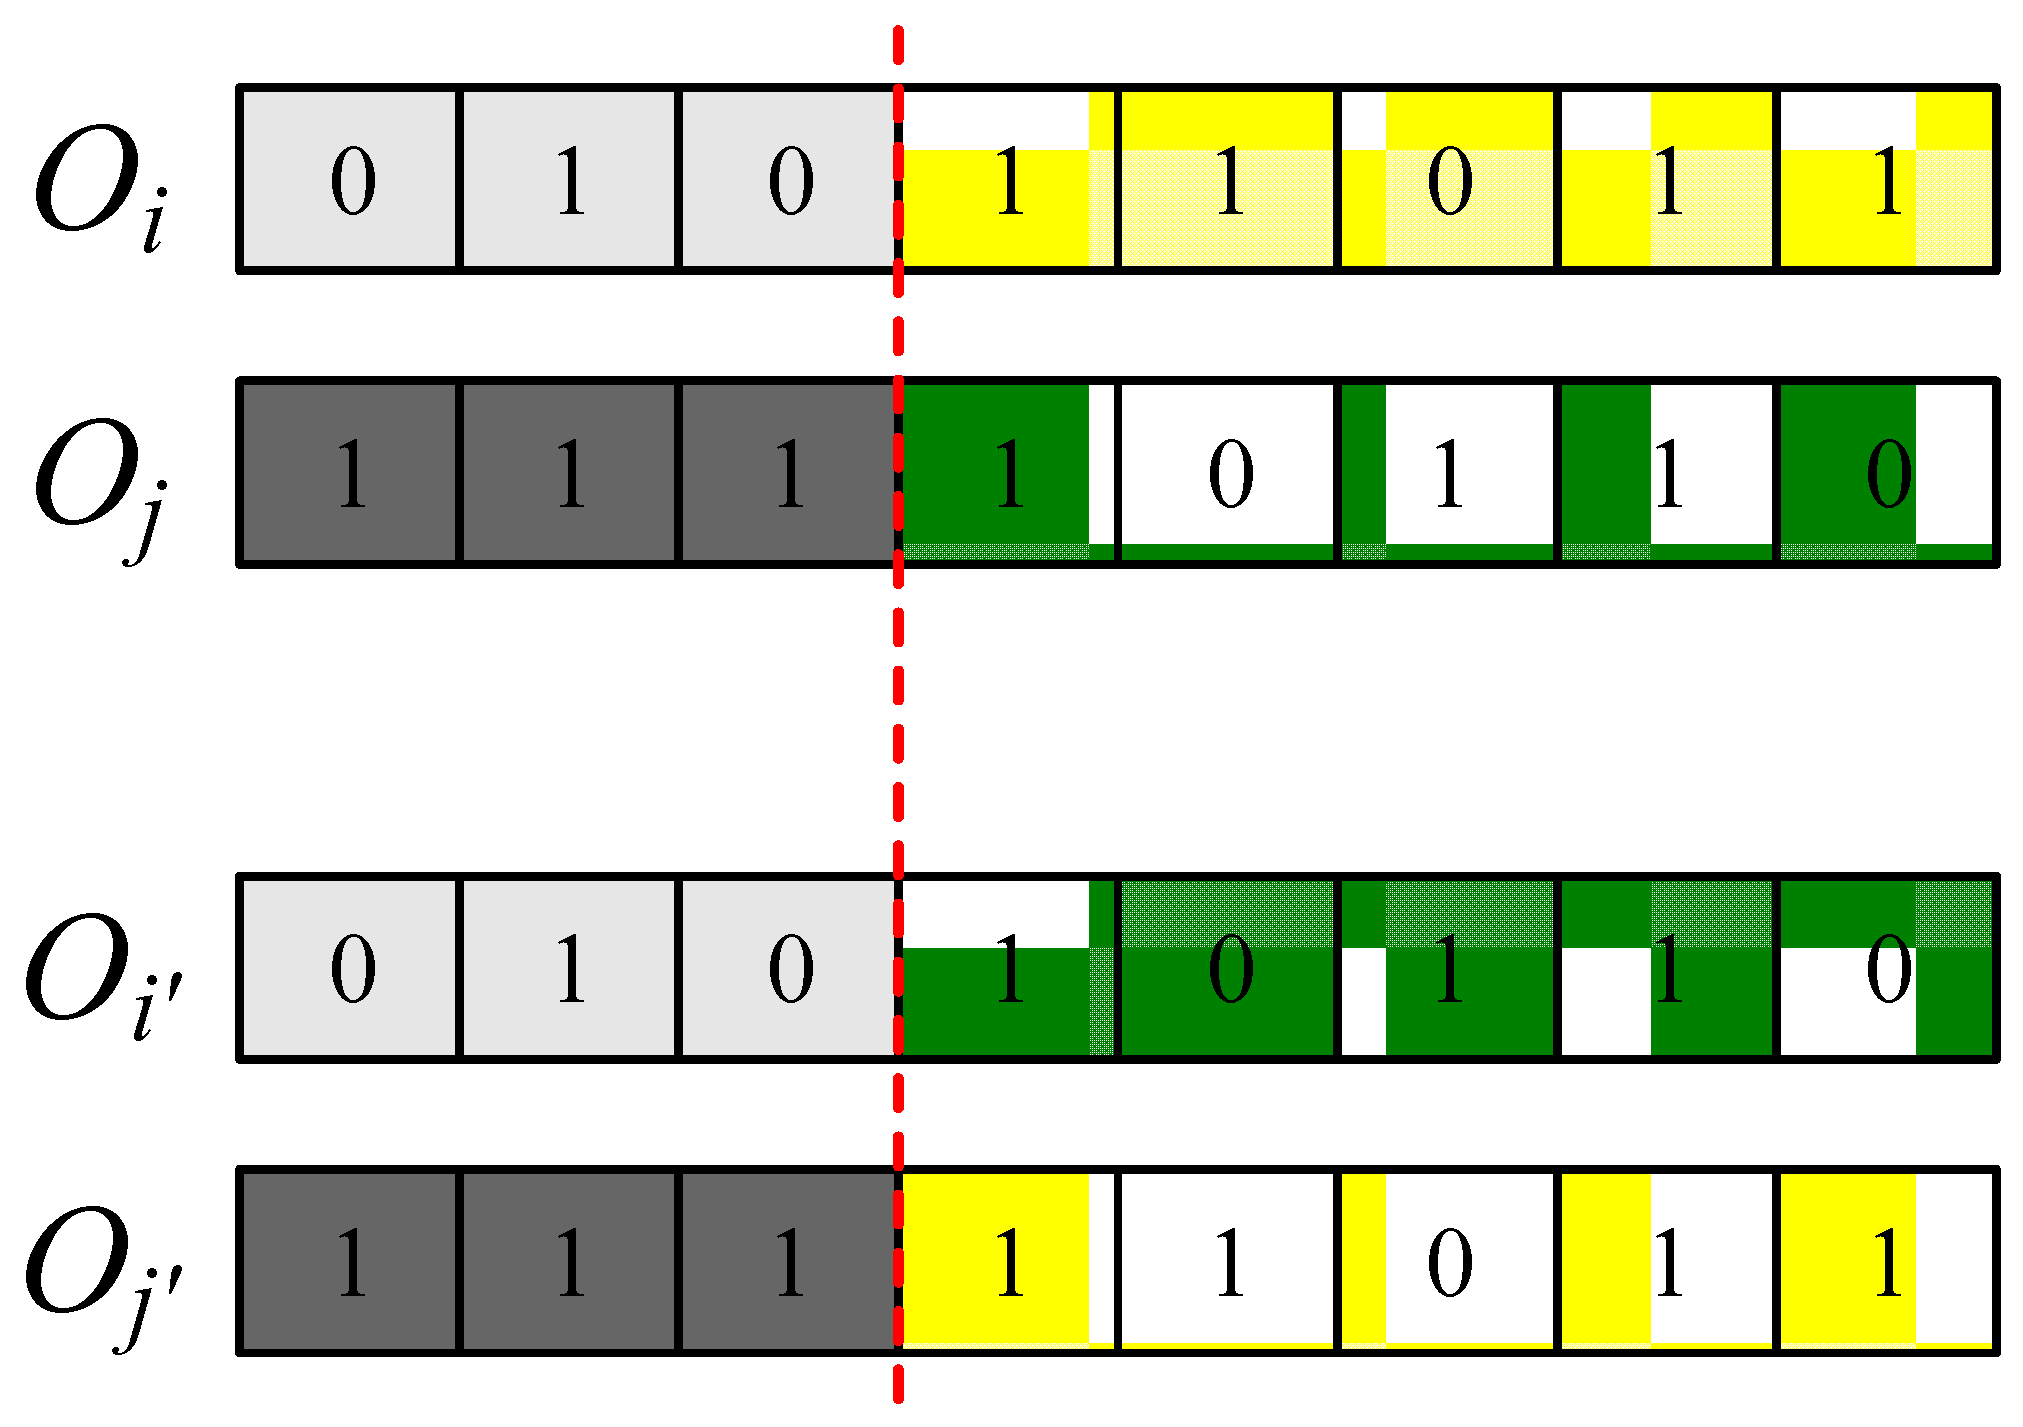
- Crossover and mutation: an arithmetic crossover operation that combines two offsprings (Oi and Oj) is performed in Figure 6, so it produces new offsprings: Oi’ and Oj’. To avoid convergence to a local minimum, a new offspring member, Ok’, is also generated by single-position uniform mutation in Figure 7.
4. Case Studies
4.1. Validation of Power-Flow Calculation Method
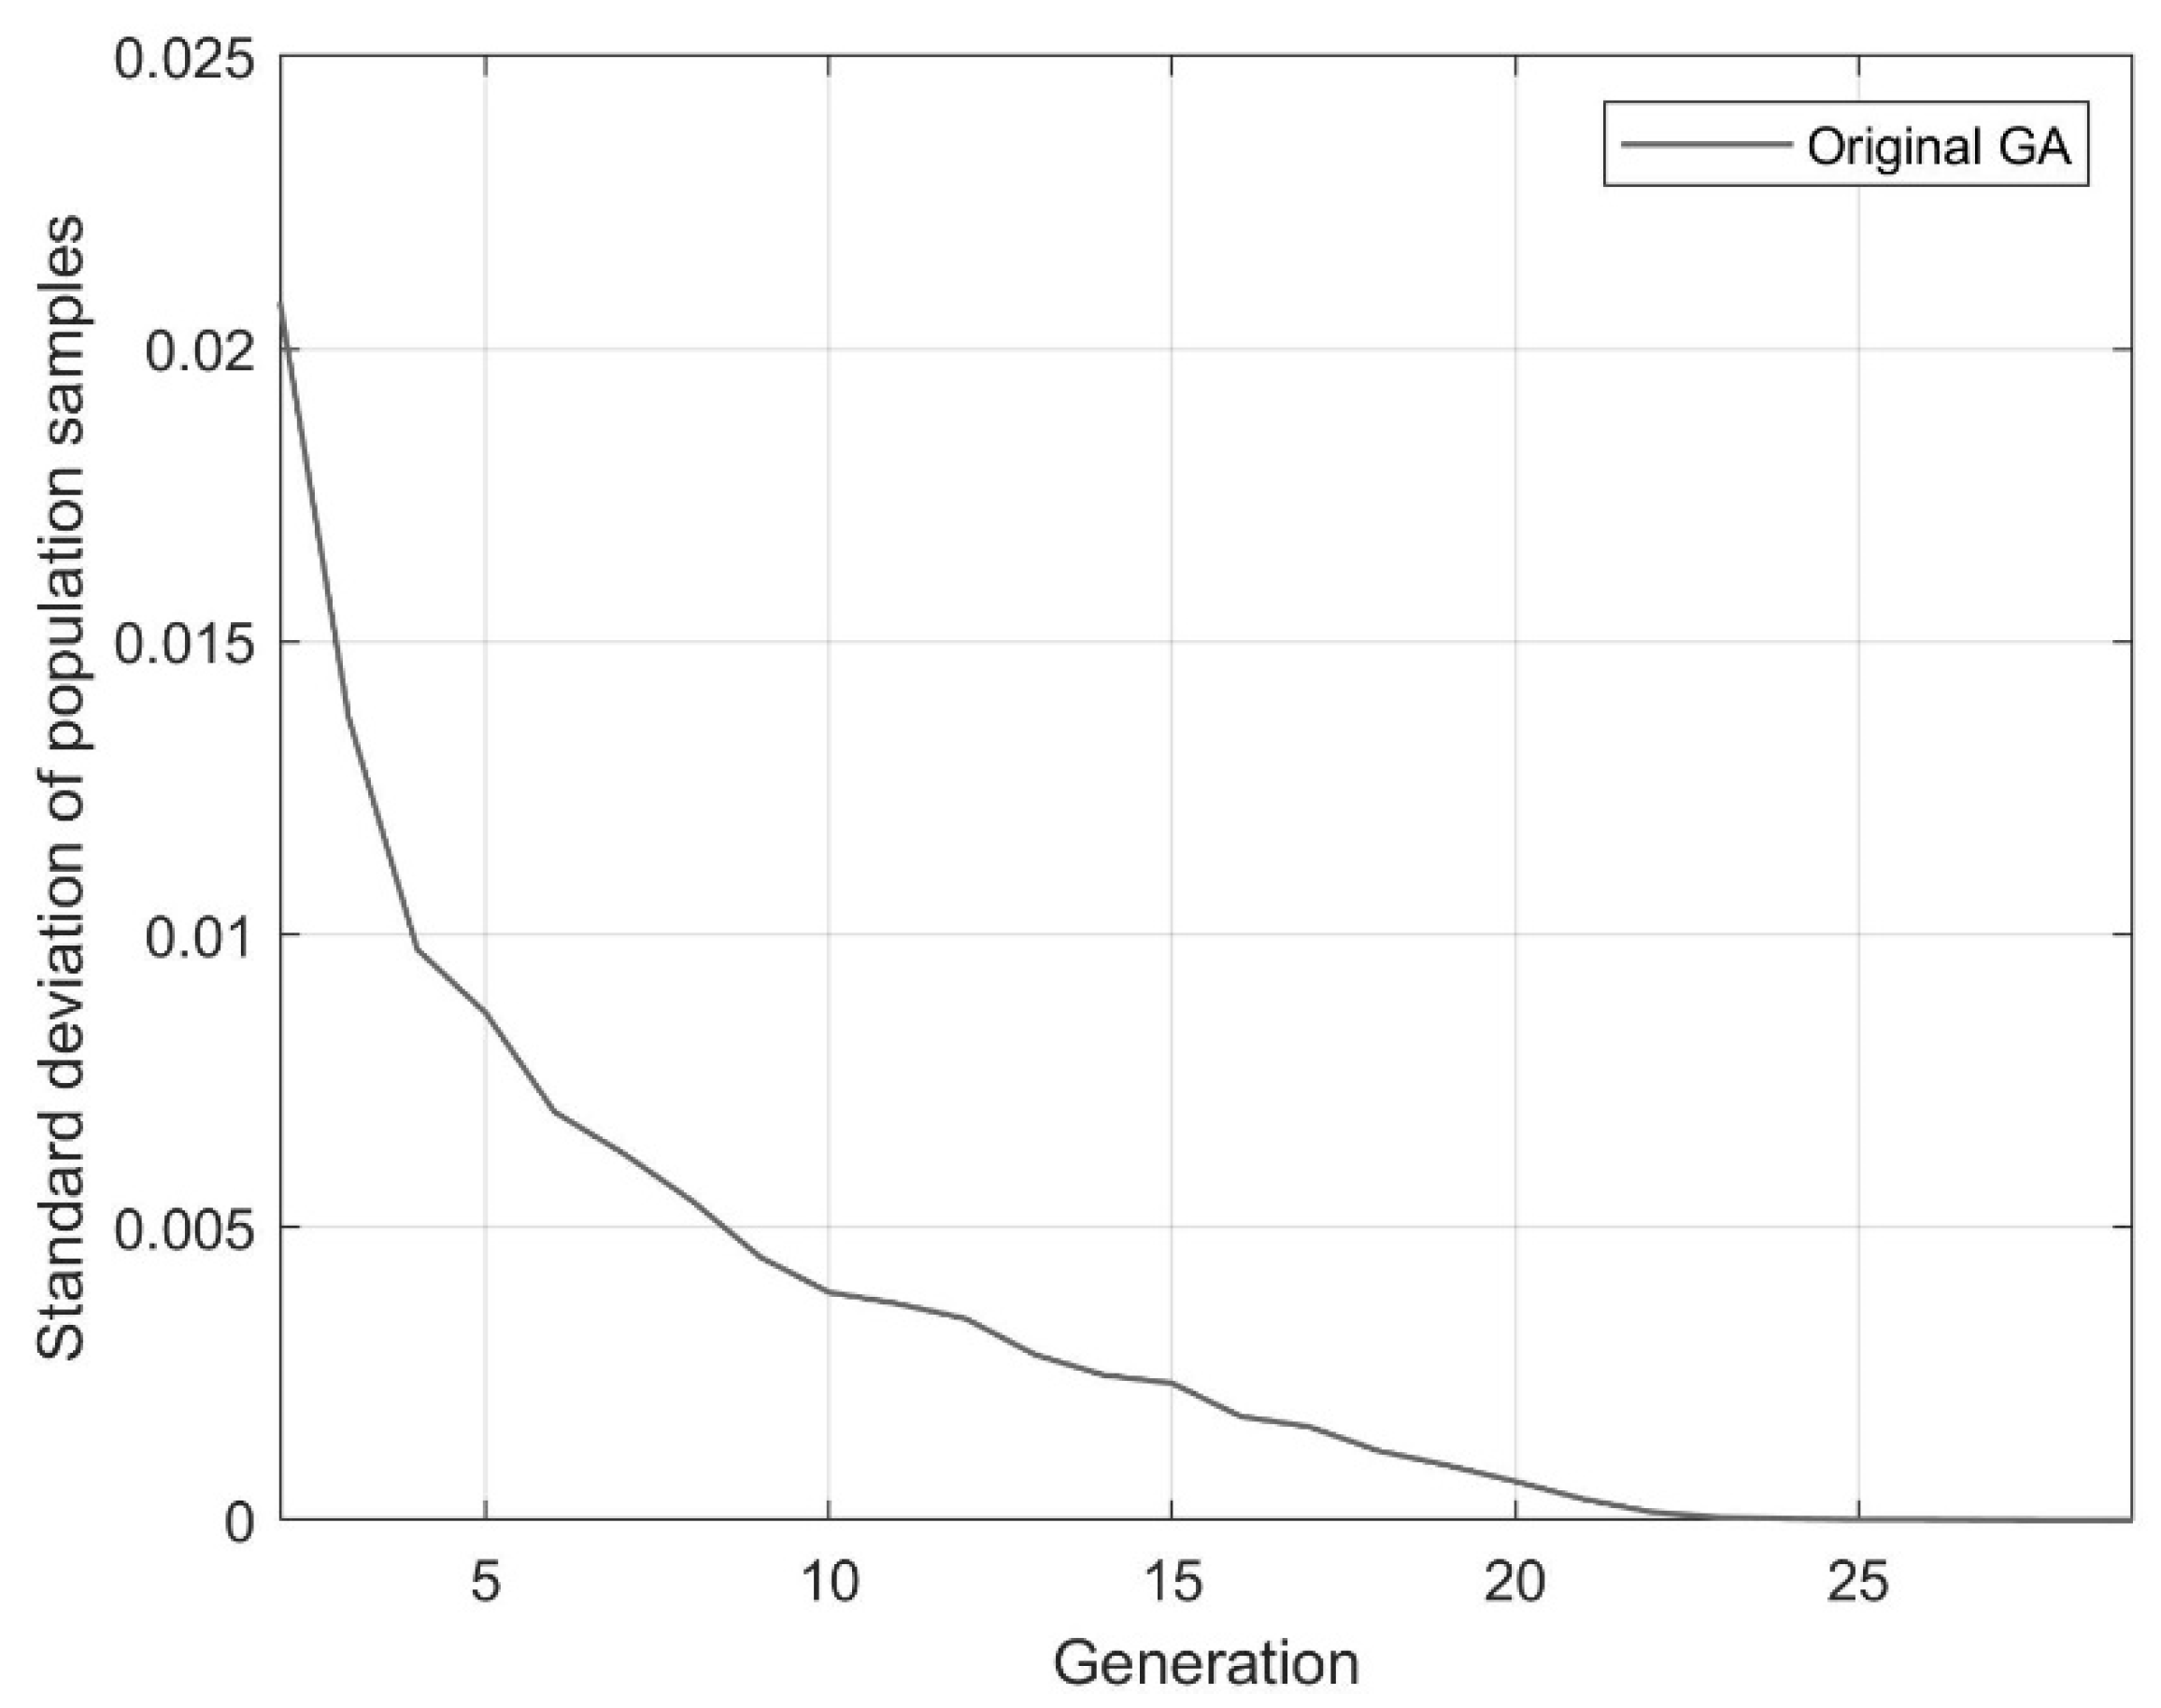
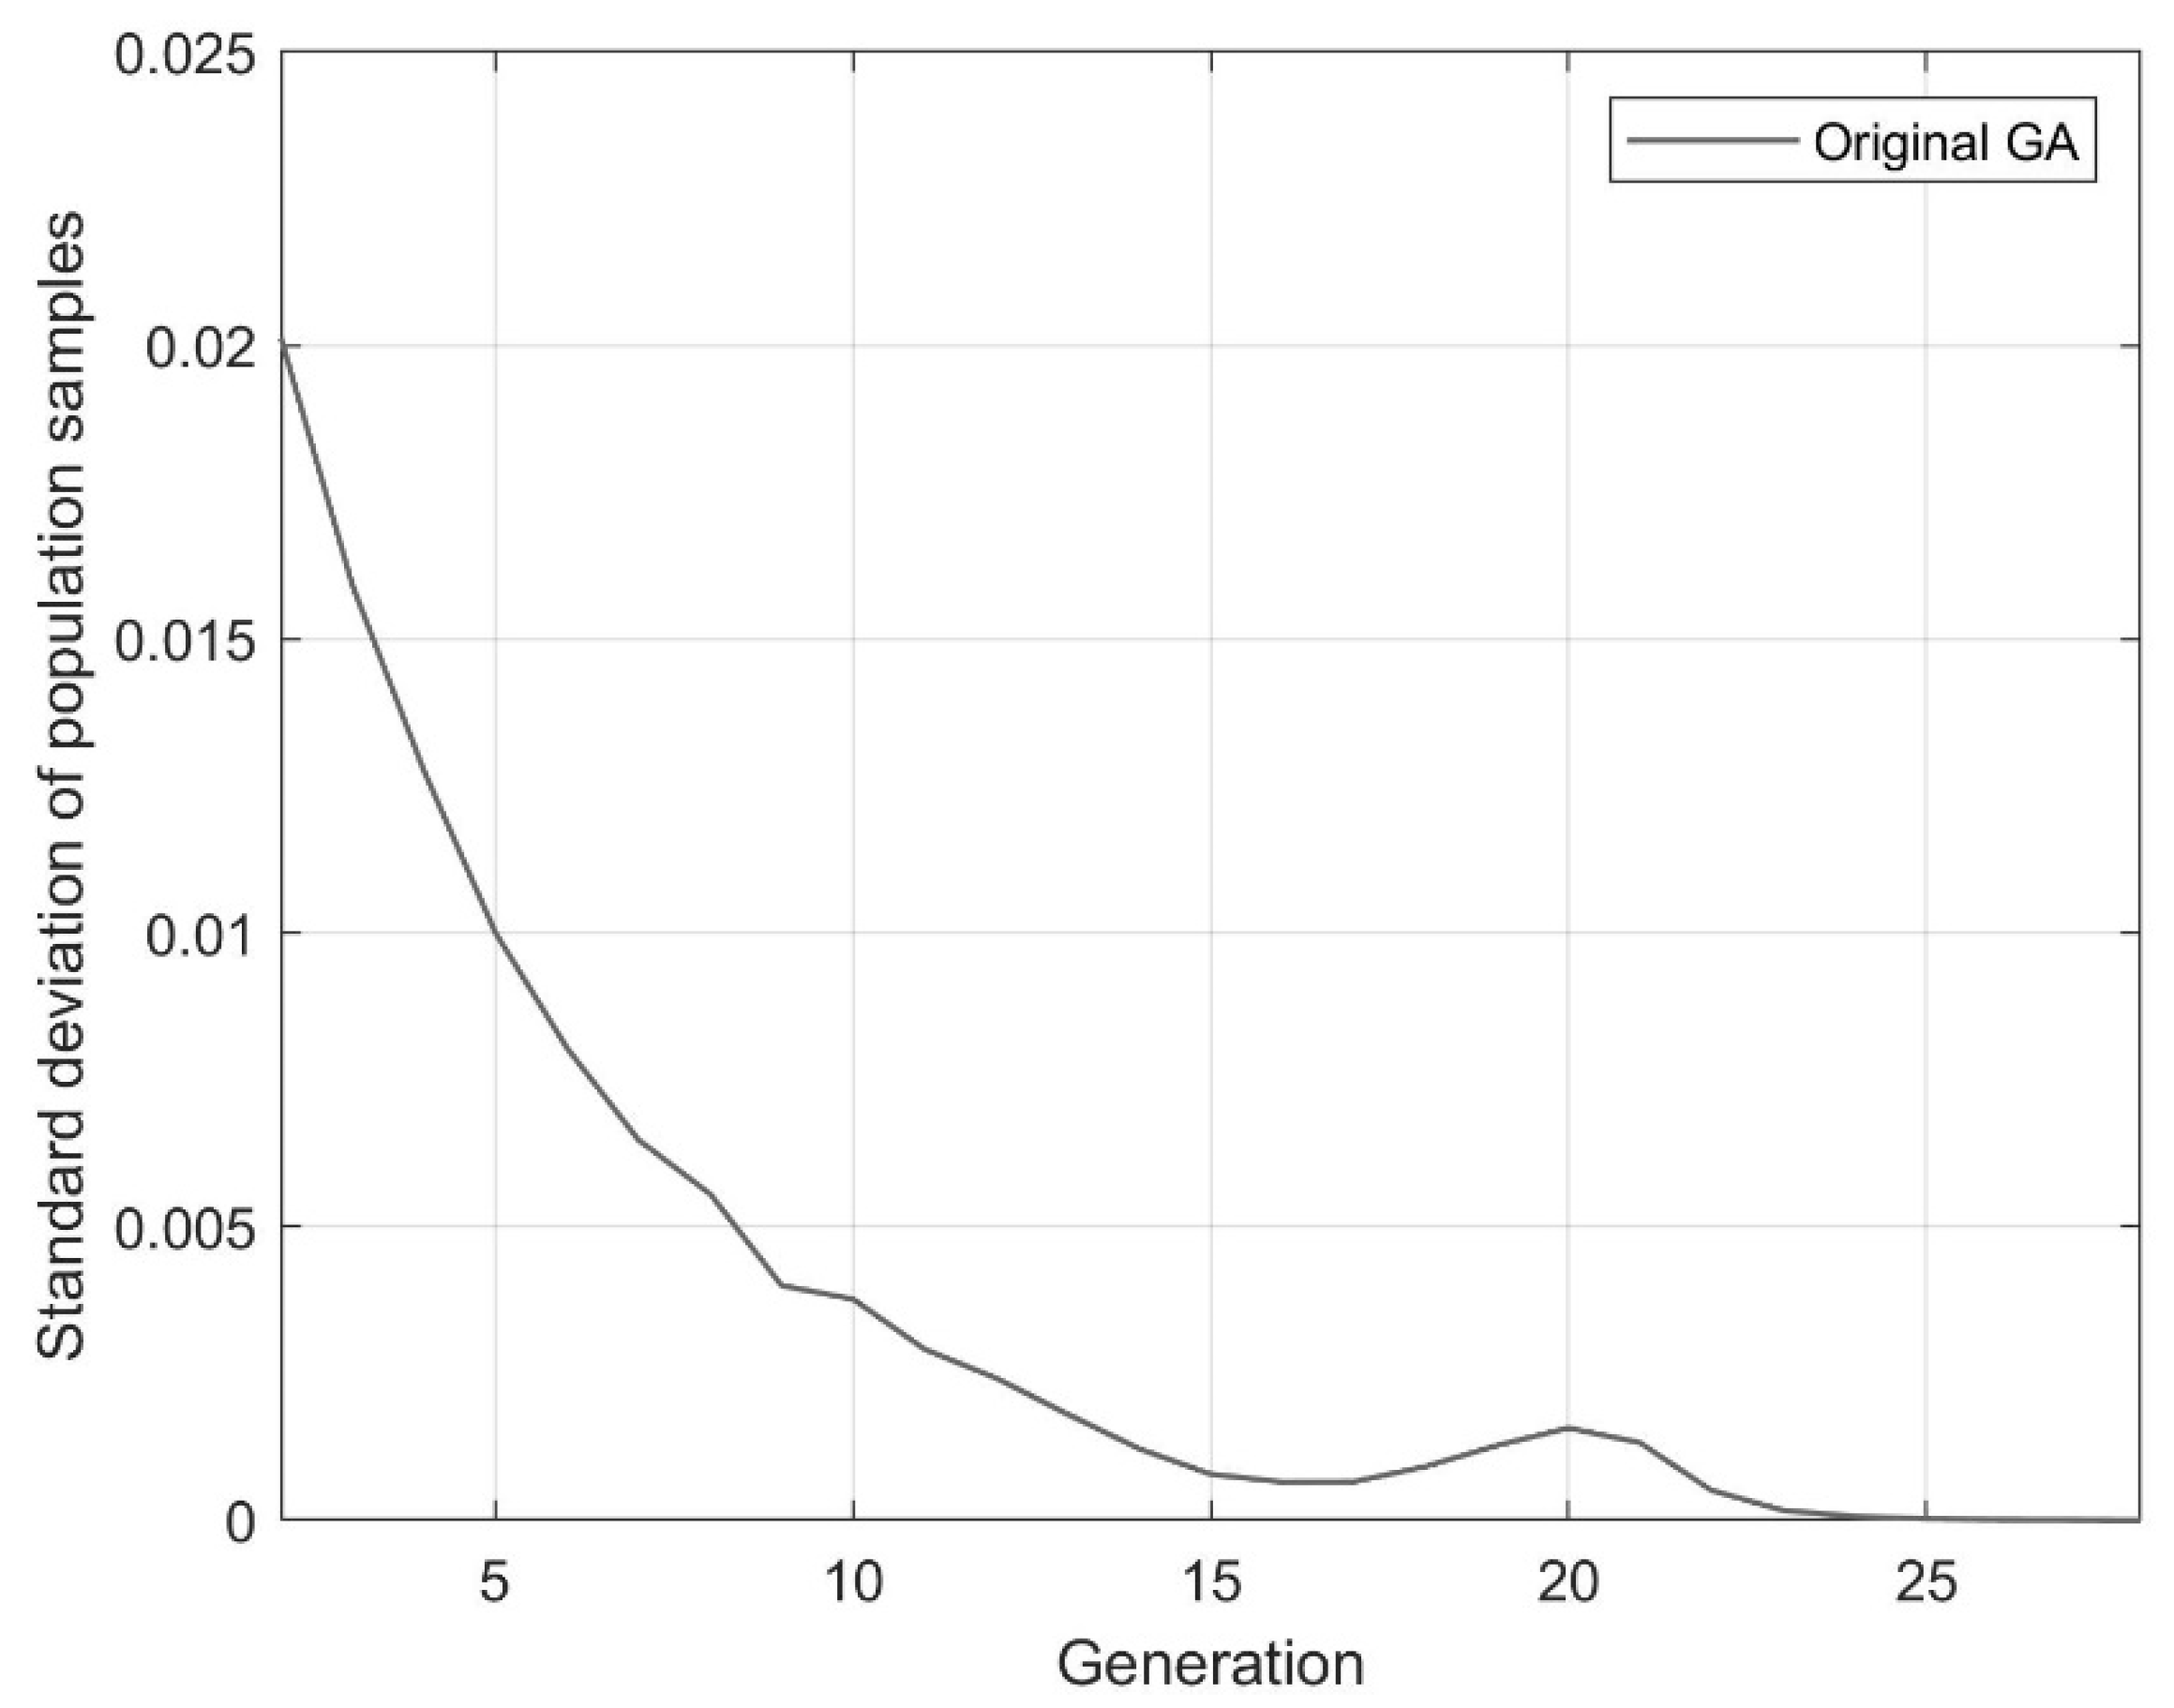
4.2. Validation of the Genetic Algorithm
- (1)
- The maximum capacity of an RPG unit is 100% of the base MVA of the system (i.e., 100 MVA);
- (2)
- RPG units can be connected to all buses except the slack bus;
- (3)
- The weighting factors in the objective function are equal;
- (4)
- The nominal voltage of the slack and P–V buses is set to 1∠0° p.u.
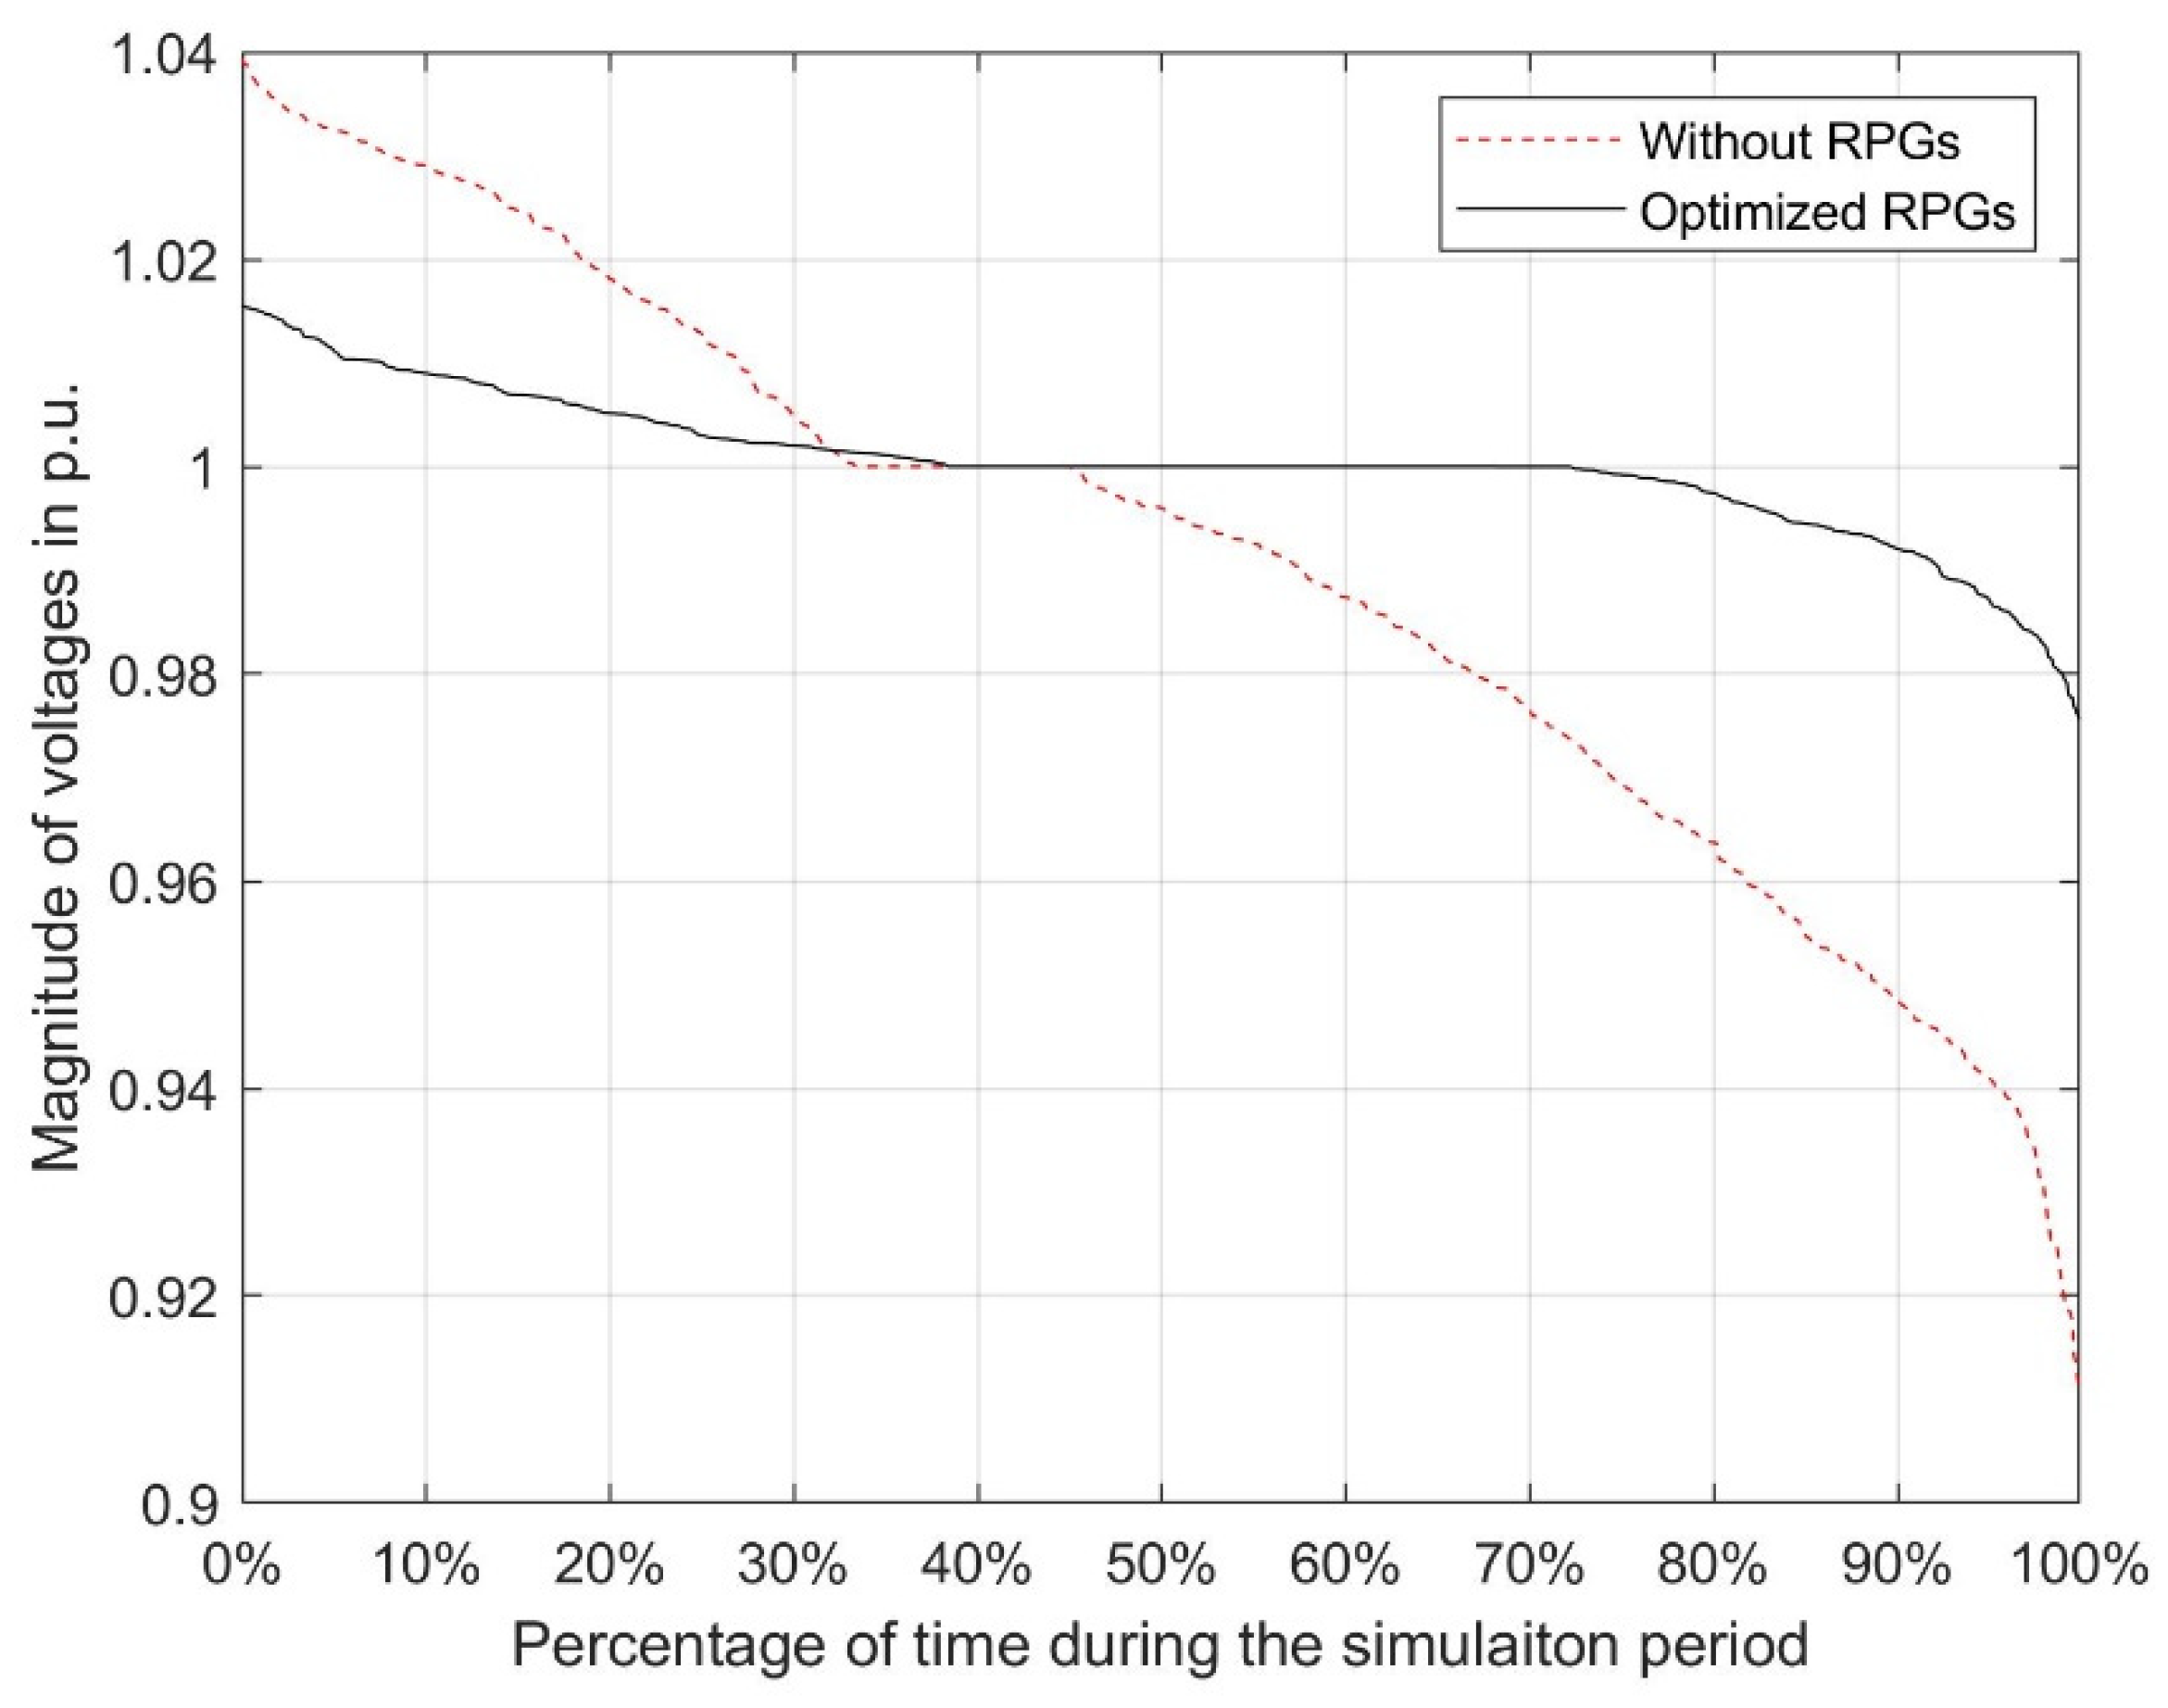
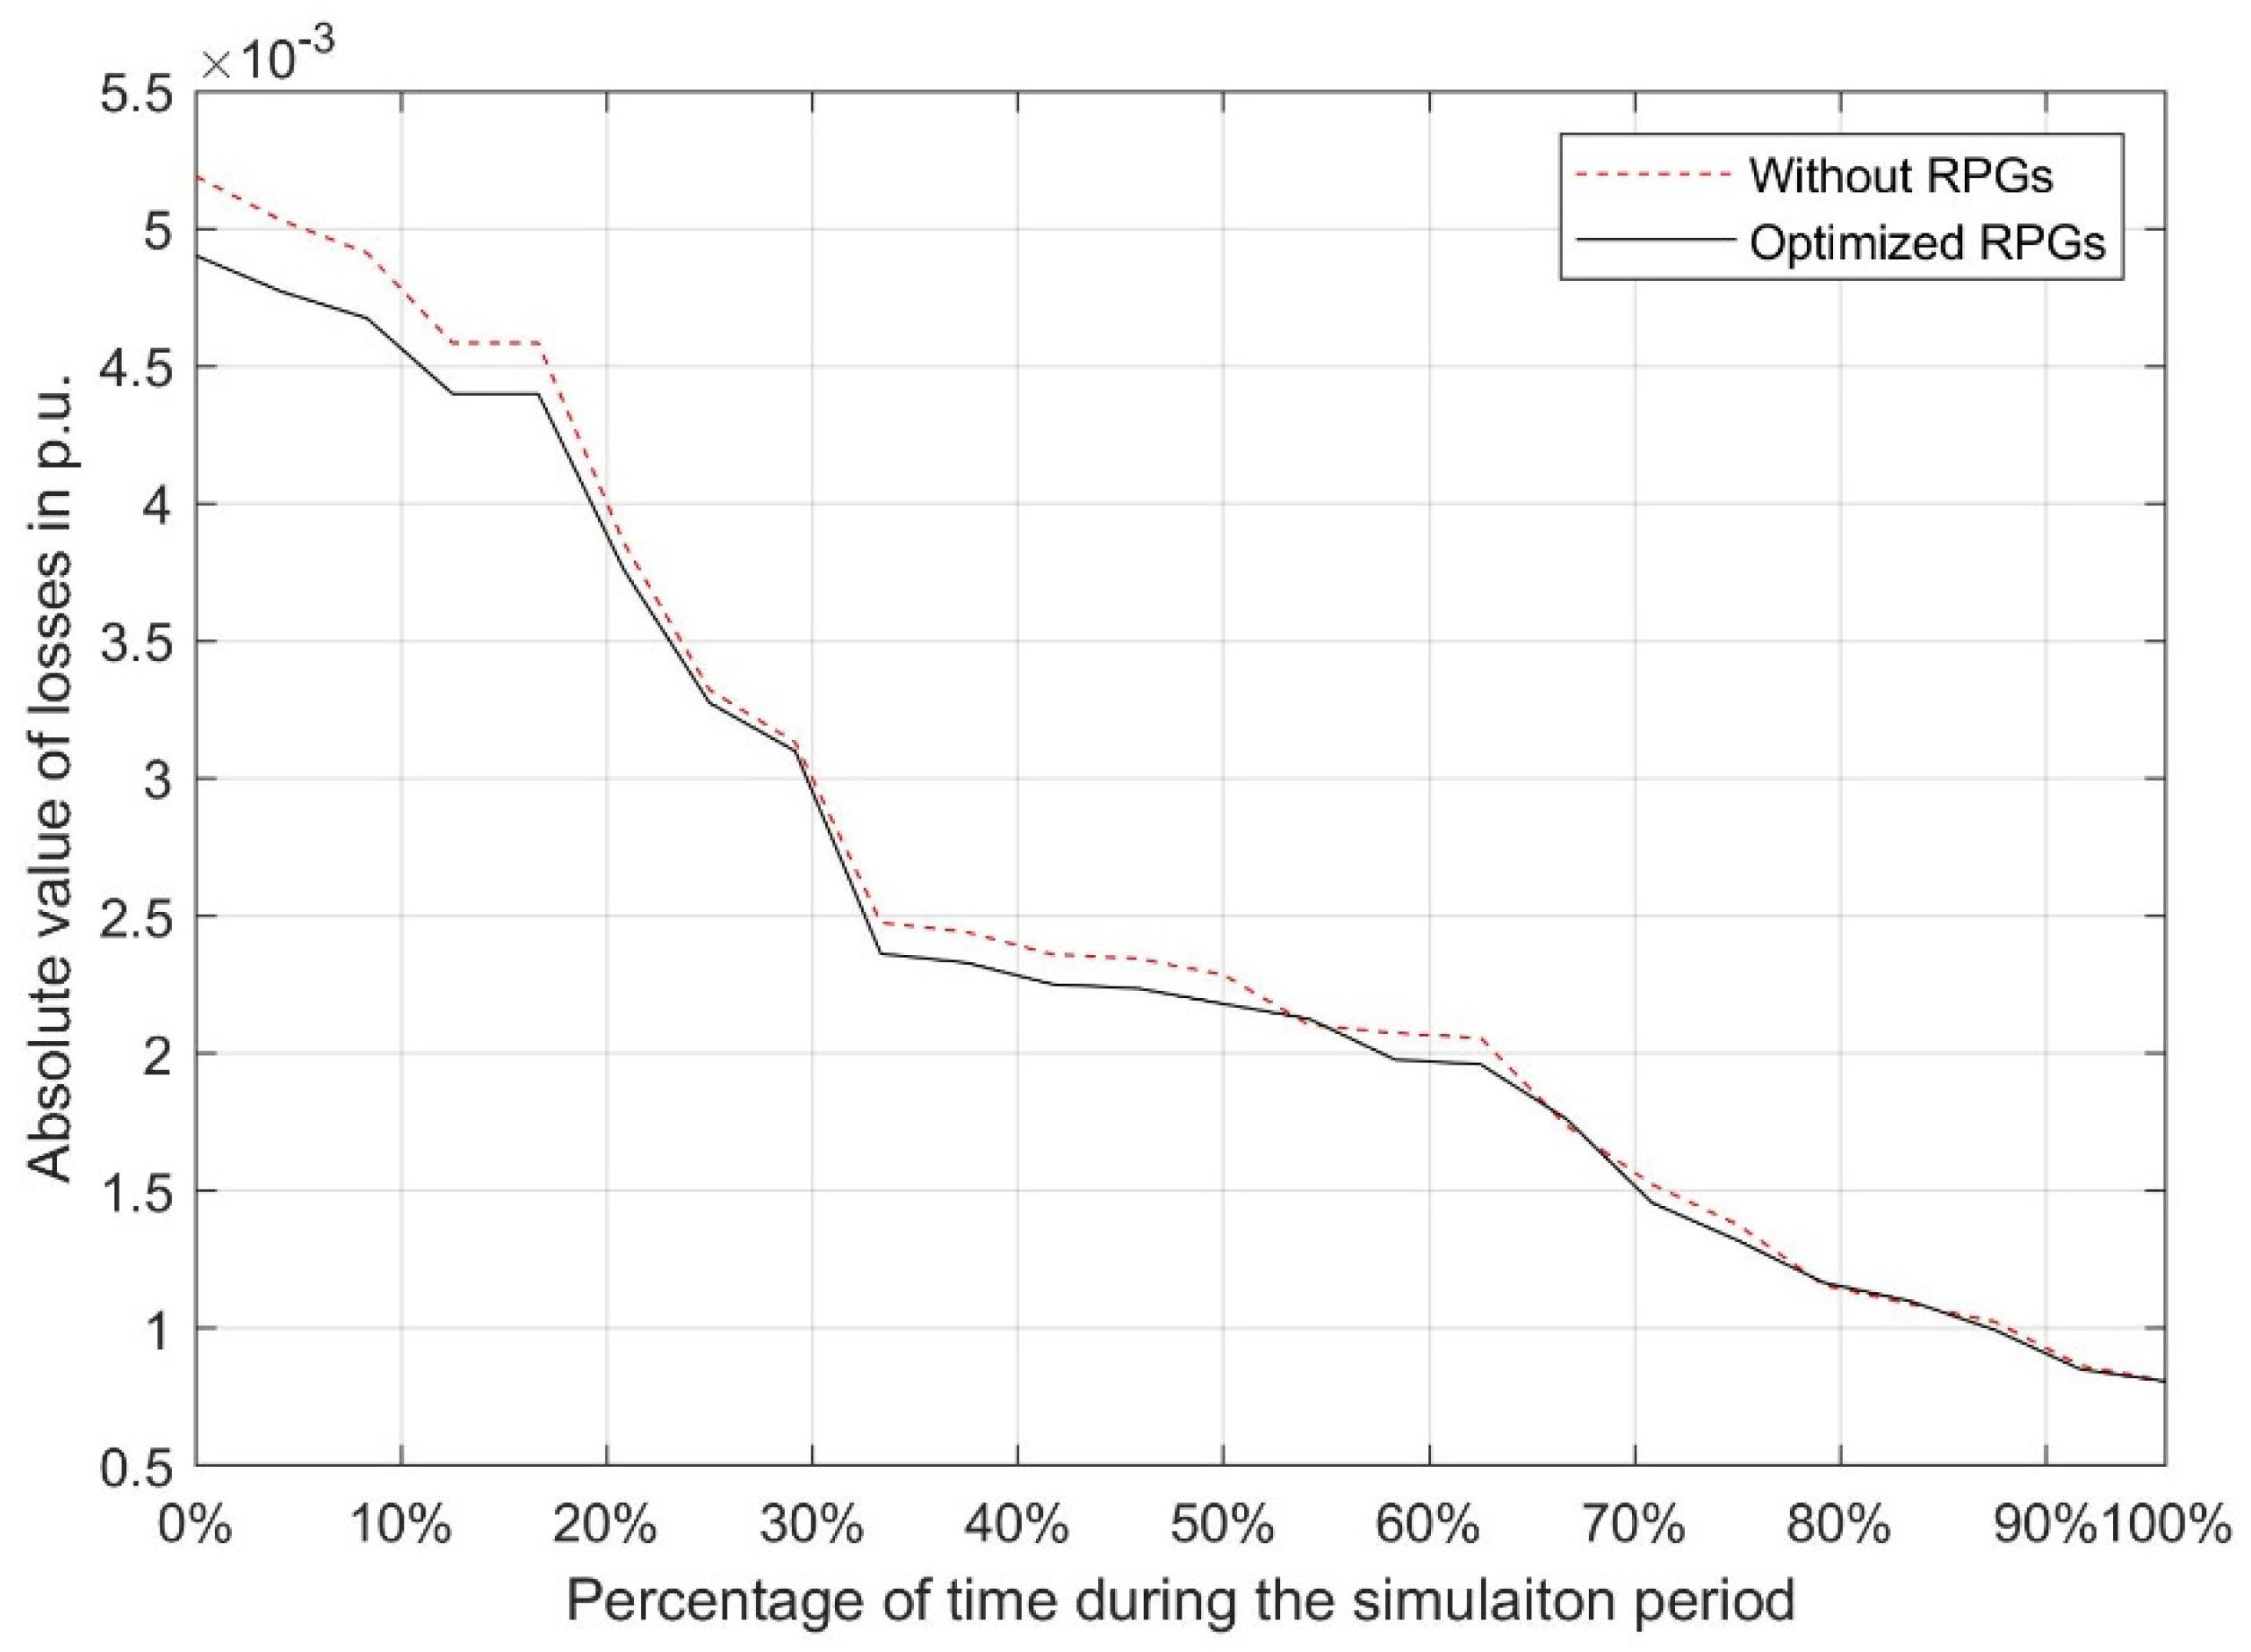
4.2.1. IEEE 30-Bus System
4.2.2. IEEE 14-Bus System
5. Conclusions
Funding
Conflicts of Interest
Nomenclature
| Abbreviations |
| DG: distributed generation |
| GA: genetic algorithm |
| HVDC: high-voltage direct current |
| OPF: optimal power flow |
| p.u.: per unit |
| PV: photovoltaic |
| RPG: reactive power generation |
| SVC: static Var compensator |
| WTG: wind turbine generator |
| Variables |
| A: { ai | ai is a bus, excluding a slack bus } |
| B: the number of branches |
| CLoss: cost function for branch losses |
| CRPG: cost function for reactive power generation installation |
| CV: cost function for voltage variation |
| CLoss,max, CRPG,max, and CV,max: worst case costs for losses, reactive power generator installation, and voltage variation |
| : generation cost of unit i in $/kW |
| : angle of the voltage at iteration k (: ∠ ) |
| δs: angle of the scheduled complex power (Sload: P+jQ:|S|∠δs) |
| H: total simulation period |
| : currents that flow in each node at iteration k |
| : currents that flow in a line at iteration k |
| : currents that flow to constant power loads in each node at iteration k |
| : currents that flow to constant current loads in each node at iteration k |
| : currents that flow to constant impedance loads in each node at iteration k |
| Im and In: currents that flow in buses m and n |
| Iex: excitation current of a tap-changing transformer |
| : currents that flow through parallel elements |
| N: the number of buses |
| M: the number of offspring members |
| NRPG,i: nameplate capacity of reactive power generator i |
| O: offspring member in a generation |
| : output of reactive power generator i at iteration k |
| and : minimum and maximum outputs of reactive power generator i at iteration k |
| p: probability that produces the fittest offspring |
| Pi: probability of the slot size of the scaled roulette wheel |
| R: the number of reactive power generators |
| Ri: geometric rank of offspring member i from 1 to M |
| Si: nameplate capacity of a reactive power generation unit i |
| Smin,i: minimum nameplate capacity of a reactive power generation unit i |
| Smax,i: maximum nameplate capacity of a reactive power generation unit i |
| SLoss,i,h: losses of transmission line (or branch) i at period h |
| Sload: complex power of loads connected to each node: P + jQ:|S|∠δs |
| T: the number of tap-changing transformers |
| Tapi: tap position of transformer i |
| Tapmin and Tapmax: minimum and maximum tap positions |
| Tapmin and Tapmax: minimum and maximum tap positions |
| : voltages induced in each node at iteration k |
| : voltage (magnitude) of bus i at period h and iteration k |
| Vm and Vn: voltages of buses m and n |
| Vnom: magnitude of the nominal (or rated) voltage |
| Vset: set voltage magnitude of a reactive power generation unit |
| xi: location to which a reactive power generation unit can be connected |
| WLoss, WRPG, and WV: weighting factors for losses, reactive power generator installation cost, and voltage variation, respectively |
| Ybus: bus admittance matrix |
| Yeq: series admittance of a tap-changing transformer |
| Yex: excitation admittance of a tap-changing transformer |
| yi: capacity of a reactive power generation unit |
| Ym0 and Yn0: admittances of buses m and n connected the ground |
| Yparallel: admittance matrix of parallel elements connected to the ground |
| Zbus or Zbus: bus impedance matrix |
Appendix A
| Bus | Zbus Method | Newton–Raphson | Gauss–Seidel | Decoupled |
|---|---|---|---|---|
| 1 | 1.00000∠0.000° | 1.00000∠0.000° | 1.00000∠0.000° | 1.00000∠0.000° |
| 2 | 0.98681∠−5.706° | 0.98681∠−5.706° | 0.98681∠−5.706° | 0.98681∠−5.706° |
| 3 | 0.96106∠−14.609° | 0.96106∠−14.609° | 0.96106∠−14.609° | 0.96106∠−14.609° |
| 4 | 0.95433∠−11.645° | 0.95433∠−11.645° | 0.95433∠−11.645° | 0.95433∠−11.645° |
| 5 | 0.95627∠−9.917° | 0.95627∠−9.917° | 0.95627∠−9.917° | 0.95627∠−9.917° |
| 6 | 1.00000∠−16.203° | 1.00000∠−16.203° | 1.00000∠−16.203° | 1.00000∠−16.203° |
| 7 | 0.98343∠−15.117° | 0.98343∠−15.117° | 0.98343∠−15.117° | 0.98343∠−15.117° |
| 8 | 1.00000∠−15.117° | 1.00000∠−15.117° | 1.00000∠−15.117° | 1.00000∠−15.117° |
| 9 | 0.97853∠−16.937° | 0.97853∠−16.937° | 0.97853∠−16.937° | 0.97853∠−16.937° |
| 10 | 0.97431∠−17.135° | 0.97431∠−17.135° | 0.97431∠−17.135° | 0.97431∠−17.135° |
| 11 | 0.98324∠−16.815° | 0.98324∠−16.815° | 0.98324∠−16.815° | 0.98324∠−16.815° |
| 12 | 0.98359∠−17.183° | 0.98359∠−17.183° | 0.98359∠−17.183° | 0.98359∠−17.183° |
| 13 | 0.97796∠−17.264° | 0.97796∠−17.264° | 0.97796∠−17.264° | 0.97796∠−17.264° |
| 14 | 0.95883∠−18.242° | 0.95883∠−18.242° | 0.95883∠−18.242° | 0.95883∠−18.242° |
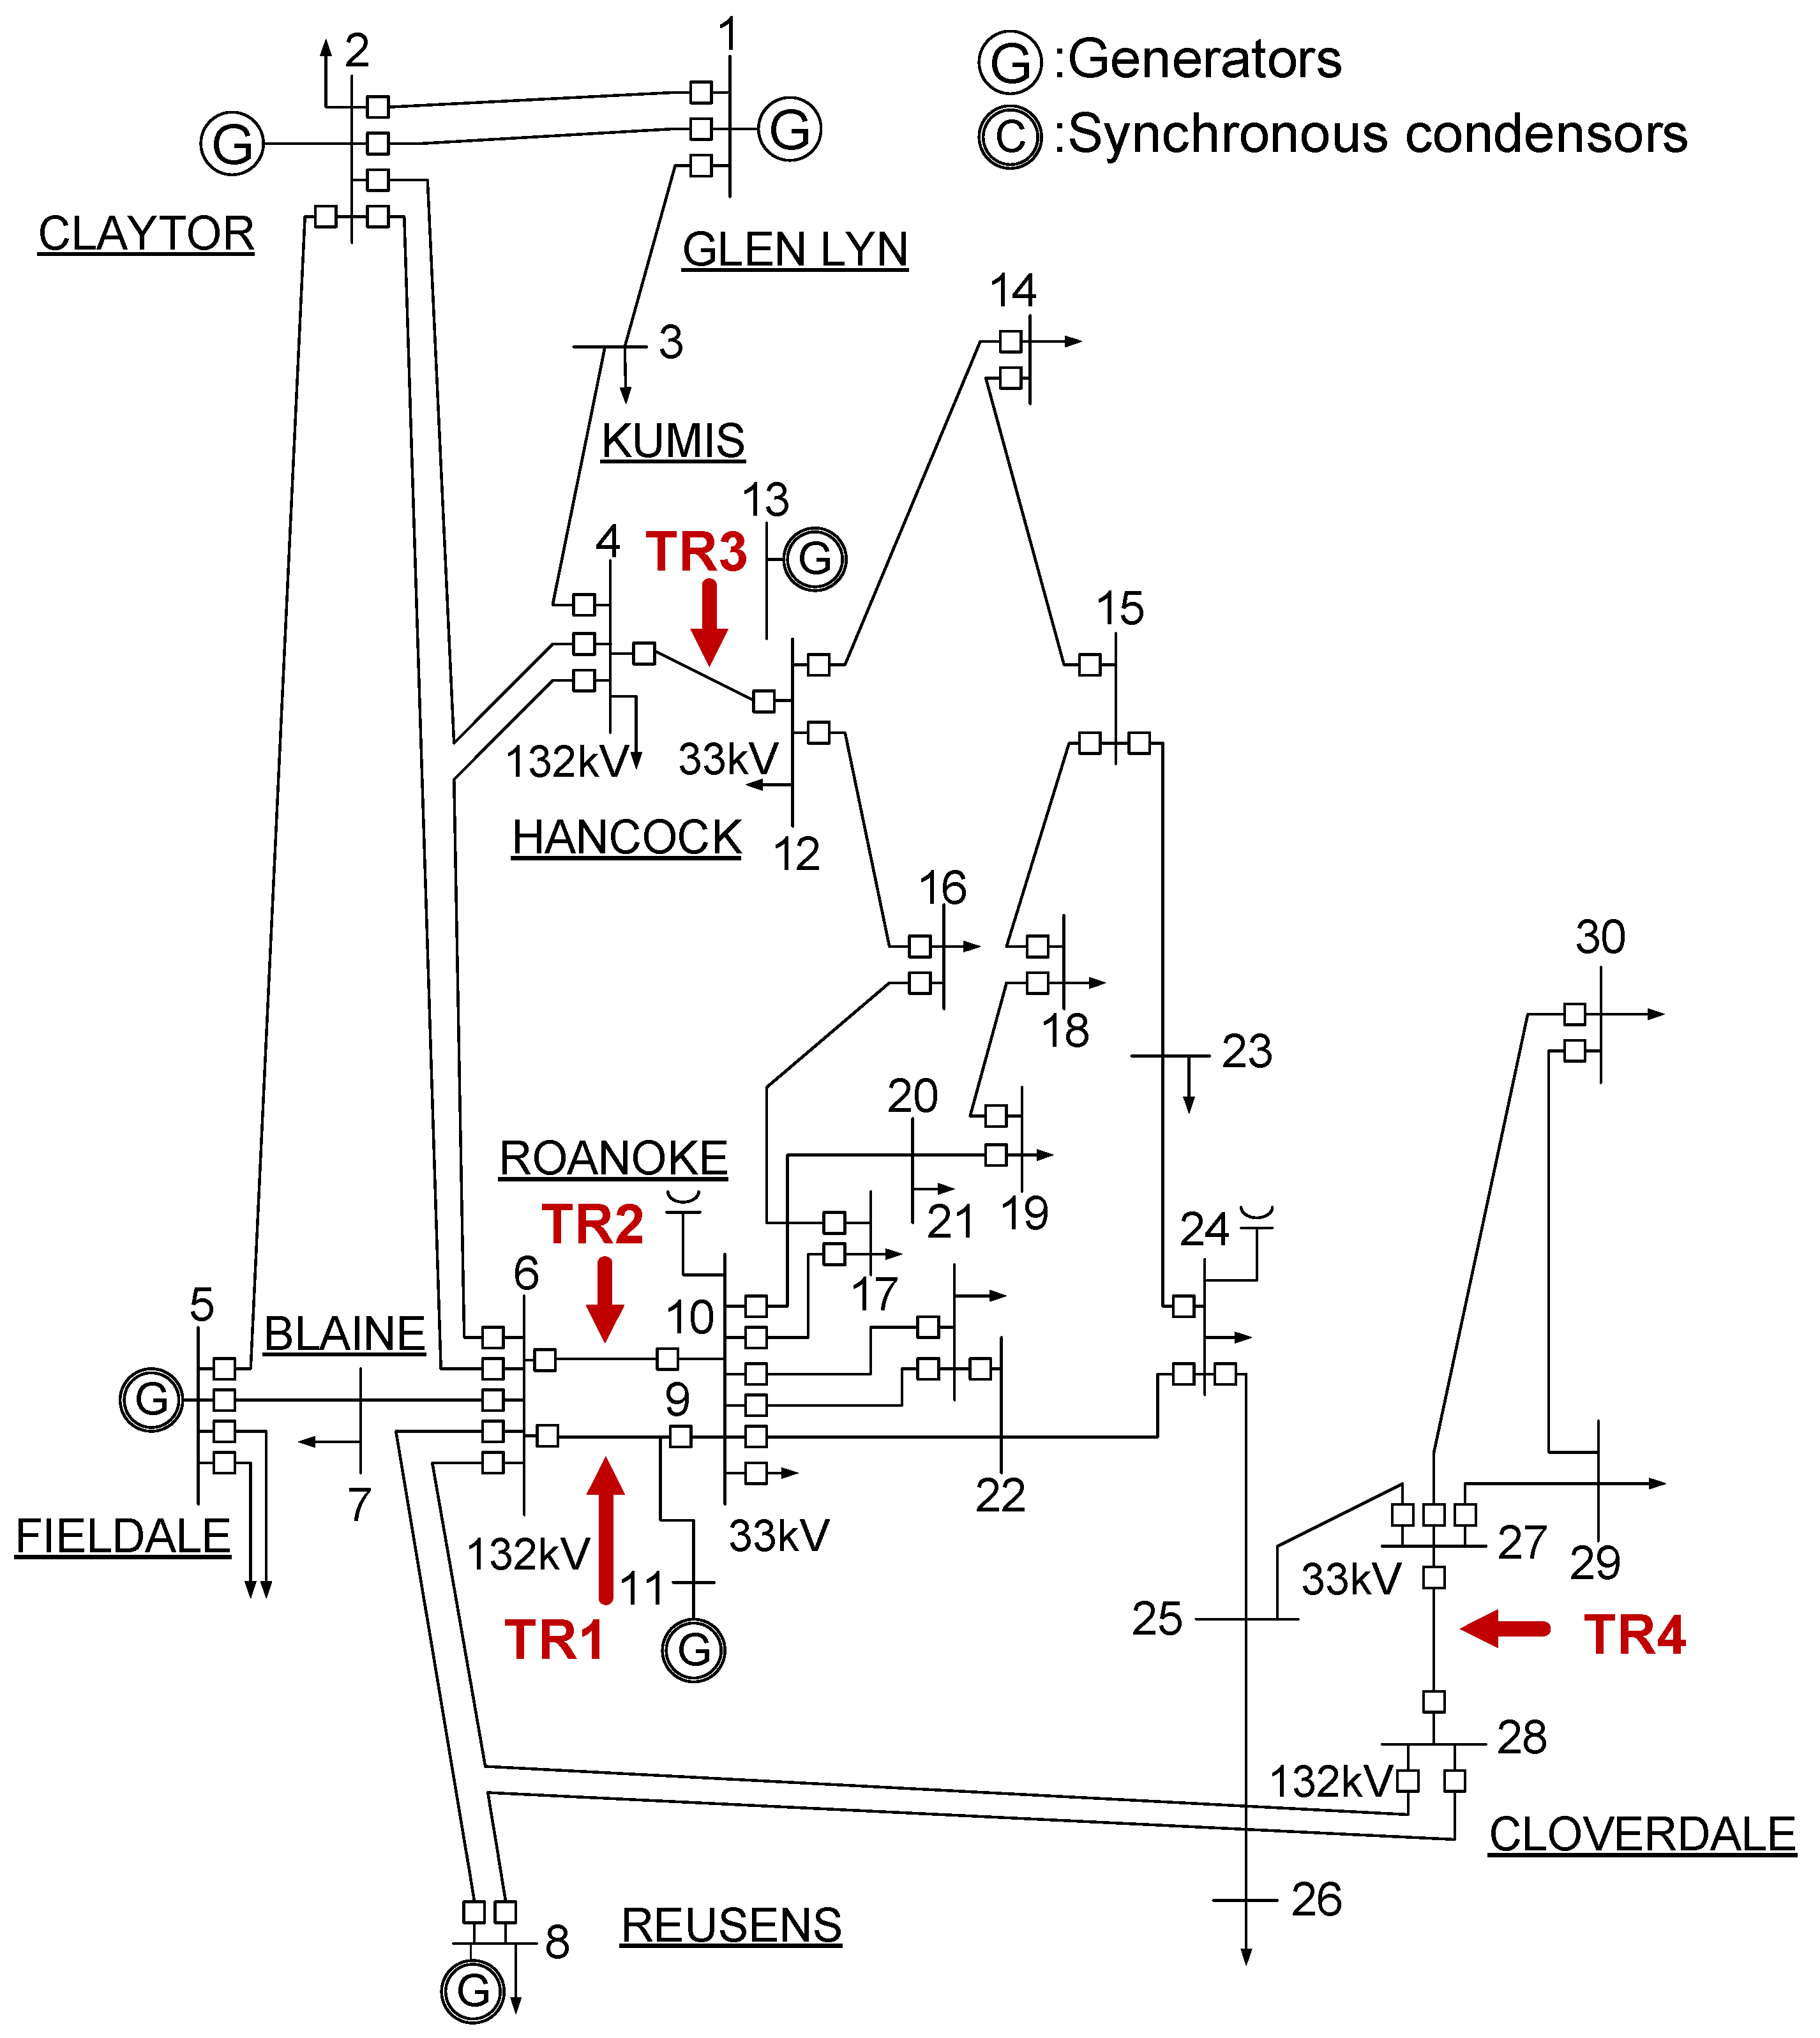
| Bus. | Bus Type/Transformer | Zbus Method | Newton–Raphson | Gauss–Seidel | Decoupled |
|---|---|---|---|---|---|
| 1 | Slack | 1.00000∠0.000° | 1.00000∠0.000° | 1.00000∠0.000° | 1.00000∠0.000° |
| 2 | P–V | 0.97782∠−6.035° | 0.97782∠−6.035° | 0.97782∠−6.035° | 0.97782∠−6.035° |
| 4 | TR3(Pri) | 0.94197∠−10.520° | 0.94197∠−10.520° | 0.94197∠−10.520° | 0.94197∠−10.520° |
| 5 | P–V | 0.94230∠−16.185° | 0.94230∠−16.185° | 0.94230∠−16.185° | 0.94230∠−16.185° |
| 6 | TR1(Pri), TR2(Pri) | 0.93936∠−12.555° | 0.93936∠−12.555° | 0.93936∠−12.555° | 0.93936∠−12.555° |
| 8 | P–V | 0.93991∠−13.436° | 0.93991∠−13.436° | 0.93991∠−13.436° | 0.93991∠−13.436° |
| 9 | TR1(Sec) | 0.97206∠−16.077° | 0.97206∠−16.077° | 0.97206∠−16.077° | 0.97206∠−16.077° |
| 10 | TR2(Sec) | 0.96487∠−17.931° | 0.96487∠−17.931° | 0.96487∠−17.931° | 0.96487∠−17.931° |
| 11 | P–V | 1.00000∠−16.077° | 1.00000∠−16.077° | 1.00000∠−16.077° | 1.00000∠−16.077° |
| 12 | TR3(Sec) | 0.98140∠−17.112° | 0.98140∠−17.112° | 0.98140∠−17.112° | 0.98140∠−17.112° |
| 13 | P–V | 1.00000∠−17.112° | 1.00000∠−17.112° | 1.00000∠−17.112° | 1.00000∠−17.112° |
| 27 | TR4(Sec) | 0.94484∠−17.806° | 0.94484∠−17.806° | 0.94484∠−17.806° | 0.94484∠−17.806° |
| 28 | TR4(Pri) | 0.93519∠−13.274° | 0.93519∠−13.274° | 0.93519∠−13.274° | 0.93519∠−13.274° |
References
- Ding, T.; Liu, S.; Yuan, W.; Bie, Z.; Zeng, B. A two-stage robust reactive power optimization considering uncertain wind power integration in active distribution networks. IEEE Trans. Sustain. Energy 2016, 7, 301–311. [Google Scholar] [CrossRef]
- Wang, Y.; Li, F.; Wan, Q.; Chen, H. Reactive power planning based on fuzzy clustering, gray code, and simulated annealing. IEEE Trans. Power Syst. 2011, 26, 2246–2255. [Google Scholar] [CrossRef]
- Singh, H.; Srivastava, L. Recurrent multi-objective differential evolution approach for reactive power management. IET Gener. Transm. Distrib. 2016, 10, 192–204. [Google Scholar] [CrossRef]
- Zhang, C.; Chen, H.; Ngan, H.; Liang, Z.; Guo, M.; Hua, D. Solution of reactive power optimisation including interval uncertainty using genetic algorithm. IET Gener. Transm. Distrib. 2017, 11, 3657–3664. [Google Scholar] [CrossRef]
- Mukherjee, A.; Mukherjee, V. Solution of optimal reactive power dispatch by chaotic krill herd algorithm. IET Gener. Transm. Distrib. 2015, 9, 2351–2362. [Google Scholar] [CrossRef]
- Shi, H.; Wen, H.; Hu, Y.; Jiang, L. Reactive power minimization in bidirectional DC–DC converters using a unified-phasor-based particle swarm optimization. IEEE Trans. Power Electron. 2018, 33, 10990–11006. [Google Scholar] [CrossRef]
- Dai, C.; Chen, W.; Zhu, Y.; Zhang, X. Seeker optimization algorithm for optimal reactive power dispatch. IEEE Trans. Power Syst. 2009, 24, 1218–1231. [Google Scholar]
- Raj, S.; Bhattacharyya, B. Optimal placement of TCSC and SVC for reactive power planning using whale optimization algorithm. Swarm Evol. Comput. 2018, 40, 131–143. [Google Scholar] [CrossRef]
- Shaheen, A.M.; El-Sehiemy, R.A.; Farrag, S.M. Integrated strategies of backtracking search optimizer for solving reactive power dispatch problem. IEEE Syst. J. 2018, 12, 424–433. [Google Scholar] [CrossRef]
- Raha, S.B.; Mandal, K.K.; Chakraborty, N. Hybrid SMES based reactive power dispatch by cuckoo search algorithm. IEEE Trans. Ind. Appl. 2019, 55, 907–917. [Google Scholar] [CrossRef]
- Amrane, Y.; Boudour, M.; Belazzoug, M. A new optimal reactive power planning based on differential search algorithm. Int. J. Electr. Power Energy Syst. 2015, 64, 551–561. [Google Scholar] [CrossRef]
- Huang, W.; Sun, K.; Qi, J.; Ning, J. Optimisation of dynamic reactive power sources using mesh adaptive direct search. IET Gener. Transm. Distrib. 2017, 11, 3675–3682. [Google Scholar] [CrossRef]
- Sheng, W.; Liu, K.; Liu, Y.; Ye, X.; He, K. Reactive power coordinated optimisation method with renewable distributed generation based on improved harmony search. IET Gener. Transm. Distrib. 2016, 10, 3152–3162. [Google Scholar] [CrossRef]
- López, J.C.; Vergara, P.P.; Lyra, C.; Rider, M.J.; Silva, L.C.P.D. Optimal operation of radial distribution systems using extended dynamic programming. IEEE Trans. Power Syst. 2018, 33, 1352–1363. [Google Scholar] [CrossRef]
- Zhou, E.; Hu, J. Gradient-based adaptive stochastic search for non-differentiable optimization. IEEE Trans. Autom. Control 2014, 59, 1818–1832. [Google Scholar] [CrossRef]
- Nie, Y.; Du, Z.; Li, J. AC–DC optimal reactive power flow model via predictor–corrector primal-dual interior-point method. IET Gener. Transm. Distrib. 2013, 7, 382–390. [Google Scholar] [CrossRef]
- Zhang, C.; Chen, H.; Liang, Z.; Guo, M.; Hua, D.; Ngan, H. Reactive power optimization under interval uncertainty by the linear approximation method and its modified method. IEEE Trans. Smart Grid 2018, 9, 4587–4600. [Google Scholar] [CrossRef]
- Lin, C.; Wei, H.; Hou, W.; Tan, J. Linear inequalities convex transformation for optimal reactive power flow model based on MISOCP relaxations. IET Gener. Transm. Distrib. 2018, 12, 1589–1594. [Google Scholar] [CrossRef]
- Deng, Z.; Liu, M.; Ouyang, Y.; Lin, S.; Xie, M. Multi-objective mixed-integer dynamic optimization method applied to optimal allocation of dynamic Var sources of power systems. IEEE Trans. Power Syst. 2018, 33, 1683–1697. [Google Scholar] [CrossRef]
- Franco, J.F.; Ochoa, L.F.; Romero, R. AC OPF for smart distribution networks: An efficient and robust quadratic approach. IEEE Trans. Smart Grid 2018, 9, 4613–4623. [Google Scholar] [CrossRef]
- Bhattacharyya, B.; Babu, R. Teaching learning based optimization algorithm for reactive power planning. Int. J. Electr. Power Energy Syst. 2016, 81, 248–253. [Google Scholar] [CrossRef]
- Vita, V. Development of a decision-making algorithm for the optimum size and placement of distributed generation units in distribution networks. Energies 2017, 10, 1433. [Google Scholar] [CrossRef]
- Nguyen, Q.; Padullaparti, H.V.; Lao, K.; Santoso, S.; Ke, X.; Samaan, N. Exact optimal power dispatch in unbalanced distribution systems with high PV penetration. IEEE Trans. Power Syst. 2019, 34, 718–728. [Google Scholar] [CrossRef]
- Galvani, S.; Hagh, M.T.; Sharifian, M.B.B.; Mohammadi-Ivatloo, B. Multiobjective predictability-based optimal placement and parameters setting of UPFC in wind power included power systems. IEEE Trans. Ind. Inform. 2019, 15, 878–888. [Google Scholar] [CrossRef]
- Zeng, X.; Tao, J.; Zhang, P.; Pan, H.; Wang, Y. Reactive power optimization of wind farm based on improved genetic algorithm. Energy Procedia 2012, 14, 1362–1367. [Google Scholar] [CrossRef]
- Agundis-Tinajero, G.; Aldana, N.L.D.; Luna, A.C.; Segundo-Ramírez, J.; Visairo-Cruz, N.; Guerrero, J.M.; Vazquez, J.C. Extended-optimal-power-flow-based hierarchical control for islanded AC microgrids. IEEE Trans. Power Electron. 2019, 34, 840–848. [Google Scholar] [CrossRef]
- Begovic, M.M.; Kim, I. Distributed renewable PV generation in urban distribution networks. In Proceedings of the 2011 IEEE Power Systems Conference and Exposition, Phoenix, AZ, USA, 20–23 March 2011. [Google Scholar]
- Kim, I.; Begovic, M.; Jeong, H.; Crittenden, J. Impact of photovoltaic distributed generation on generation resource allocation. In Proceedings of the 2013 46th Hawaii International Conference on System Sciences, Wailea, Maui, HI, USA, 7–10 January 2013; pp. 2230–2236. [Google Scholar]
- Kim, I.; Begovic, M. On impact of randomly distributed PV systems on distribution networks. In Proceedings of the 2016 49th Hawaii International Conference on System Sciences, Koloa, HI, USA, 5–8 January 2016; pp. 2418–2425. [Google Scholar]
- Kim, I.; Harley, R.G.; Regassa, R. Optimal distributed generation allocation on distribution networks at peak load and the analysis of the impact of volt/var control on the improvement of the voltage profile. In Proceedings of the 2014 North American Power Symposium, Pullman, WA, USA, 7–9 September 2014. [Google Scholar]
- Thallam, R.S.; Suryanarayanan, S.; Heydt, G.T.; Ayyanar, R. Impact of interconnection of distributed generation of electric distribution systems—A dynamic simulation perspective. In Proceedings of the IEEE Power Engineering Society General Meeting, Montreal, QC, Canada, 18–22 June 2006. [Google Scholar]
- Vita, V.; Alimardan, T.; Ekonomou, L. The impact of distributed generation in the distribution networks’ voltage profile and energy losses. In Proceedings of the 2015 IEEE European Modelling Symposium, Madrid, Spain, 6–8 October 2015; pp. 260–265. [Google Scholar]
- Kim, I.; Harley, R.G.; Regassa, R.; Valle, Y.D. The effect of the Volt/VAr control of photovoltaic systems on the time-series steady-state analysis of a distribution network. In Proceedings of the 2015 Clemson University Power Systems Conference (PSC), Clemson, SC, USA, 10–13 March 2015. [Google Scholar]
- Goldberg, D.E. Genetic Algorithms in Search, Optimization, and Machine Learning; Addison-Wesley: Boston, MA, USA, 1989. [Google Scholar]
- Kim, I. Optimal distributed generation allocation for reactive power control. IET Gener. Transm. Distrib. 2017, 11, 1549–1556. [Google Scholar] [CrossRef]
- Amini, M.H.; Jaddivada, R.; Hoseinzadeh, B.; Mishra, S.; Mozafar, M.R. Optimal SVC allocation in power systems for loss minimization and voltage deviation reduction. In Sustainable Interdependent Networks: From Theory to Application; Springer International Publishing: Cham, Switzerland, 2018; pp. 221–232. [Google Scholar]
- Kılıç, U.; Ayan, K.; Arifoğlu, U. Optimizing reactive power flow of HVDC systems using genetic algorithm. Int. J. Electr. Power Energy Syst. 2014, 55, 1–12. [Google Scholar] [CrossRef]
- Abdelkader, A.; Rabeh, A.; Ali, D.M.; Mohamed, J. Multi-objective genetic algorithm based sizing optimization of a stand-alone wind/PV power supply system with enhanced battery/supercapacitor hybrid energy storage. Energy 2018, 163, 351–363. [Google Scholar] [CrossRef]
- Kim, I.; Harley, R.G. Examination of the effect of the reactive power control of photovoltaic systems on electric power grids and the development of a voltage-regulation method that considers feeder impedance sensitivity. Electr. Power Syst. Res. 2020, 180, 106130. [Google Scholar] [CrossRef]
- Brown, H.E.; Carter, G.K.; Happ, H.H.; Person, C.E. Power flow solution by impedance matrix iterative method. IEEE Trans. Power Appar. Syst. 1963, 82, 1–10. [Google Scholar] [CrossRef]
- Dugan, R.C.; Arritt, R.F.; Smith, J.; Rylander, M. OpenDSS Training Workshop; University of North Carolina at Charlotte: Charlotte, NC, USA, 2013. [Google Scholar]
- Houck, C.R.; Joines, J.A.; Kay, M.G. A genetic algorithm for function optimization: A MATLAB implementation. Tech. Rep. 1995, 95, 1–10. [Google Scholar]
- Dabbagchi, I. IEEE 14-Bus System. 1993. Available online: http://labs.ece.uw.edu/pstca/pf14/pg_tca14bus.htm (accessed on 8 February 2019).
- Working Group on a Common Format for Exchange of Solved Load Flow Data, Common format for exchange of solved load flow data. IEEE Trans. Power Appar. Syst. 1973, 92, 1916–1925.
- Dabbagchi, I. IEEE 30-Bus System. 1993. Available online: http://www.ee.washington.edu/research/pstca/pf30/pg_tca30bus.htm (accessed on 8 February 2019).
- Dabbagchi, I. IEEE 57-Bus System. 1993. Available online: http://labs.ece.uw.edu/pstca/pf57/pg_tca57bus.htm (accessed on 8 February 2019).
- Kim, I. Impact of stochastic renewable distributed generation on urban distribution networks. In Doctor of Philosophy, Electrical and Computer Engineering; Georgia Institute of Technology: Atlanta, GA, USA, 2014. [Google Scholar]
- Pregelj, A. Impact of distributed generation on power network operation. In Doctoral Dissertation; Georgia Institute of Technology: Atlanta, GA, USA, 2003. [Google Scholar]
- De Jong, K.A. An Analysis of the Behavior of a Class of Genetic Adaptive Systems. Ph.D. Thesis, University of Michigan, Ann Arbor, MI, USA, 1975. [Google Scholar]




| Operation | Method | Parameter |
|---|---|---|
| Reproduction [34,47,49] | Probability that produces the fittest offspring (scaled roulette wheel) | p = 0.001 |
| Crossover [34,47,49] | Arithmetic crossover per offspring | Pc = 1.0 |
| Mutation [34,47,49] | Uniform mutation | Pm = 0.1 |
| Experimental data [47] | The number of populations | 5000 |
| The number of generations | 100 |
© 2020 by the author. Licensee MDPI, Basel, Switzerland. This article is an open access article distributed under the terms and conditions of the Creative Commons Attribution (CC BY) license (http://creativecommons.org/licenses/by/4.0/).
Share and Cite
Kim, I. The Optimization of the Location and Capacity of Reactive Power Generation Units, Using a Hybrid Genetic Algorithm Incorporated by the Bus Impedance Power-Flow Calculation Method. Appl. Sci. 2020, 10, 1034. https://doi.org/10.3390/app10031034
Kim I. The Optimization of the Location and Capacity of Reactive Power Generation Units, Using a Hybrid Genetic Algorithm Incorporated by the Bus Impedance Power-Flow Calculation Method. Applied Sciences. 2020; 10(3):1034. https://doi.org/10.3390/app10031034
Chicago/Turabian StyleKim, Insu. 2020. "The Optimization of the Location and Capacity of Reactive Power Generation Units, Using a Hybrid Genetic Algorithm Incorporated by the Bus Impedance Power-Flow Calculation Method" Applied Sciences 10, no. 3: 1034. https://doi.org/10.3390/app10031034
APA StyleKim, I. (2020). The Optimization of the Location and Capacity of Reactive Power Generation Units, Using a Hybrid Genetic Algorithm Incorporated by the Bus Impedance Power-Flow Calculation Method. Applied Sciences, 10(3), 1034. https://doi.org/10.3390/app10031034


