Article

The Influences of Acoustic and Pulsed Corona Discharge Coupling Field on Agglomeration of Monodisperse Fine Particles

State Key Laboratory of Clean Energy Utilization, Zhejiang University, Hangzhou 310027, China
*
Author to whom correspondence should be addressed.
Appl. Sci. 2020, 10(3), 1045; https://doi.org/10.3390/app10031045
Submission received: 7 January 2020 / Revised: 25 January 2020 / Accepted: 31 January 2020 / Published: 4 February 2020
(This article belongs to the Section Environmental Sciences)

Abstract

:
In view of the low efficiency of traditional electrostatic precipitators in removing fine particles, acoustic and pulsed corona discharge coupling fields were proposed to increase particle size. In this paper, monodisperse particles with three different sizes (0.5 μm, 2 μm, and 4 μm) were generated to investigate the agglomeration effect under different parameters in external fields. A larger reduction ratio of particle number concentration resulted in a higher agglomeration efficiency. Results indicated that, in the range from 800 to 2400 Hz, the acoustic agglomeration effect on 4-μm particles was better than that on 0.5-μm and 2-μm particles. In the pulsed corona discharge field, agglomeration efficiencies of the three particle sizes were lower than those in the acoustic field. However, application of the coupling field highly improved agglomeration efficiency compared with the single field. When a pulse input voltage of 50 kV with acoustic sound pressure level (SPL) of 143 dB and frequency of 1600 Hz was selected, the corresponding number reduction ratio of 0.5-μm, 2-μm, and 4-μm particles increased to 0.464, 0.526, and 0.918 from 0.254, 0.438, and 0.814 in the acoustic wave field and 0.226, 0.385, and 0.794 in the pulsed corona discharge field.

1. Introduction

With the rapid development of economy and society in China, the enormous amount of energy consumption caused severe air pollution problems [1,2,3,4,5]. The flue gas emitted by coal-fired power plants contains a variety of fine particles, which are major air pollutants in some big cities. Fine particulate matter with a particle size less than 2.5 μm is denoted as PM2.5. Large quantities of toxic substances can be easily transported because of their small sizes and large specific surface areas. These can, therefore, enter the lungs and endanger human health [6,7,8,9]. Traditional dust removers, such as cyclone dust collectors and electrostatic precipitators (ESPs), although with high efficiency in decreasing the mass concentration of particles, exhibit low efficiency in removing PM1 (85% or less) [10,11,12]. Wet electrostatic dust removal devices cover a large area, and they increase equipment operating cost. Therefore, it is particularly important to study the pre-treatment technology of fine particles [13]. There are several pre-treatment technologies for fine particles including acoustic agglomeration [14,15], electrical agglomeration [16], chemical agglomeration [17], and nucleation condensation growth [18].
In the acoustic agglomeration field, high-intensity acoustic waves act on aerosols, causing fine particles to collide and agglomerate through different vibrations and interactions. As particles become larger, their subsequent elimination with dust removal equipment is improved. The effect of acoustic agglomeration is related to acoustic frequency, sound pressure level (SPL), particle size distribution, action time, and other factors [17,19,20]. The vibration of sound waves induces the vibration of the medium, which in turn causes the vibration of particles through the viscous force. Sound waves with different frequencies have different carrying capacities for various sizes of particles; such capacity is related to what is called the entrainment coefficient (μp). The vibration of particles in the medium lags behind that of the medium itself because of inertia. This means that a larger particle leads to a greater inertia and a more considerable hysteresis. The change in particle size, therefore, has a significant impact on the vibration of particles in the acoustic field. Wang et al. [21] compared the effects of high-frequency 20-kHz sound waves and low-frequency 1400-Hz sound waves on coal-fired particles. They found that the low-frequency 1400-Hz sound wave was more suitable for coal-fired particles, whereas the high-frequency 20-kHz acoustic wave was more effective for nanometer-sized particles than micron-sized particles. Electrical agglomeration is a pre-treatment technology whereby the chargeability of particles is increased, and the agglomeration effect among particles is enhanced. In this experimental study, a high-voltage narrow pulsed corona discharge is used as an external field. During the corona discharge with a pulse width of several hundred nanoseconds, the electrons have a considerably larger charge capacity than ions. The charge process is mainly reflected in the collision of high-energy free electrons and particles that can significantly improve the charge of particles. The time outside the pulsed corona discharge period is considerably longer than the discharge period. After the discharge period, the impact charge of positive ions on particles through diffusion motion transpires. During the entire agglomeration process, therefore, particles with different electrical charges collide and agglomerate. In previous research, Xu et al. [22] found that the pulsed combined direct current field device has a fine particle removal efficiency that is as high as 90%.
For different particle sources, the use of appropriate acoustic and pulse parameters to maximize the agglomeration effect in the coupling field is an important research topic. In previous studies, different particle sources were used. However, there is no consistent conclusion on what parameters are optimal for single and coupling fields. The studies on the effect of a single particle size on particle agglomeration are also limited.
In this study, experimental studies on monodisperse aerosol particle agglomeration in single and coupling fields are conducted. The optimum agglomeration parameters of monodisperse particles and the selection of particle size are investigated. The effects of particle size distribution and other parameters on agglomeration are analyzed. The results of this study, thus, provide an experimental basis for the agglomeration of polydisperse aerosol particles in industrial application.

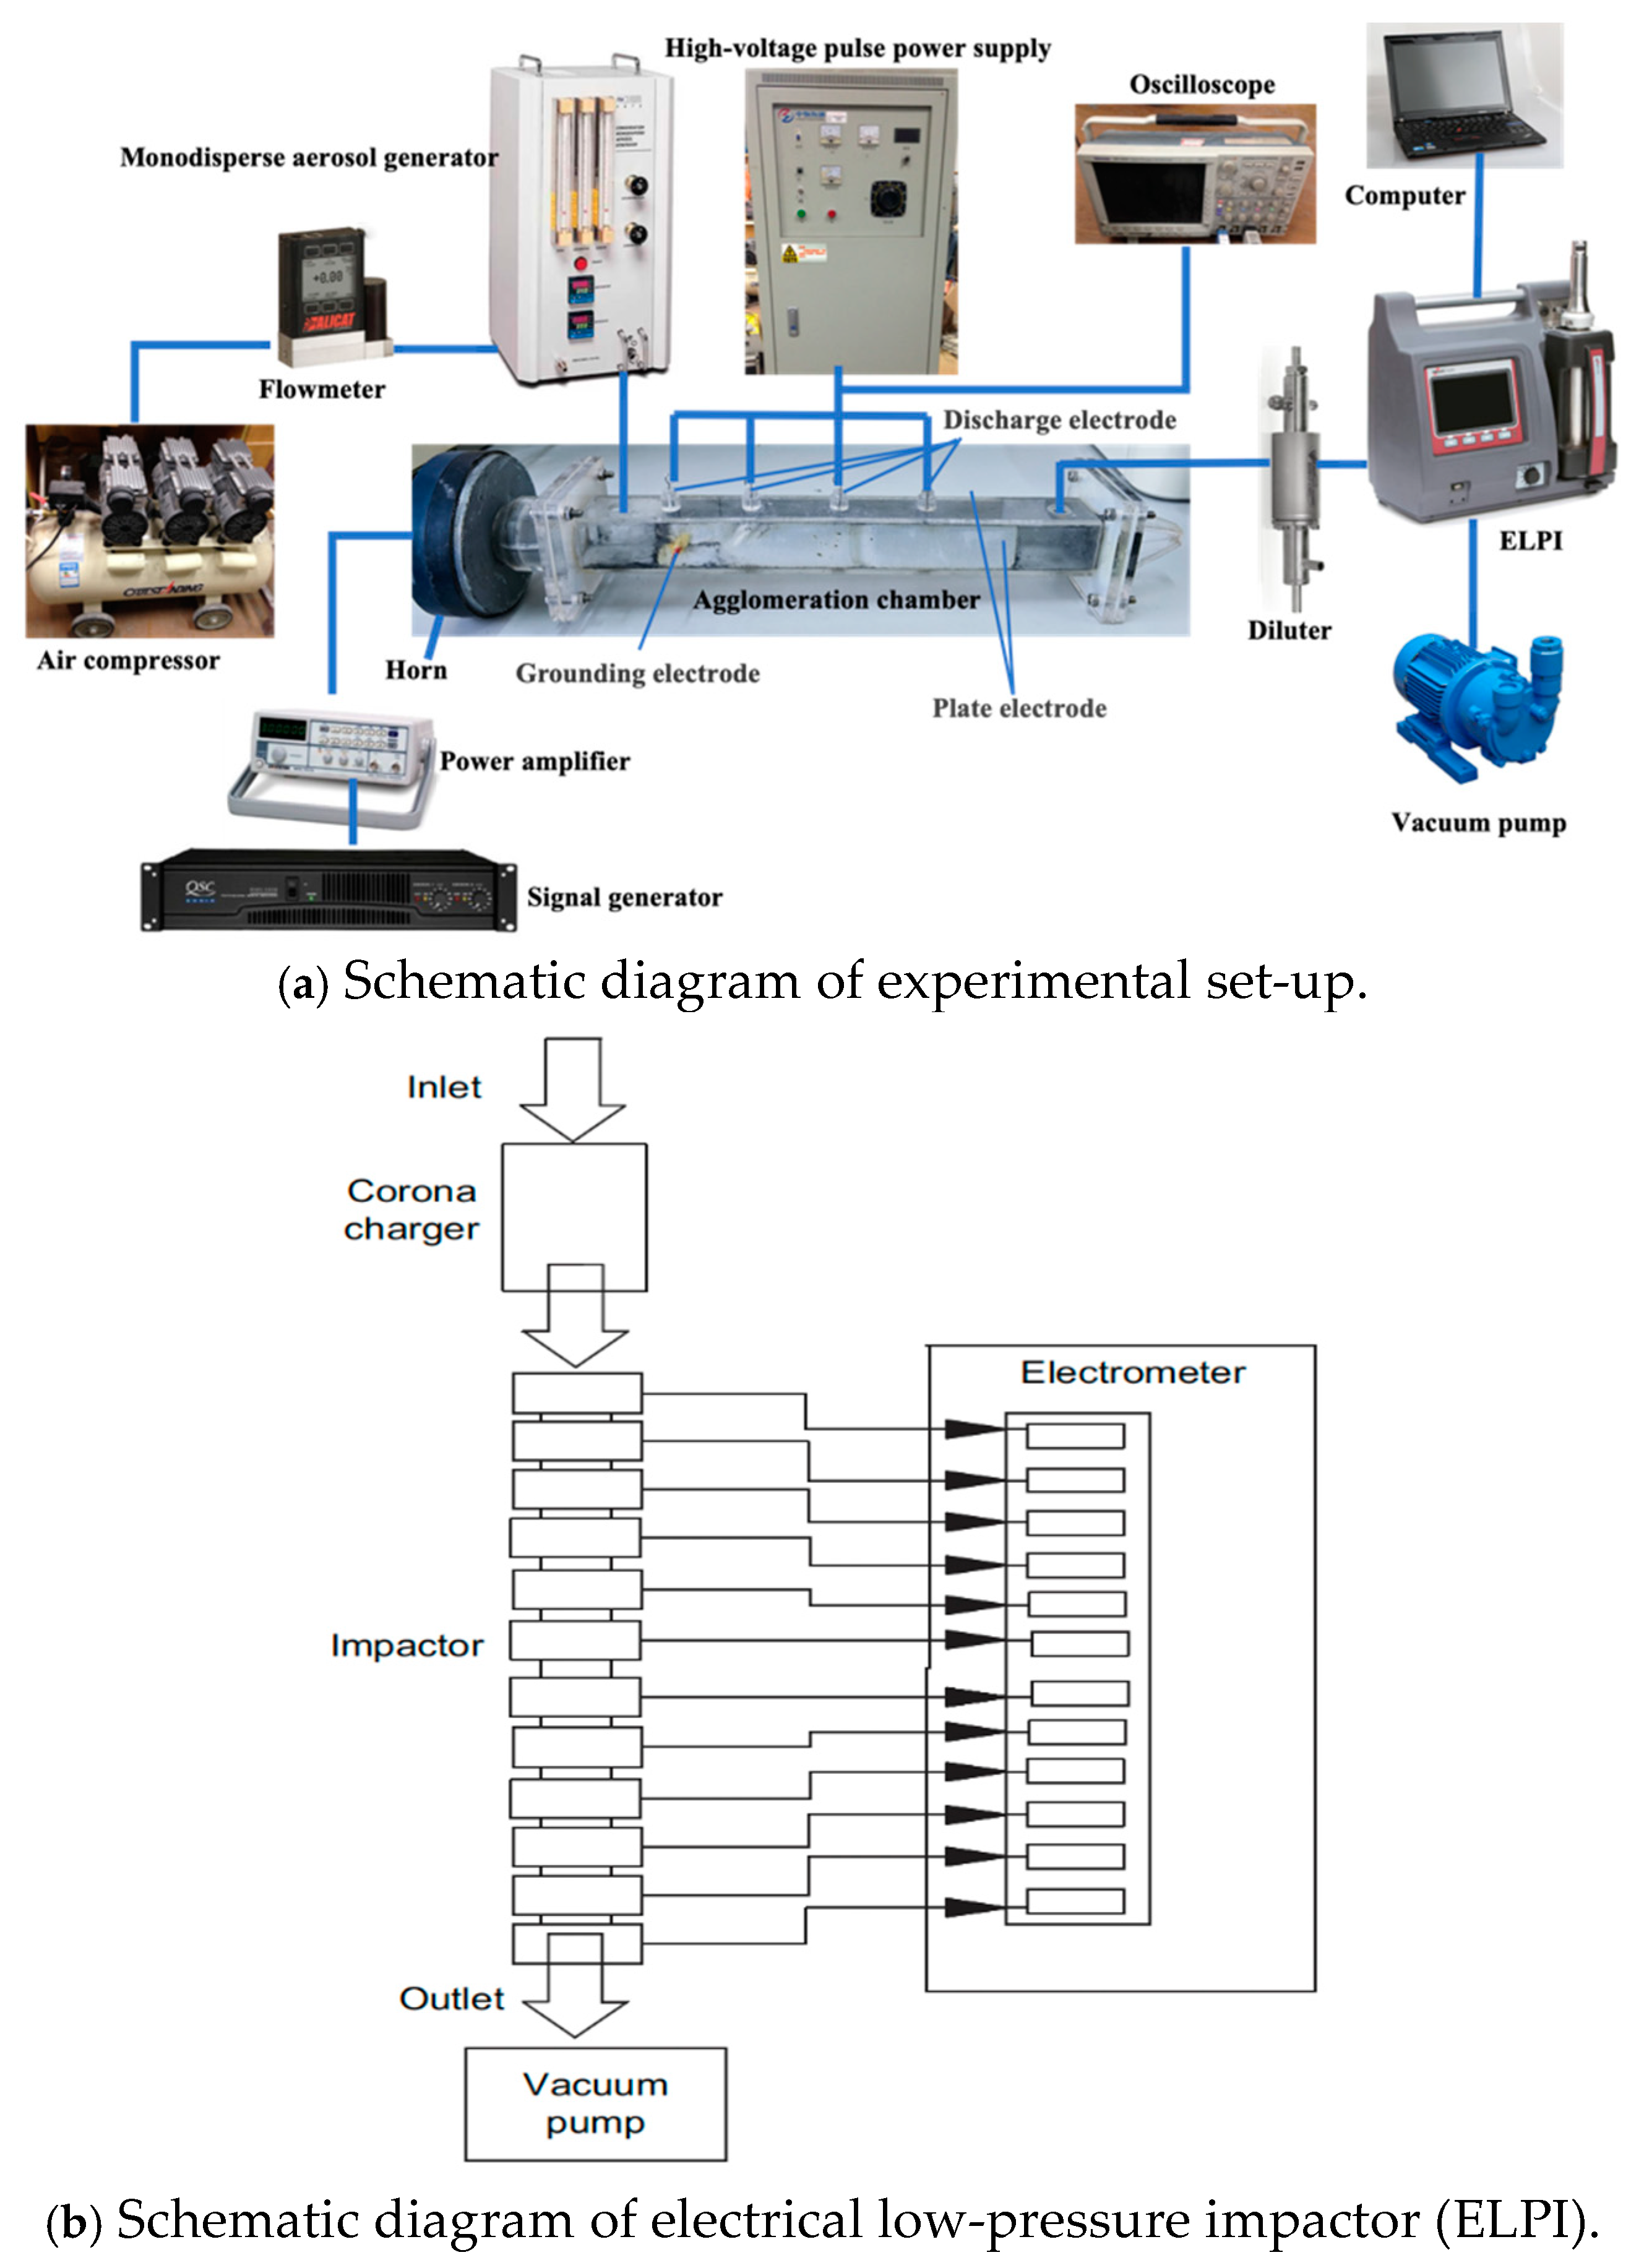
2. Materials and Methods

The schematic diagram of the experimental devices is shown in Figure 1. In this experiment, the feeding system comprised a PALAS monodisperse aerosol generator which generates monodisperse particles called diisooctyl sebacates (DEHs). The particle size of monodisperse particles can be changed by adjusting the temperature of the PALAS generator according to the Sinclair–LaMer principle. The relationship between particle size and temperature is as shown in Table 1. Here, 0.5-μm (PM1), 2-μm (PM2.5) and 4-μm (PM5) DEH particles were selected as the particle sources. The agglomeration system consisted of an agglomeration chamber, acoustic wave system, and pulsed discharge system. The 6 cm × 6 cm × 30 cm agglomeration chamber was made up of polymethyl methacrylate, inside which four stainless-steel wire electrodes were placed every 7 cm. In addition, two stainless-steel plate electrodes were contained. To drive the YF-513 compression driver in the acoustic wave system, an SFG-1013 signal generator and QSC RMX2450 power amplifier were used. The frequency band in this system was between 800 Hz and 2400 Hz, and SPLs were selected from 133–143 dB to prevent aggregates from breaking up. These acoustic parameters were proven to have high efficiency in the former studies [16,22]. The pulsed discharge system comprised a high-voltage pulse power supply, Tektronix TCP0150 current probe, Tektronix DPO4034 digital oscilloscope, and P150-GL HV probe. Sampling measurement was performed using an electrical low-pressure impactor (ELPI) with an air intake of approximately 10 L∙min−1. The air velocity in the agglomeration chamber was approximately 7.5 cm∙s−1, and the stay time was approximately 4 s. At the outlet of agglomeration chamber, DEH particles were isokinetically sampled and measured by ELPI. The schematic diagram of ELPI is shown in Figure 1. The particles sampled flowed through a precharging system, where particles were saturated with positive charges. Subsequently, the charged particles entered a low-pressure cascade impactor, which was divided into 13 stages. There were holes in the impact layer of each stage, and the hole size decreased successively from top to bottom. When particles passed through these impact holes, the gas flow line changed, and the larger particles continued to fall before hitting the collecting layer due to inertia, while the smaller particles followed the airflow to the lower impact layer. Each stage had a conducting needle connected to an electrometer. The number and mass concentration of particles on the impactor were calculated by measuring the real-time change of particle charge on each layer. The experiment was carried out at 20 °C. The initial particle size distribution (PSD) and particle number concentration (PNC) measured by the ELPI under the three conditions are shown in Figure 2.
In Figure 2, Dp is the particle size, and N is the PNC with different sizes. It can be observed that the particle size distribution basically satisfies the monodisperse condition. The evaporation capacity of DEHs varies with temperature change, and the particle number concentrations under the three temperature conditions differ. According to the research results of Wang et al. [21], the concentration does not affect the selection of particles for optimal parameters. The particles generated under these three conditions can, therefore, be used for experiments on monodisperse aerosol agglomeration in single and coupling fields.
In the experiment, the monodisperse aerosol generator is firstly turned on. The ELPI is thereafter turned on for particle size measurement. By changing the acoustic wave frequencies, SPLs, and pulse input voltages, the monodisperse aerosol particle size distribution after agglomeration under different conditions can be measured.

3. Theoretical Analysis

In the acoustic wave and pulsed corona discharge coupling fields, the monodisperse particles are affected by various forces, such as Coulomb force and viscous resistance among particles, as well as air, gravity, and inertia forces. The effects of these forces, however, are relatively complex when considered together.

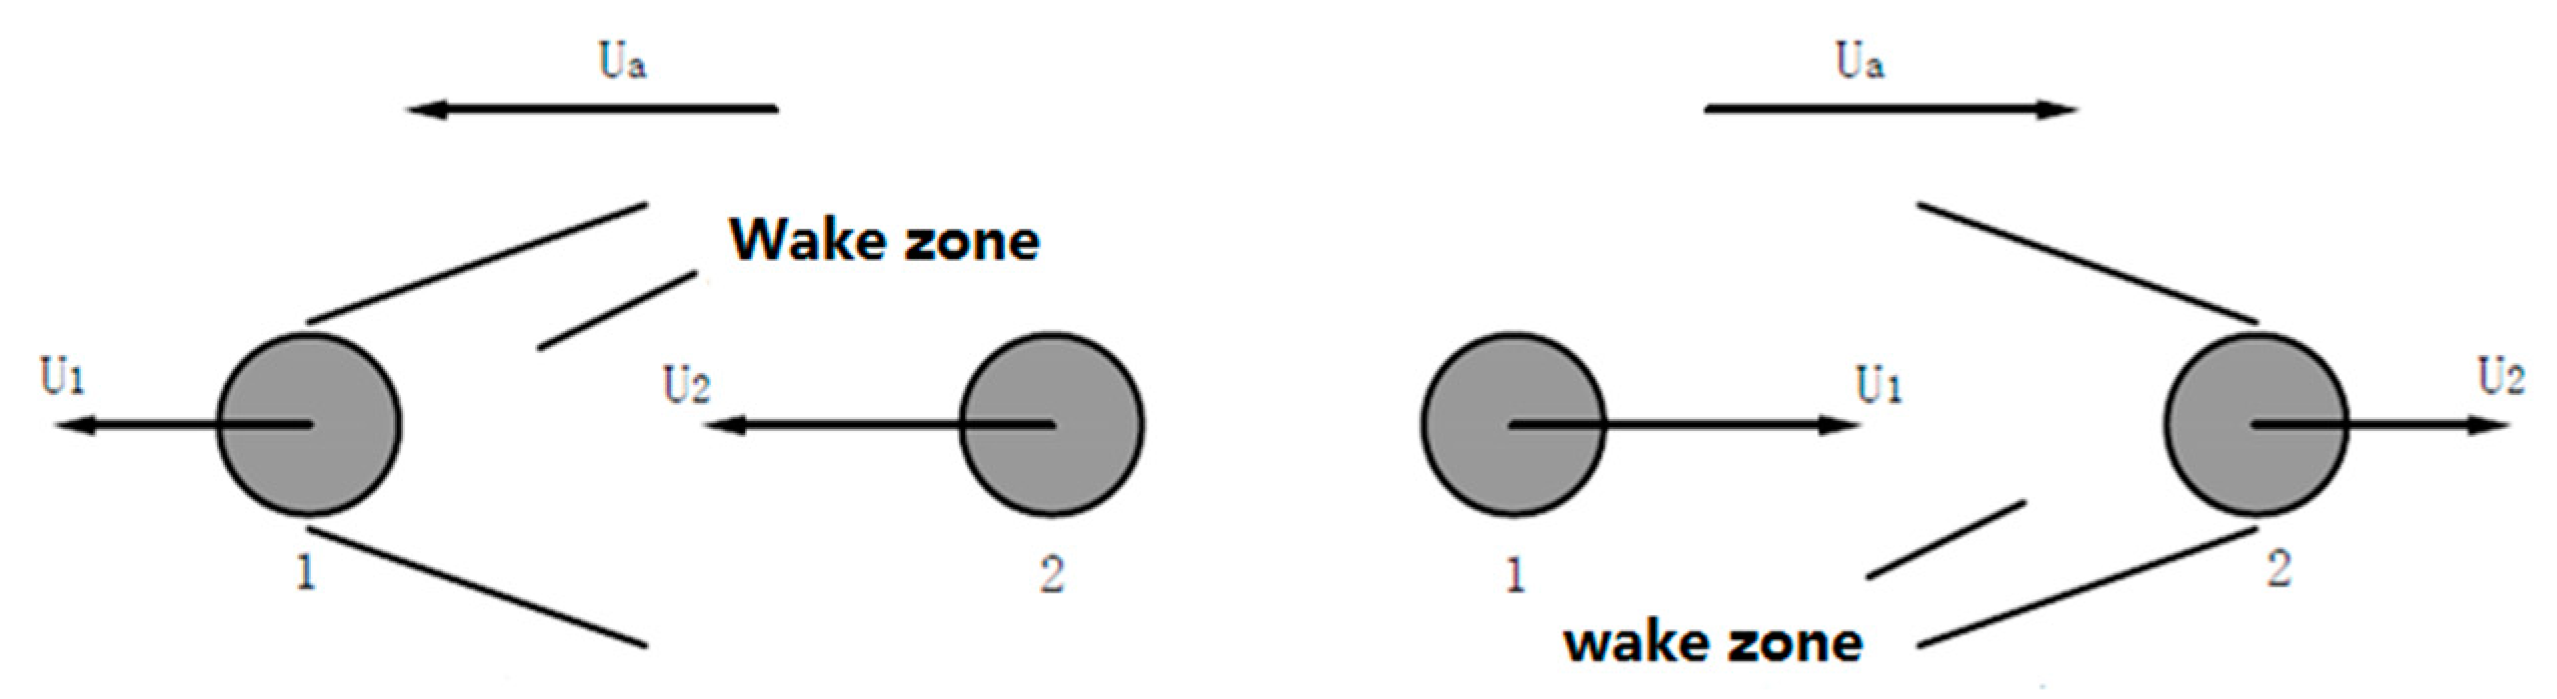
3.1. Acoustic Wave Field

In the acoustic field, sound waves propagate through the medium vibration. The particles in the dusty gas vibrate back and forth because of acoustic entrainment. The force that drives the particle movement is called acoustic driving force, also known as Stokes viscous force. It is expressed as follows [23]:
F s t = 3 π η g d ( u 0 sin ω t v a ) C c ,
where ηg is the air dynamic viscosity, u0 is the air velocity, ω is the angular frequency (ω = 2πf), f is the acoustic wave frequency, d is particle diameter, va is the velocity of particles moving in the sound transmission direction, and Cc is the Cunningham correction coefficient given by as follows [24]:
C c = 1 + λ d [ 2.514 + 0.8 exp ( 0.55 d λ ) ] ,
where λ refers to average free path of air molecules.
In acoustic wave field, fine particles collide and agglomerate into large ones because of the acoustic wave driving force. Furthermore, the acoustic entrainment coefficient is the ratio of the vibration amplitude of particles to that of air. It is given by the following formula:
μ p = 1 1 + ( ω τ ) 2 ,
where τ is the relaxation time calculated by the following expression:
τ = ρ d 2 C c 18 η g ,
where ρ is the density of particles.
The effects of acoustic frequencies and particle size on the entrainment coefficient is shown in Figure 3. A higher entrainment coefficient indicates that the particles vibrate together with air, whereas a lower entrainment coefficient indicates that particles are practically motionless.
In Equation (3), it can be observed that μp is affected by the acoustic frequency and it is independent of the SPLs. As shown in Figure 3, μp ranges from 0 to 1. When the particles are less than 1 μm, μp approaches 1; however, as the particle size increases, μp drops sharply. The particle size of monodisperse particles in this study was less than 5 μm, and the entrainment effect was evident within the 1000–2200-Hz acoustic frequency range in which the experiment was conducted.
The particle source used in this experiment was the DEH particles. All particles were practically in the same diameter range, and the relative speed was practically zero. Most studies considered orthokinetic interaction as the theoretical support of acoustic agglomeration [25]. In fact, hydrodynamics, especially the acoustic wake effect, also has an important function in the movement of particles in the acoustic field, as shown in Figure 4.
In the first half-cycle, two particles follow the medium to the left. Particle 1 generates a low-pressure wake area in the section it passes through, and, because of the pressure difference, particle 2 approaches particle 1 in the movement. In the latter half-cycle, two particles move to the right with the air medium. Similarly, a low-pressure wake area is generated at the tail of particle 2, and particle 1 approaches particle 2 because of the differential pressure. After several cycles, the two particles eventually collide and aggregate. At the same time, the monodisperse aerosol particles produced by the PALAS are not completely of the same size. The speeds and effects of orthokinetic interaction differ among different particles. In view of the foregoing, particle agglomeration is intensified.

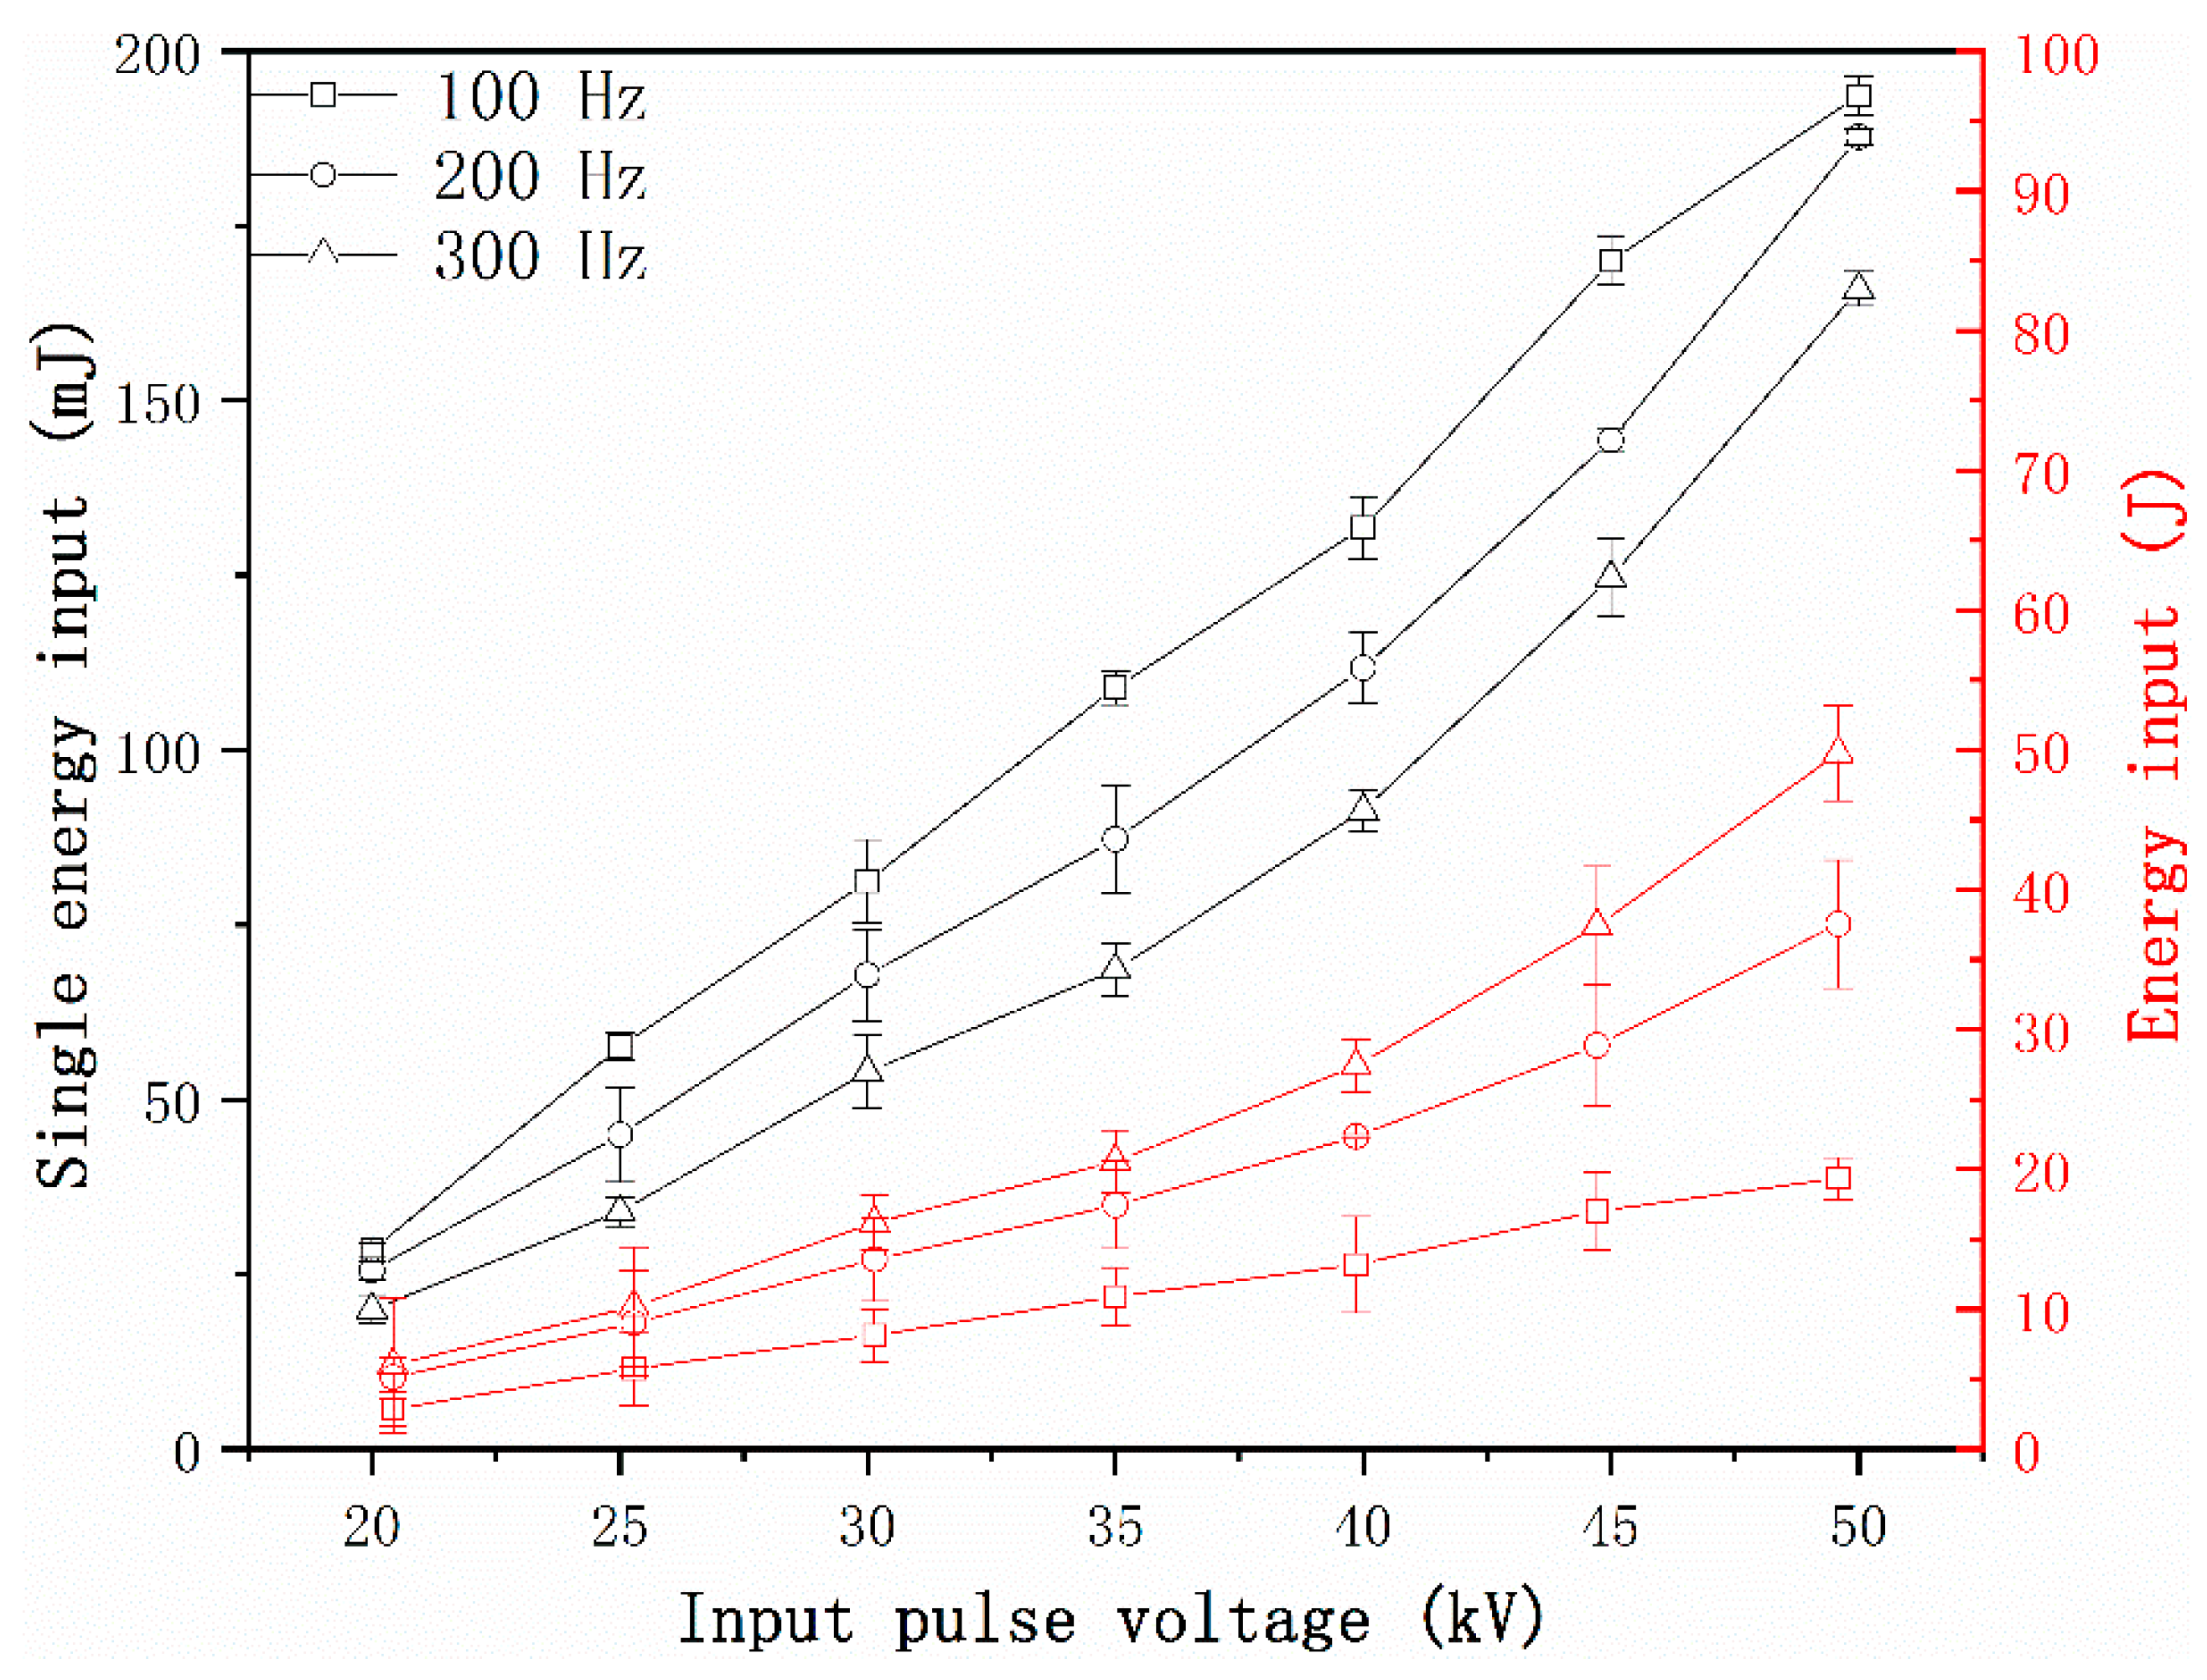
3.2. Pulsed Corona Discharge Field

In the monodisperse aerosol system, although the particles are mainly concentrated around a certain size, the pulsed corona discharge process is an intermittent discharge process. In the pulsed corona discharge period, the voltage is considerably high, and an electron avalanche occurs. When the electric field intensity is sufficiently large, a large number of free electrons can negatively charge the fine particles. During the intermission period, the positive ion diffusion charge dominates the whole space. In the entire particle movement process, charged particles move toward the electrode plate with the presence of the electric field force during the discharge period, and the particles with opposite charges collide under Coulomb forces.
Due to the influence of electric field force, the movement of particles to the plate is similar to that in the direct current discharge. The particles can, however, achieve a larger charge because of the high pulse voltage. The electric field force in this process can be expressed as follows:
F e = E a q ,
where Ea is the average electric field intensity inside ESP, and q is the particle charge.
Owing to the presence of mean free path, Cochet [26] combined the traditional field charge and diffusion charge to derive the overall expression of particle charge in the electric field as follows:
q = π ε 0 [ ( 1 + 2 λ d ) 2 + ( 2 1 + 2 λ d ) ( ε 1 ε + 2 ) ] E a d 2 ,
where ε0 is the permittivity of vacuum, and ε is the relative permittivity of particles.
In the process of moving toward the dust collector plate, the particles are also subject to viscous resistance. The particles are in the Stokes motion zone, and it can, therefore, be known from Newton’s second law that
m d v d t = E a q 6 π η g R v C c ,
where v is the velocity of particles moving toward the dust collector plate. This velocity is also the migration velocity in the ESP.
By solving Equation (6) and Equation (7) and ignoring the exponential term, the migration velocity formula can be obtained as follows:
v = E a q C c 6 π η g R .
In this study, monodisperse particles did not have an absolute single particle size. Particles with various sizes and opposite charges agglomerated because of the Coulomb force in the entire pulsed corona discharge process. Some scholars [22] believe that there is a distinct critical point between the electric field charge and diffusion charge in the pulsed corona discharge process. Regardless of whether it is the discharge period or the intermission period, even particles of the same size may be oppositely charged, and the process becomes relatively complex. When considering particle charge, the approximate expression is that of Equation (8). The mathematical expression of Coulomb force in the pulsed corona discharge is as follows:
F c = q 1 q 2 4 π ε 0 r 2 ,
where r is the center distance between two particles, and q1 and q2 are the particle charges.
The acoustic wave and pulsed corona discharge coupling field can increase the probability of collision and agglomeration of fine particles. Some of these fine particles are collected by the dust collector plate, thus effectively reducing their number. Chen et al. [27] used a numerical calculation to analyze the agglomeration coefficient of the acoustic and electricity coupling field; they drew a conclusion that the existence of the coupling field increased the agglomeration coefficient of particles compared with that in the single external field, and they also verified the theoretical analysis and results of this paper.

4. Results and Discussion

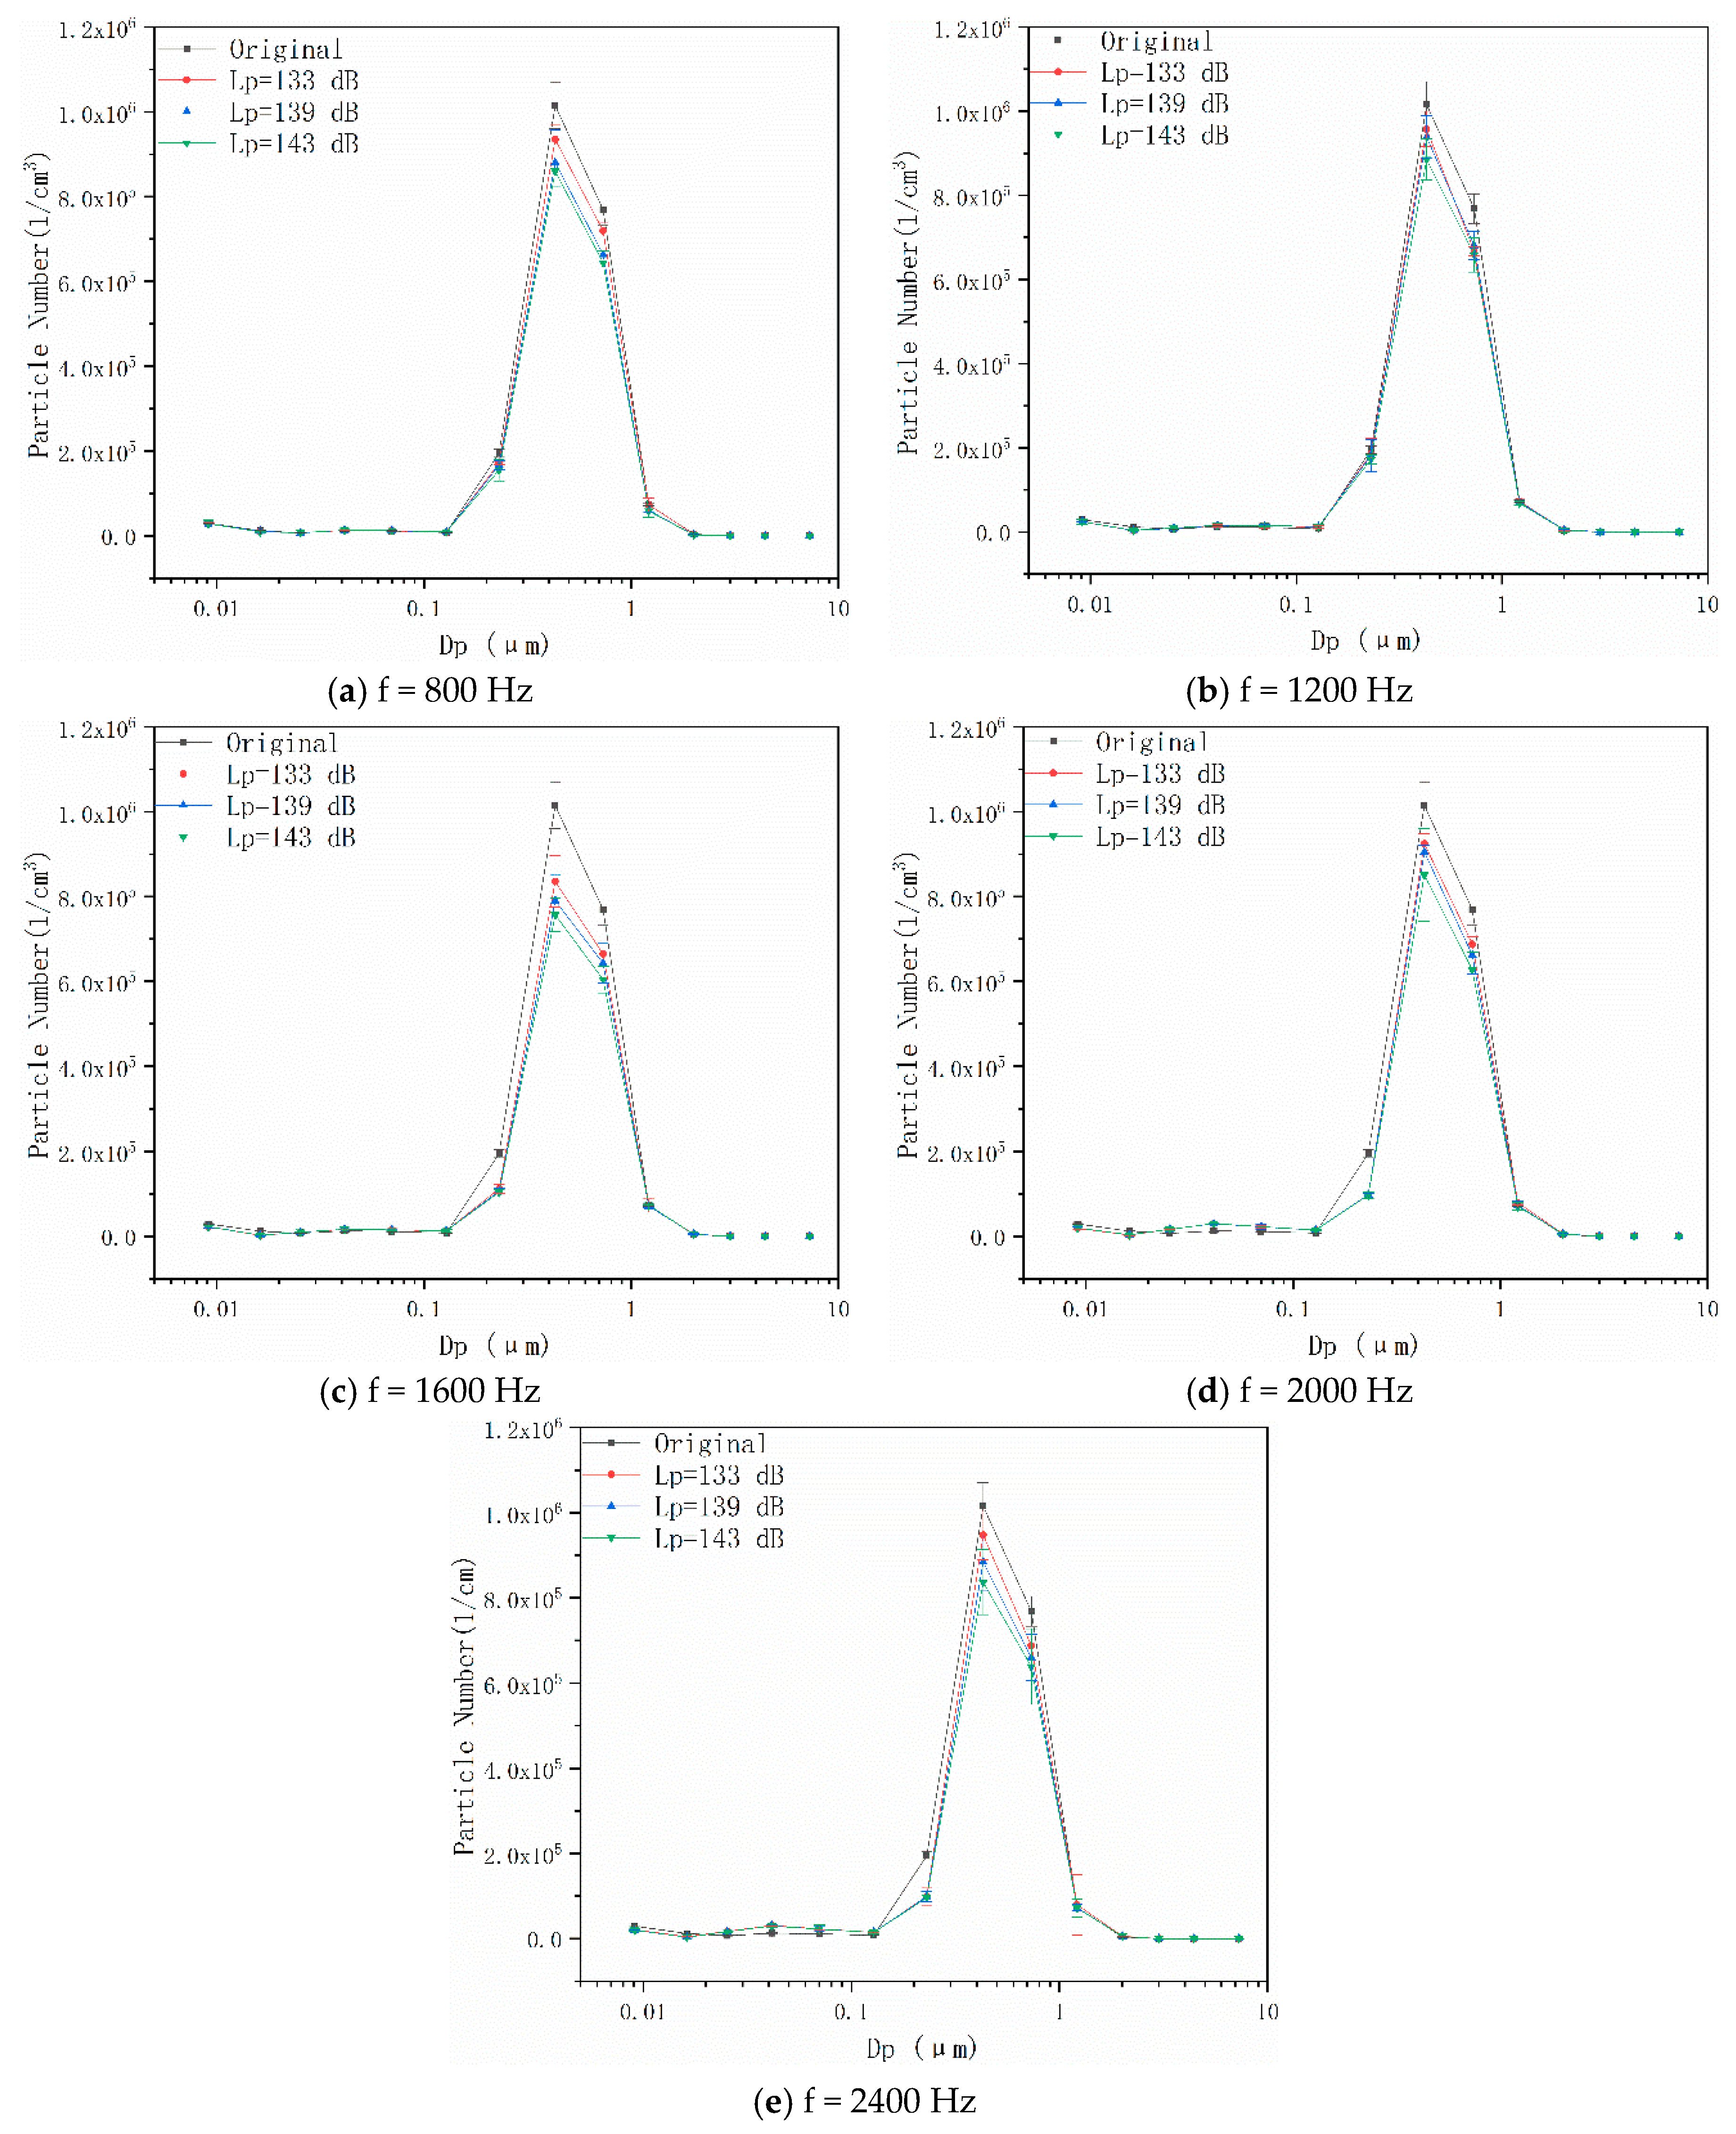
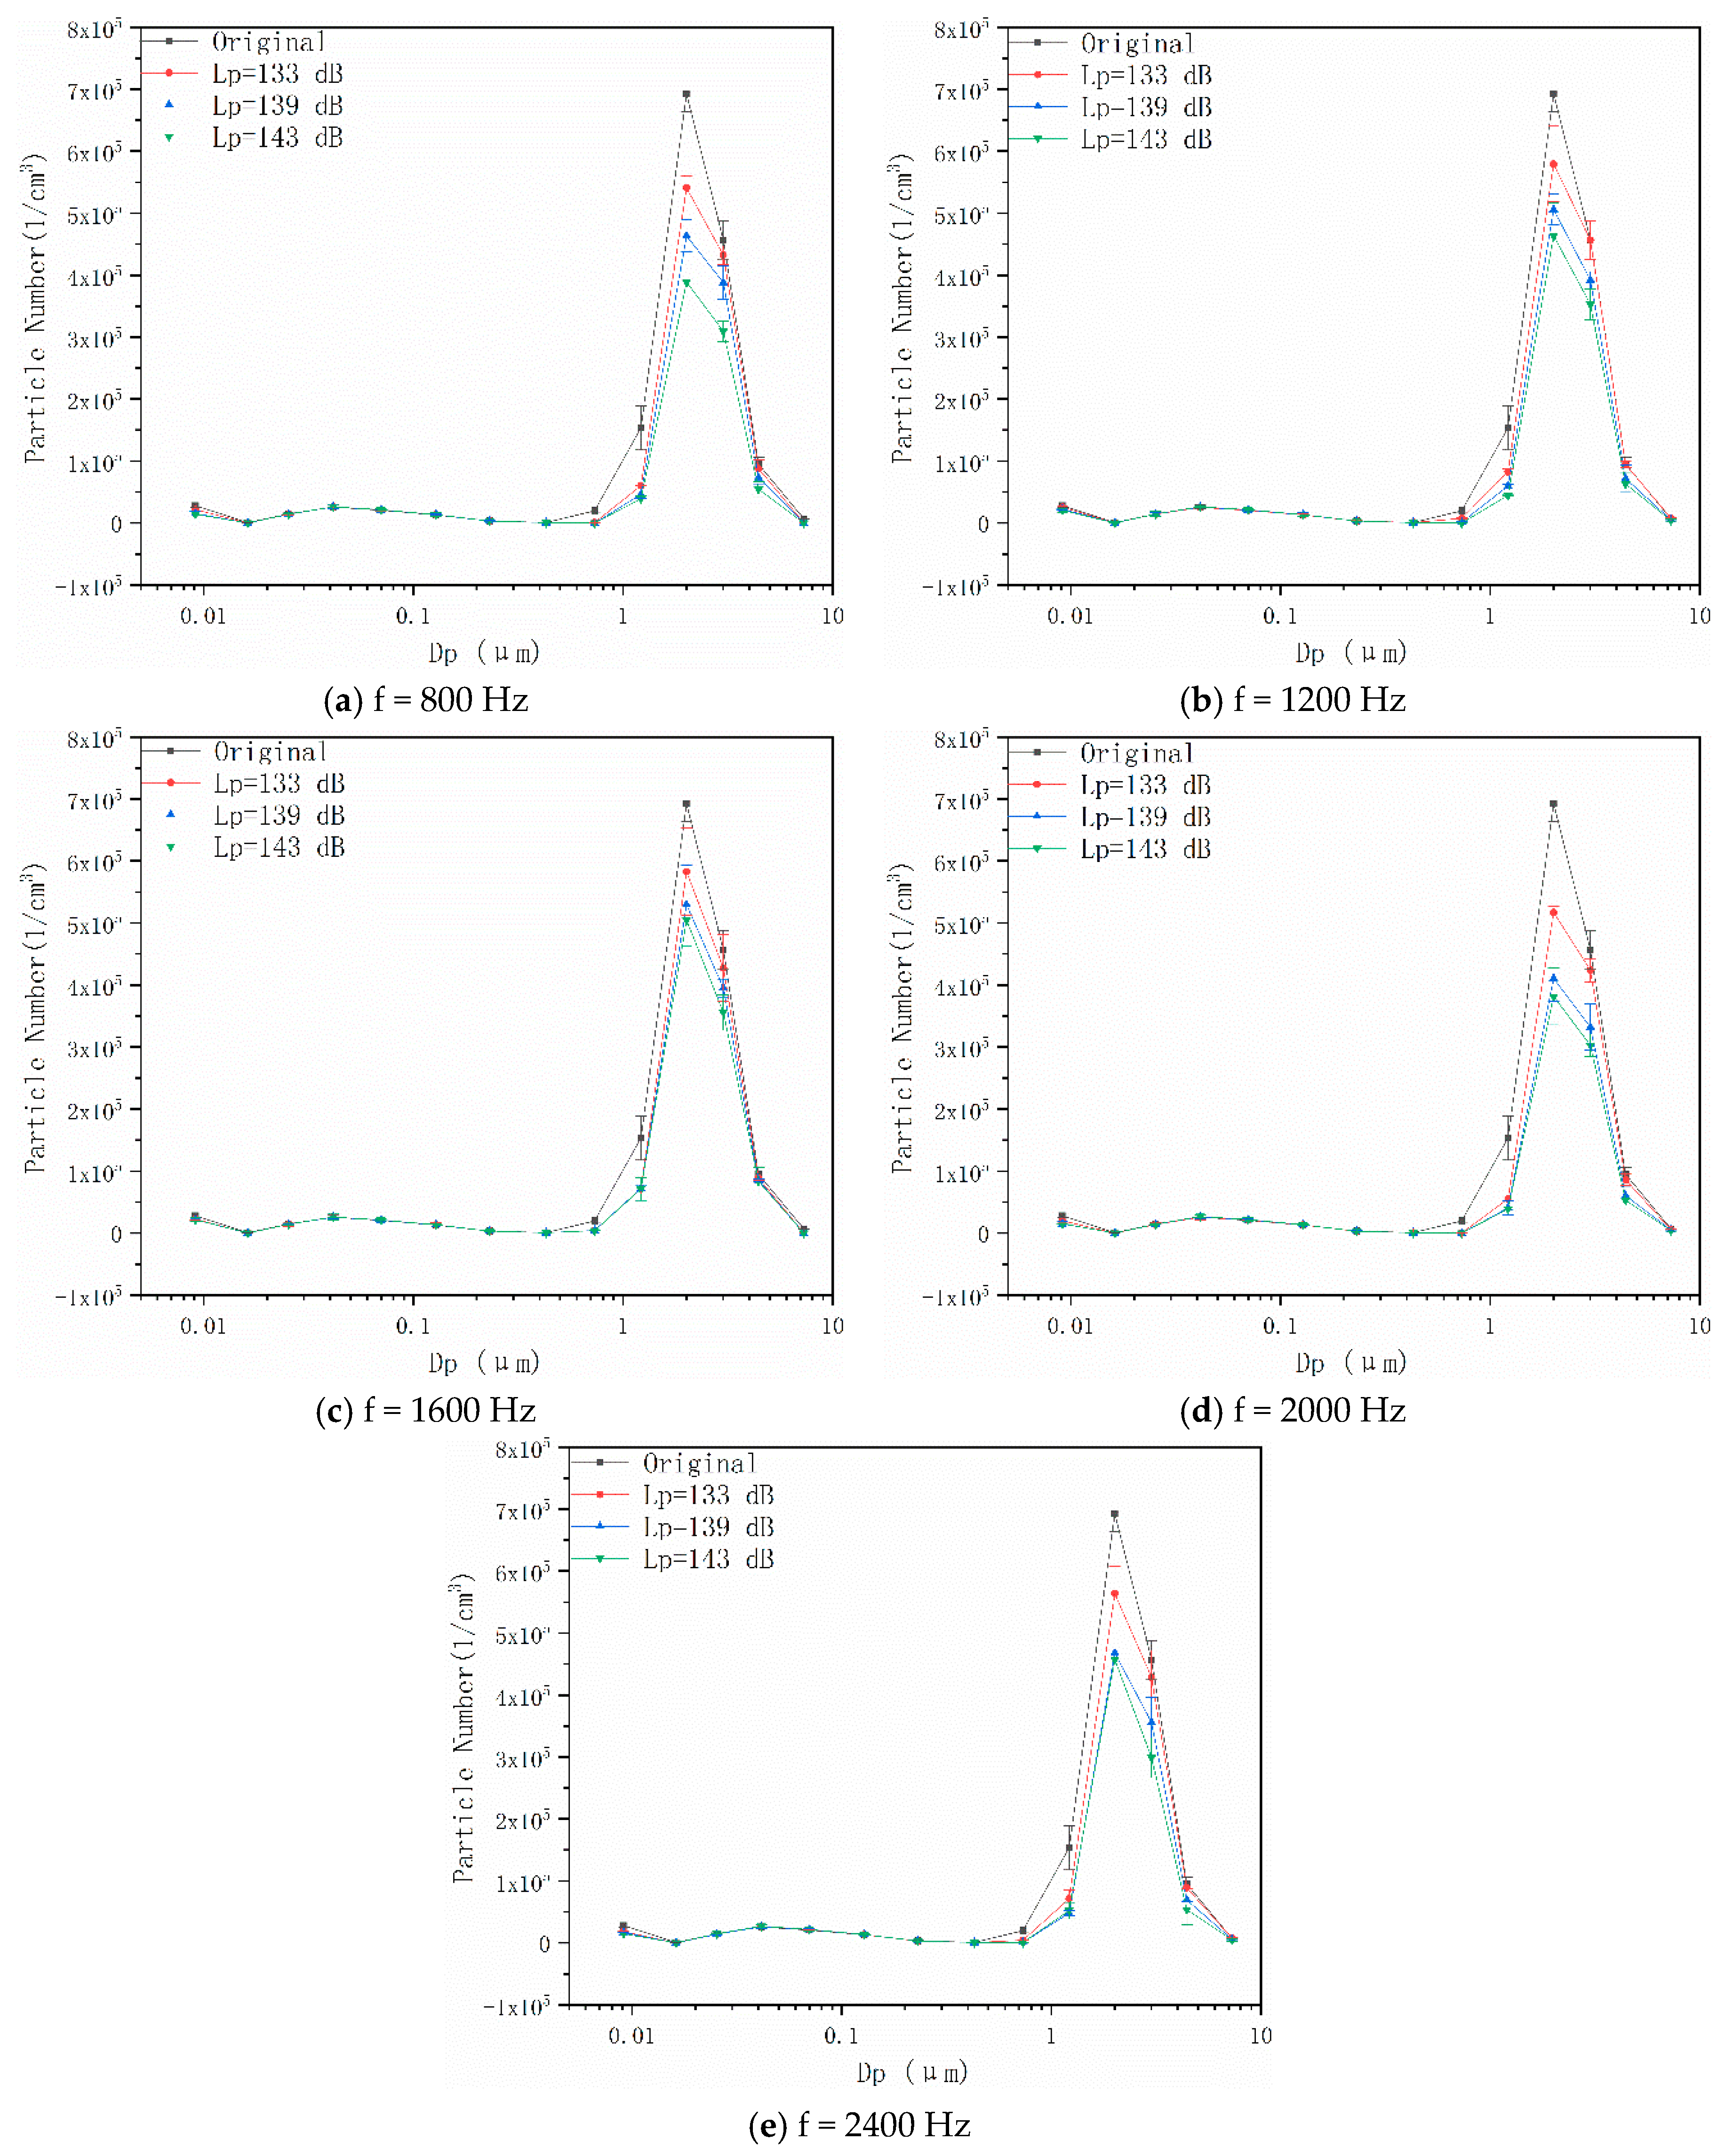
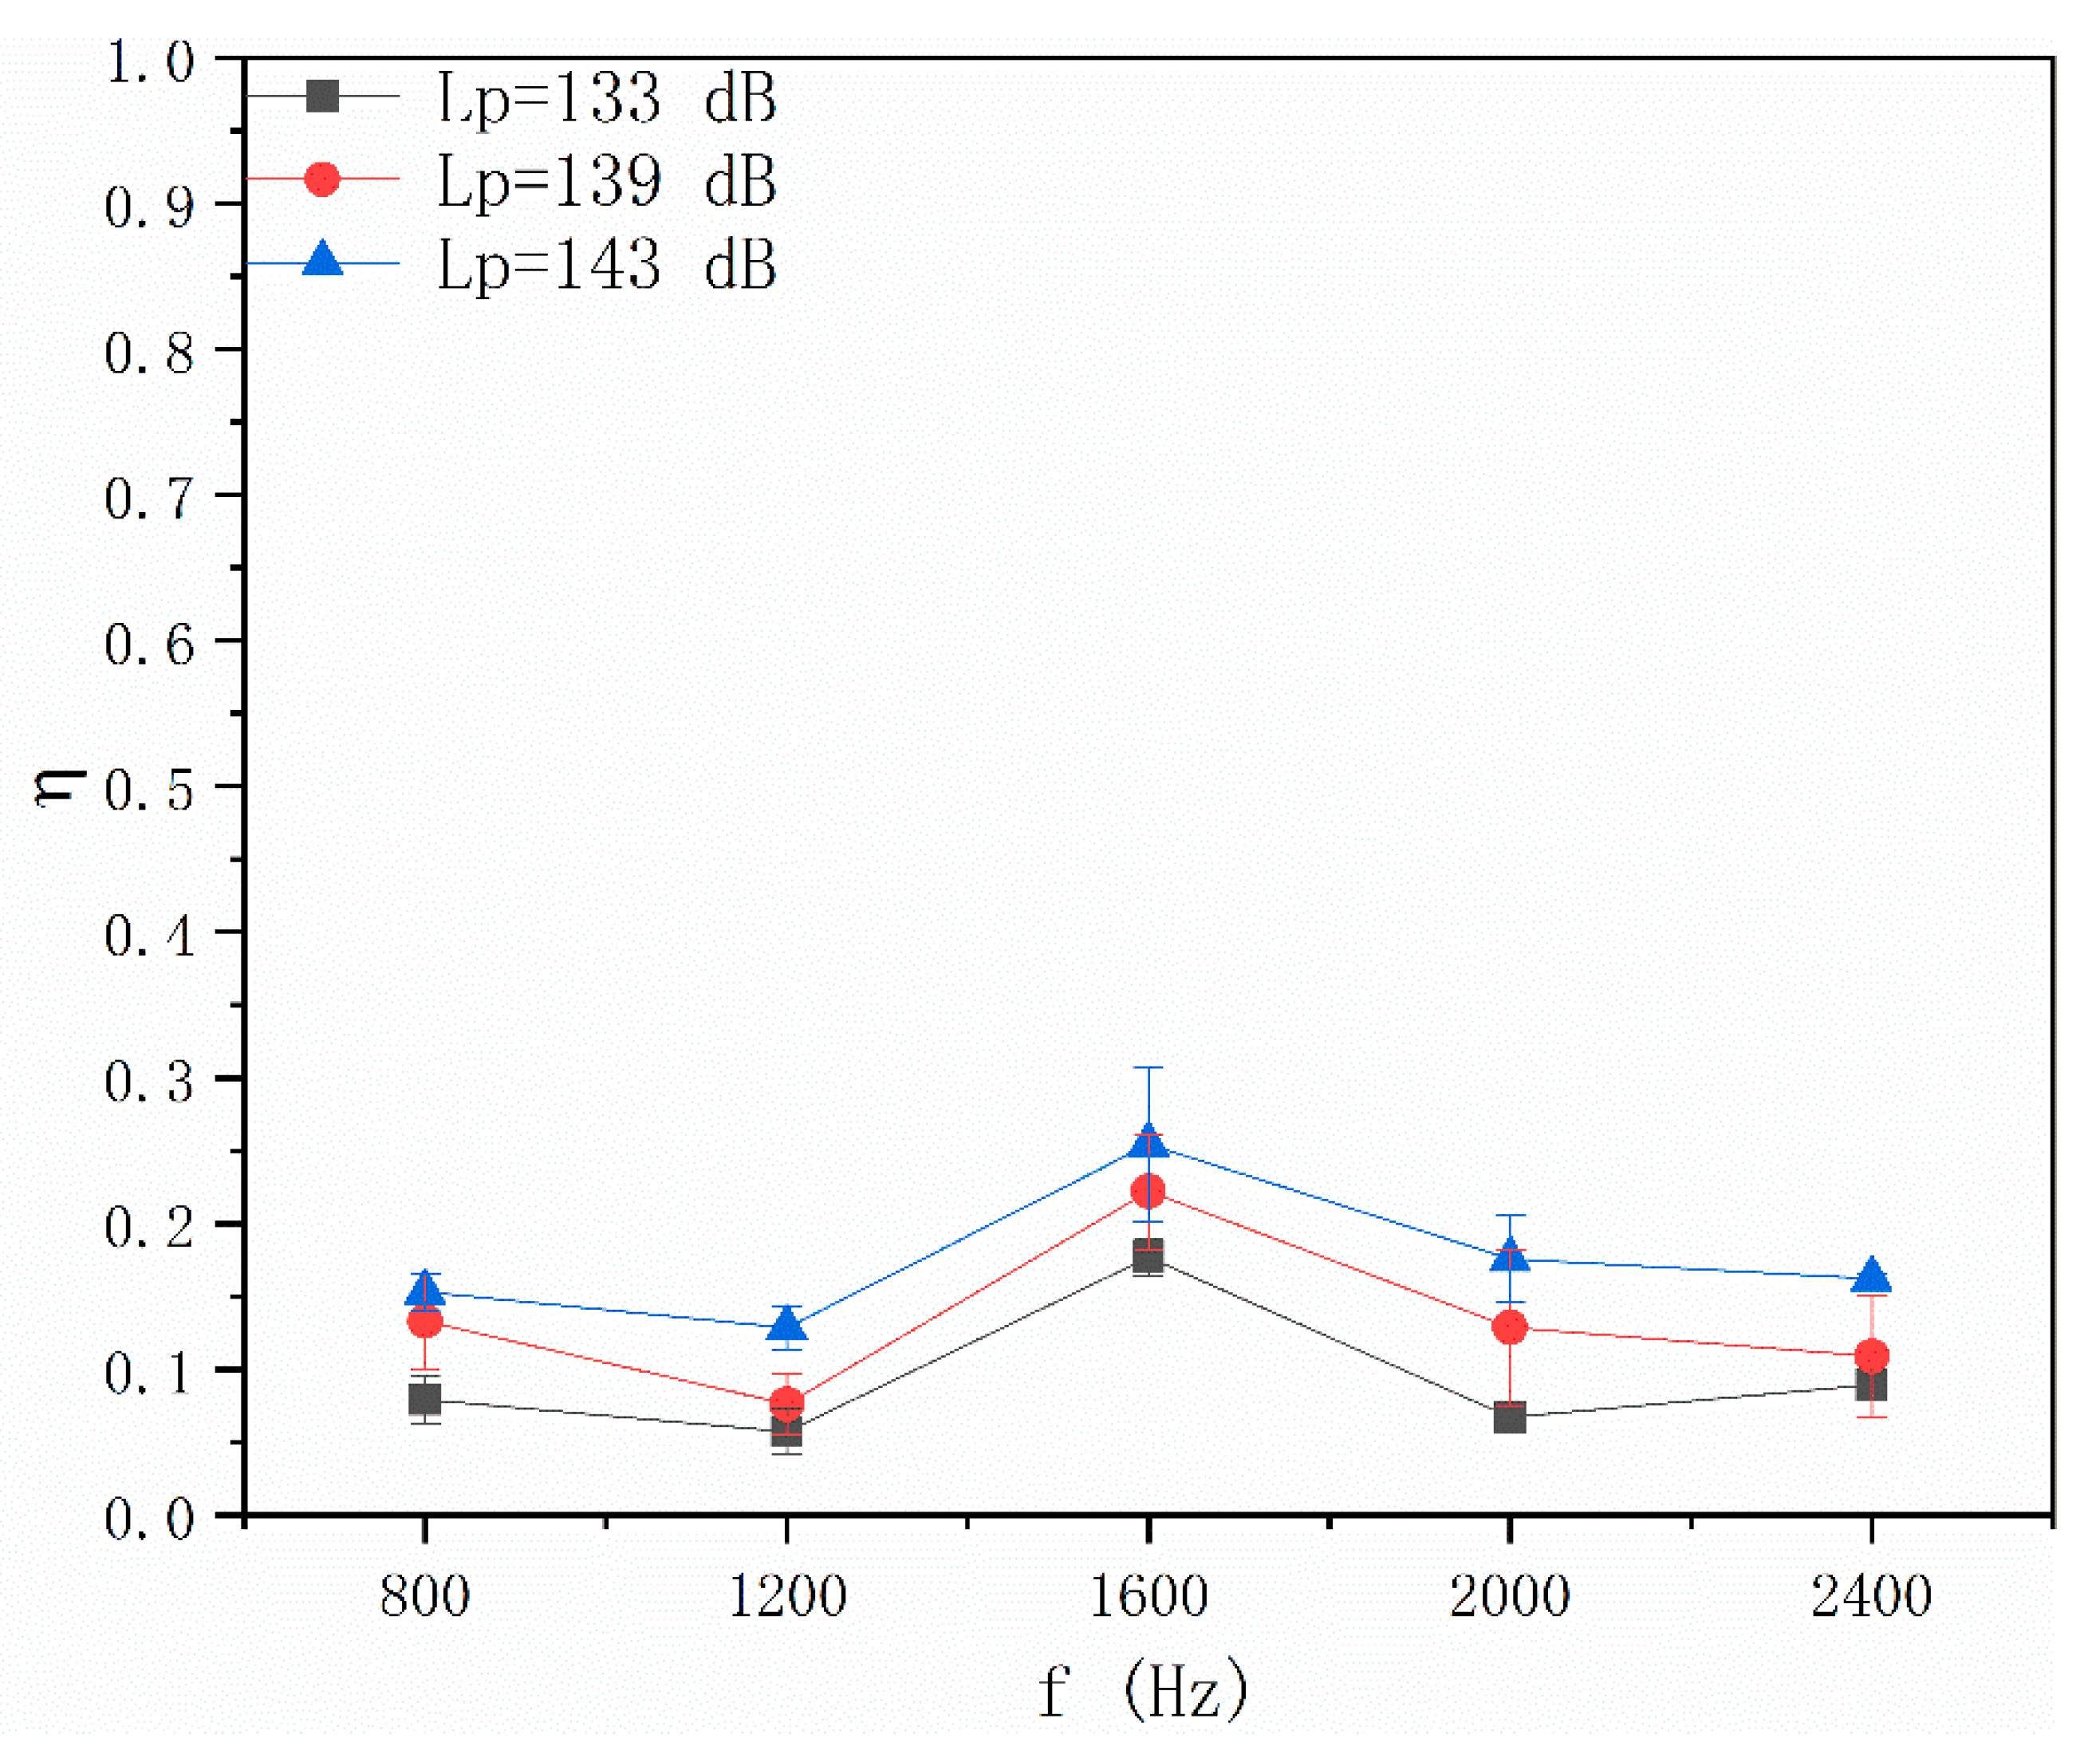
4.1. Effects of Acoustic Wave Field on Particle Number Concentration

When the temperature was adjusted to 160 °C, the DEH particle size was 0.5 μm. The effect of SPLs on acoustic agglomeration under different acoustic frequencies is shown in Figure 5, where f is the acoustic frequency. The number concentration of DEH particles in the initial state without the acoustic field is indicated in the original curve. As the SPL increased considerably, the concentration number decreased. It can be concluded that large SPLs are conducive to acoustic agglomeration. The trend of decrease, however, was not evident, and a significant decrease was only observed at the 1600-Hz frequency. The optimal condition occurred when the SPL was 143 dB and the acoustic wave frequency was 1600 Hz; under this condition, the PNC decreased by 25.5%.
When the aerosol particle size was adjusted to 2 μm, the influence of SPLs at different frequencies can be observed in Figure 6. The figure indicates that the change rule of PNC was similar to that when the particle size was 0.5 μm. The reduction ratio of particles, however, was significantly improved compared with that of the 0.5-μm particles. The best improvements occurred when the SPL was 143 dB at frequencies of 1600 and 2000 Hz. Under these two conditions, the number concentration of particles was reduced by 43.8% and 45%, respectively.
When the aerosol particle size was adjusted to 4 μm, the influence of SPLs at different frequencies can be observed in Figure 7. Compared with the 0.5- and 2-μm particles, the effect of acoustic agglomeration on the 4-μm particles was remarkable; under most frequencies, the number concentration of particles significantly decreased by 59–84%, and the frequency band of the effective acoustic wave widened.
The effect of acoustic agglomeration is reflected by the reduction ratio of the PNC. This ratio was calculated using Equation (10).
η = 1 N N 0 ,
where η is the reduction ratio, N0 is the original PNC, and N is the PNC after agglomeration effects.
Figure 8 illustrates the reduction ratio of 0.5-μm particles at different acoustic frequencies and SPLs. A larger SPL resulted in a greater reduction in the number concentration of particles. The increase in the SPL mainly increased the amplitude of the air medium and particle vibrations. As the amplitude increased, the range of motion of each particle also increased. The relative motion among particles also increased, thus increasing the probability of collision and agglomeration. The optimal frequency for the acoustic agglomeration of the 0.5-μm particles in the selected frequency band was 1600 Hz.
The reduction ratios of the 2-μm particles at different acoustic frequencies and SPLs are shown in Figure 9.
It can be observed that the acoustic agglomeration effect on 2-μm particles at 800 Hz improved, and there was a downward trend at 1200 Hz. The effect when the SPL was 143 dB and the frequencies were 1600 and 2000 Hz was evident, i.e., the reduction ratio reached approximately 45%. The reduction ratio curve of the 4-μm particles at different SPLs and frequencies is shown in Figure 10. This curve was similar to that of the 2-μm particles, and the optimal frequency remained at 2000 Hz; however, the reduction ratio of the 4-μm particles was considerably larger than that of the 2- and 0.5-μm particles.
By comparing the acoustic agglomeration results of the three particle sizes, it can be observed that, within the selected 800–2200-Hz frequency band, the agglomeration effect on the 4-μm particles was more evident under the same acoustic condition. Some scholars [21] found that a larger particle number concentration led to a better acoustic agglomeration effect. The concentration number of the 4-μm particles was low and it was only one-third of that of the 0.5-μm particles. This is because the evaporation of DEHs in the monodisperse aerosol generator was constant. The acoustic agglomeration effect on the 4-μm particles, however, was considerably better than that on the 2- and 0.5-μm particles. When SPL = 143 dB and f = 2000 Hz, η4 = 0.814, whereas η0.5 = 0.254 when SPL = 143 dB and f = 1600 Hz. It can be observed that the particle size distribution compared with the number concentration had a more significant effect on acoustic agglomeration. Based on the orthokinetic agglomeration mechanism in the acoustic field, acoustic agglomeration is mainly embodied in the carrying effect of acoustic waves on particles. Furthermore, particles vibrate with the acoustic waves to generate the aggregate volume and relative motion among particles. If the particles are extremely small, then the frequency of the acoustic wave that can completely carry the particles is high, the volume of submicron particles is minuscule, the movement range is considerably limited, and there are fewer particle collisions.

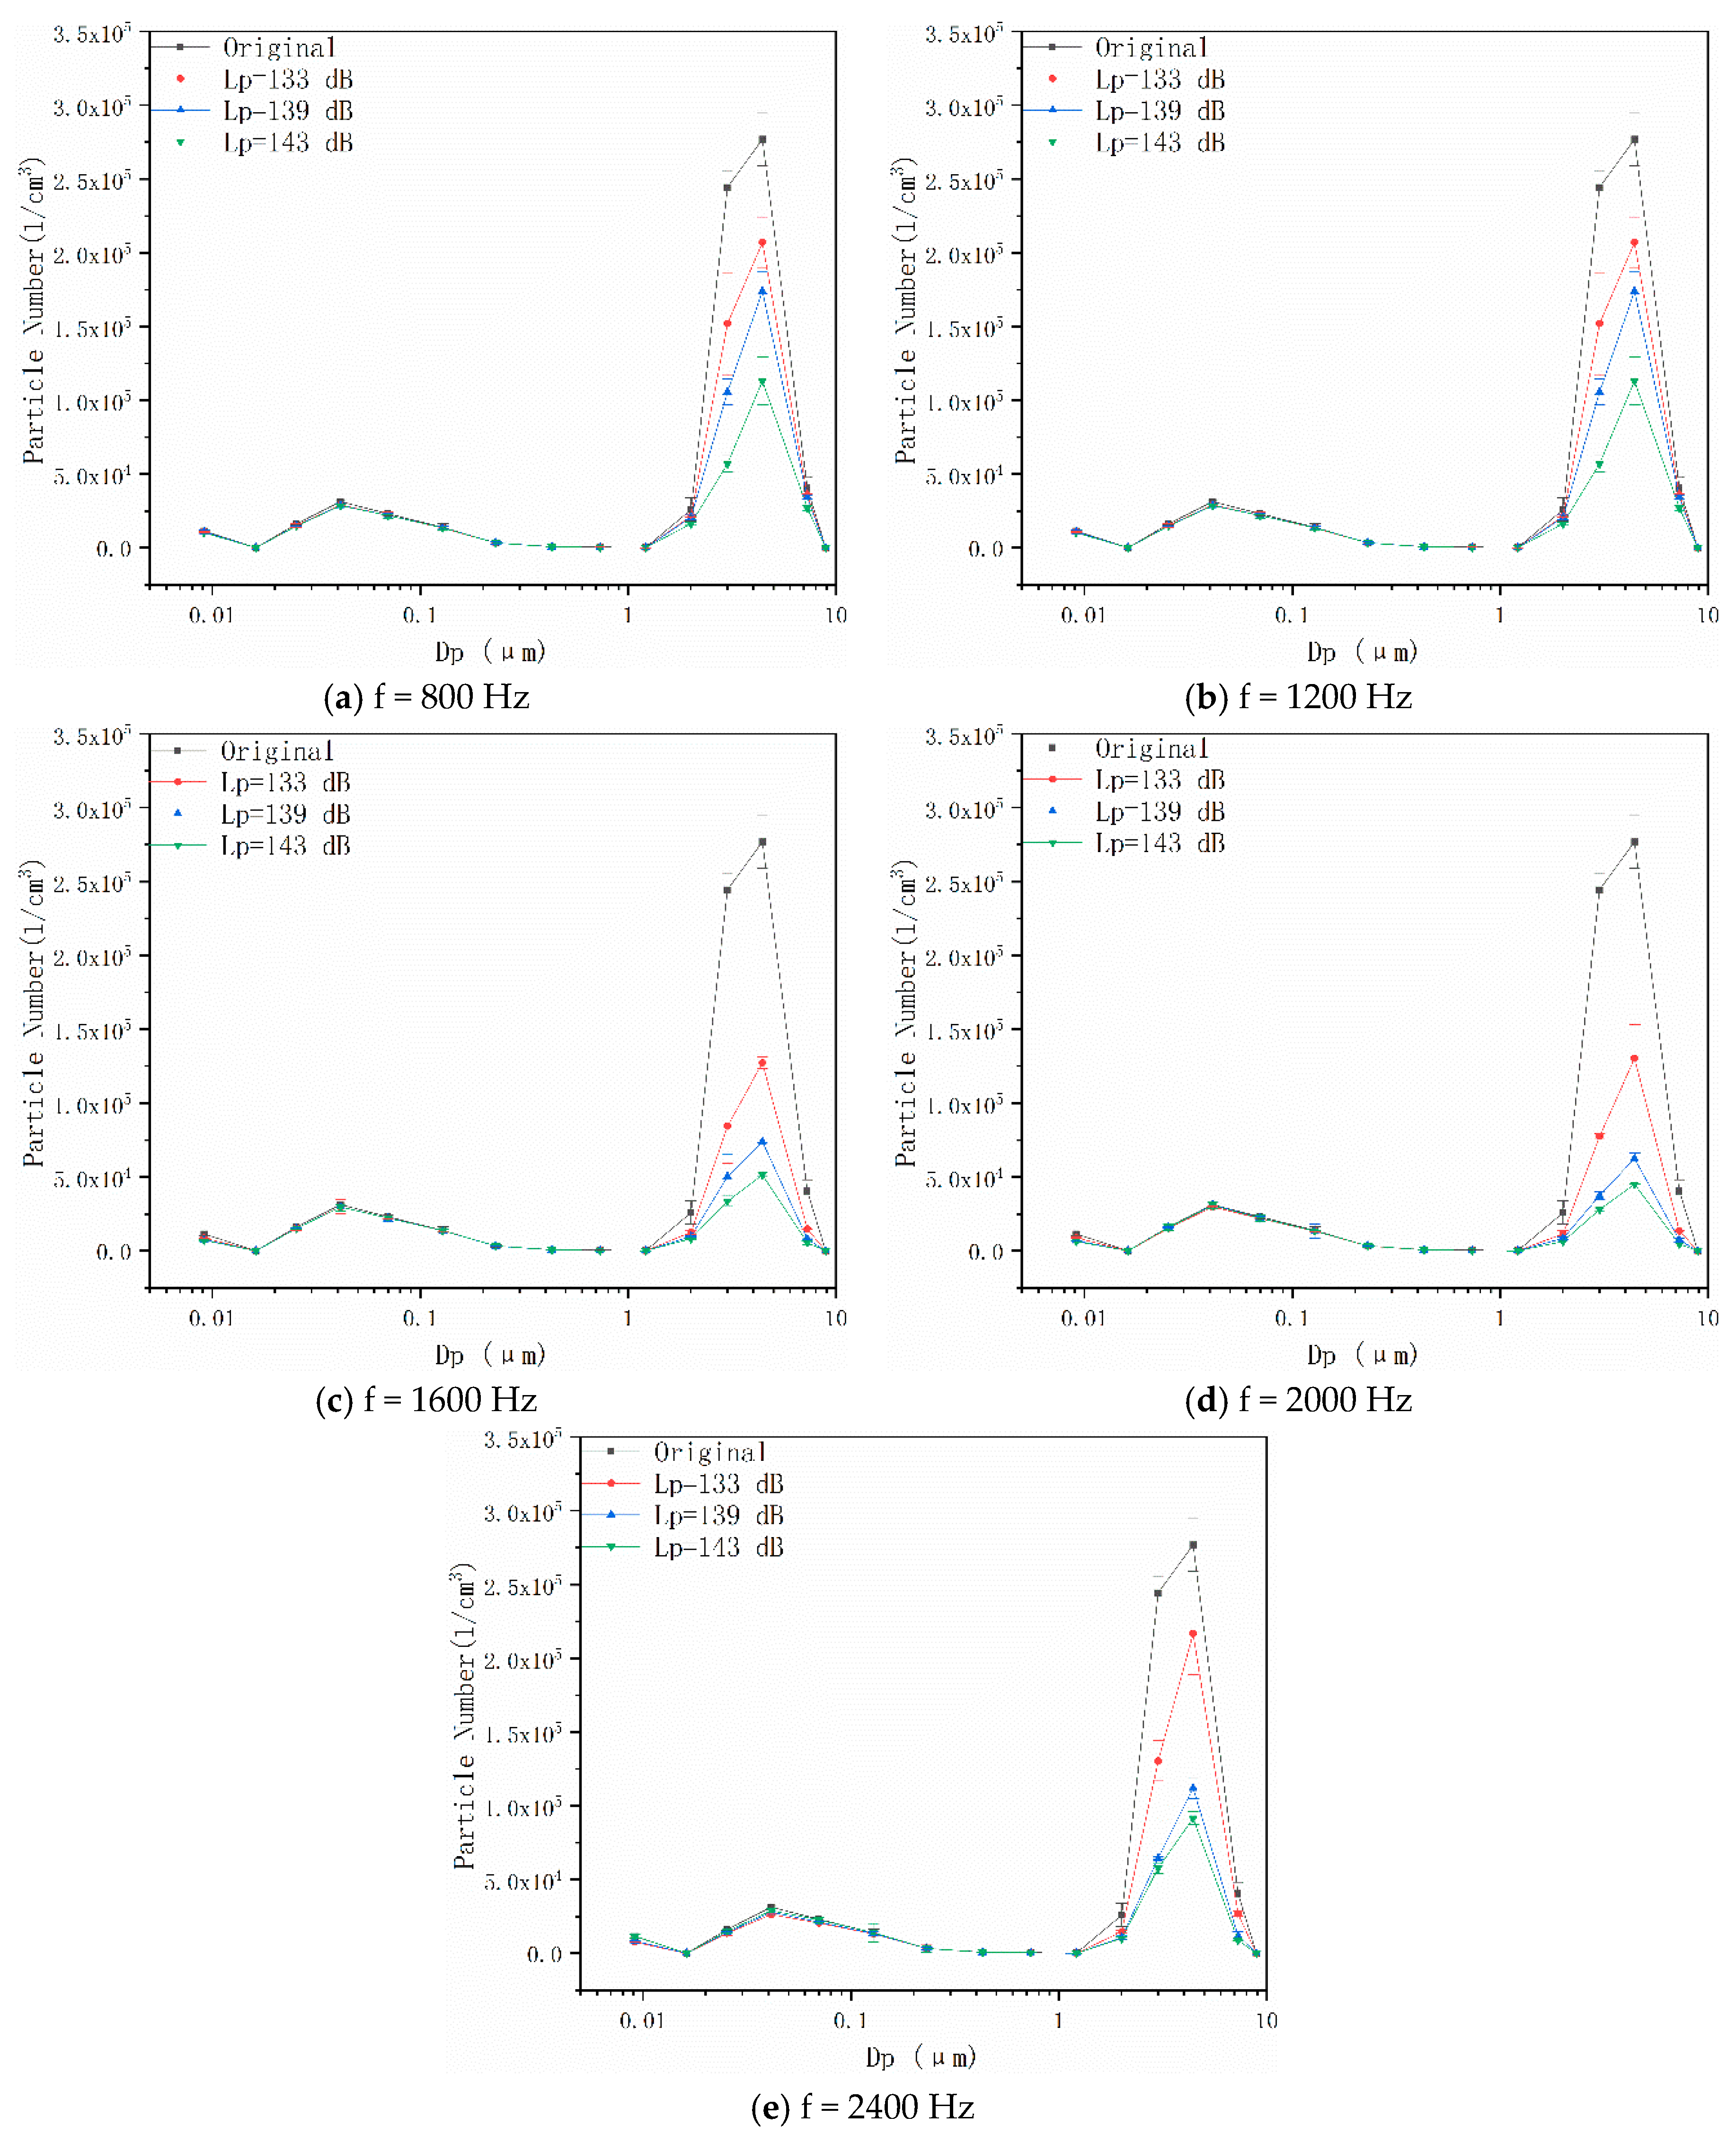
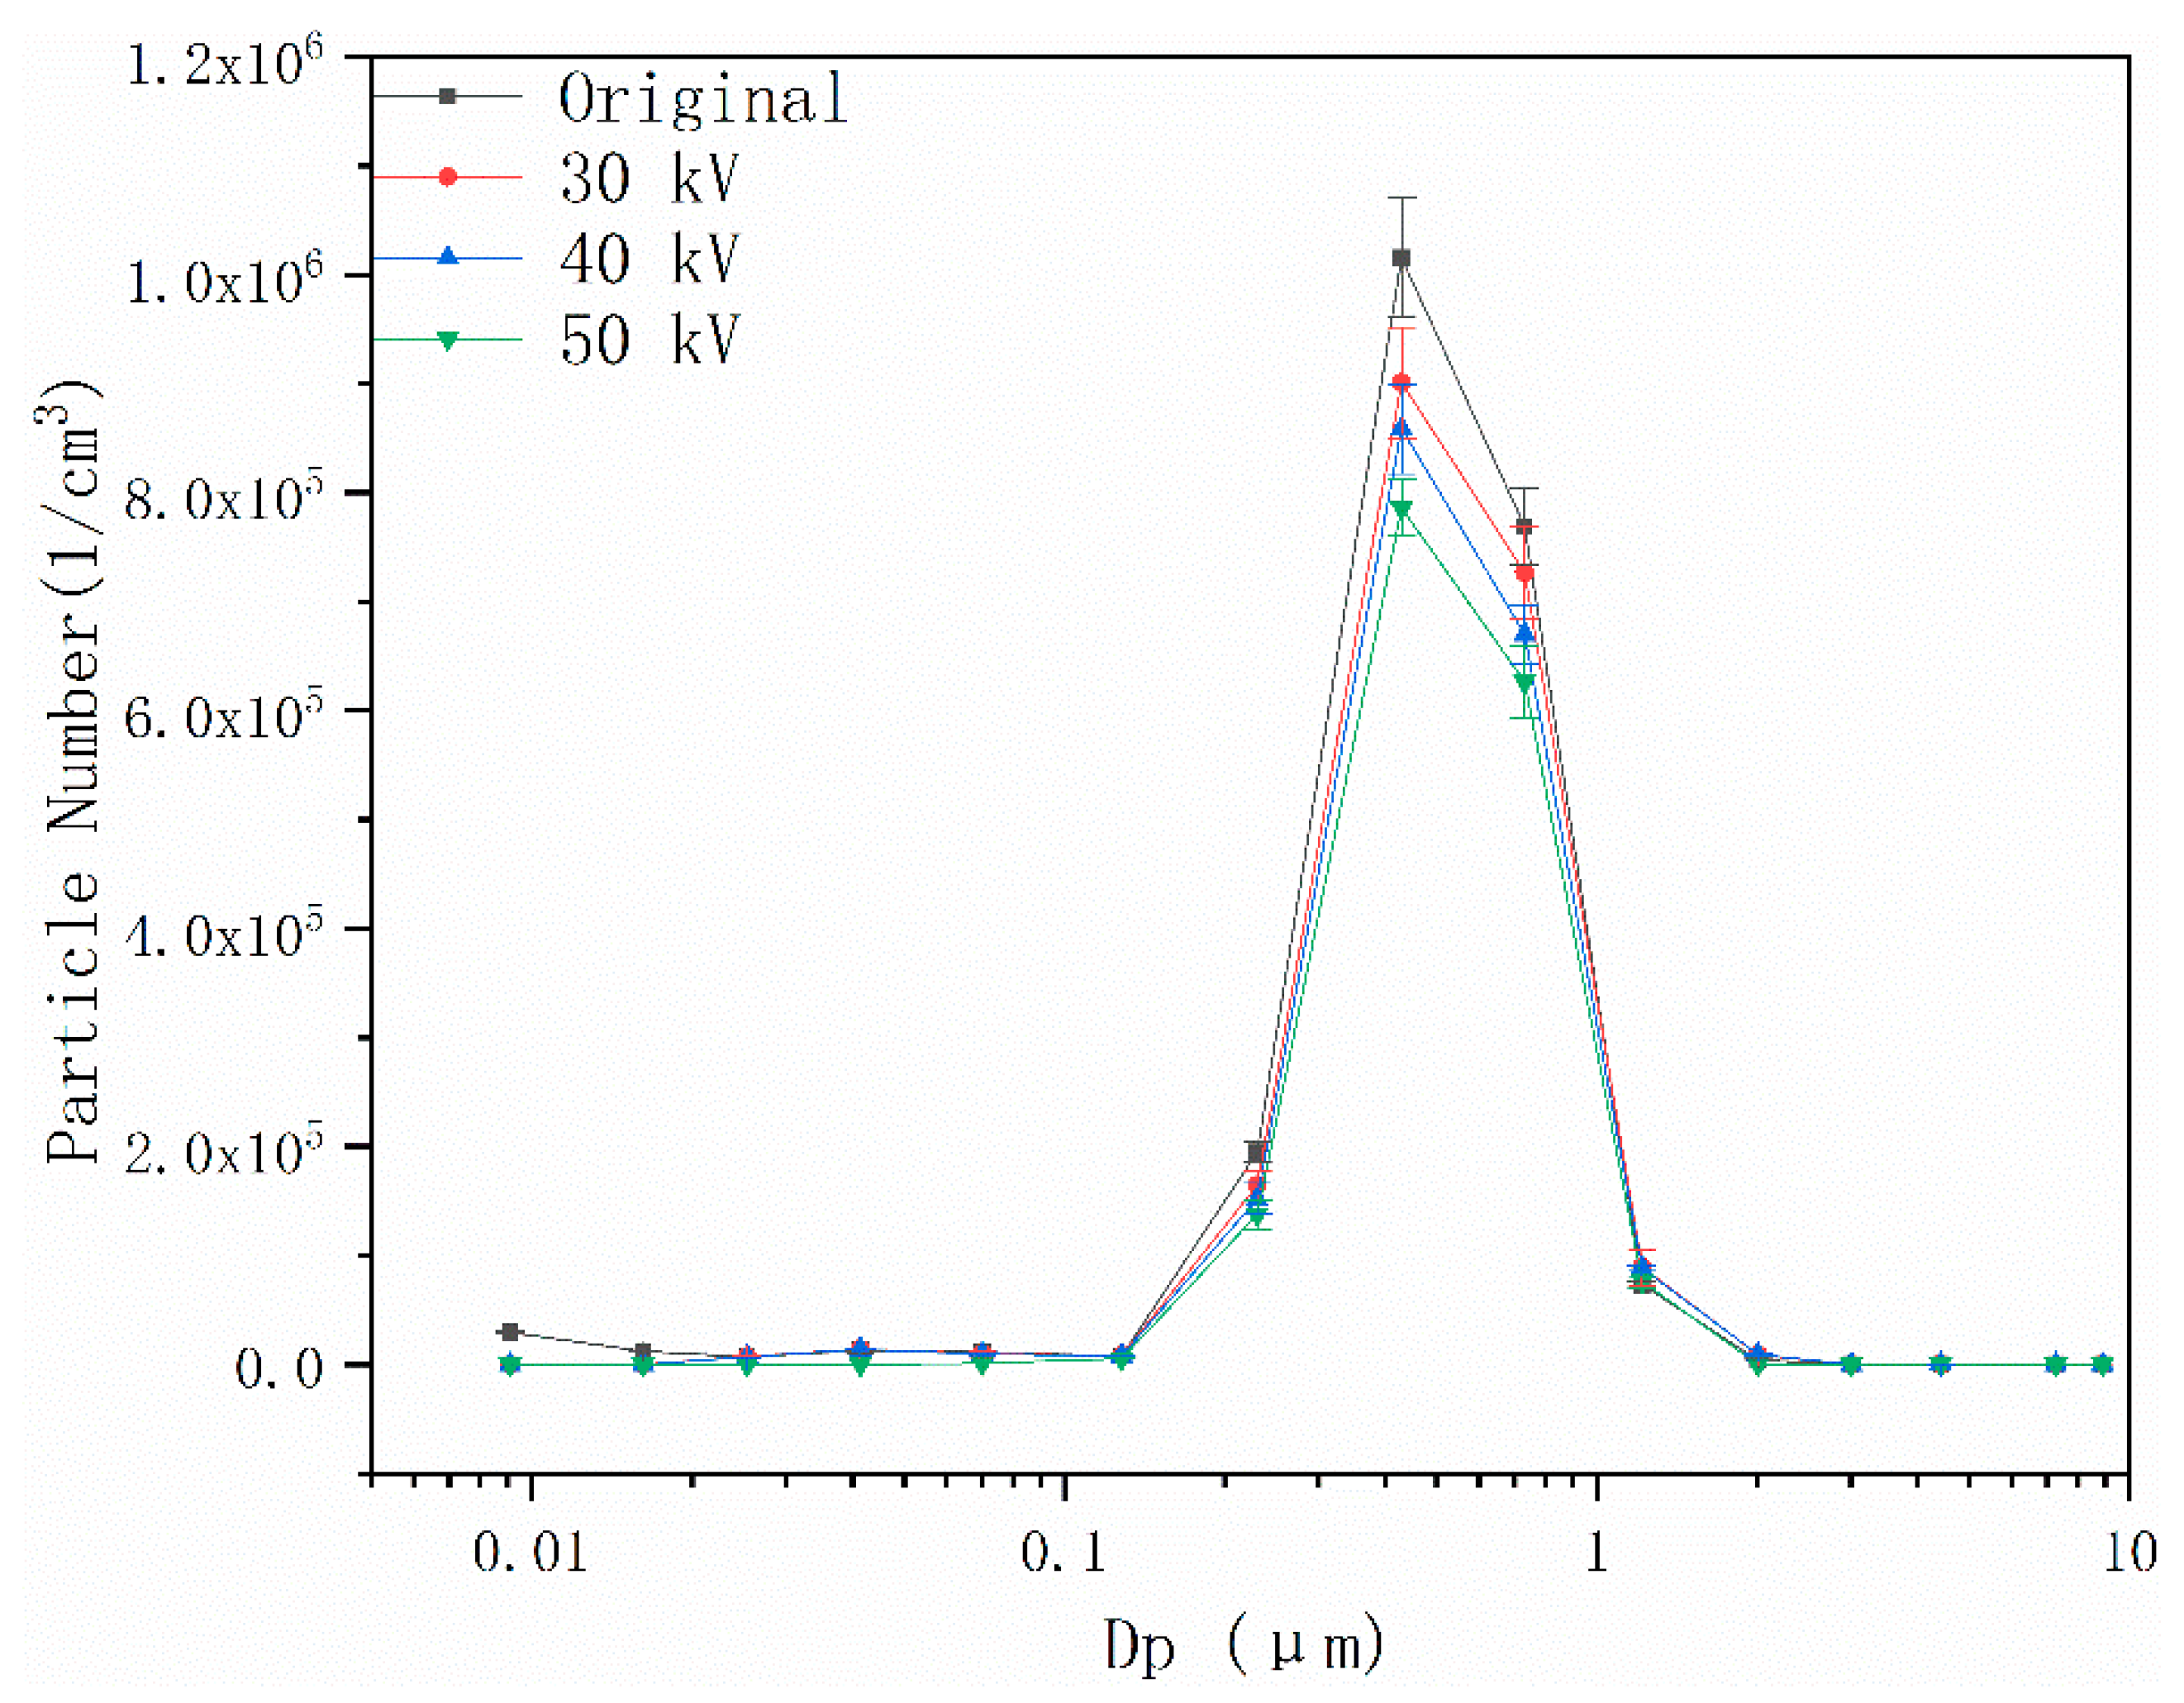
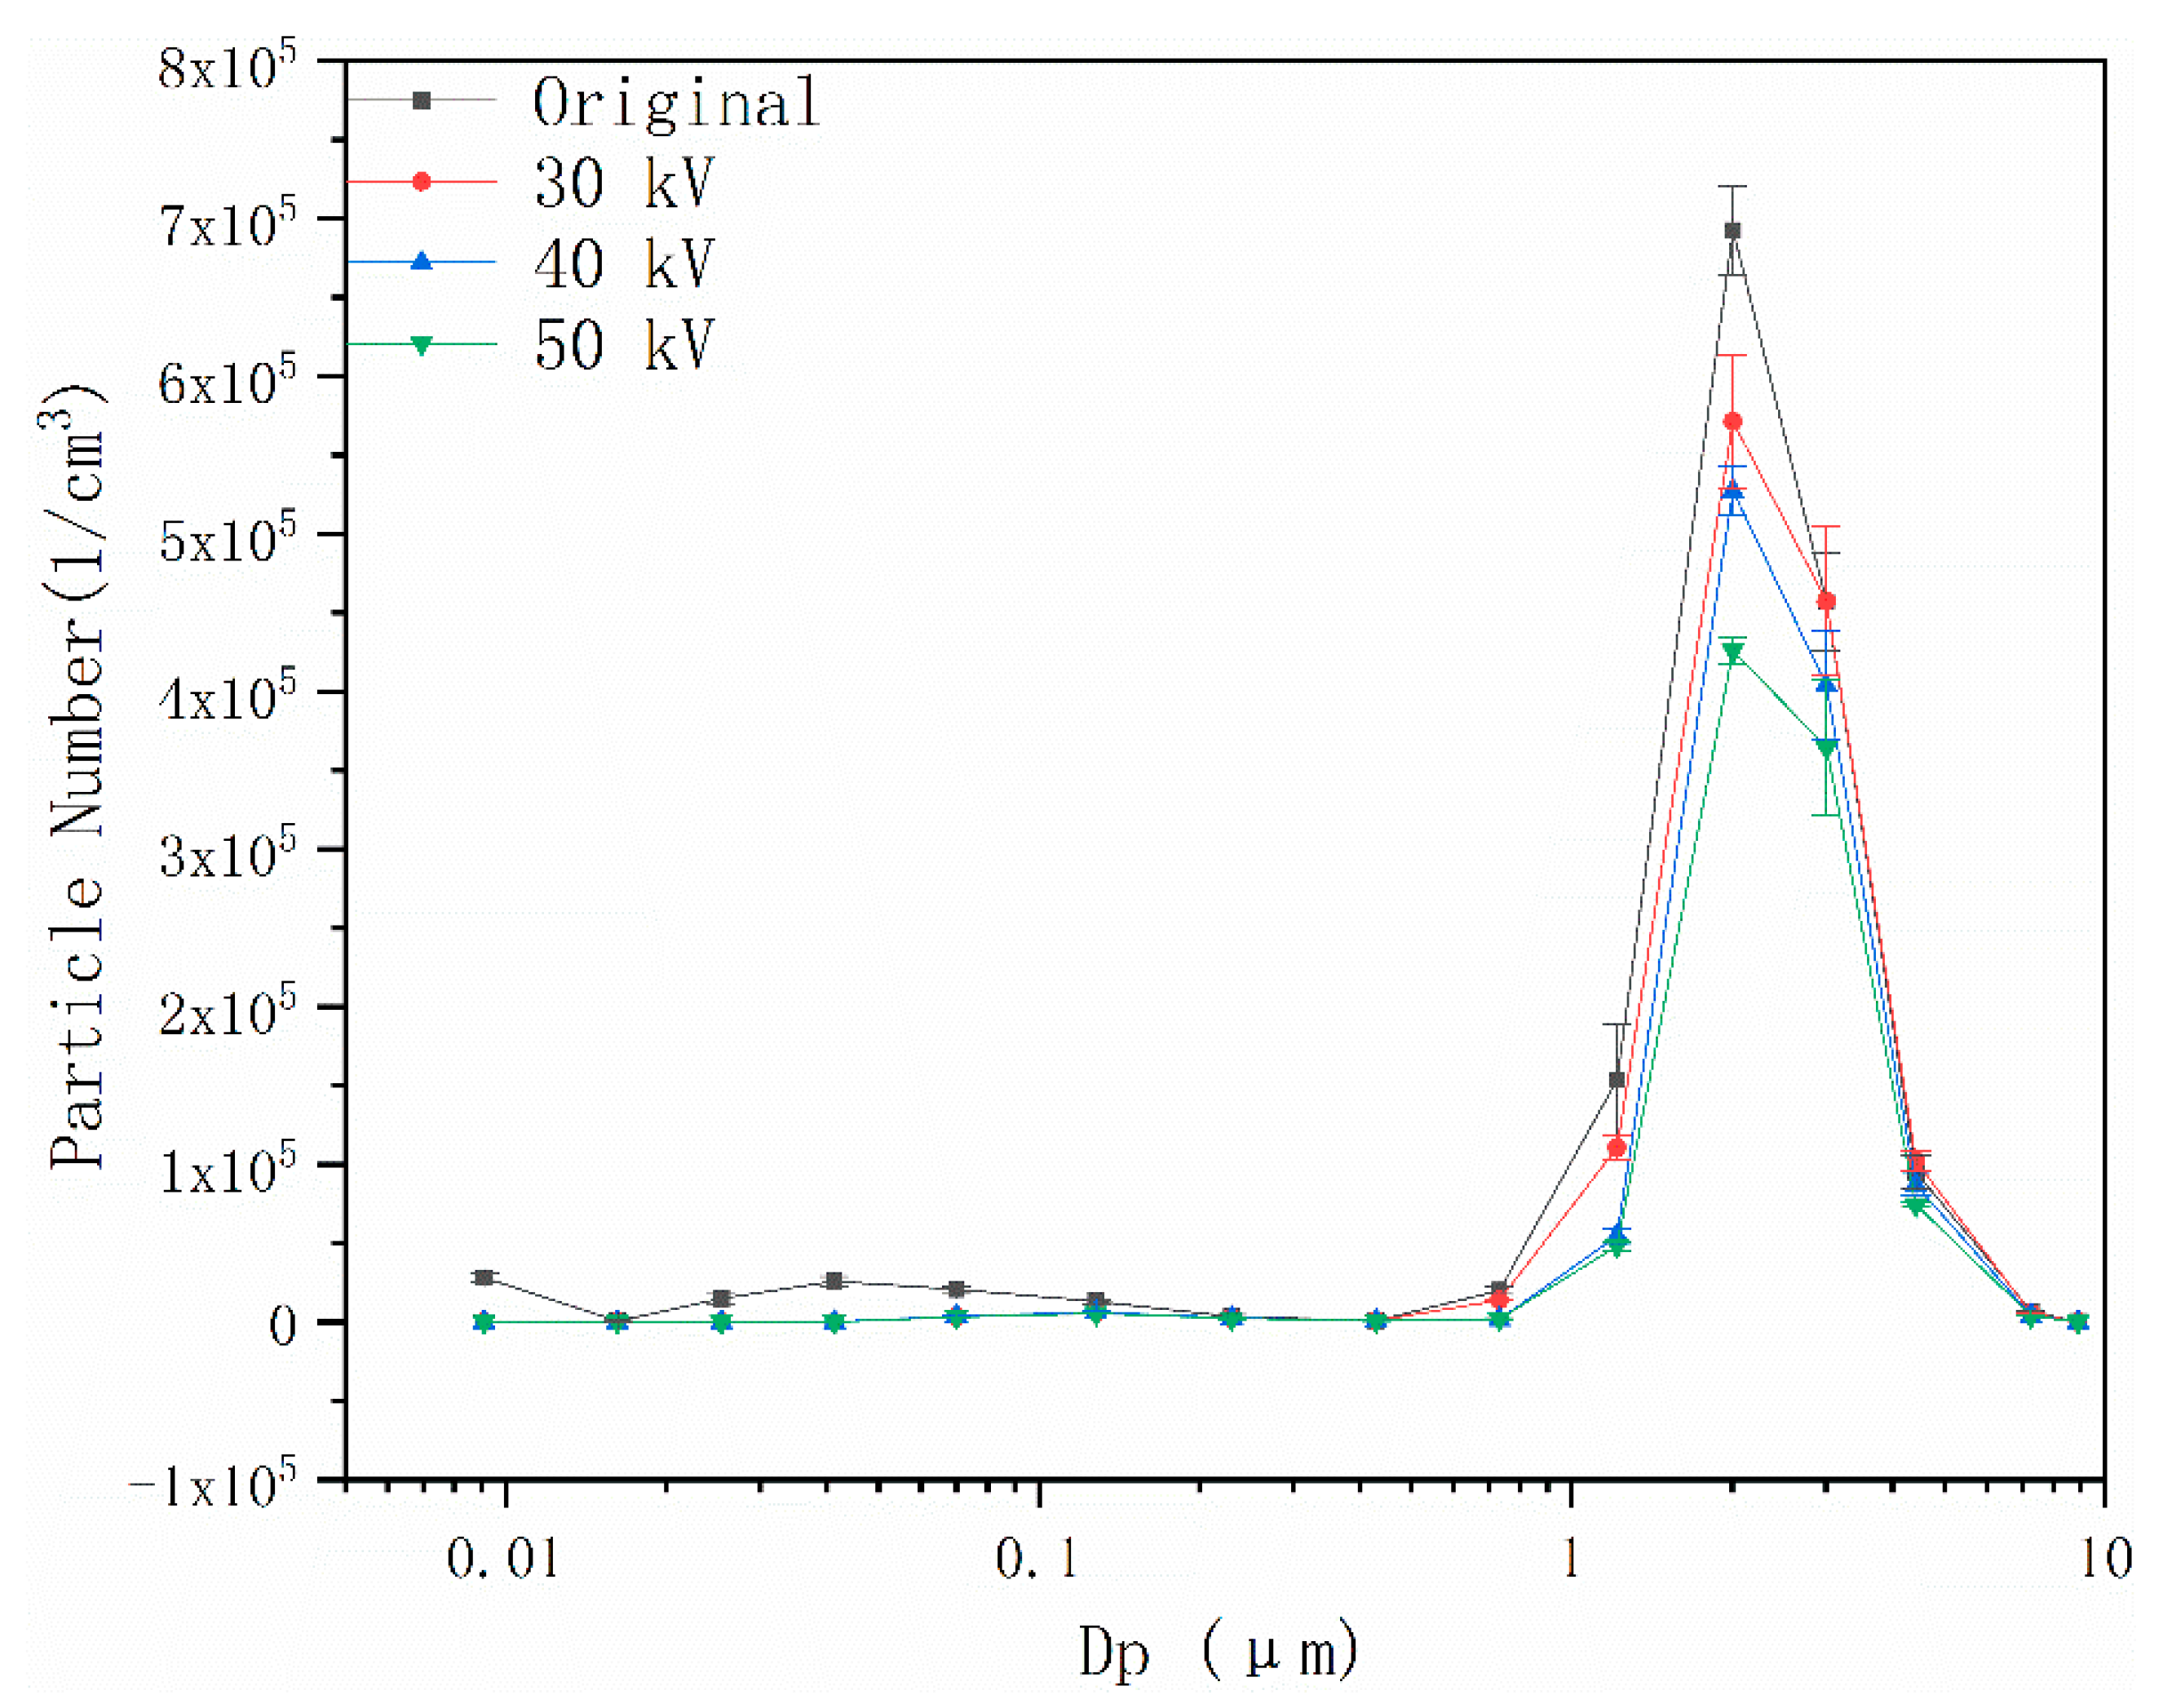
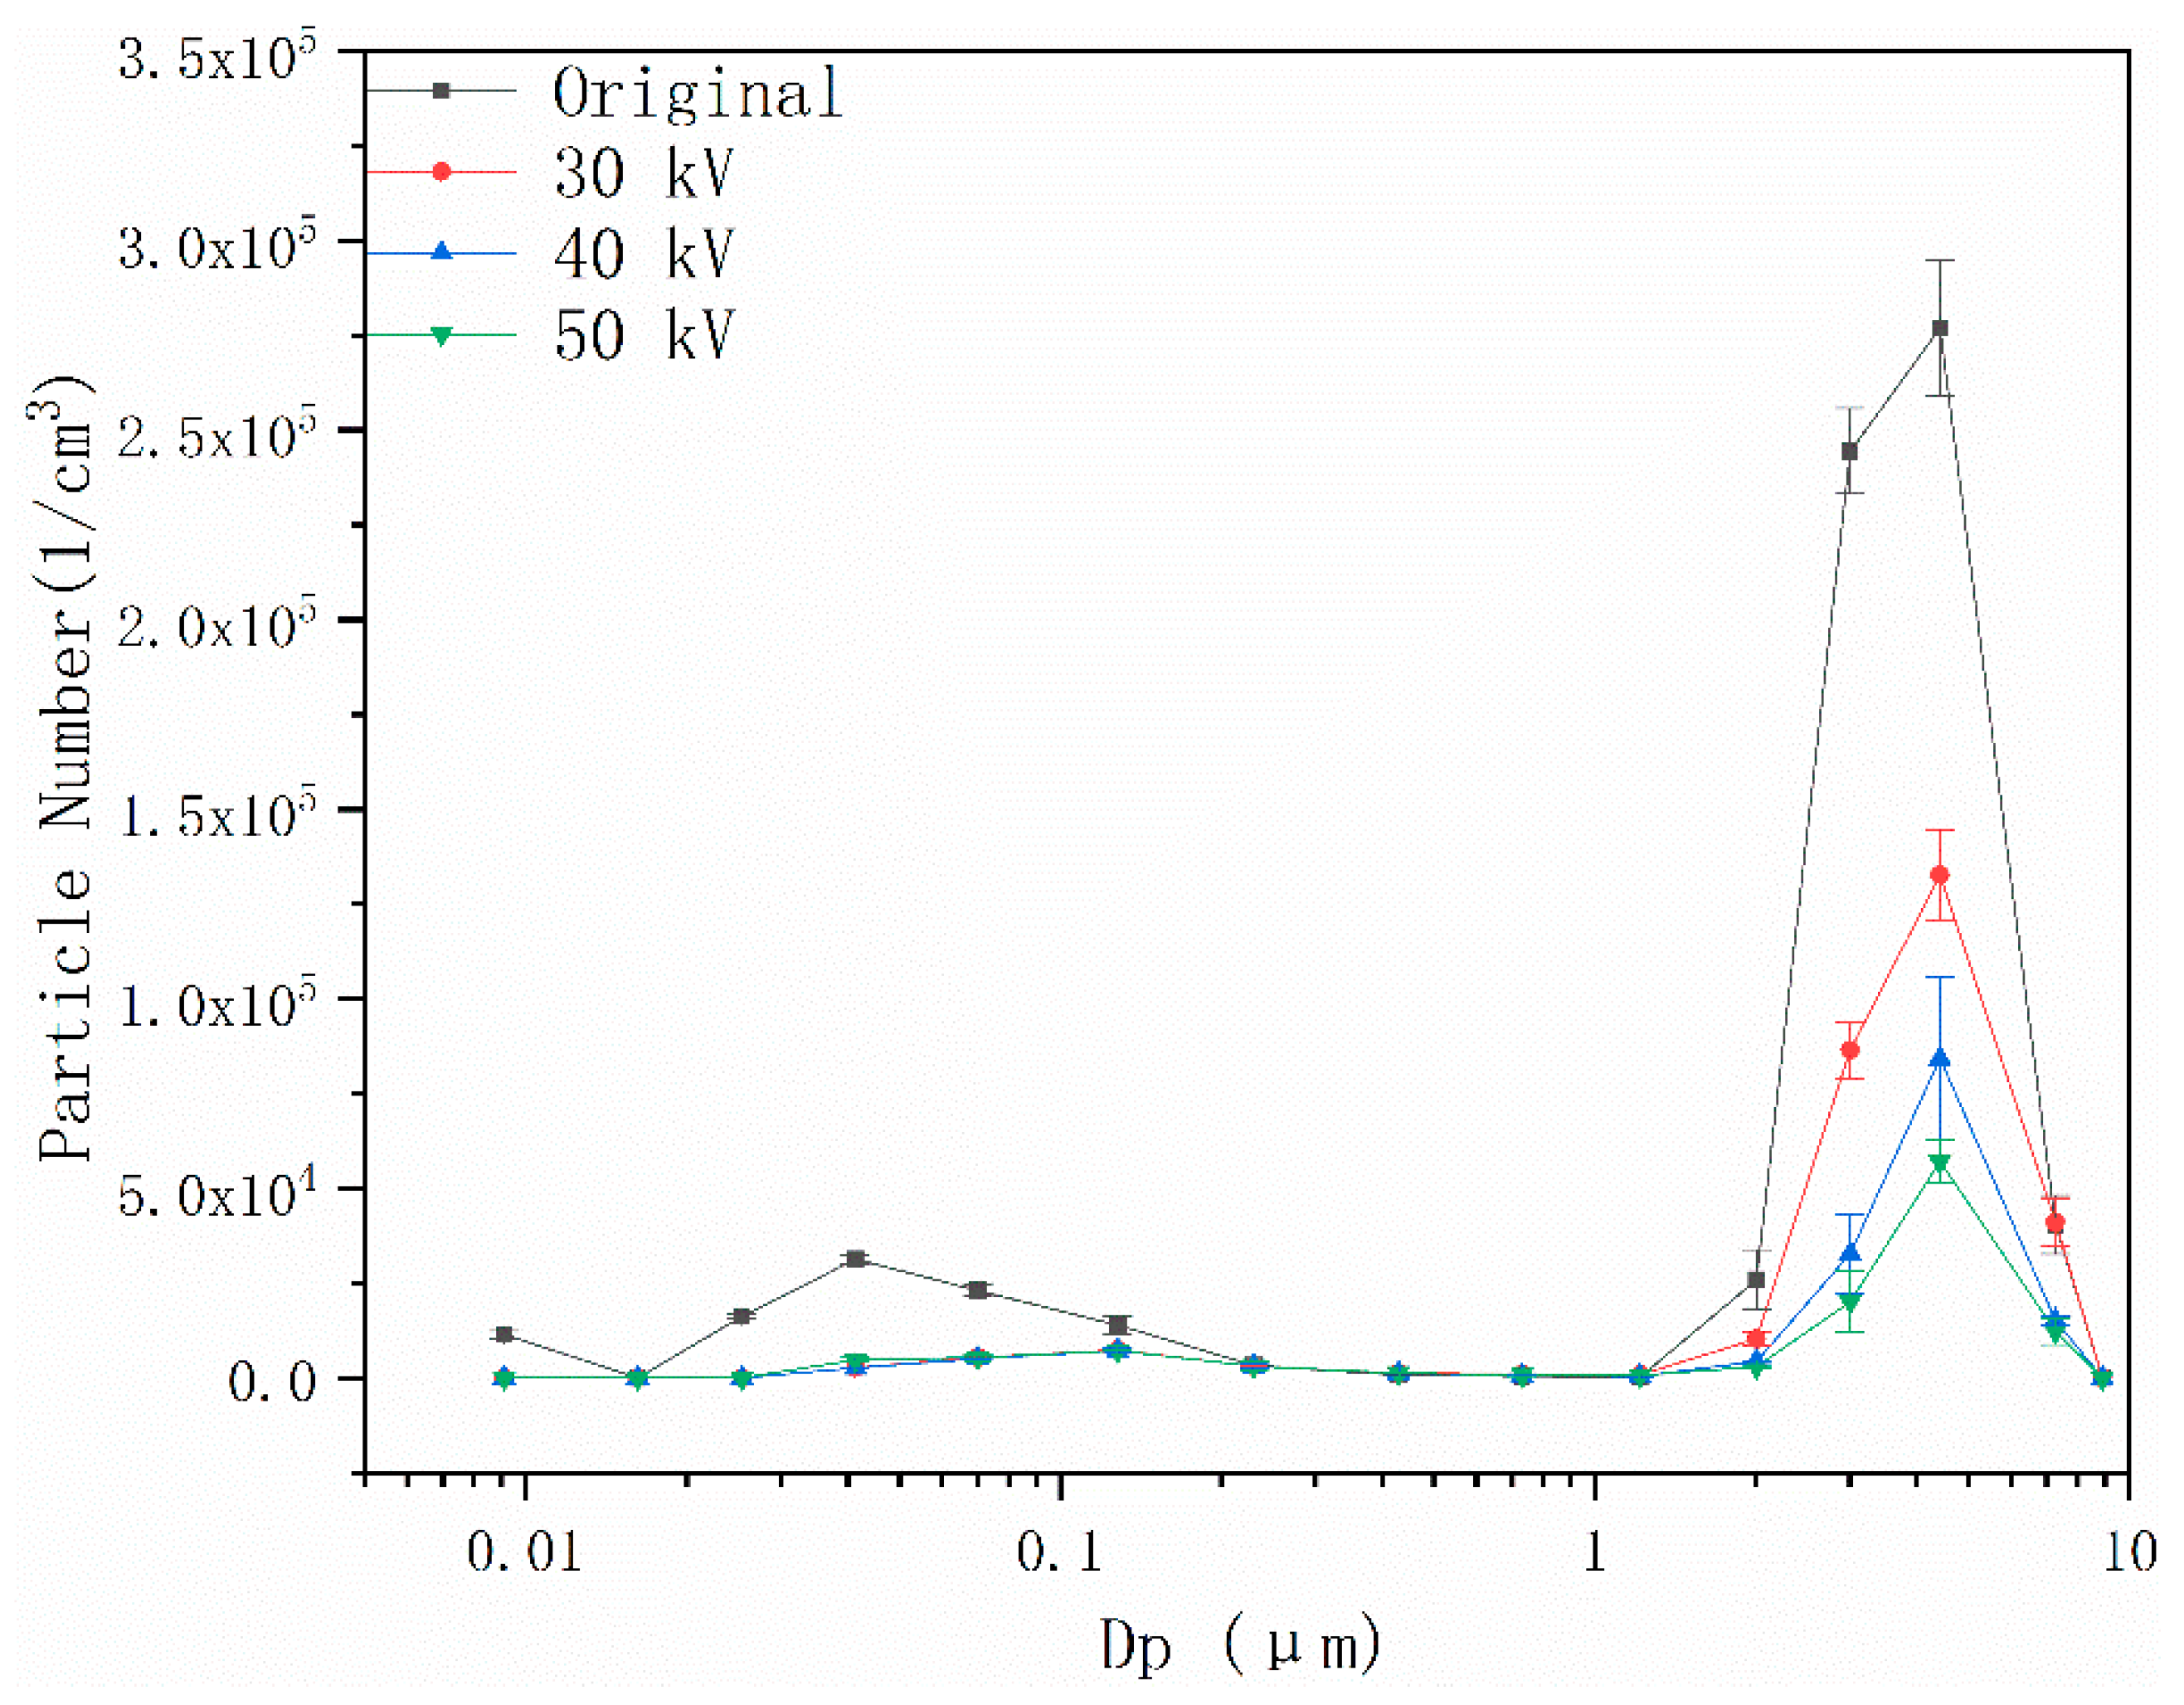
4.2. Effects of Pulsed Corona Discharge Field on Particle Number Concentration

The discharge characteristic is an important criterion to measure the discharge energy of different pulsed power supplies, and the pulse energy directly affects the concentration of electrons and ions in the reactor. The monopulse energy calculation formula is as follows:
E s = V ( t ) I ( t ) d t .
The total energy injected into the reactor per unit time can be obtained by multiplying the pulse frequency with the monopulse energy,
E t = E s f i ,
where V(t) and I(t) are the instantaneous pulse voltage and pulse current recorded by the oscilloscope respectively, and fi is the pulse frequency.
The monopulse energy and the total pulse energy of the pulse corona discharge under different pulse voltages and pulse frequencies are shown in Figure 11. When the input pulse voltage increased, both the monopulse energy and the total pulse energy increased, indicating that the ion and electron concentration in the reactor increased. When the pulse frequency was adjusted to 100 Hz and the input pulse voltage was 20 kV, the monopulse energy and the total pulse energy per unit time were only 28.4 mJ and 2.8 J, while they were as high as 193.6 mJ and 19.4 J when the input pulse voltage was 50 kV. In addition, it can be clearly observed from the figure that the monopulse energy decreased with the increase in pulse frequency, while the total pulse energy increased with the increase in pulse frequency. When the pulse voltage was 50 kV and the pulse frequency was 300 Hz, the corresponding monopulse energy was 165.9 mJ, which was lower than that at 100 Hz, while the total pulse energy was 49.8 J, which was much higher than the 19.4 J corresponding to 100 Hz. In this agglomeration experiment, the selected input voltages were 30, 40, and 50 kV, while 300 Hz was selected as the pulse frequency.
Figure 12 shows that when 0.5-μm particles were generated, the pulsed corona discharge effect on the PNC was not evident; when voltage input was increased, the PNC gradually decreased. The increase in the pulse input voltage improved the input energy, which charged the particles. This facilitated the aggregation of particles into larger ones because of the Coulomb force. There are two mechanisms in the process of particle charging: field charge (by high-energy free electrons) and diffusion charge (by positive ions) in the pulsed electric field. Particles larger than 0.2 μm are dominated by field charge, and they become more charged with increasing size, while particles smaller than 0.2 μm are dominated by diffusion charge and they become more charged with decreasing size [22]. Particles with critical size are hard to charge and 0.5 μm is near the critical size; thus, the charge effect is relatively weak, which reduces particle collision. The probability of particle collision is also decreased.
Figure 13 indicates the change in the number concentration of the 2-μm particles in the pulsed corona discharge field. Compared with the 0.5-μm particles, the reduction ratio of 2-μm PNC was more significant with the increase in input voltage. When the input voltage was 50 kV, the reduction ratio reached 38.5%. This also proved that the 2-μm particles were more easily charged. Under the same parameters, the migration velocity of particles to the plate significantly increases, particle collisions become increasingly frequent, and the particle agglomeration efficiency similarly increases because of the presence of Coulomb coagulation.
As demonstrated in Figure 14, when the particle diameter was adjusted to 4 μm, the input voltages (30, 40, and 50 kV) could contribute to particle reduction with reduction ratios of 52%, 69.5%, and 79.4%, respectively. The latter was more evident and considerably larger than that of the 0.5- and 2-μm particles, whose reduction ratios were 22.6% and 38.5%, respectively, when the input voltage was 50 kV. This shows that, with the increase in particle size, the pulsed corona discharge field could significantly reduce the PNC and improve energy input. The foregoing differs from the effect of direct current, in which the pulsed electric field mainly increases both the charge of fine particles and the probability of these particles to be charged.

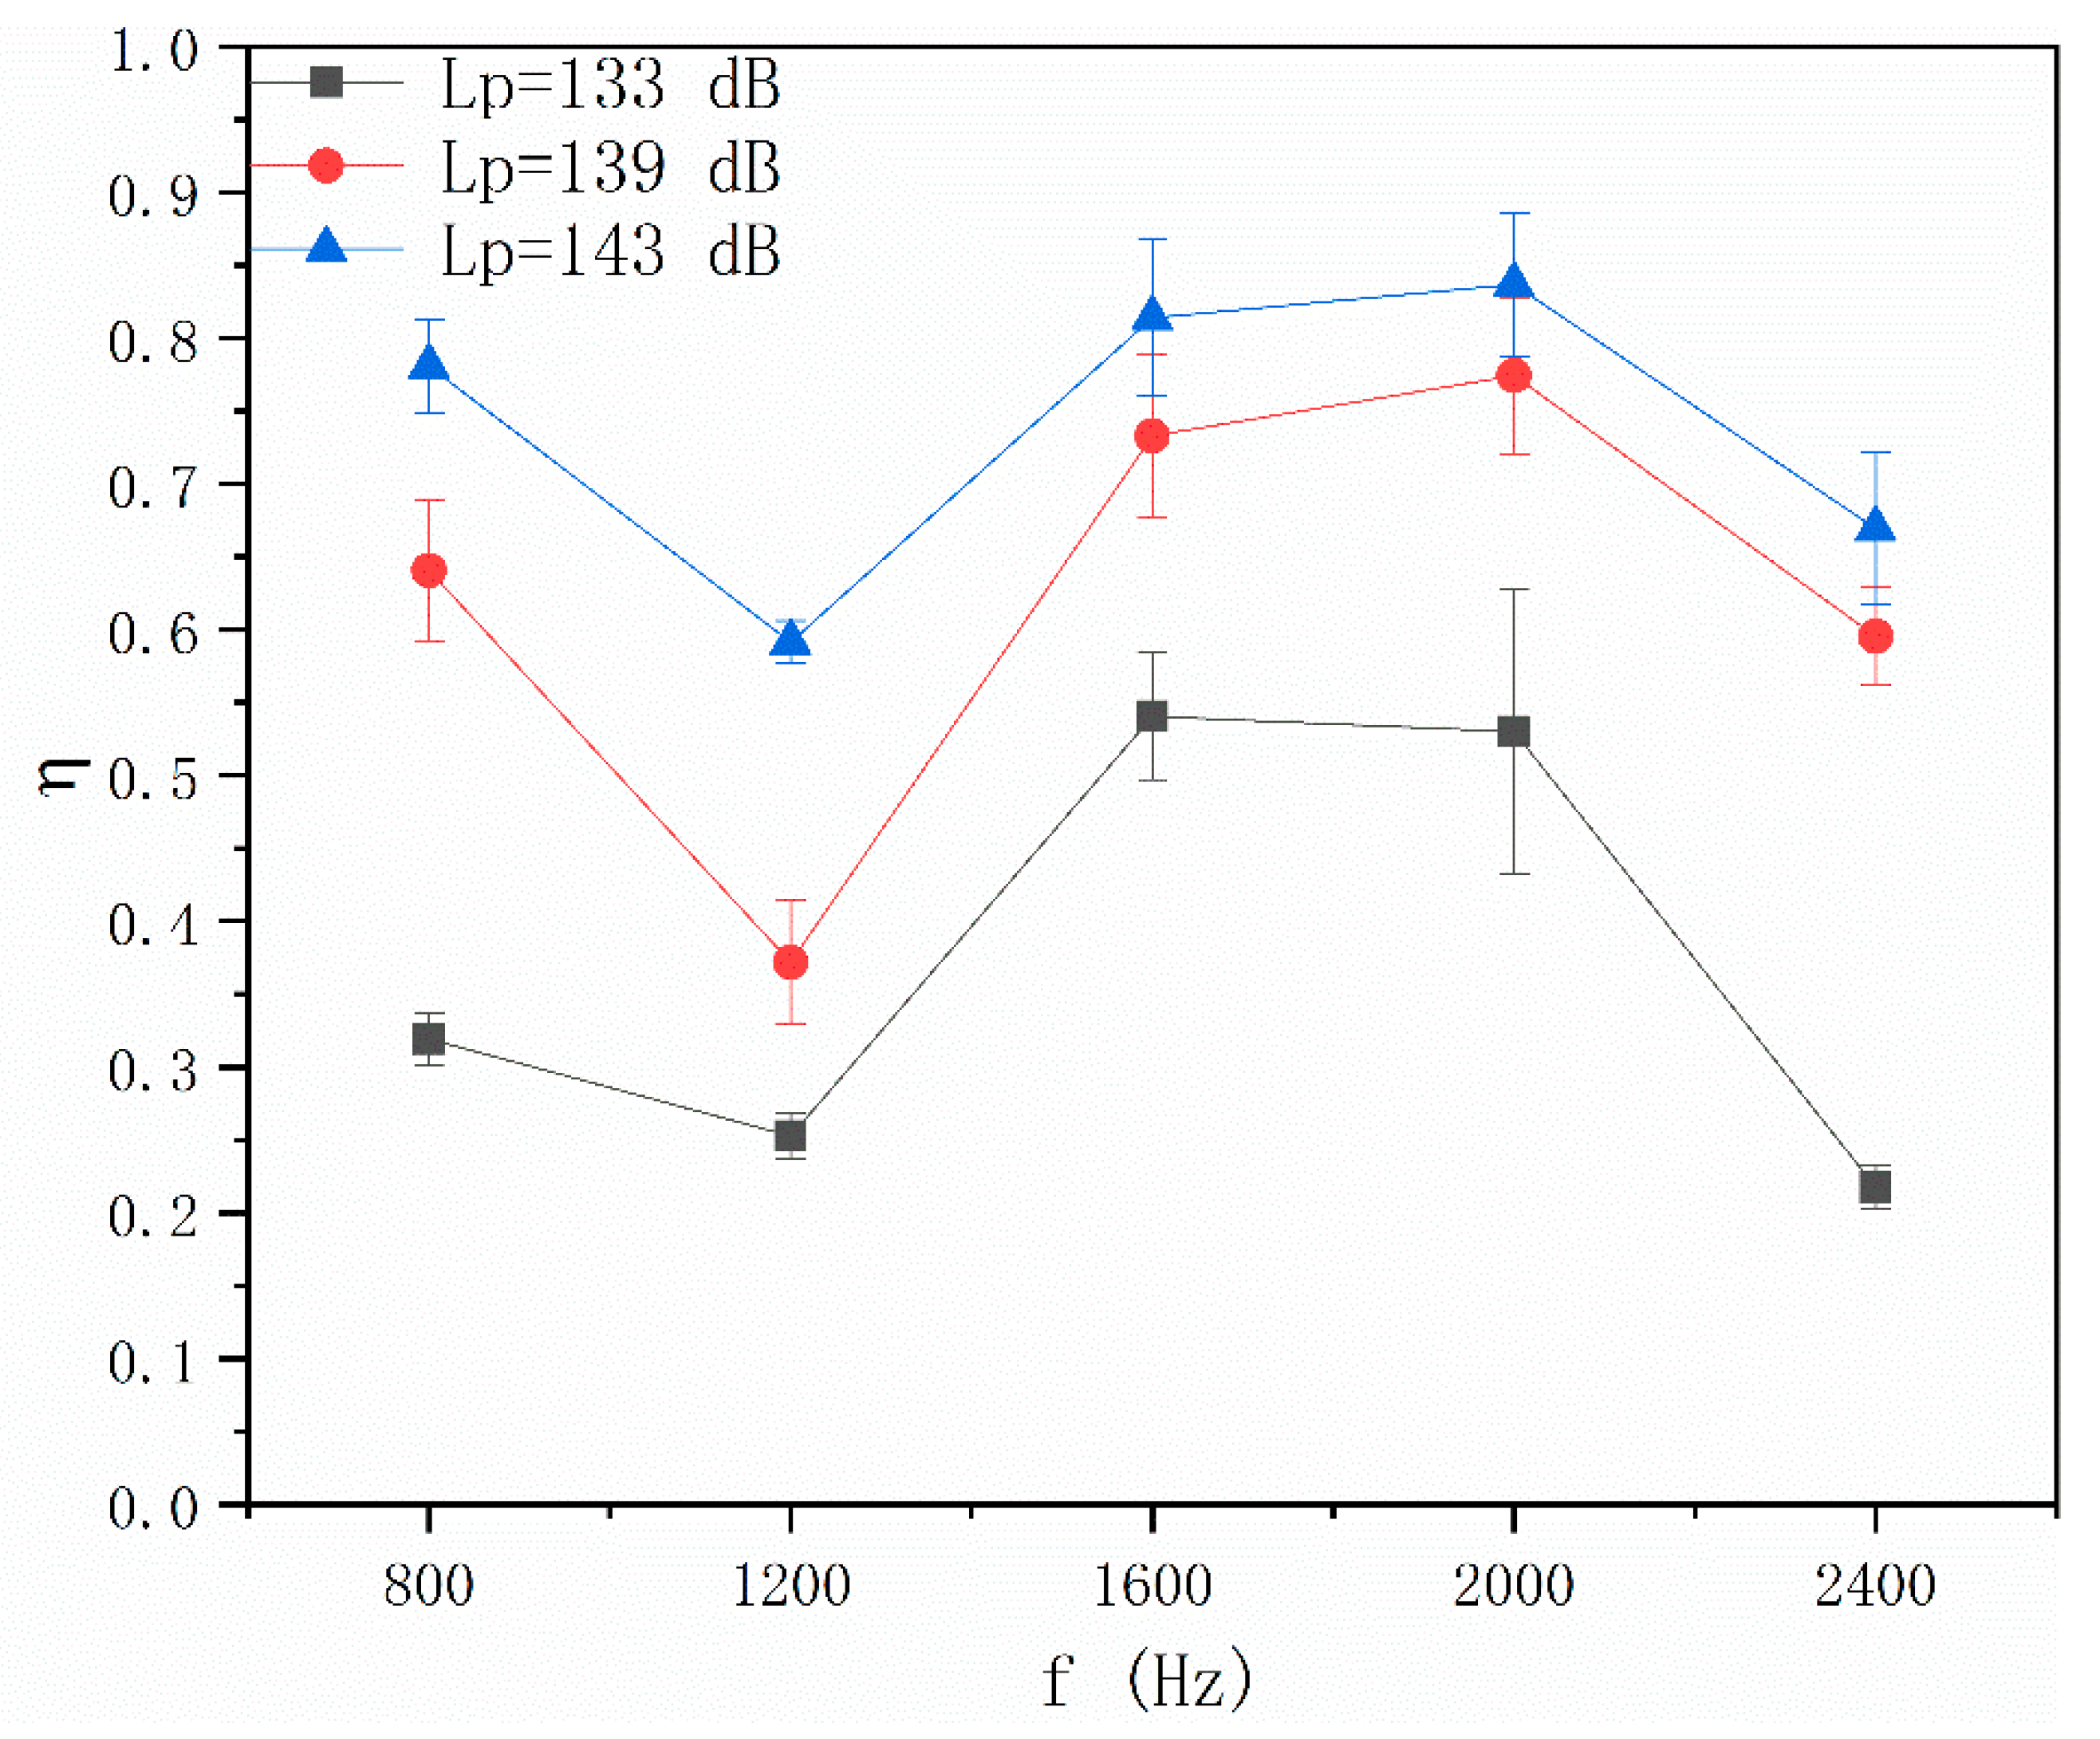
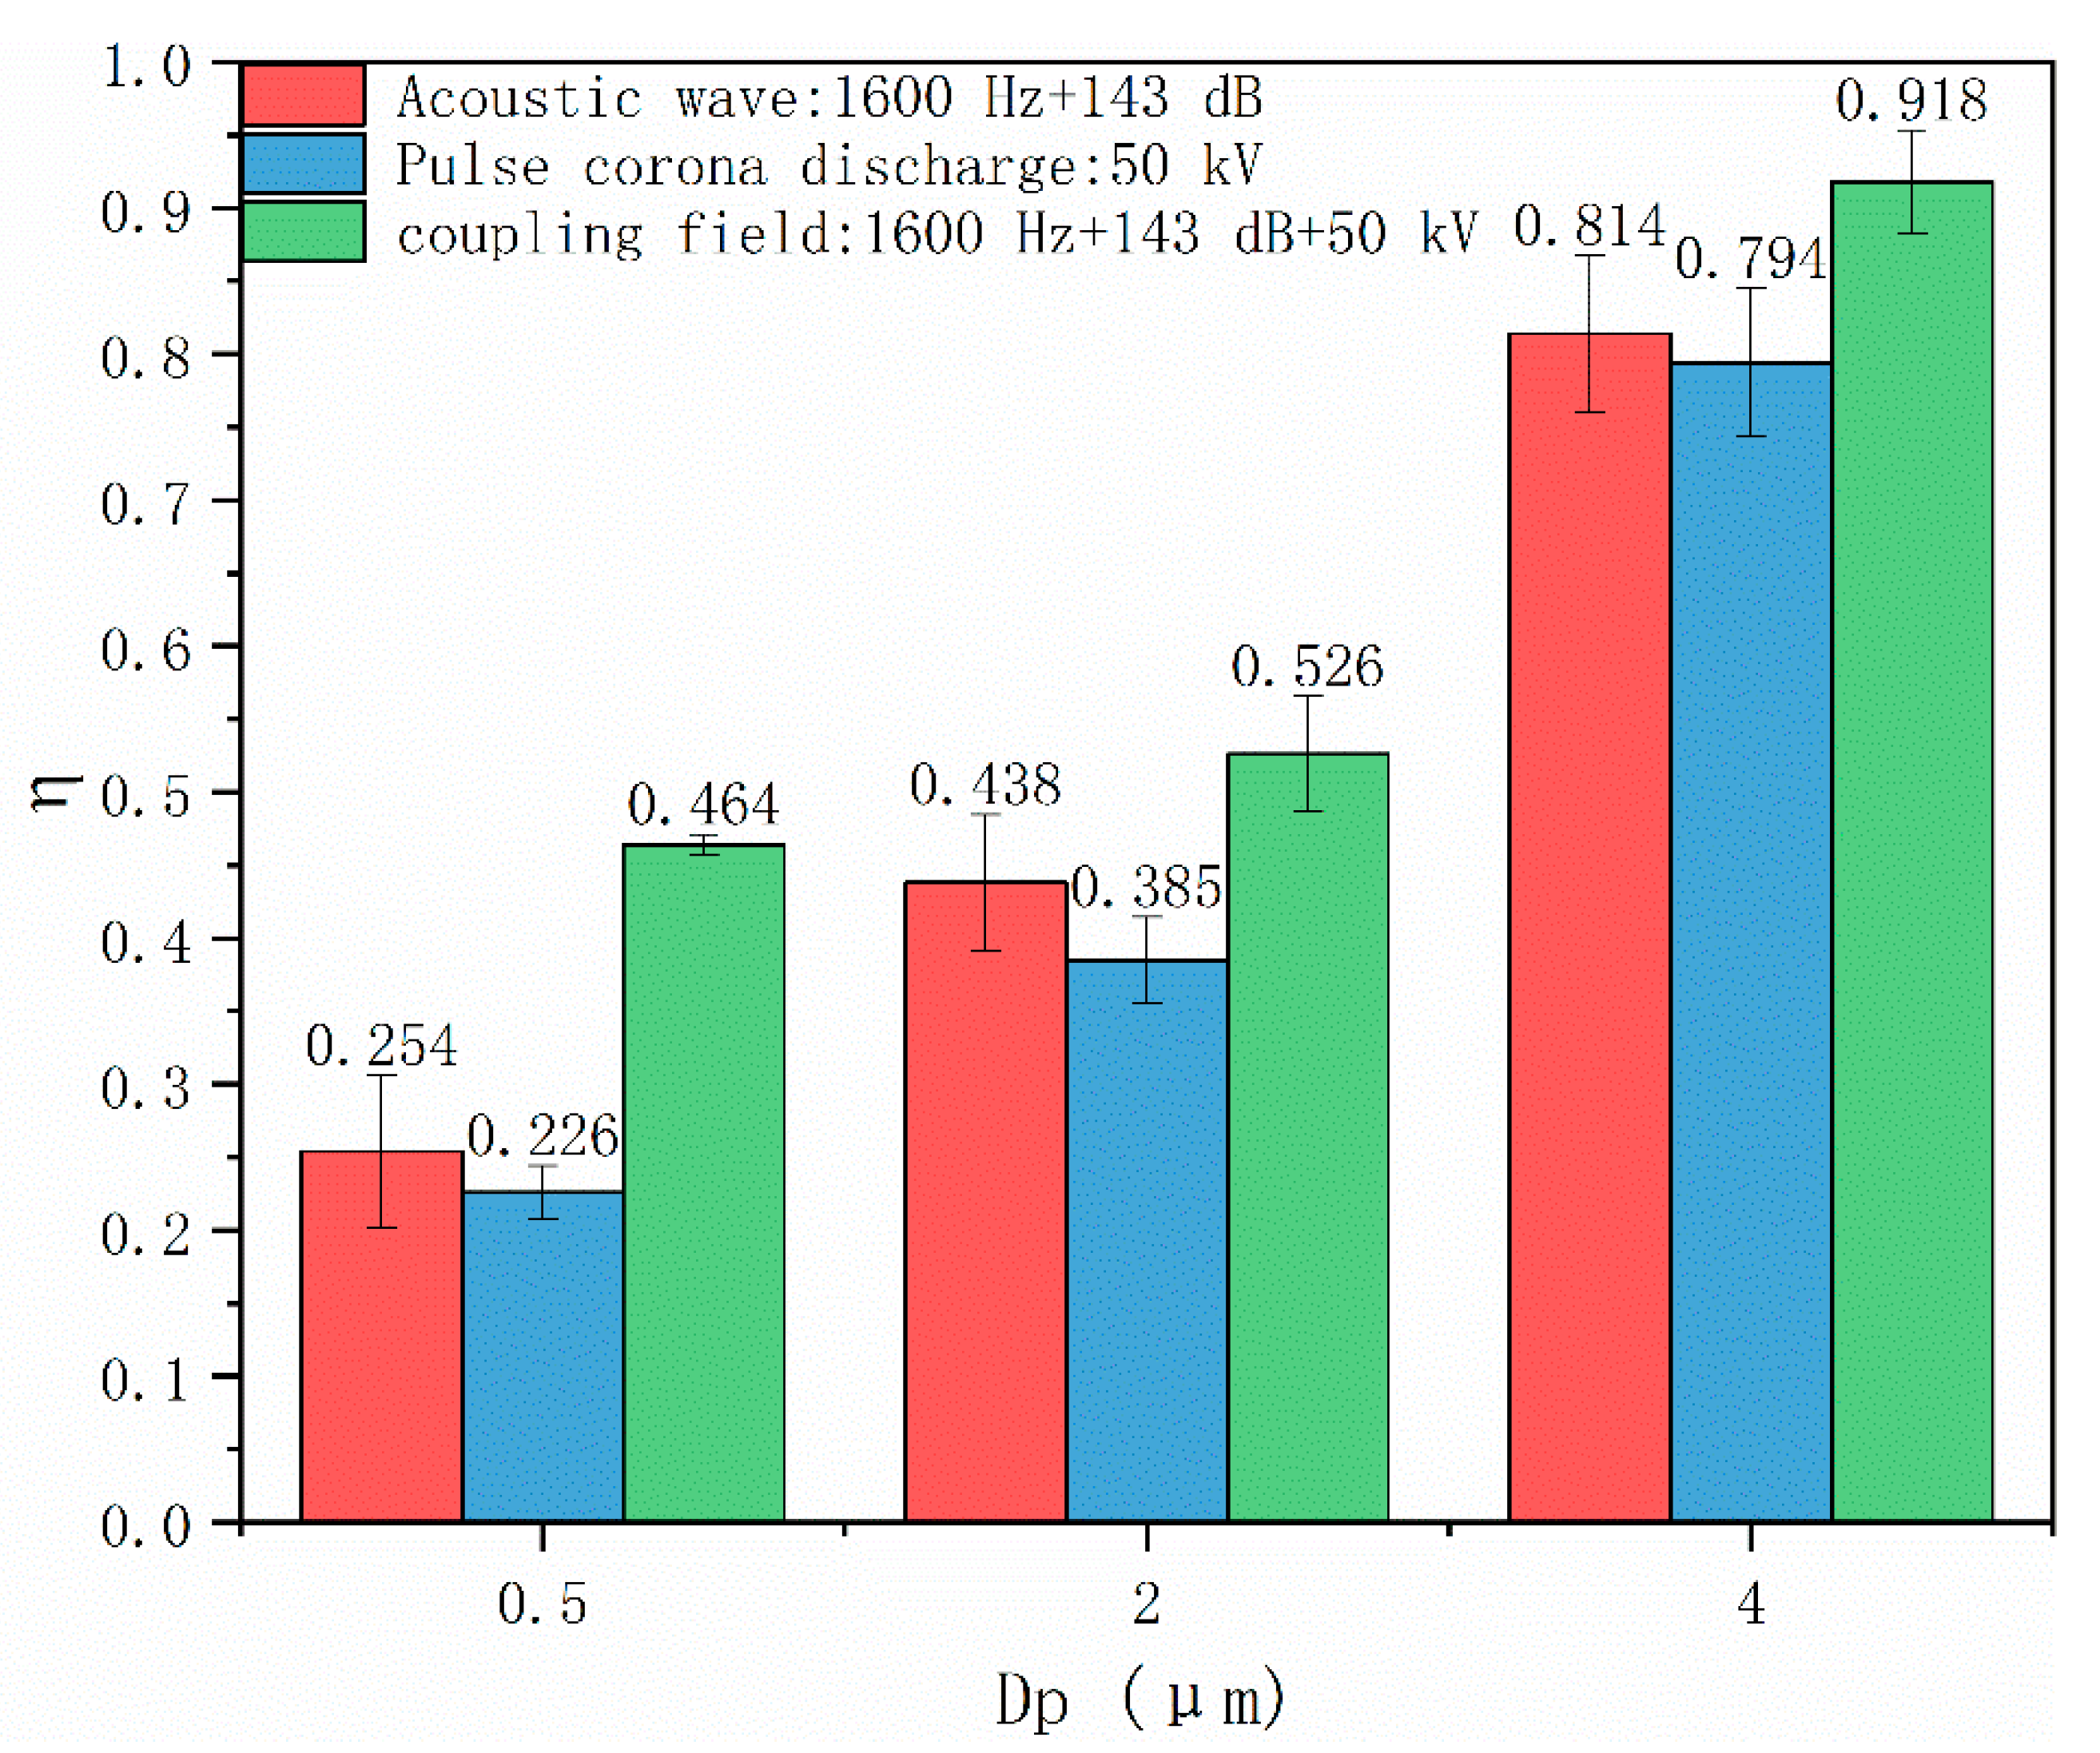
4.3. Effects of Coupling Field on Particle Number Concentration

In order to verify whether the acoustic wave and pulsed corona discharge coupling field can effectively further increase the reduction ratio of particles with three sizes, the selected acoustic wave parameters were 143 dB and 1600 Hz, and the selected pulse input voltage was 50 kV. The effect of the coupling and single fields on the PNC is demonstrated in Figure 15.
As demonstrated in Figure 15, the particle number concentration reduction ratios of three sizes in the single and coupling fields were significantly different. Under the three conditions, the reduction ratio in the coupling field was greater than that in the acoustic wave field, which was also greater than the reduction ratio in the pulsed corona discharge field. When the particle size was adjusted to 0.5 μm, the effect of the coupling field was considerably better than that of the two single fields. The corresponding reduction ratio of particles could reach 0.464, which was more than twice that in the pulsed corona discharge field (i.e., 0.226). As mentioned above, the 0.5-μm particles are in the critical region of field charge and diffusion charge, and they are the most difficult to remove using traditional ESPs. This shows that the effect of coupling field on the reduction of the PNC in small-sized segments was remarkable. With the increase in particle size, the reduction effect of the three types of external fields on particles increased. In particular, when the particle size was 4 μm, the reduction ratio in the coupling field could reach 0.918. Since, in this study, only agglomeration effect was considered and there was no collection effect, the agglomeration efficiency was still higher than the 90% of Xu [22] and 75.3% of Liu [23]. The reduction ratios in the acoustic wave field and pulsed corona discharge field could reach 0.814 and 0.794, respectively. The differences among the reduction ratios of these fields were smaller than those when the particle size was adjusted to 0.5 μm. The effect of the three external fields on the 2-μm particles was similar to their effect on the two other sizes. The reduction ratios were 0.526 (coupling field), 0.438 (acoustic wave field), and 0.385 (pulsed corona discharge field). The results also definitely indicate that, with the increase in particle size, the particles had a greater tendency to agglomerate, and the coupling field facilitated submicron particle agglomeration and reduction. Owing to the limit of the experimental set-up, the evaporation of DEHs in the monodisperse aerosol generator was constant, and the larger particles had lower number concentration. Some scholars [28,29] found that a higher number concentration of particles led to a better agglomeration effect, but the number concentration must be less than 4.1 × 106 cm−3. Firstly, particles with larger concentration are more likely to be broken up by acoustic waves; secondly, since the charge concentration generated by corona discharge remains unchanged, the charge of each fine particle decreases correspondingly. In this experimental study, the number concentration of particles was less than 4.1 × 106 cm−3. We choose the N/N0 values to compare the results in order to reduce the influence of original number concentration. According to the results, as the particles with lowest number concentration, the agglomeration effect on 2-μm particles was better than that on the two other sizes. It can be seen that the influence of particle size distribution on agglomeration was far greater than the influence of number concentration. If the original number concentration of the three sizes was adjusted to be the same, the results would be more pronounced.

5. Conclusions

Comparative experimental studies were performed to determine the effects of pulsed discharge and acoustic wave coupling fields on the monodisperse aerosol particle agglomeration and reduction ratio. It was found that the coupling field clearly enhanced the agglomeration effects. For the 4-μm particles, the maximum reduction ratio (0.918) was achieved when the pulse input voltage was 50 kV, the acoustic SPL was 143 dB, and the frequency was 1600 Hz. The coupling field agglomeration effects on the 0.5-μm particles indicated that such effects were smaller on larger particle sizes. This is because the 0.5-μm particles are in the critical area of field charge and diffusion charge, and their reduction ratio (0.464) was considerably greater than 0.254 in the acoustic wave field and 0.226 in the pulsed corona discharge field. In the pulsed corona discharge field, the agglomeration efficiencies of the three particle sizes were lower than those in the acoustic wave field. With the increase in size, the particles easily charged and collided, and the agglomeration effect was better. The difference between the coupling field and single field, however, was narrow. The acoustic wave optimal value to enhance the agglomeration effect differed among the three particle sizes. Compared with the single field, the coupling field was a more effective pre-treatment for monodisperse fine particles.

Author Contributions

M.H., Z.L., and M.F. conceptualized and designed the experiments; M.H. and H.W. performed the experiments and analyzed the data; M.H. wrote the paper. All authors have read and agreed to the published version of the manuscript.

Funding

This research was funded by the National Basic Research Program (973) of China (No. 2013CB228504).

Conflicts of Interest

The authors declare no conflicts of interest.

References

  1. Liu, J.; Wenchang, H.; Minghua, L.; Yong, L.; Shitang, H. A Novel Particulate Matter 2.5 Sensor Based on Surface Acoustic Wave Technology. Appl. Sci. 2018, 8, 82. [Google Scholar] [CrossRef] [Green Version]
  2. Yang, Z.; Ji, P.; Li, Q.; Jiang, Y.; Zheng, C.; Wang, Y.; Gao, X.; Lin, R. Comprehensive understanding of SO3 effects on synergies among air pollution control devices in ultra-low emission power plants burning high-sulfur coal. J. Clean. Prod. 2019, 239, 118096. [Google Scholar] [CrossRef]
  3. Ji, D.; Li, L.; Wang, Y.; Zhang, J.; Cheng, M.; Sun, Y.; Liu, Z.; Wang, L.; Tang, G.; Hu, B. The heaviest particulate air-pollution episodes occurred in northern China in January, 2013: Insights gained from observation. Atmos. Environ. 2014, 92, 546–556. [Google Scholar] [CrossRef]
  4. Jiang, N.; Liu, X.; Wang, S.; Yu, X.; Yin, S.; Duan, S.; Wang, S.; Zhang, R.; Li, S. Pollution characterization, source identification, and health risks of atmospheric-particle-bound heavy metals in PM10 and PM2. 5 at multiple sites in an emerging megacity in the central region of China. Aerosol Air Qual. Res. 2019, 19, 247–271. [Google Scholar] [CrossRef] [Green Version]
  5. Błaszczak, B.; Widziewicz-Rzońca, K.; Zioła, N.; Klejnowski, K.; Juda-Rezler, K. Chemical Characteristics of Fine Particulate Matter in Poland in Relation with Data from Selected Rural and Urban Background Stations in Europe. Appl. Sci. 2019, 9, 98. [Google Scholar] [CrossRef] [Green Version]
  6. Haikerwal, A.; Akram, M.; Sim, M.R.; Meyer, M.; Abramson, M.J.; Dennekamp, M. Fine particulate matter (PM2.5) exposure during a prolonged wildfire period and emergency department visits for asthma. Respirology 2016, 21, 88–94. [Google Scholar] [CrossRef] [PubMed]
  7. Wang, W.; Shao, L.; Li, J.; Chang, L.; Zhang, D.; Zhang, C.; Jiang, J. Characteristics of Individual Particles Emitted from an Experimental Burning Chamber with Coal from the Lung Cancer Area of Xuanwei, China. Aerosol Air Qual. Res. 2019, 19, 355–363. [Google Scholar] [CrossRef]
  8. Jin, X.; Yang, N.; Wang, X.; Bai, Y.; Su, T.; Kong, J. Integrated predictor based on decomposition mechanism for PM2.5 long-term prediction. Appl. Sci. 2019, 9, 4533. [Google Scholar] [CrossRef] [Green Version]
  9. Xing, Y.; Yue, J.; Chen, C.; Xiang, Y.; Chen, Y.; Shi, M. A Deep Belief Network Combined with Modified Grey Wolf Optimization Algorithm for PM2.5 Concentration Prediction. Appl. Sci. 2019, 9, 3765. [Google Scholar] [CrossRef] [Green Version]
  10. Le, T.-C.; Lin, G.-Y.; Tsai, C.-J. The predictive method for the submicron and nano-sized particle collection efficiency of multipoint-to-plane electrostatic precipitators. Aerosol Air Qual. Res. 2013, 13, 1404–1410. [Google Scholar] [CrossRef] [Green Version]
  11. Wu, H.; Pan, D.; Hong, G.; Jiang, Y.; Yang, L.; Yang, B.; Peng, Z. Removal of sulfuric acid aerosols in desulfurized flue gas by adding moist air. J. Chem. Technol. Biotechnol. 2017, 92, 1026–1034. [Google Scholar] [CrossRef]
  12. Lu, M.; Fang, M.; He, M.; Liu, S.; Luo, Z. Insights into agglomeration and separation of fly-ash particles in a sound wave field. RSC Adv. 2019, 9, 5224–5233. [Google Scholar] [CrossRef] [Green Version]
  13. Heidenreich, S.; Ebert, F. Condensational droplet growth as a preconditioning technique for the separation of submicron particles from gases. Chem. Eng. Process. 1995, 34, 235–244. [Google Scholar] [CrossRef]
  14. Hoffmann, T.L. Environmental implications of acoustic aerosol agglomeration. Ultrasonics 2000, 38, 353–357. [Google Scholar] [CrossRef]
  15. Zhou, D.; Luo, Z.; Jiang, J.; Chen, H.; Lu, M.; Fang, M. Experimental study on improving the efficiency of dust removers by using acoustic agglomeration as pretreatment. Powder Technol. 2016, 289, 52–59. [Google Scholar] [CrossRef]
  16. Matsoukas, T. The coagulation rate of charged aerosols in ionized gases. J. Colloid Interface Sci. 1997, 187, 474–483. [Google Scholar] [CrossRef]
  17. Liu, J.; Zhang, G.; Zhou, J.; Wang, J.; Zhao, W.; Cen, K. Experimental study of acoustic agglomeration of coal-fired fly ash particles at low frequencies. Powder Technol. 2009, 193, 20–25. [Google Scholar] [CrossRef]
  18. Chen, C.-C.; Tao, C.-J.; Cheng, H.-C. Condensation of supersaturated water vapor on charged/neutral nanoparticles of glucose and monosodium glutamate. J. Colloid Interface Sci. 2002, 255, 158–170. [Google Scholar] [CrossRef]
  19. González, I.A.; Hoffmann, T.L.; Gallego, J.A. Precise measurements of particle entrainment in a standing-wave acoustic field between 20 and 3500 Hz. J. Aerosol Sci. 2000, 31, 1461–1468. [Google Scholar] [CrossRef]
  20. De Sarabia, E.R.-F.; Elvira-Segura, L.; Gonzalez-Gomez, I.; Rodrıguez-Maroto, J.; Munoz-Bueno, R.; Dorronsoro-Areal, J. Investigation of the influence of humidity on the ultrasonic agglomeration of submicron particles in diesel exhausts. Ultrasonics 2003, 41, 277–281. [Google Scholar] [CrossRef]
  21. Wang, J.; Liu, J.; Zhang, G.; Zhou, J.; Cen, K. Orthogonal design process optimization and single factor analysis for bimodal acoustic agglomeration. Powder Technol. 2011, 210, 315–322. [Google Scholar] [CrossRef]
  22. Xu, F.; Luo, Z.; Bo, W.; Zhao, L.; Gao, X.; Fang, M.; Cen, K. Experimental investigation on charging characteristics and penetration efficiency of PM2. 5 emitted from coal combustion enhanced by positive corona pulsed ESP. J. Electrostat. 2009, 67, 799–806. [Google Scholar] [CrossRef]
  23. Liu, J.; Wang, J.; Zhang, G.; Zhou, J.; Cen, K. Frequency comparative study of coal-fired fly ash acoustic agglomeration. J. Environ. Sci. 2011, 23, 1845–1851. [Google Scholar] [CrossRef]
  24. Fan, F.; Yang, X.; Kim, C.N. Direct simulation of inhalable particle motion and collision in a standing wave field. J. Mech. Sci. Technol. 2013, 27, 1707–1712. [Google Scholar] [CrossRef]
  25. Gallego-Juárez, J.A.; Riera-Franco De Sarabia, E.; RodrÍguez-Corral, G.; Hoffmann, T.L.; Gálvez-Moraleda, J.C.; RodrÍguez-Maroto, J.J.; Gómez-Moreno, F.J.; Bahillo-Ruiz, A.; MartÍn-Espigares, M.; Acha, M. Application of acoustic agglomeration to reduce fine particle emissions from coal combustion plants. Environ. Sci. Technol. 1999, 33, 3843–3849. [Google Scholar] [CrossRef] [Green Version]
  26. Cochet, R. Lois Charge des Fines Particules (Submicroniques) Etudes Théoriques-Controles Récents Spectre de Particules; Coll. Int. la Physique des Forces Electrostatiques et Leurs Application, Centre National de la Recherche Scientifique: Paris, France, 1961; Volume 102, pp. 331–338. [Google Scholar]
  27. Chen, H.; Wang, T.; Luo, Z.; Zhou, D.; Lu, M.; He, M.; Fang, M.; Cen, K. Agglomeration Kernel of Bipolar Charged Particles in the Presence of External Acoustic and Electric Fields. Aerosol Air Qual. Res. 2017, 17, 857–866. [Google Scholar] [CrossRef] [Green Version]
  28. Halkos, G.E. Evaluation of the Direct Cost of Sulfur Abatement under the Main Desulfurization Technologies. Energy Sources 1995, 17, 391–412. [Google Scholar] [CrossRef] [Green Version]
  29. Chen, H.; Luo, Z.; Jiang, J.; Zhou, D.; Lu, M.; Fang, M. Effects of simultaneous acoustic and electric fields on removal of fine particles emitted from coal combustion. Powder Technol. 2015, 281, 12–19. [Google Scholar] [CrossRef]
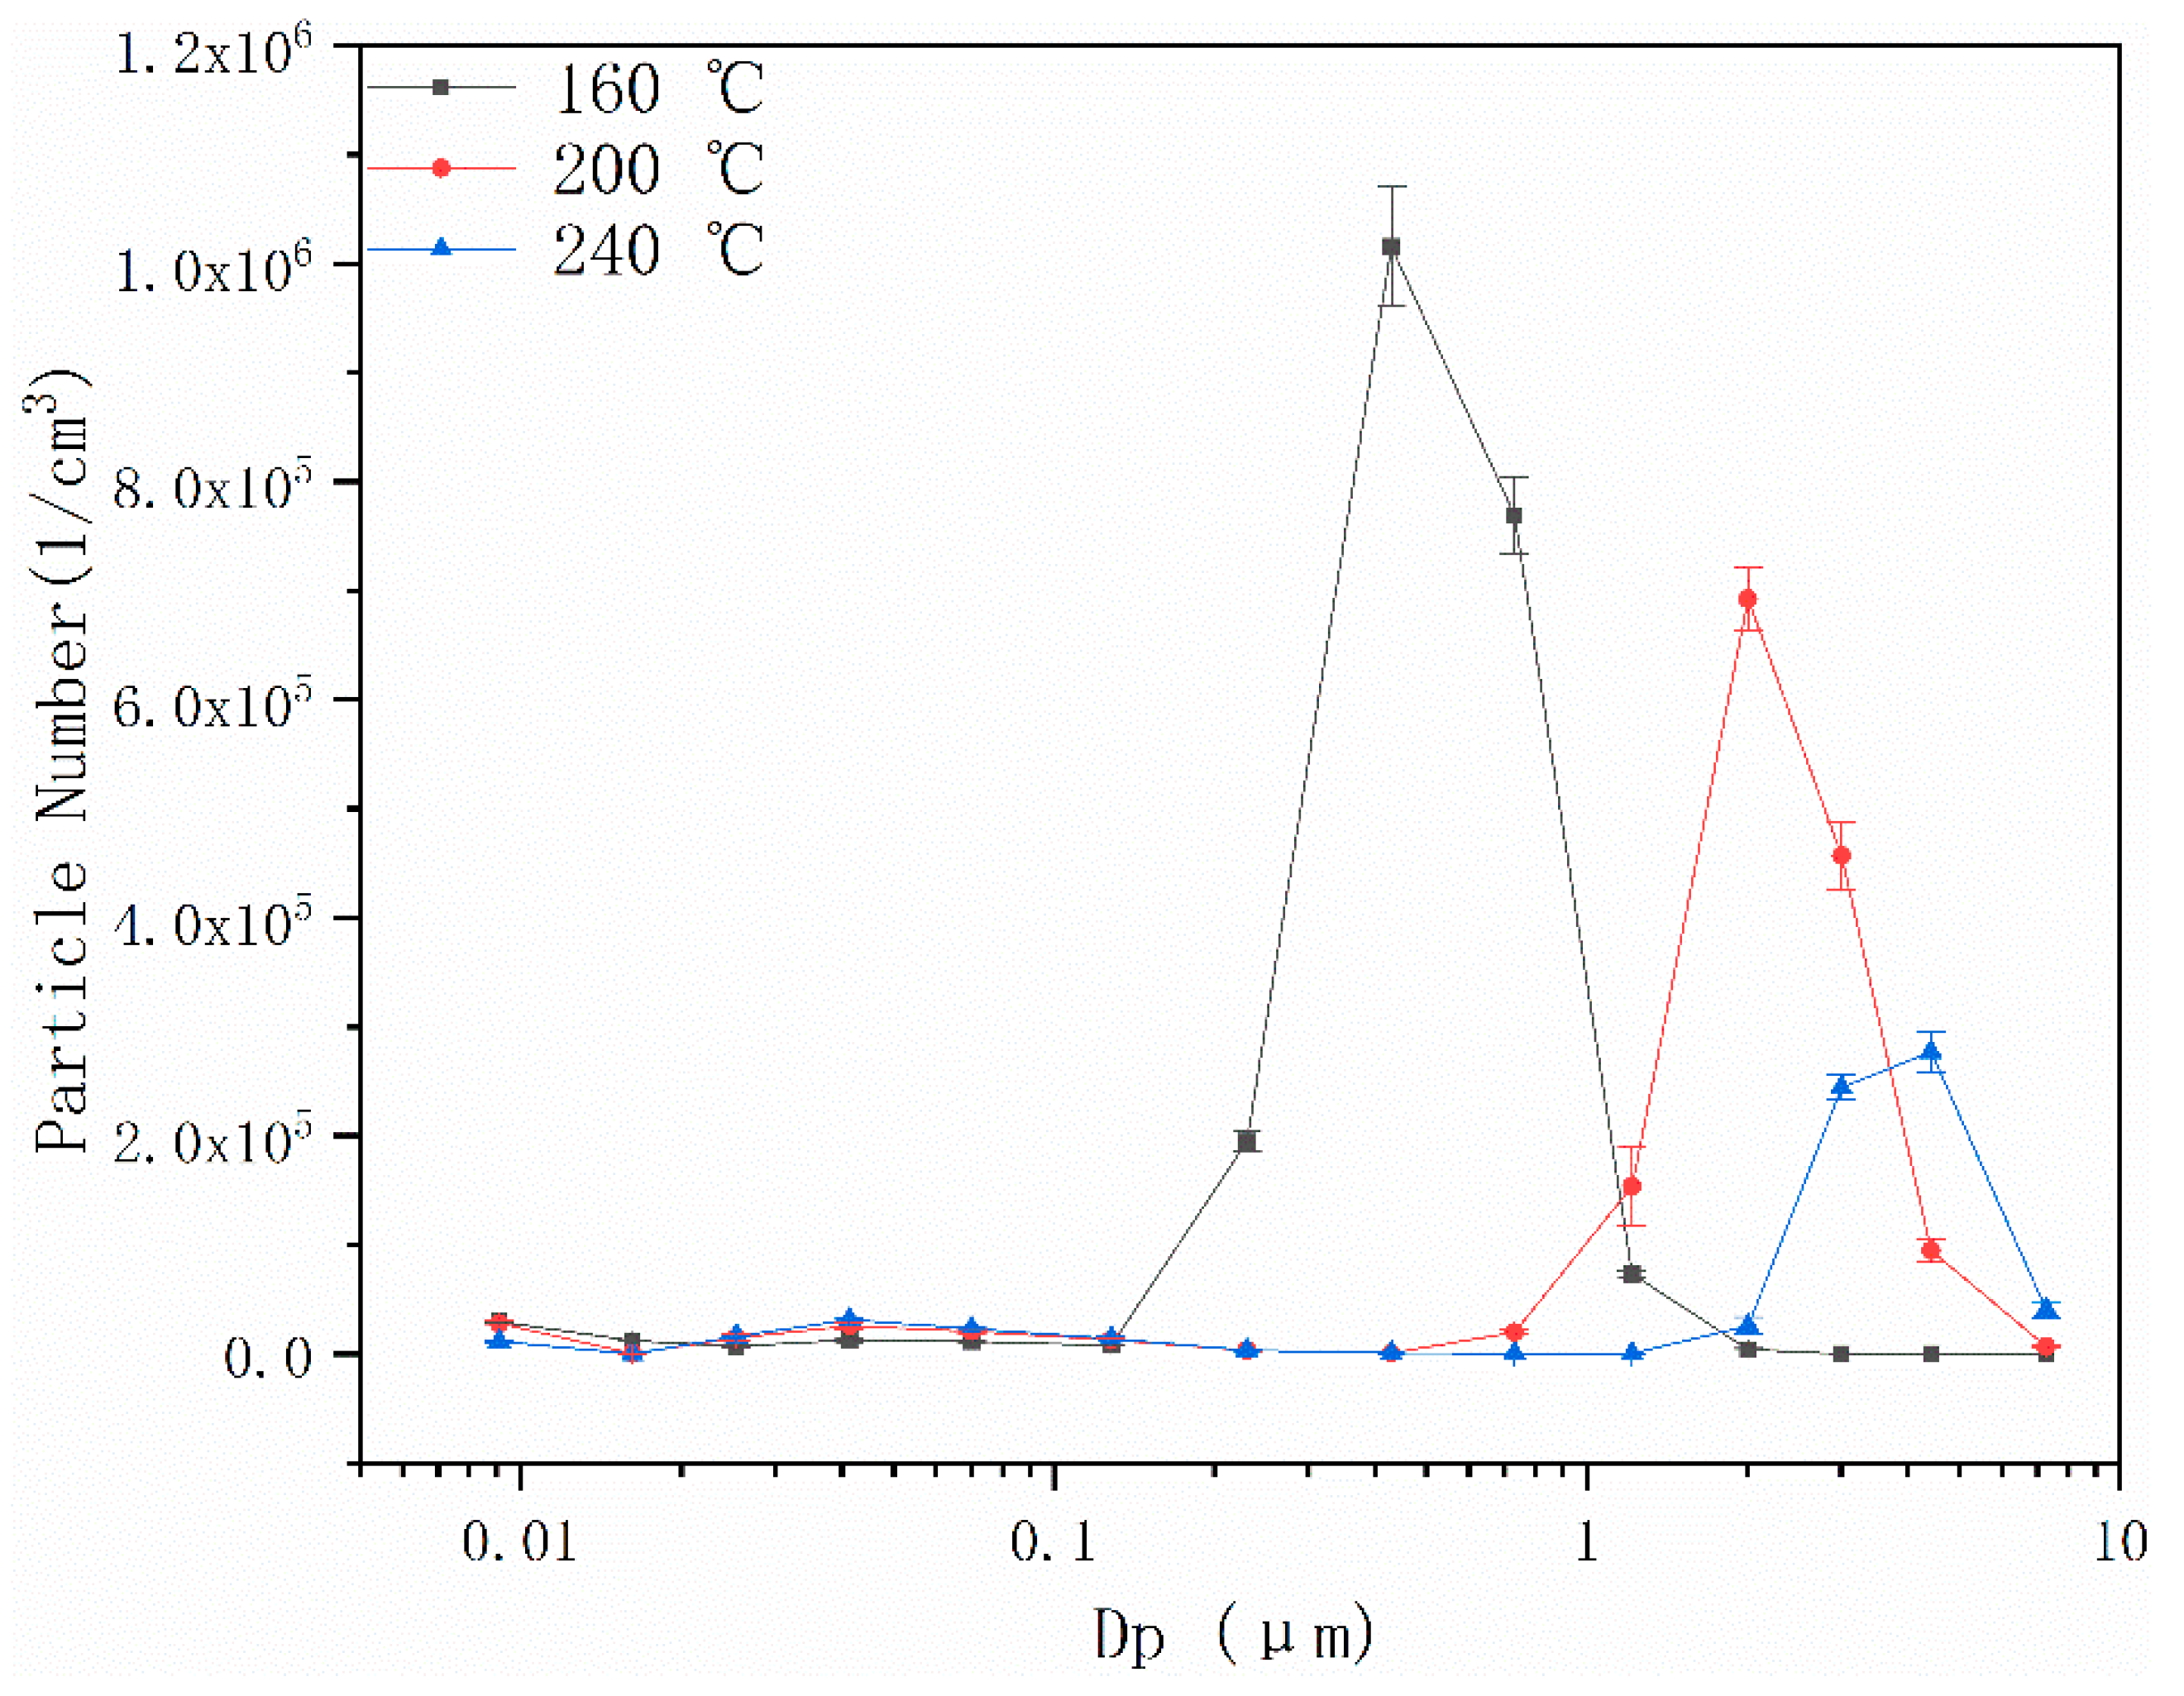
Figure 1. Schematic diagram of experimental set-up and electrical low-pressure impactor (ELPI).
Applsci 10 01045 g001
Figure 2. Original particle size distribution (PSD) and particle number concentration (PNC) of monodisperse particles.
Applsci 10 01045 g002
Figure 3. Relationship between entrainment coefficient, particle size, and frequency of particles.
Applsci 10 01045 g003
Figure 4. Schematic of acoustic wake effect.
Applsci 10 01045 g004
Figure 5. Effect of sound pressure levels (SPLs) on 0.5-μm particles at different frequencies in acoustic agglomeration.
Applsci 10 01045 g005
Figure 6. Effect of SPLs on 2-μm particles at different frequencies in acoustic agglomeration.
Applsci 10 01045 g006
Figure 7. Effect of SPLs on 4-μm particles at different frequencies in acoustic agglomeration.
Applsci 10 01045 g007
Figure 8. Reduction ratio of 0.5-μm particles under different acoustic conditions.
Applsci 10 01045 g008
Figure 9. Reduction ratios of 2-μm particles under different acoustic conditions.
Applsci 10 01045 g009
Figure 10. Reduction ratios of 4-μm particles under different acoustic conditions.
Applsci 10 01045 g010
Figure 11. Pulse energy input at different pulse voltages and pulse frequencies.
Applsci 10 01045 g011
Figure 12. Number concentration of 0.5-μm particles at different voltages.
Applsci 10 01045 g012
Figure 13. Number concentration of 2-μm particles at different voltages.
Applsci 10 01045 g013
Figure 14. Number concentration of 4-μm particles at different voltages.
Applsci 10 01045 g014
Figure 15. Number reduction ratios of particles with three sizes under different conditions.
Applsci 10 01045 g015
Table 1. The relationship between temperature and particle size in the PALAS generator.
T (°C)160180200220240260280
Particle Size (μm)0.51.32.02.74.06.38.1

