Article

Modeling of the Loading–Unloading Contact of Two Cylindrical Rough Surfaces with Friction

College of Mechanical and Electrical Engineering, Harbin Engineering University, No. 145 Nantong Street, Nangang District, Harbin 150001, China
*
Author to whom correspondence should be addressed.
Appl. Sci. 2020, 10(3), 742; https://doi.org/10.3390/app10030742
Submission received: 5 December 2019 / Revised: 7 January 2020 / Accepted: 20 January 2020 / Published: 21 January 2020
(This article belongs to the Section Mechanical Engineering)

Abstract

:
The first fractal model for the loading–unloading process between two cylindrical surfaces with friction is presented. The nonlinear relation between the real contact area and the contact load in different deformation stages are deduced for a load–unload cycle. The impacts of parameters in the model are discussed. The numerical results show that for a given dimensionless contact load, the dimensionless real contact area of the loading–unloading process of cylindrical contact surface with friction, as well as the differences of the dimensionless real contact area between the loading and unloading processes, increase with the increase of the loading interference and fractal dimension, decrease of the profile scaling parameter and curvature radius, or the substitution of external contact for internal contact.

1. Introduction

The surface of the mechanical structure is rugged on a microscopic view, and consists of numerous asperities of different sizes. The contact between rough surfaces is characterized by the interaction of asperities, which leads to the real contact area being a small fraction of the apparent contact area. The contact characterization has a significant impact on physical phenomena such as friction, wear, lubrication, etc. The contact between two cylindrical rough surfaces are very common in the engineering field, such as gear and cam mechanism. It is of great significance to make an extensive research on mechanical properties of the contact form.
Statistical methods are commonly used to analyze the contact problems of rough surfaces. There are many statistical models proposed recently, such as GW (Greenwood and Williamson) model [1,2,3], CEB (Chang, Etsion and Bogy) model [4], KE (Kogut and Etsion) model [5,6,7], the ellipse model [8,9], the size-dependent plasticity model [10] and so on. In particular, Kogut and Etsion [11,12] proposed a model that predicts the static friction for elastic-plastic contact of rough surfaces (KE friction model); Brizmer et al. [13] developed a numerical model for the elastic–plastic spherical contact under combined normal and tangential loading in full stick based on their single asperity models in full stick condition [14,15]; Cohen et al. [16,17] proposed statistical models for flat contacting rough surfaces and for spherical contacting rough surfaces under combined normal and tangential loading with the plasticity index ψ ≤ 8 respectively; Li et al. [18] extended the spherical model of Cohen up to ψ = 32; Wang et al. [19] developed a model to predict the static friction coefficient considering the multi-scale nature of roughness; Zheng et al. [20] proposed an improved static friction model for elastic-plastic contacting surfaces based on KE friction model. From the above statistical models and Etsion’s comment [21], the static friction coefficient is related to the normal load and decreases with an increasing normal load.
However, the statistical parameters in the above statistical models depend on the sample length and the resolution of the instrument, so that it is not unique in determining the characterization and analysis of the rough surface. In order to overcome the shortcomings of the statistical model, the necessity for scale independent contact models motivated the growing use of fractal description of the multiscale nature of contacting rough surfaces. Majumdar and Bhushan [22] proposed the first fractal model for two-dimensional rough surface using the Weierstrass–Mandelbrot function (MB model). Yan [23] extended the MB model to create the fractal model of three-dimensional rough surface (YK model). These two models revealed the relationship between the real contact area and the contact load through the numerical results, and the result of two models that the small contact spots were in plastic contact whereas large spots were in elastic contact was contrary to classical contact mechanics. Gao [24] analyzed contact between a rigid cylindrical indenter and an elastic, perfectly plastic solid with fractal surface roughness. The conclusion was that idealizing surface roughness as a perfect fractal led to unphysical predictions for the contact size and number of contact spots. Morag and Etsion [25] developed the fractal surface contact model (ME model) which agreed with classical contact mechanics by suggesting a revision to the MB model, in which the critical area of a single asperity was scale-dependent. Miao [26] developed a complete contact model of a fractal surface by extending the ME model, and the total load, area and stiffness of a fractal rough surface were studied. Chen [27,28,29] established the fractal model of the loading contact stiffness of the plane rough surfaces, cylindrical rough surfaces and spheroidal rough surfaces considering the friction factor successively by introducing the specific contact coefficient to the loading contact stiffness formula. It revealed the influence of parameters such as the friction coefficient and the fractal dimension on the loading contact stiffness. Hanaor [30] developed an approach for contact mechanics of fractal surfaces by spline assisted discretization and revealed the significant effect of surface fractality on contact mechanics. Ma [31] established a sliding frictional fractal contact model of two involute arc cylindrical gears. The model showed that the load-area relation was not only affected by the fractal parameters, but also by the contact radius and tooth line radius. Wang [32] proposed a fractal contact stiffness model considering the effect of asperity interaction by introducing the concept of fractal smoothness which affected the contact stiffness and the effect could be offset by the asperity interaction. The effect of asperity interaction on contact stiffness was studied as well. Pan [33,34] established a normal contact stiffness fractal prediction model of dry-friction rough surface considering the friction factor based on three-dimensional fractal function, and the validity of the established model was verified by experiment. Shen [35] proposed a contact stiffness model in view of the influence of domain extension factor between two spherical rough surfaces and analyzed evolution of the elastic-plastic contact involving three distinct stages ranged from complete elastic through elastic-plastic to fully plastic deformation. Guan [36] used the results of reference [29] and investigated the conformal contact between piston and cylinder by employing the fractal theory. In this model, the contact coefficient was proposed, which was affected by the structural parameters of piston radius and radial clearance as well as the material properties. Zhao [37] proposed a novel contact stiffness model of a concrete–steel joint based on the fractal theory. Here, an iteration model was proposed to describe the contact state of the concrete–steel joint and revealed the nonlinear relationships between contact stiffness and load, fractal parameters. Yuan [38] proposed a revised MB model, and deduced the transition from elastic, elastoplastic to full plastic deformation for a single asperity whose contact area and load is related to asperity level. Further, Yuan [39] extended this model to develop a loading–unloading contact model between three-dimensional rough plane surfaces based on fractal theory, and the relation between the total contact load and the total real contact area was obtained in the loading and unloading processes. Xu [40] developed the revised size distribution functions for the two-dimensional and three-dimensional fractal rough surfaces respectively, and the validity of the model was verified by comparing with the experimental data.
As can be seen from the above literature review, a substantial effort has been made so far to investigate the contact between rough surfaces both statistical methods and fractal theory. However, the current research of the fractal model involved in the contact problem between two cylindrical surfaces mainly focused on the loading process, rather than the unloading process. Therefore, a loading–unloading contact analytical model between two cylindrical rough surfaces with friction, based on fractal theory is presented in this paper. The relation between the real contact area and the contact load in different deformation stages are given to investigate how the parameters in the model (such as fractal dimension, profile scaling parameter, curvature radius and contact type) affect the loading–unloading contact performance.

2. Contact Model in the Loading Process with Regard of Friction

Assuming that (1) the surfaces in contact are cylindrical, rough and isotropic; (2) asperities are far away from each other and no interaction between them; (3) no bulk deformation occurs during contact; (4) asperities are assumed spherical; and (5) no adhesion force during contact. The asperity and the rough surface deformation happens in the sequence of elasticity, elastoplasticity and plasticity as the contact load and area increase.

2.1. Contact Model of Single Asperity in Loading Process with Regard of Friction

According to the von Mises yield criterion, the critical elastic interference ω e c and the critical elastic contact area a e c of single asperity without friction can be expressed as [41]:
ω e c = π C σ Y 2 E 2 R
a e c = π R ω e c = π π C σ Y 2 E 2 R 2
where C is the critical yield stress coefficient, C = 1.295 exp ( 0.736 ν ) ; ν is the Poisson ratio of the softer material; σ Y is the yield strength of the softer material; R is the radius of asperity curvature; E is the equivalent elastic modulus, which is:
1 E = 1 ν 1 2 E 1 + 1 ν 2 2 E 2 ,
and E1, E2 are the elastic modulus of two contact surfaces, respectively; ν 1 and ν 2 are the Poisson ratio of two contact surfaces, respectively.
By Hertzian theory, the relation between the critical elastic contact load F e c and the critical elastic interference ω e c of single asperity without friction is:
F e c = 4 3 E R 1 2 ω e c 3 2
By substituting Equations (1) and (2) into Equation (4), the relation between the critical elastic contact load F e c and the critical elastic contact area a e c can be given as:
F e c = 2 3 C σ Y a e c
According to the fractal theory, the critical elastic interference ω e c and the critical elastic contact area a e c can be expressed as [26]:
ω e c = C 2 σ Y 2 l D 4 E 2 G D 1
a e c = C 2 σ Y 2 l 2 D 4 E 2 G 2 D 2 π
where G is the profile scaling parameter; D is the fractal dimension and l is the asperity base diameter.
For a given rough surface, the value of the critical elastic interference and the critical elastic contact area are constant, which depend on the material properties, the fractal dimension and the profile scaling parameter, as well as the maximum asperity base diameter on the base plane [29].
If the slide happens between contact surfaces, the relation between the critical elastic contact load F e c and the critical elastic contact area a e c of single asperity with regard of friction can be given as by Equation (8) when single asperity begins to yield [42].
F e c = 1.1 k μ e c σ Y a e c
where, F e c is the critical elastic contact load of single asperity with regard of friction; a e c is the critical elastic contact area of single asperity with regard of friction; kμec is the value of the correction factor with regard of friction, kμ, when single asperity begins to yield, and kμ can be expressed as:
k μ = 1 0.228 μ 0 μ 0.3 0.932 e 1.58 μ 0.3 0.3 < μ 0.9
where the friction coefficient μ is related to the normal load and decreases with an increasing normal load in the deformation process of single asperity [11,12,13,14,15,16,17,18,21]. Due to the neglecting of the adhesion force, the relation between the friction coefficient and the normal load in the elastic regime can be expressed as [11]:
μ = 0.516 F F e c 0.345
The critical elastic contact load of the spherical surface are the same both with and without friction according to Tabor’s measurement [43] and the GW model [1]. The friction force acting on asperities is the tangential force which affects the normal contact by changing the contact area, and the load–area relation of single asperity in the elastic stage satisfies F a’3/2 [28,29,36], where F’ is the contact load of single asperity and a’ is the contact area.
Combining Equations (5) and (8), the relation between the critical elastic contact areas a e c without friction and a e c with friction can be given as:
a e c = 2 C 3.3 k μ e c a e c
Thus, the contact model of single asperity in loading process can be given in elastic, elastoplastic and plastic stages respectively.
1. Elastic stage:
The single asperity is in elastic deformation when 0 a a e c . The contact area and contact load is in the form of:
F e = F e c ω ω e c 3 / 2
a = a e c ω ω e c
where F e is the contact load of single asperity in the elastic stage and ω is the interference of single asperity.
Combining Equations (8), (12) and (13), the relation between the contact area and the contact load of single asperity in the elastic deformation with regard of friction can be given as:
F e = 1.1 k μ e c σ Y a e c 1 / 2 a 3 / 2
2. Elastoplastic stage:
When the interference is greater than critical elastic interference, the elastoplastic deformation occurs. When ω e c < ω 6 ω e c [5], the single asperity is in the first elastoplastic stage, where the relation between the contact area and the contact load can be given as:
F F e c = 1.03 a 0.93 a e c 1.2544
When 6 ω e c < ω 110 ω e c , the single asperity is in the second elastoplastic stage, where the relation between the contact area and the contact load can be given as:
F F e c = 1.40 a 0.94 a e c 1.1021
By substituting Equations (5), (8) and (11) into Equations (15) and (16) respectively, the relation between the contact area and the contact load of single asperity in the elastoplastic deformation with regard of friction can be expressed by Equations (17) and (18) respectively.
F e p 1 = 0.6621 σ Y C 1.2544 k μ e c 0.2544 a e c 0.2544 a 1.2544   ( a e c < a a e p c )
F e p 2 = 0.9494 σ Y C 1.1021 k μ e c 0.1021 a e c 0.1021 a 1.1021   ( a e p c < a a p c )
where F e p 1 is the contact load of single asperity in the first elastoplastic stage; a e p c is the critical contact area of the first elastoplastic stage with regard of friction, which is a e p c = 11.7475 k μ e c C a e c with ω = 6 ω e c ; F e p 2 is the contact load of single asperity in the second elastoplastic stage; a p c is the critical contact area of the second elastoplastic stage with regard of friction, which is a p c = 338.8815 k μ e c C a e c with ω = 110 ω e c .
3. Plastic stage:
When a > a p c , the contact is in the plastic stage. The relation between the contact area and the contact load of single asperity can be expressed as:
F p = H a ,
where F p is the contact load of single asperity in the plastic stage and H is the hardness of the softer material.
The above results can be used in contact modeling of two cylindrical surfaces with regard of friction.

2.2. Fractal Contact Model of Two Cylindrical Surfaces in Loading Process with Regard of Friction

In the fractal theory, the contact spots are of different sizes and spread randomly over the contact interface. The size distribution of contact spots is n(a), such that n(a)da is equal to the number of contact spots of area between a and a + da. According to the MB model, the size distribution of contact spots n(a) is:
n a = d N A > a d a = D 2 a max D / 2 a D + 2 / 2 ,
where N is the total number of contact spots with area larger than a; amax is the area of the largest contact spot.
However, Equation (20) cannot apply to the rough curved surface since the deformation of curved surface is different from that of the planar surface, and results in the disparity for the calculation of variable N in Equation (20). With support of the cylindrical contact coefficient, λ C , the asperity size distribution, n a , in the contact of two cylindrical surfaces [27], can be given as:
n a = λ C D 2 a l D 2 a D + 2 2 ,
where a l is the maximum contact area for all asperities with a given interference and λ C is the cylindrical contact coefficient, defined as:
λ C = 4 B π E R c 1 R c 2 R c 1 ± R c 2 1 2 π R c 1 ± R c 2 1 R c 2 ± 1 R c 1 ,
where Rc1 and Rc2 are the curvature radius of two cylinders, respectively; B is the contact length of two cylinders; “+” is for the external contact; “−” is for the internal contact and Rc1 > Rc2.
Thus, the contact model between two cylindrical surfaces in loading process can be given in each deformation stage with regard of friction.
1. Elastic stage:
The elastic deformation only happens in asperities on the surface when 0 a l a e c . The contact model in the elastic stage can be written as:
A c e = 0 a l n a a d a = λ C D 2 D a l   and
F c e = 0 a l F e n a d a = 1.1 λ C D k μ e c σ Y 3 D a e c 1 / 2 a l 3 / 2 ,
where Ace and Fce are the real contact area and the contact load between two cylindrical surfaces in the elastic stage with regard of friction, respectively.
2. Elastoplastic stage:
When a e c < a l a e p c , both the elastic deformation and the first elastoplastic deformation happen in asperities on the surface. The contact model in the first elastoplastic stage can be written as:
A c e p 1 = 0 a e c n a a d a + a e c a l n a a d a = λ C D 2 D a l   and
F c e p 1 = 0 a e c F e n a d a + a e c a l F e p 1 n a d a = 1.1 λ C D k μ e c σ Y 3 D a e c 2 D 2 a l D / 2 + λ C D σ Y C 1.2544 k μ e c 0.2544 2 0.6621 a e c 0.2544 1.2544 0.5 D a l 1.2544 0.5 D a e c 1.2544 0.5 D a l D / 2 ,
where Acep1 and Fcep1 are the real contact area and the contact load between two cylindrical surfaces in the first elastoplastic stage with regard of friction, respectively.
When a e p c < a l a p c , the deformation of asperities on the surface includes the elastic deformation, the first elastoplastic deformation and the second elastoplastic deformation. The contact model in the second elastoplastic stage can be written as:
A c e p 2 = 0 a e c n a a d a + a e c a e p c n a a d a + a e p c a l n a a d a = λ C D 2 D a l   and
F c e p 2 = 0 a e c F e n ( a ) d a + a e c a e p c F e p 1 n ( a ) d a + a e p c a l F e p 2 n ( a ) d a = 1.1 λ C D k μ e c σ Y a e c 1 0.5 D 3 D a l D / 2 + λ C D σ Y C 1.2544 k μ e c 0.2544 2 0.6621 a e c 0.2544 1.2544 0.5 D 11.7475 k μ e c C 1 a e c 1.2544 0.5 D a l D / 2 , + λ C D σ Y C 1.1021 k μ e c 0.1021 2 0.9494 a e c 0.1021 1.1021 0.5 D [ a l 1.1021 0.5 D ( 11.7475 k μ e c C a e c ) 1.1021 0.5 D ] a l D / 2
where Acep2 and Fcep2 are the real contact area and the contact load between two cylindrical surfaces in the second elastoplastic stage with regard of friction, respectively.
3. Plastic stage:
When a > a p c , the deformation of asperities on the surface includes all of elastic deformation, the first elastoplastic deformation, the second elastoplastic deformation and the plastic deformation.
The current research objective is to model the loading/unloading cycle in the contact of two cylindrical surface and it is assumed that the deformation in plastic stage does not happen. If the interest is only the loading process, readers can use the above method to complete this part of modelling work.

3. Fractal Contact Model in the Unloading Process with Regard of Friction

The contact model between two cylindrical surfaces in unloading process relies on the loading process. The corresponding unloading contact model varies with the final deformation stage of the loading process. Asperities on the surface still satisfy the fractal characteristic at the end of the unloading process [39,44]. The size distribution in contact of two cylindrical surfaces in the unloading process can be written as:
n u a u = λ C D 2 a l u D 2 a u D + 2 2 ,
where a l u is the maximum contact area for all asperities in the unloading process; and a u is the contact area of single asperity in the unloading process. Because the real contact area and contact load of asperities at the end of the loading process equal those at the beginning of the unloading process respectively, a l u = a l = a max , and a max is the maximum contact area corresponding to the maximum interference ω max for all asperities in the loading process.
Thus, the unloading contact model between two cylindrical surfaces with regard of friction can be given in each deformation stage.
1. Elastic stage:
when 0 a max a e c , only the elastic deformation occurs in asperities on the surface and the unloading process is an inverse process of the loading process in this case. So, the unloading contact model of the elastic stage can be written as:
A c e u = 0 a l u n u a u a u d a u = λ C D 2 D a l u   and
F c e u = 0 a l u F e u n u a u d a u = 1.1 λ C D k μ e c σ Y 3 D a e c 1 / 2 a l u 3 / 2 ,
where A c e u and F c e u are the real contact area and the contact load between two cylindrical surfaces in the unloading process in the elastic stage with regard of friction, respectively.
2. Elastoplastic stage:
When a e c < a max a p c , the residual interference of asperities on the surface is the unrecoverable plastic portion of ω max at the completion of the asperity unloading, which results in the surface topography after unloading different from the original one before loading process.
The relation between the radius of curvature, R u , of the asperity after unloading and the radius before loading, R, is [6]:
R u R = 1 + 1.275 E σ y 0.216 ω max ω e c 1 .
The critical elastic contact area is proportional to the square of the radius of asperity curvature according to Hertzian theory. By combining Equation (32), the critical elastic contact area a e c u of single asperity with regard of friction after unloading can be given as:
a e c u = 1 + 1.275 E σ y 0.216 ω max ω e c 1 2 a e c .
The relation between the maximum contact area and the maximum interference can be given by Equations (34) and (35) [5] when single asperity is in the first elastoplastic stage and the second elastoplastic stage, respectively.
ω max = C a max 1.5345 k μ e c a e c 1 1.136 ω e c   ( a e c < a max a e p c )
ω max = C a max 1.5510 k μ e c a e c 1 1.146 ω e c   ( a e p c < a max a p c )
When the surface is loaded in the elastoplastic stage in the end, the unloading process is equivalent to the inverse process of the loading process where the surface with the critical elastic contact area a e c u is loaded till a max , and the elastic loading model apply.
By substituting Equations (33) and (34) into Equation (14), the relation between the contact area and the contact load of single asperity in the unloading process in the first elastoplastic stage can be written as:
F e p 1 u = 1.1 k μ e c σ Y 1 + 1.275 E σ y 0.216 C a max 1.5345 k μ e c a e c 1 1.136 1 2 a e c 1 / 2 a u 3 / 2 a e c < a max a e p c 0 a u a max ,
where F e p 1 u is the contact load of single asperity in the unloading process in the first elastoplastic stage.
By substituting Equations (33) and (35) into Equation (14), the relation between the contact area and the contact load of single asperity in the unloading process in the second elastoplastic stage can be written as:
F e p 2 u = 1.1 k μ e c σ Y 1 + 1.275 E σ y 0.216 C a max 1.5510 k μ e c a e c 1 1.146 1 2 a e c 1 / 2 a u 3 / 2 a e p c < a max a p c 0 a u a max ,
where F e p 2 u is the contact load of single asperity in the unloading process in the second elastoplastic stage.
When a e c < a l u a e p c , surfaces are in the first elastoplastic stage at the beginning of the unloading process. Because the real contact area and contact load between two cylindrical surfaces at the end of the loading process equal those of the beginning of the unloading process respectively, the unloading contact model of the first elastoplastic stage can be written as:
A c e p 1 u = 0 a l u n u a u a u d a u = λ C D 2 D a l u   and
F c e p 1 u = 0 a l u F e p 1 u n u a u d a u = 0 a e c F e n a d a + a e c a l F e p 1 n a d a ,
where A c e p 1 u and F c e p 1 u are the real contact area and the contact load between two cylindrical surfaces in the unloading process in the first elastoplastic stage with regard of friction, respectively.
Because Equations (15) and (32) are regressed by the results of finite element method(FEM), some errors are involved in Equation (39). The load correction factor K u is introduced to minimize these errors [39,44] and Equation (39) can be rewritten as:
F c e p 1 u = 0 a l u K u c e p 1 F e p 1 u n u a u d a u = 1.1 K u c e p 1 λ C D k μ e c σ Y 3 D 1 + 1.275 E σ y 0.216 C a max 1.5345 k μ e c a e c 1 1.136 1 2 a e c 1 / 2 a l u 3 / 2 ,
where Kucep1 is the load correction factor of the first elastoplastic stage.
By substituting Equations (26) and (40) into Equation (39), Kucep1 can be given as:
K u c e p 1 = 1.1 λ C D k μ e c σ Y 3 D a e c 2 D 2 a max D / 2 + λ C D σ Y C 1.2544 k μ e c 0.2544 2 0.6621 a e c 0.2544 1.2544 0.5 D a max 1.2544 0.5 D a e c 1.2544 0.5 D a max D 2 1.1 λ C D k μ e c σ Y 3 D 1 + 1.275 E σ y 0.216 C a max 1.5345 k μ e c a e c 1 1.136 1 2 a e c 1 / 2 a max 3 / 2 .
When a e p c < a l u a p c , surfaces are in the second elastoplastic stage at the beginning of the unloading process. The unloading contact model of the second elastoplastic stage can be given as:
A c e p 2 u = 0 a l u n u a u a u d a u = λ C D 2 D a l u   and
F c e p 2 u = 0 a l u F e p 2 u n u a u d a u = 0 a e c F e n a d a + a e c a e p c F e p 1 n a d a + a e p c a l F e p 2 n a d a ,
where A c e p 2 u and F c e p 2 u are the real contact area and the contact load between two cylindrical surfaces in the unloading process in the second elastoplastic stage with regard of friction, respectively. F c e p 2 u can be expressed as:
F c e p 2 u = 0 a l u K u c e p 2 F e p 2 u n u a u d a u = 1.1 K u c e p 2 λ C D k μ e c σ Y 3 D 1 + 1.275 E σ y 0.216 C a max 1.5510 k μ e c a e c 1 1.146 1 2 a e c 1 / 2 a l u 3 / 2 ,
where Kucep2 is the load correction factor of the second elastoplastic stage.
By substituting Equations (28) and (44) into Equation (43), Kucep2 can be written as:
K u c e p 2 = 1.1 λ C D k μ e c σ Y 3 D a e c 2 D 2 a max D / 2 1.1 λ C D k μ e c σ Y 3 D 1 + 1.275 E σ y 0.216 C a max 1.5510 k μ e c a e c 1 1.146 1 2 a e c 1 / 2 a max 3 / 2 + λ C D σ Y C 1.2544 k μ e c 0.2544 2 0.6621 a e c 0.2544 1.2544 0.5 D 11.7475 k μ e c C 1 a e c 1.2544 0.5 D a max 0.5 D 1.1 λ C D k μ e c σ Y 3 D 1 + 1.275 E σ y 0.216 C a max 1.5510 k μ e c a e c 1 1.146 1 2 a e c 1 / 2 a max 3 / 2 + λ C D σ Y C 1.1021 k μ e c 0.1021 2 0.9494 a e c 0.1021 1.1021 0.5 D a max 1.1021 0.5 D 11.7475 k μ e c C a e c 1.1021 0.5 D a max D / 2 1.1 λ C D k μ e c σ Y 3 D 1 + 1.275 E σ y 0.216 C a max 1.5510 k μ e c a e c 1 1.146 1 2 a e c 1 / 2 a max 3 / 2 .

4. Numerical Results and Discussion

The contact models of two cylindrical surfaces in the loading and unloading process with regard of friction can be normalized to generalize the results. Further analysis can be carried out on the base of normalization.

4.1. Normalization

The contact between two cylindrical surfaces is as shown in Figure 1. The nominal contact area (the macroscopic contact area) A0 is positively related to the contact load F.
Assume that the material of the two contacts are steel and their calculation parameters are as follows: E1 = E2 = 2.06 × 10⁵ MPa, ν1 = ν2 = ν = 0.3, σy = 205 MPa, D = 1.5, G = 10−10 mm, l = 5.2151 × 10⁻⁶ mm, Rc1 = 100 mm, Rc2 = 60 mm, B = 50 mm, the contact type is the internal contact.
When the surface is loaded till a p c , the critical interference, ω p c , can be given as:
ω p c = 110 ω e c = 110 C 2 σ Y 2 l D 4 E 2 G D 1 = 2.8020 × 10 7 mm .
The critical interference ω H of Hertzian theory can be calculated by Equation (47) [45].
ω H = R M σ Y E 2 2 ln 2 E M σ Y 1 ,
where R is the equivalent curvature radius:
R = R c 1 R c 2 R c 1 ± R c 2 ,
where, “+” is for the external contact and “−” for the internal contact, M is the error correction factor, which is:
M = 1 1 2 ν ν 0.194 2.9211 ν 2 + 2.9827 ν + 1.1628 ν > 0.194 .
By substituting calculation parameters, the critical interference ω H can be calculated, that is:
ω H = 0.0188 mm ω p c .
According to Equation (50), the range of the interference in the contact process of the model proposed belong to the range of Hertz elastic contact in macroscopic view and the nominal contact area, A0, in the paper is the macroscopic contact area calculated by Hertz theory.
The dimensionless contact area, A*, is defined as the real contact area, A, divided by the nominal contact area, A0, and the dimensionless contact load, F*, is the contact load, F, divided by the nominal contact area, A0, and the equivalent elastic modulus, E:
A * = A A 0 , F * = F A 0 E ,
where A0 is the nominal contact area,
A 0 = 2 B 4 F π B R E .

4.2. Load–Unload Cycle Analysis

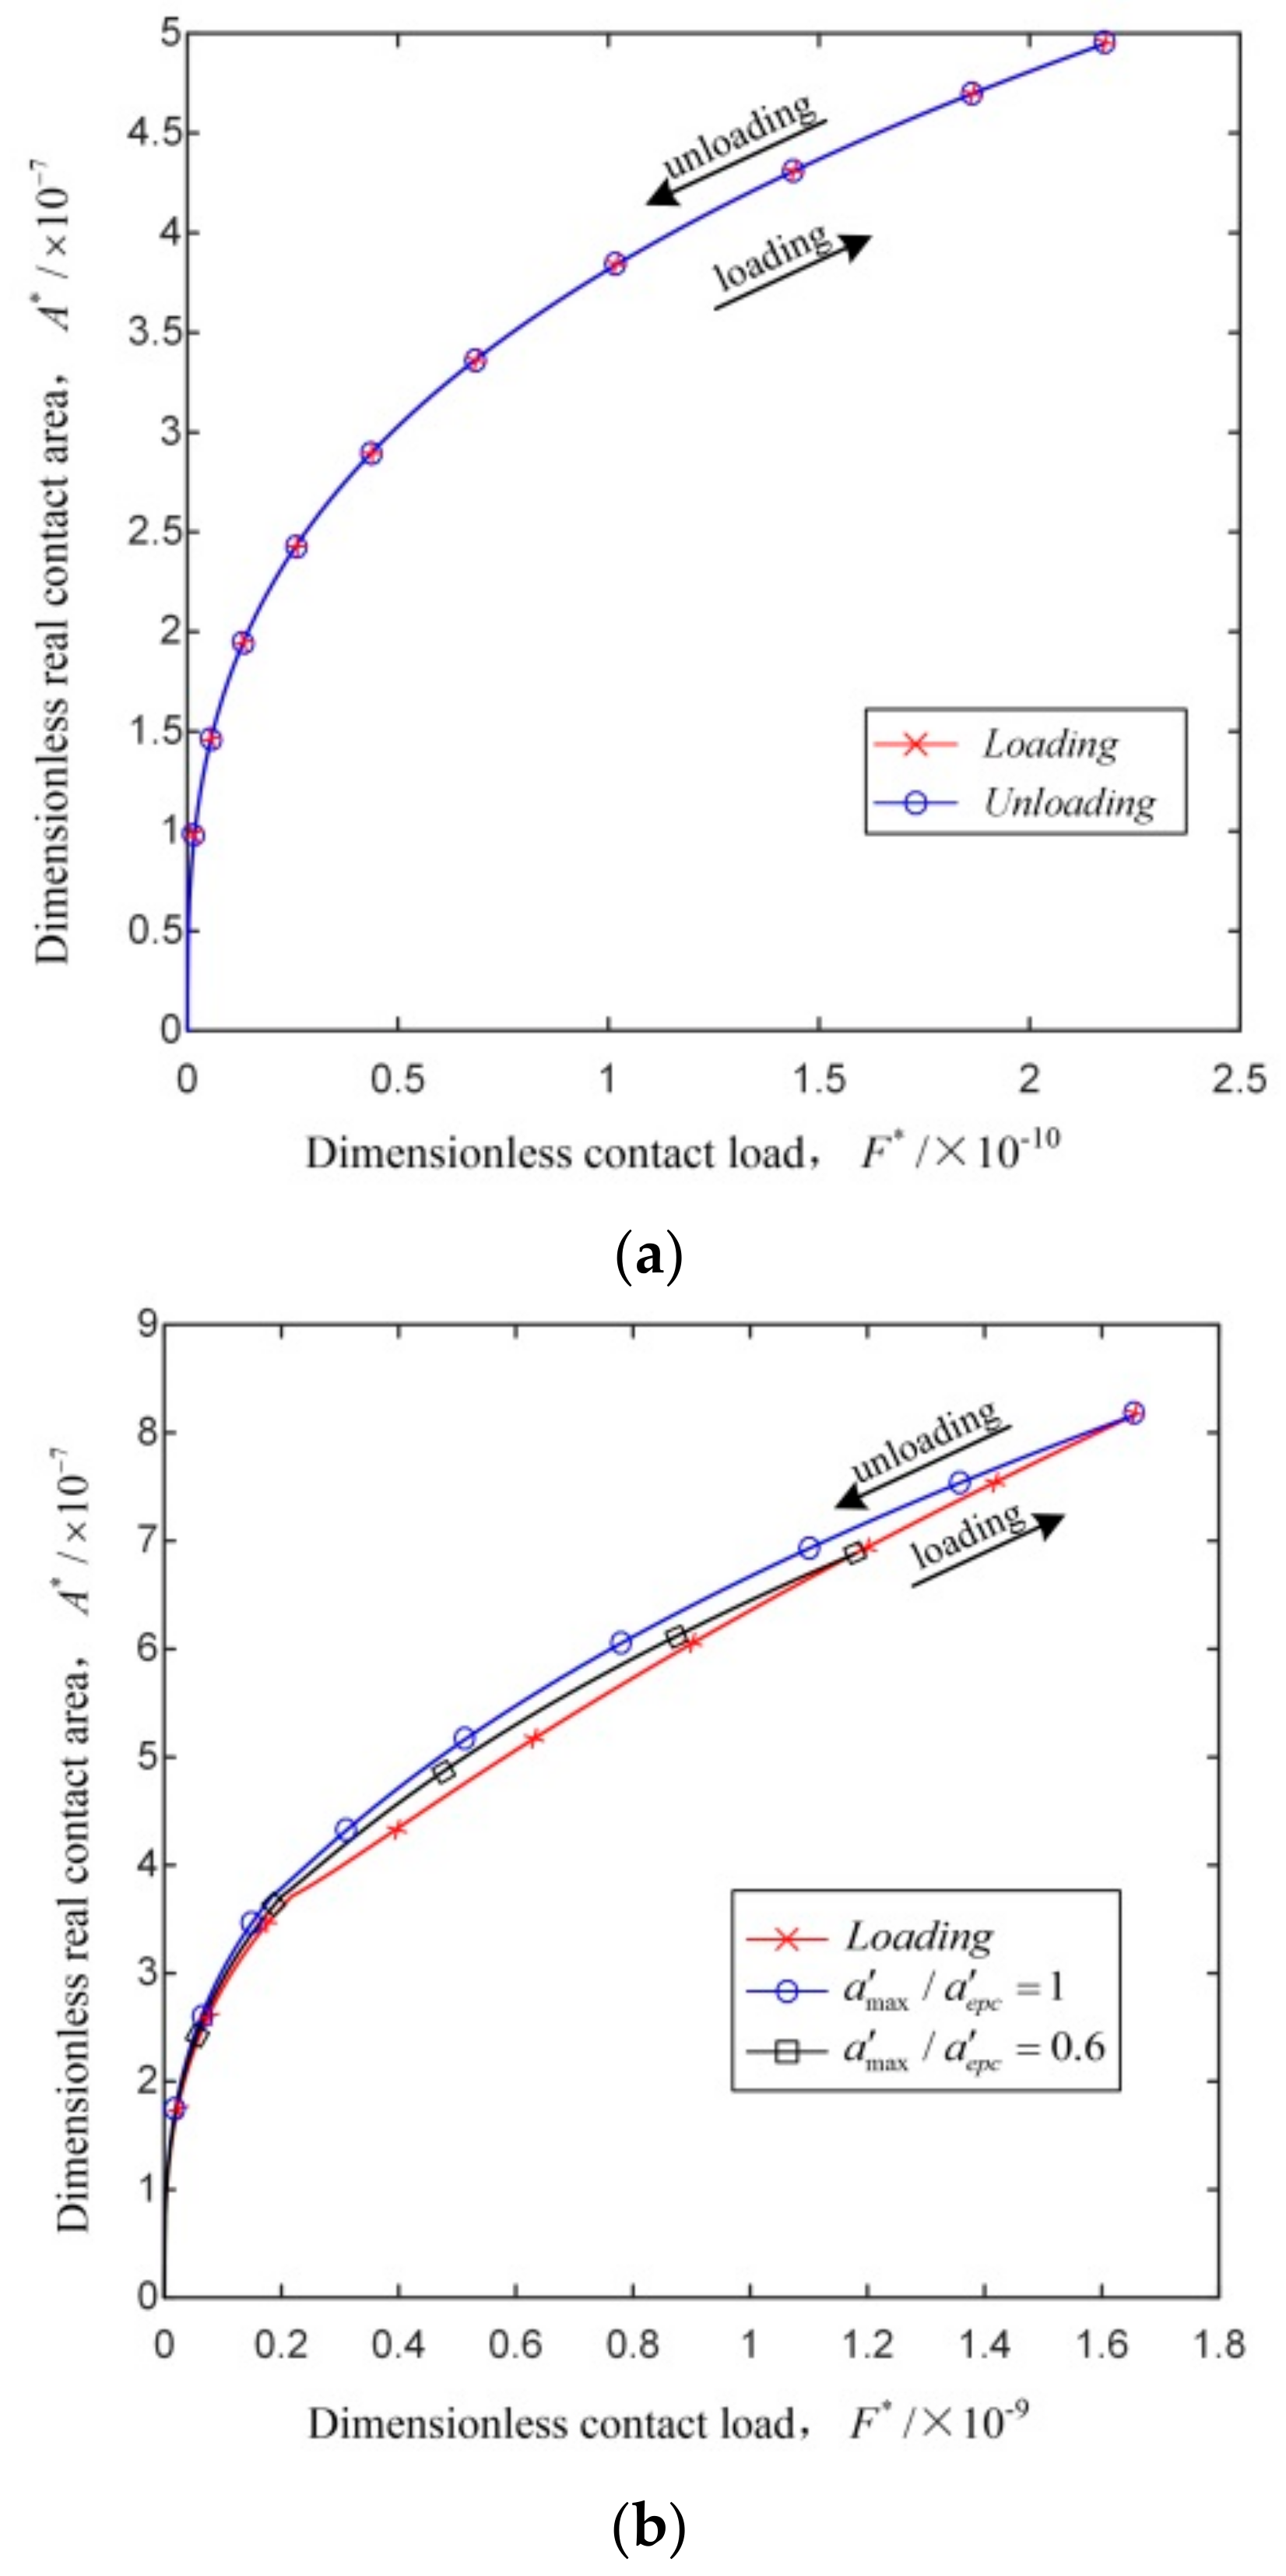
Figure 2 shows the relation between dimensionless real contact area and dimensionless contact load of two cylindrical surfaces in different deformation stages. Figure 2a shows the load–unload cycle in the elastic stage and no difference can be seen between loading and unloading process as the plastic deformation does not happen in this stage.
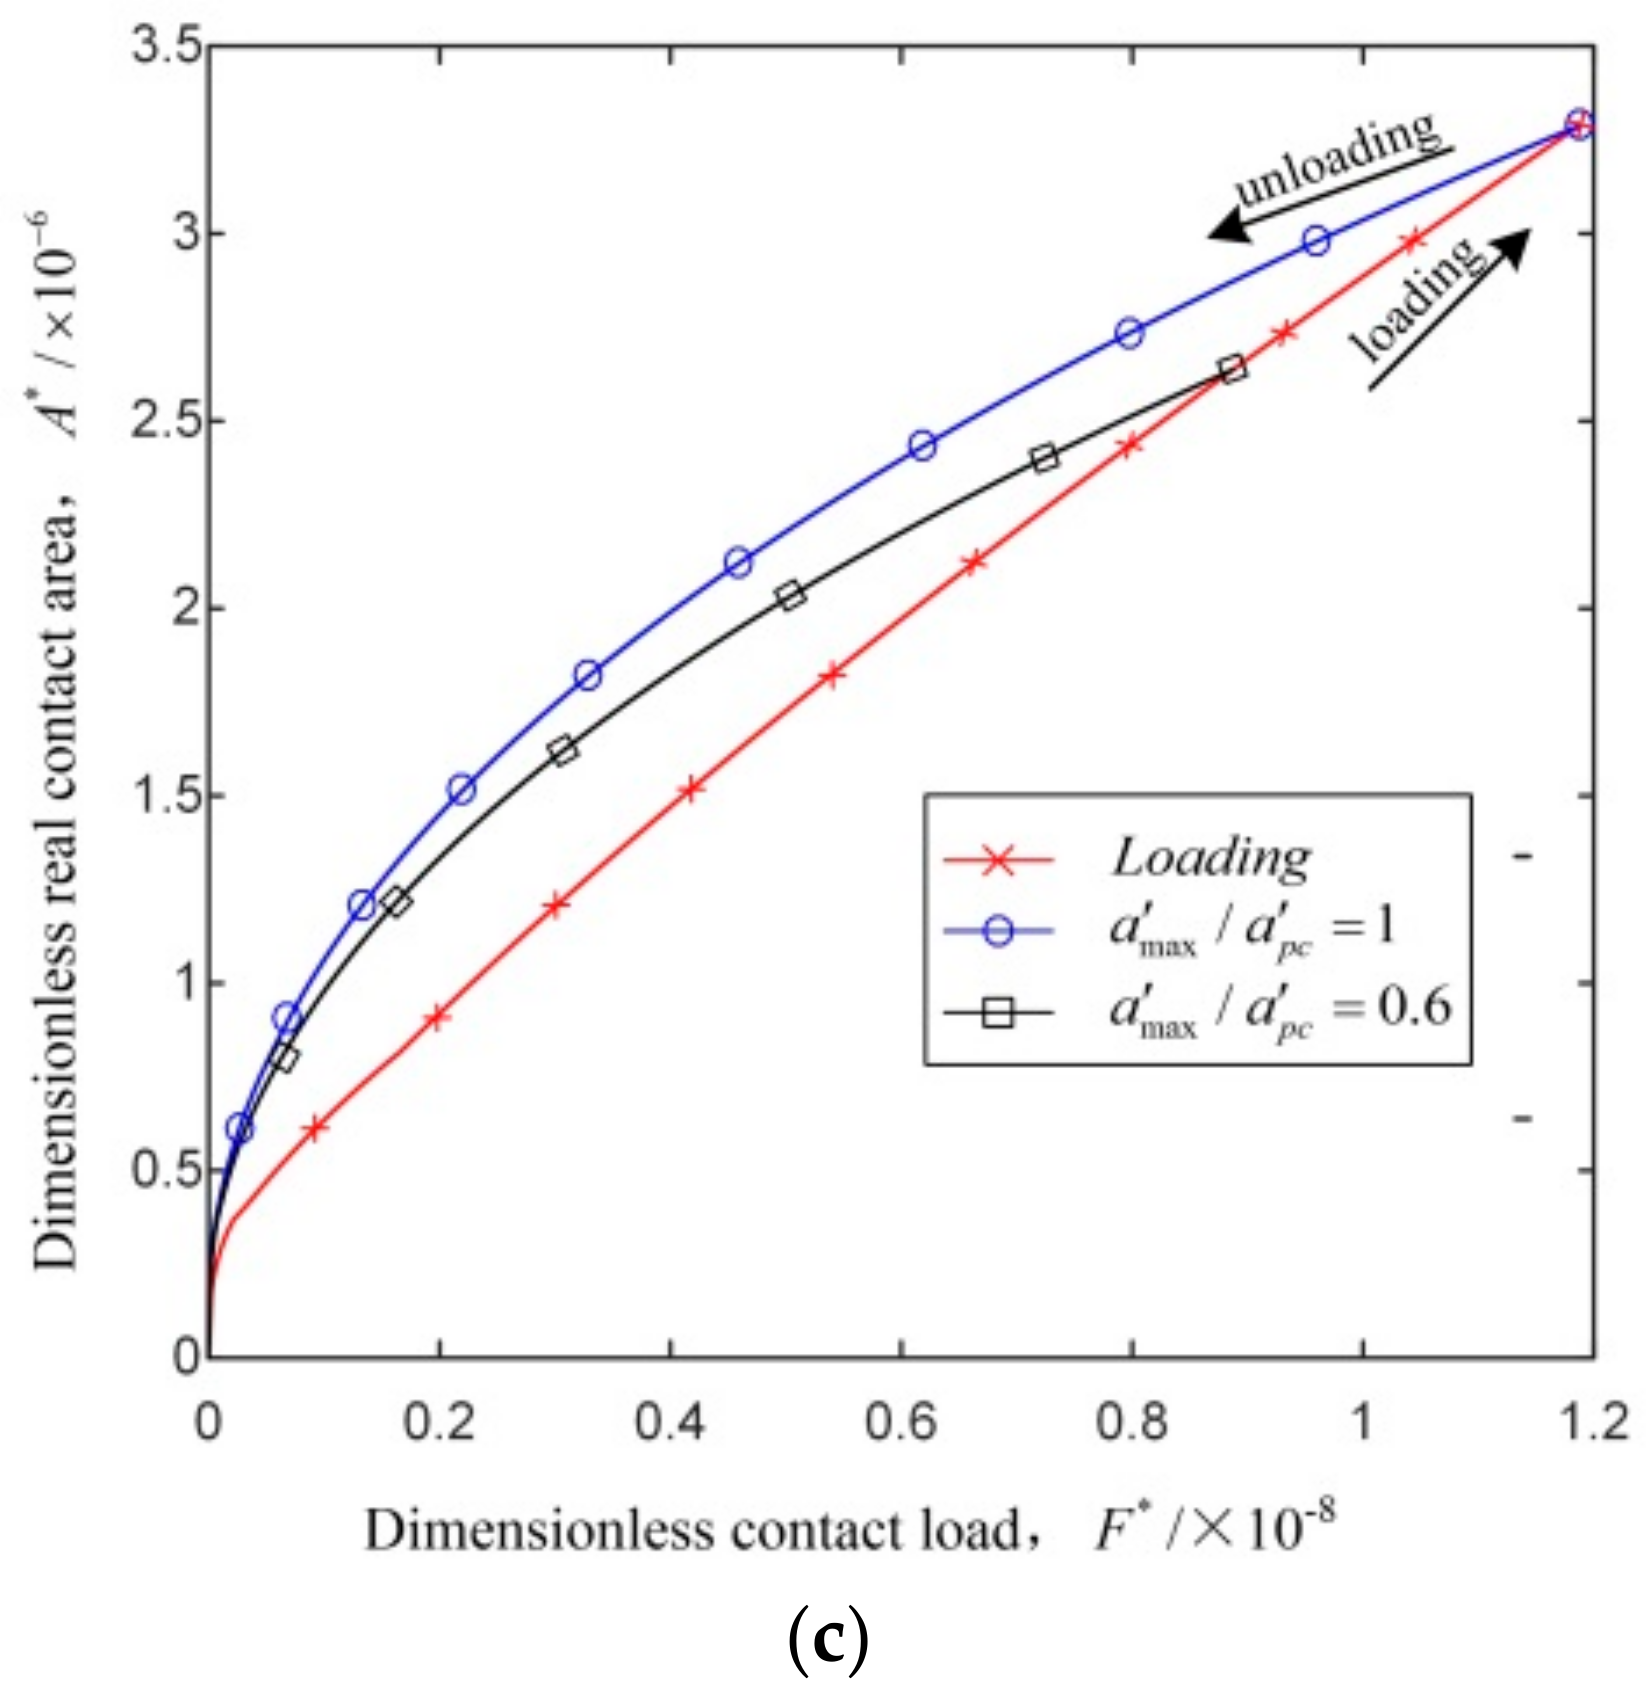
Figure 2b,c show the load–unload cycle in the first and second elastoplastic stage with the unloading points are 1.0 and 0.6 times of critical contact area. In the elastoplastic stage, the dimensionless real contact area in the unloading process is higher than that in the loading process with the same dimensionless contact load; the dimensionless real contact area of the unloading process, as well as the differences between the loading and unloading processes, increases with the loading interference. The reason is that asperities are in the elastoplastic deformation cannot fully recover in the unloading process and their curvature radius increases resulting in the adding of the contact area; the interference and quantity of asperities increase with the loading interference, leading to the further increase of the unrecoverable contact area.
The second elastoplastic stage is chosen to discuss the impacts of parameters and contact types in the model of the loading–unloading process of the two cylindrical surfaces.
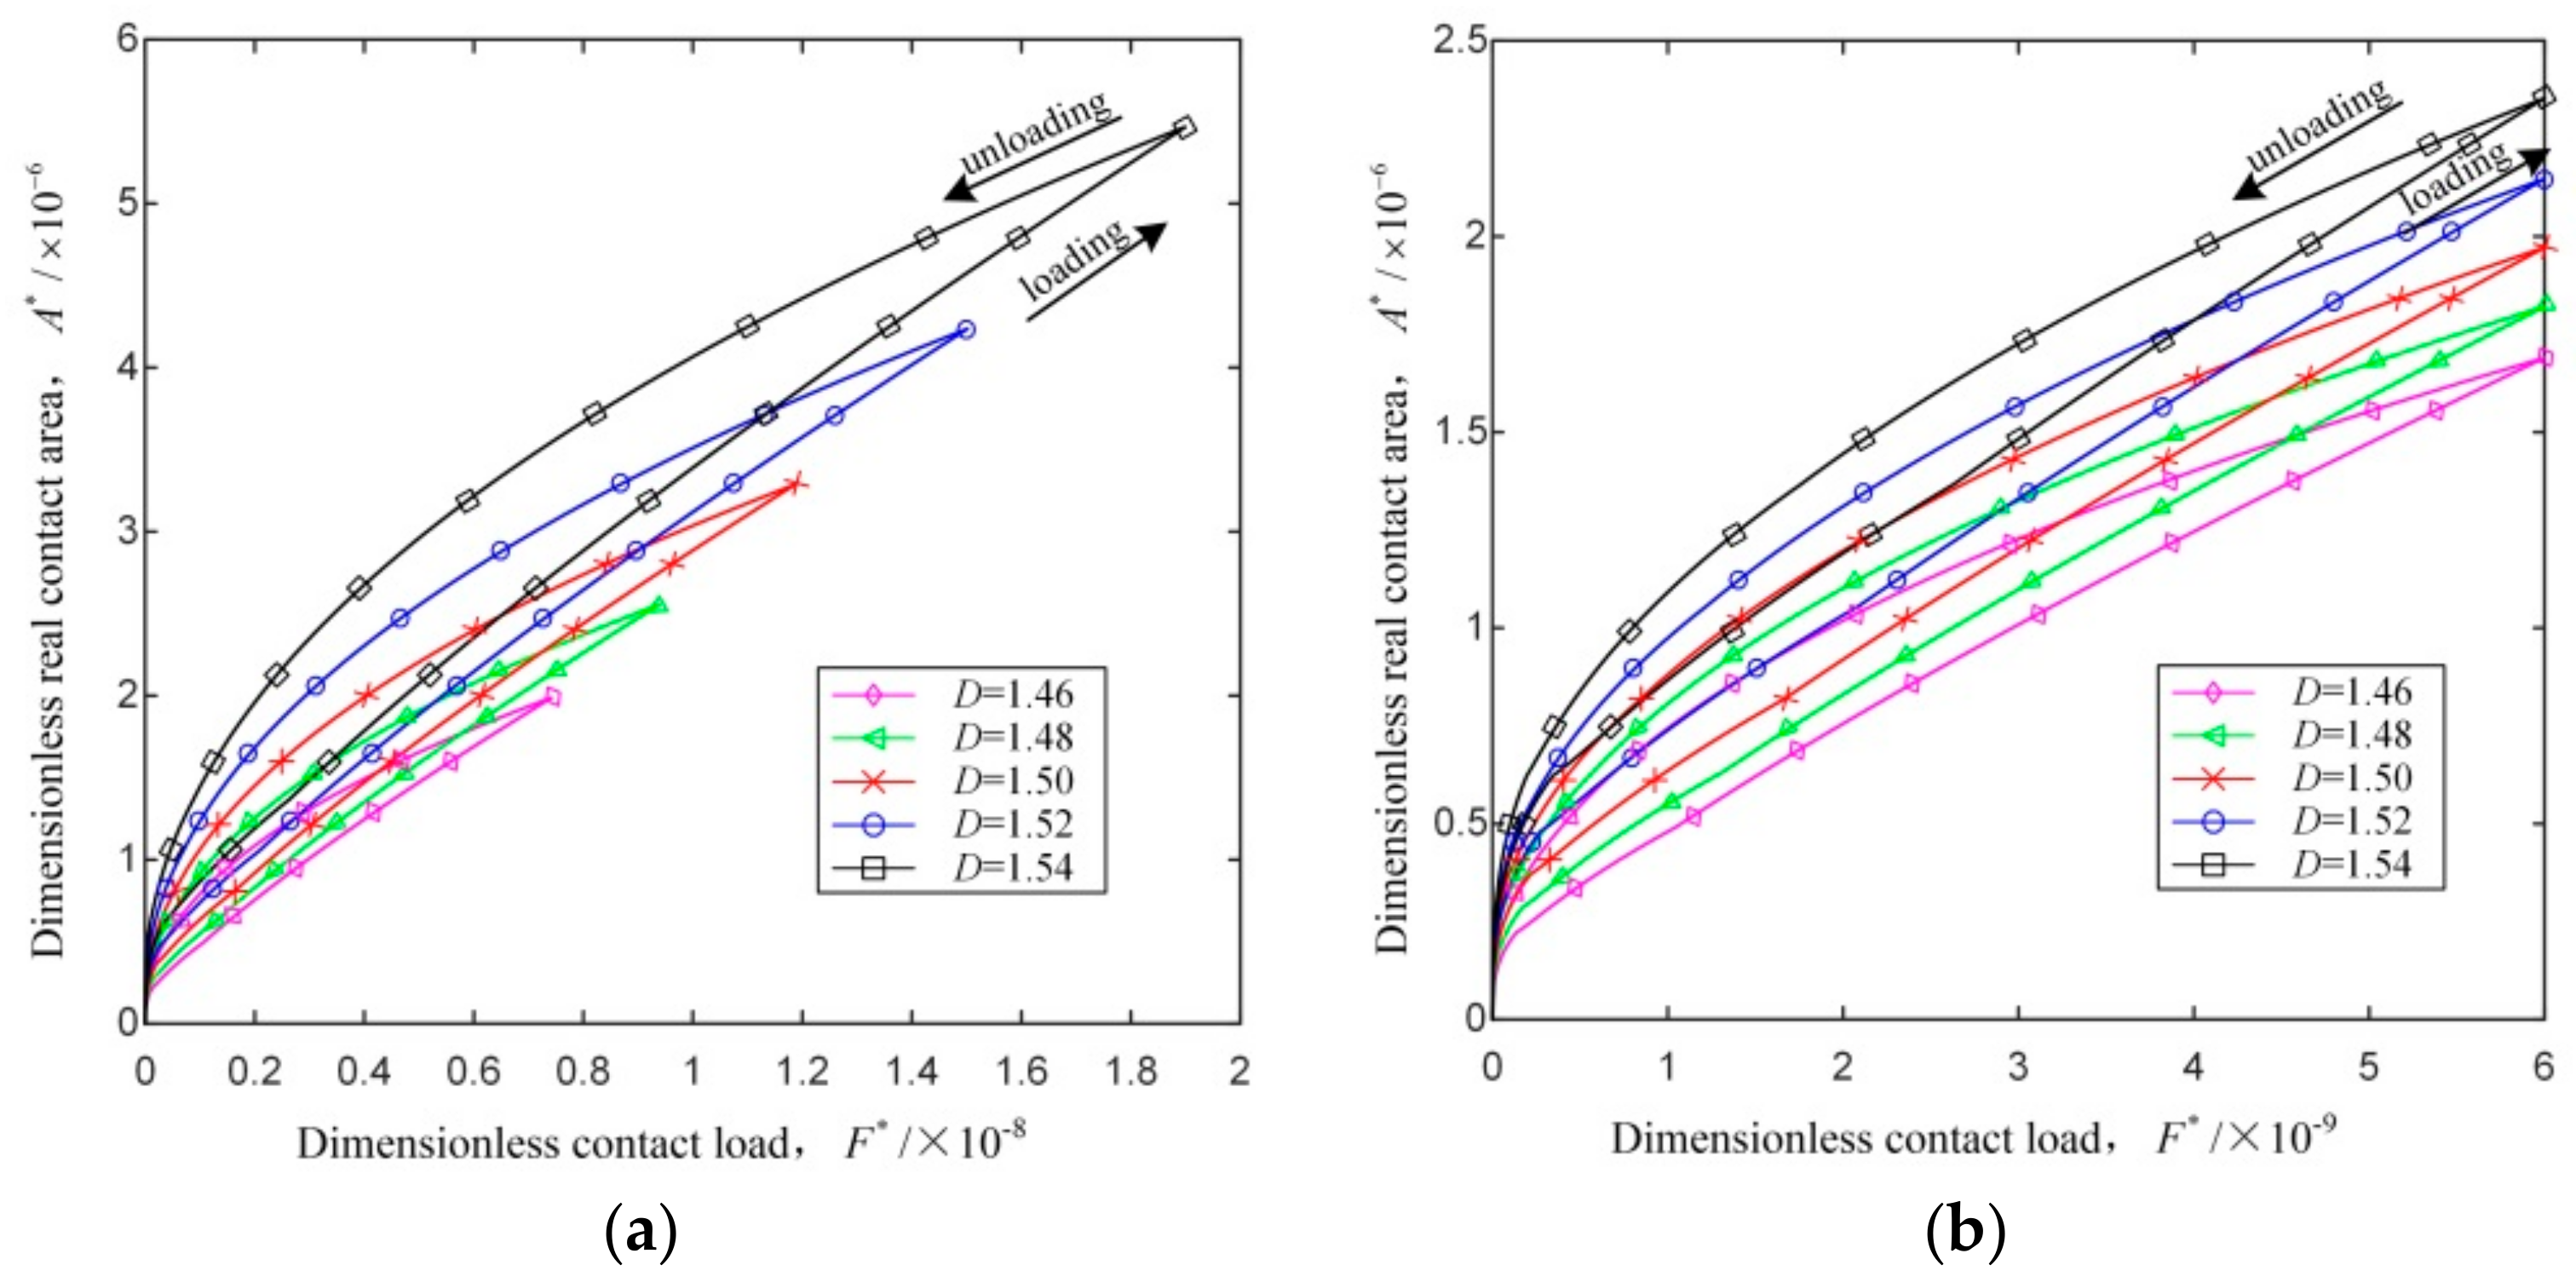
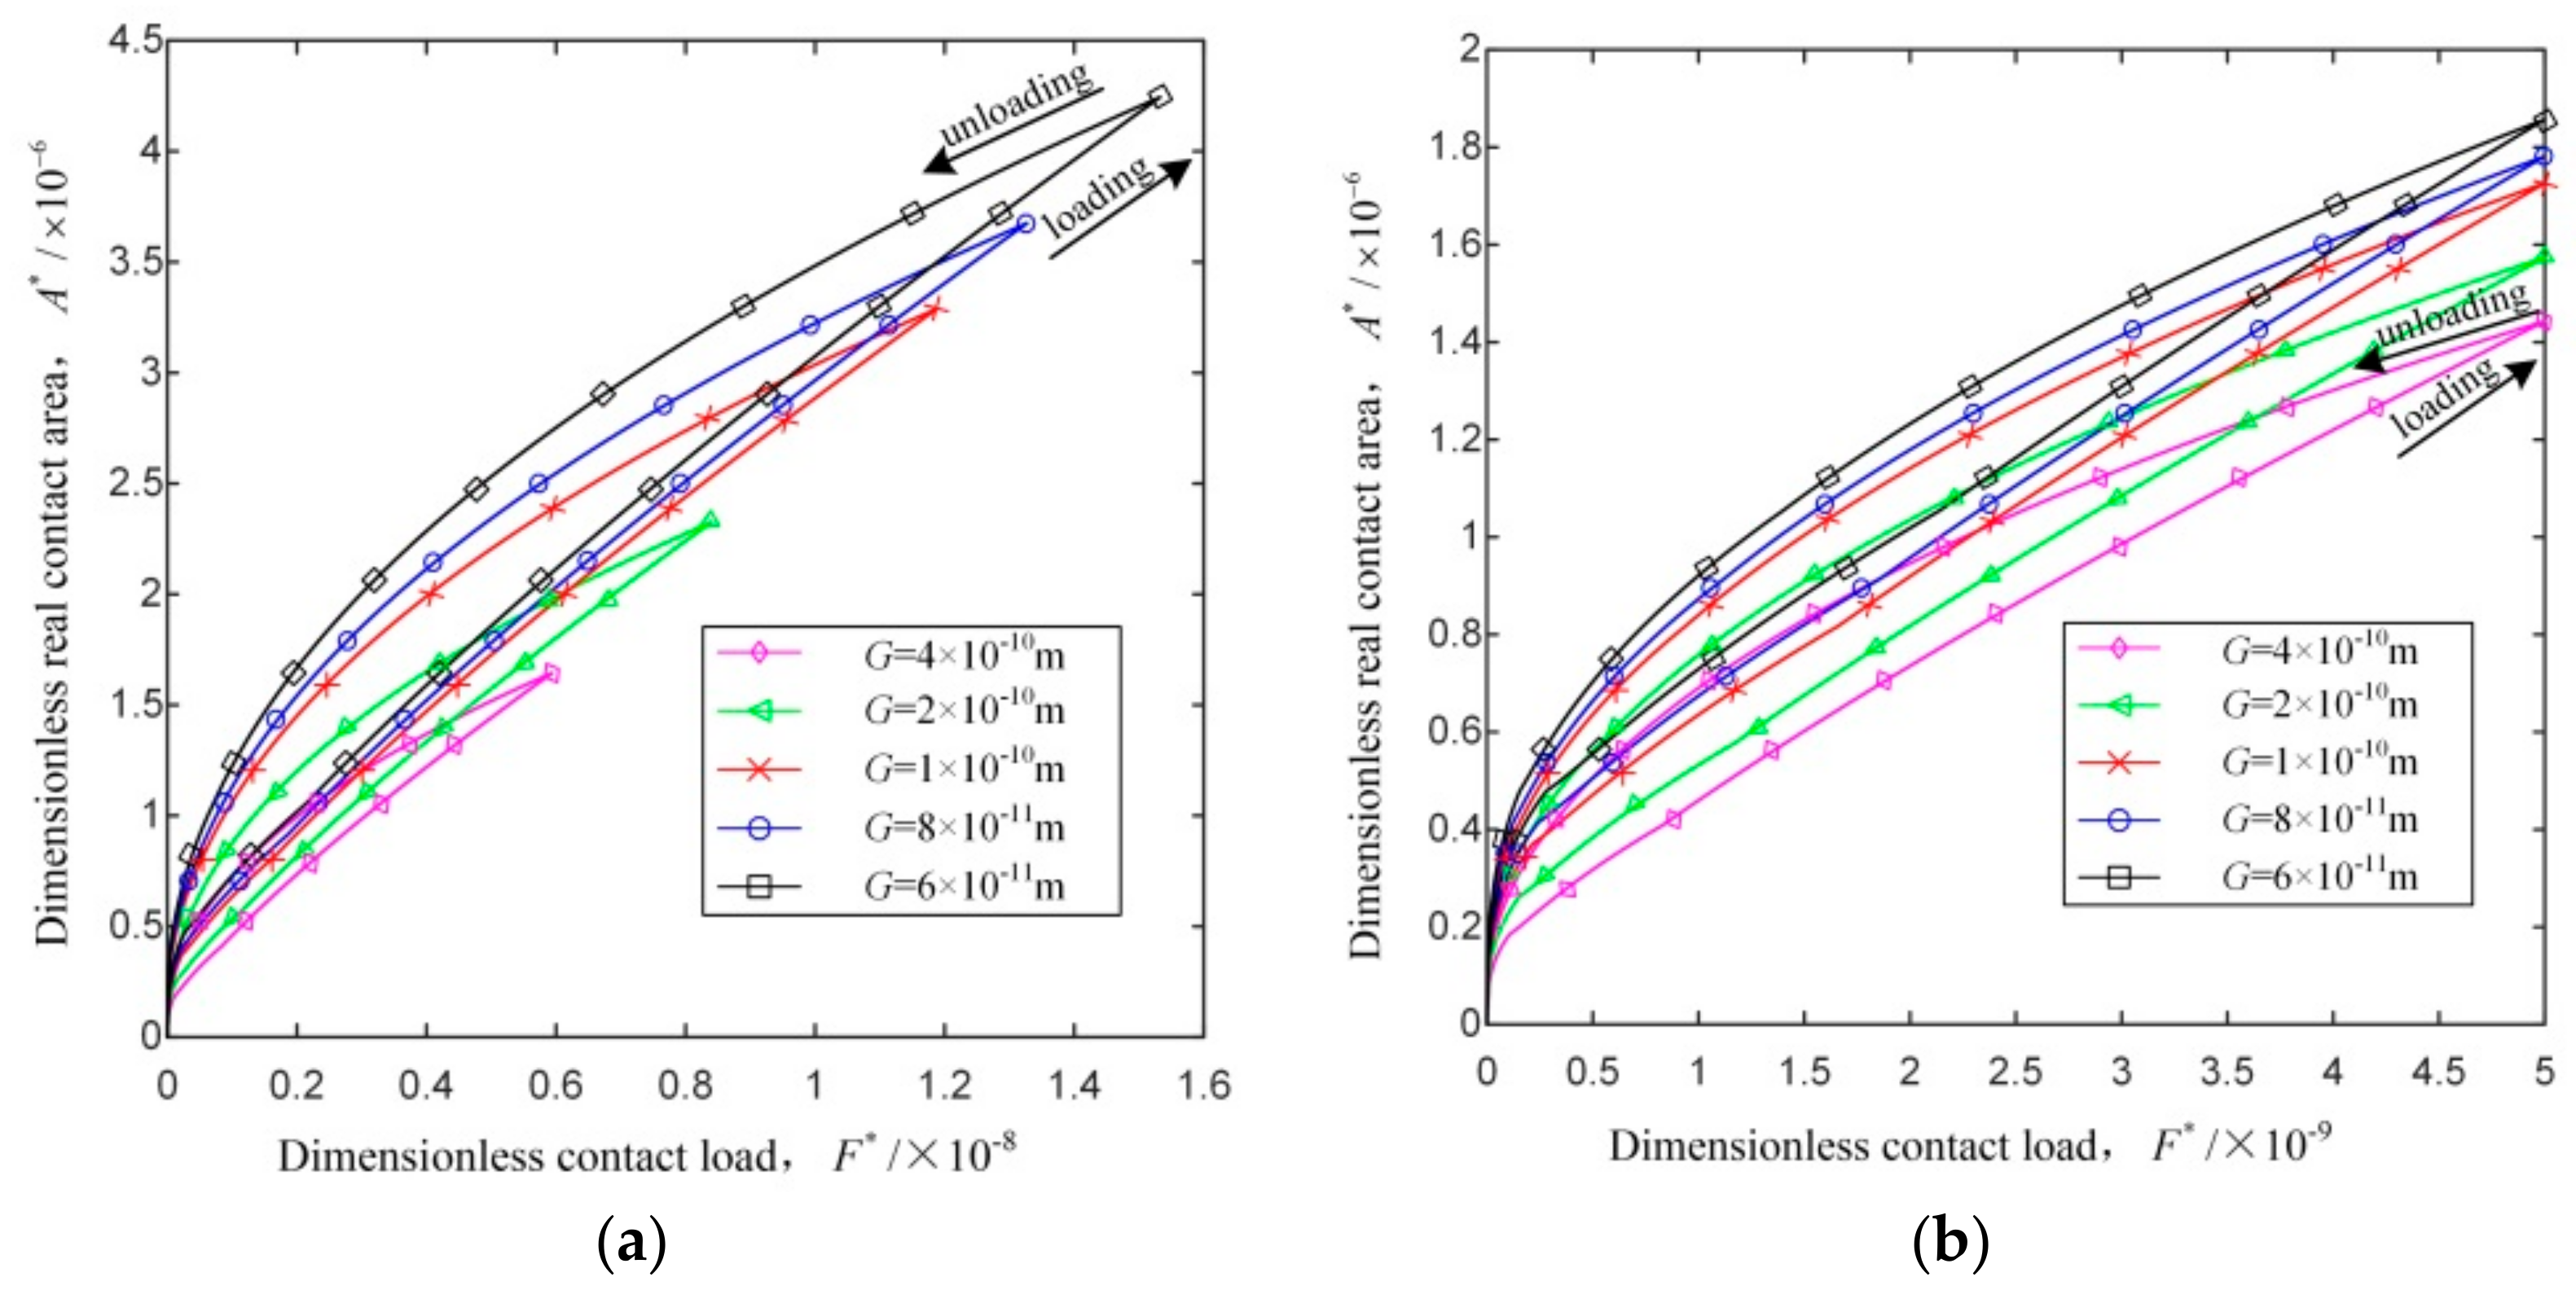
Figure 3 and Figure 4 show the dimensionless contact area-load relations of two cylindrical surfaces in the second elastoplastic stage with effects of fractal dimension D and profile scaling parameter G.
In each figure, (a) shows the unloading at the dimensionless critical contact load and (b) shows the unloading at a given dimensionless contact load.
The dimensionless critical real contact area and the dimensionless critical contact load increase with decrease of G or increase of D; for a given dimensionless contact load, the dimensionless real contact area, as well as the differences of the dimensionless real contact area between the loading and unloading processes, are positively related to D, and negatively correlated with G. The reason is that the roughness of surface decreases as G decreases [46], as well as D increases [29,47]. So it can be inferred that in the load–unload cycle in the elastoplastic stage, as the roughness of surface decreases, although the overall interference of asperities decreases, the quantity of asperities deformed increase rapidly which has a greater influence leading to the phenomenon shown in Figure 3 and Figure 4.
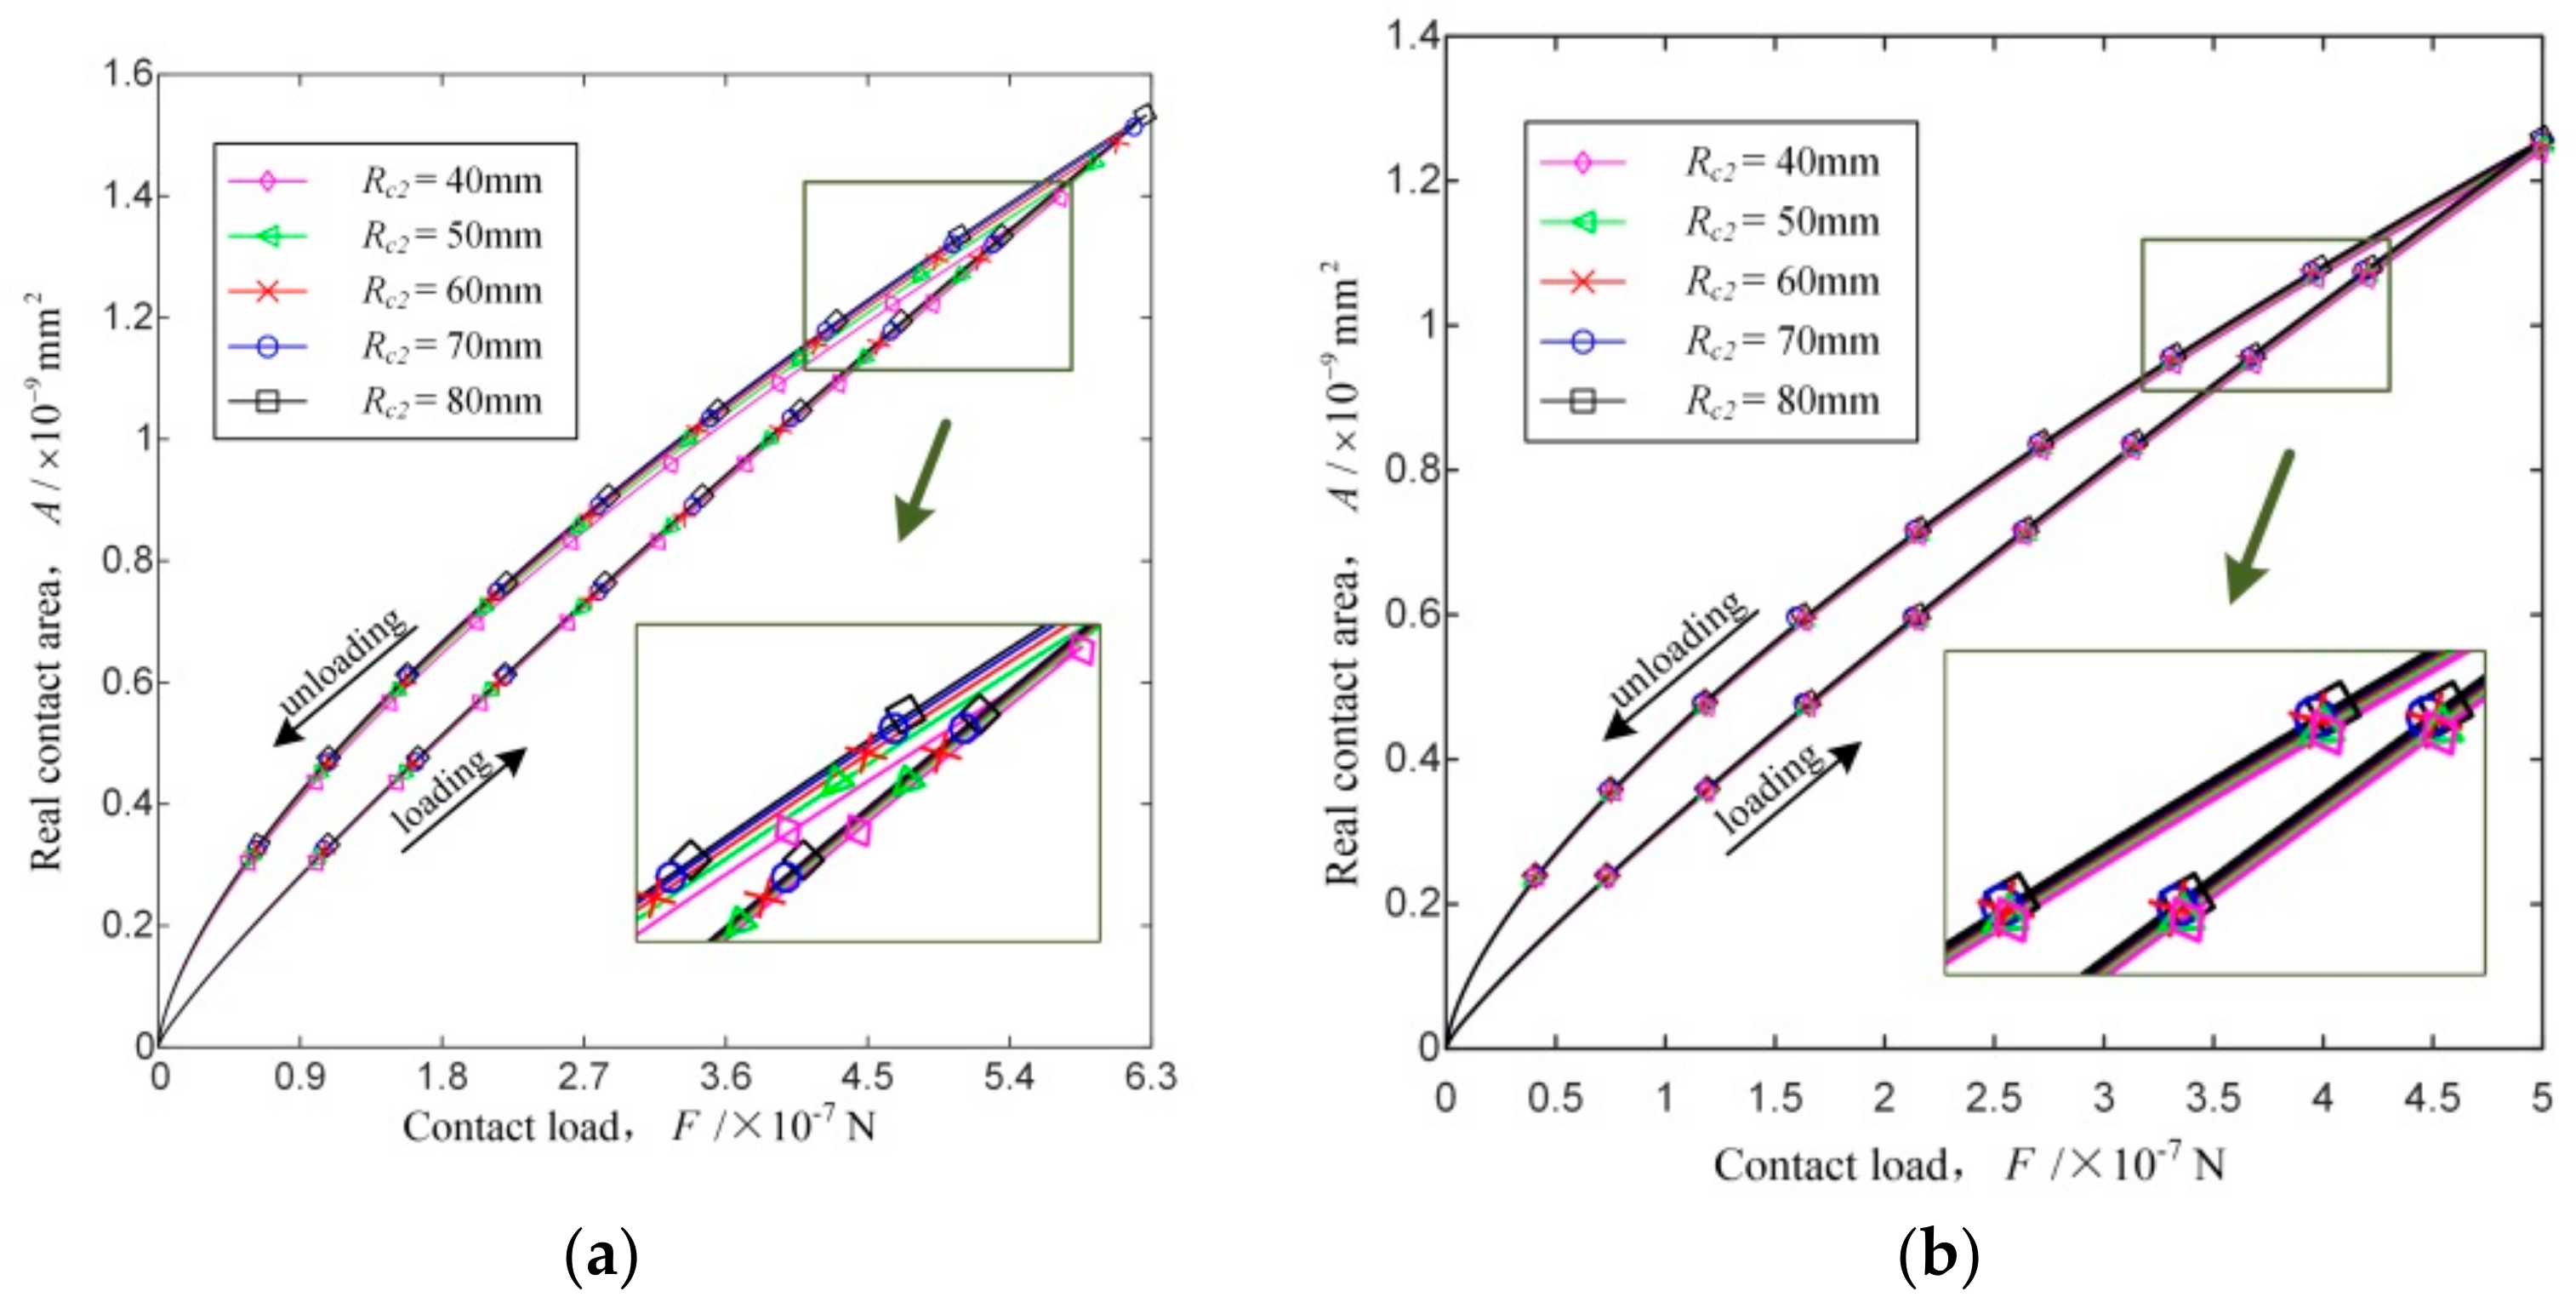
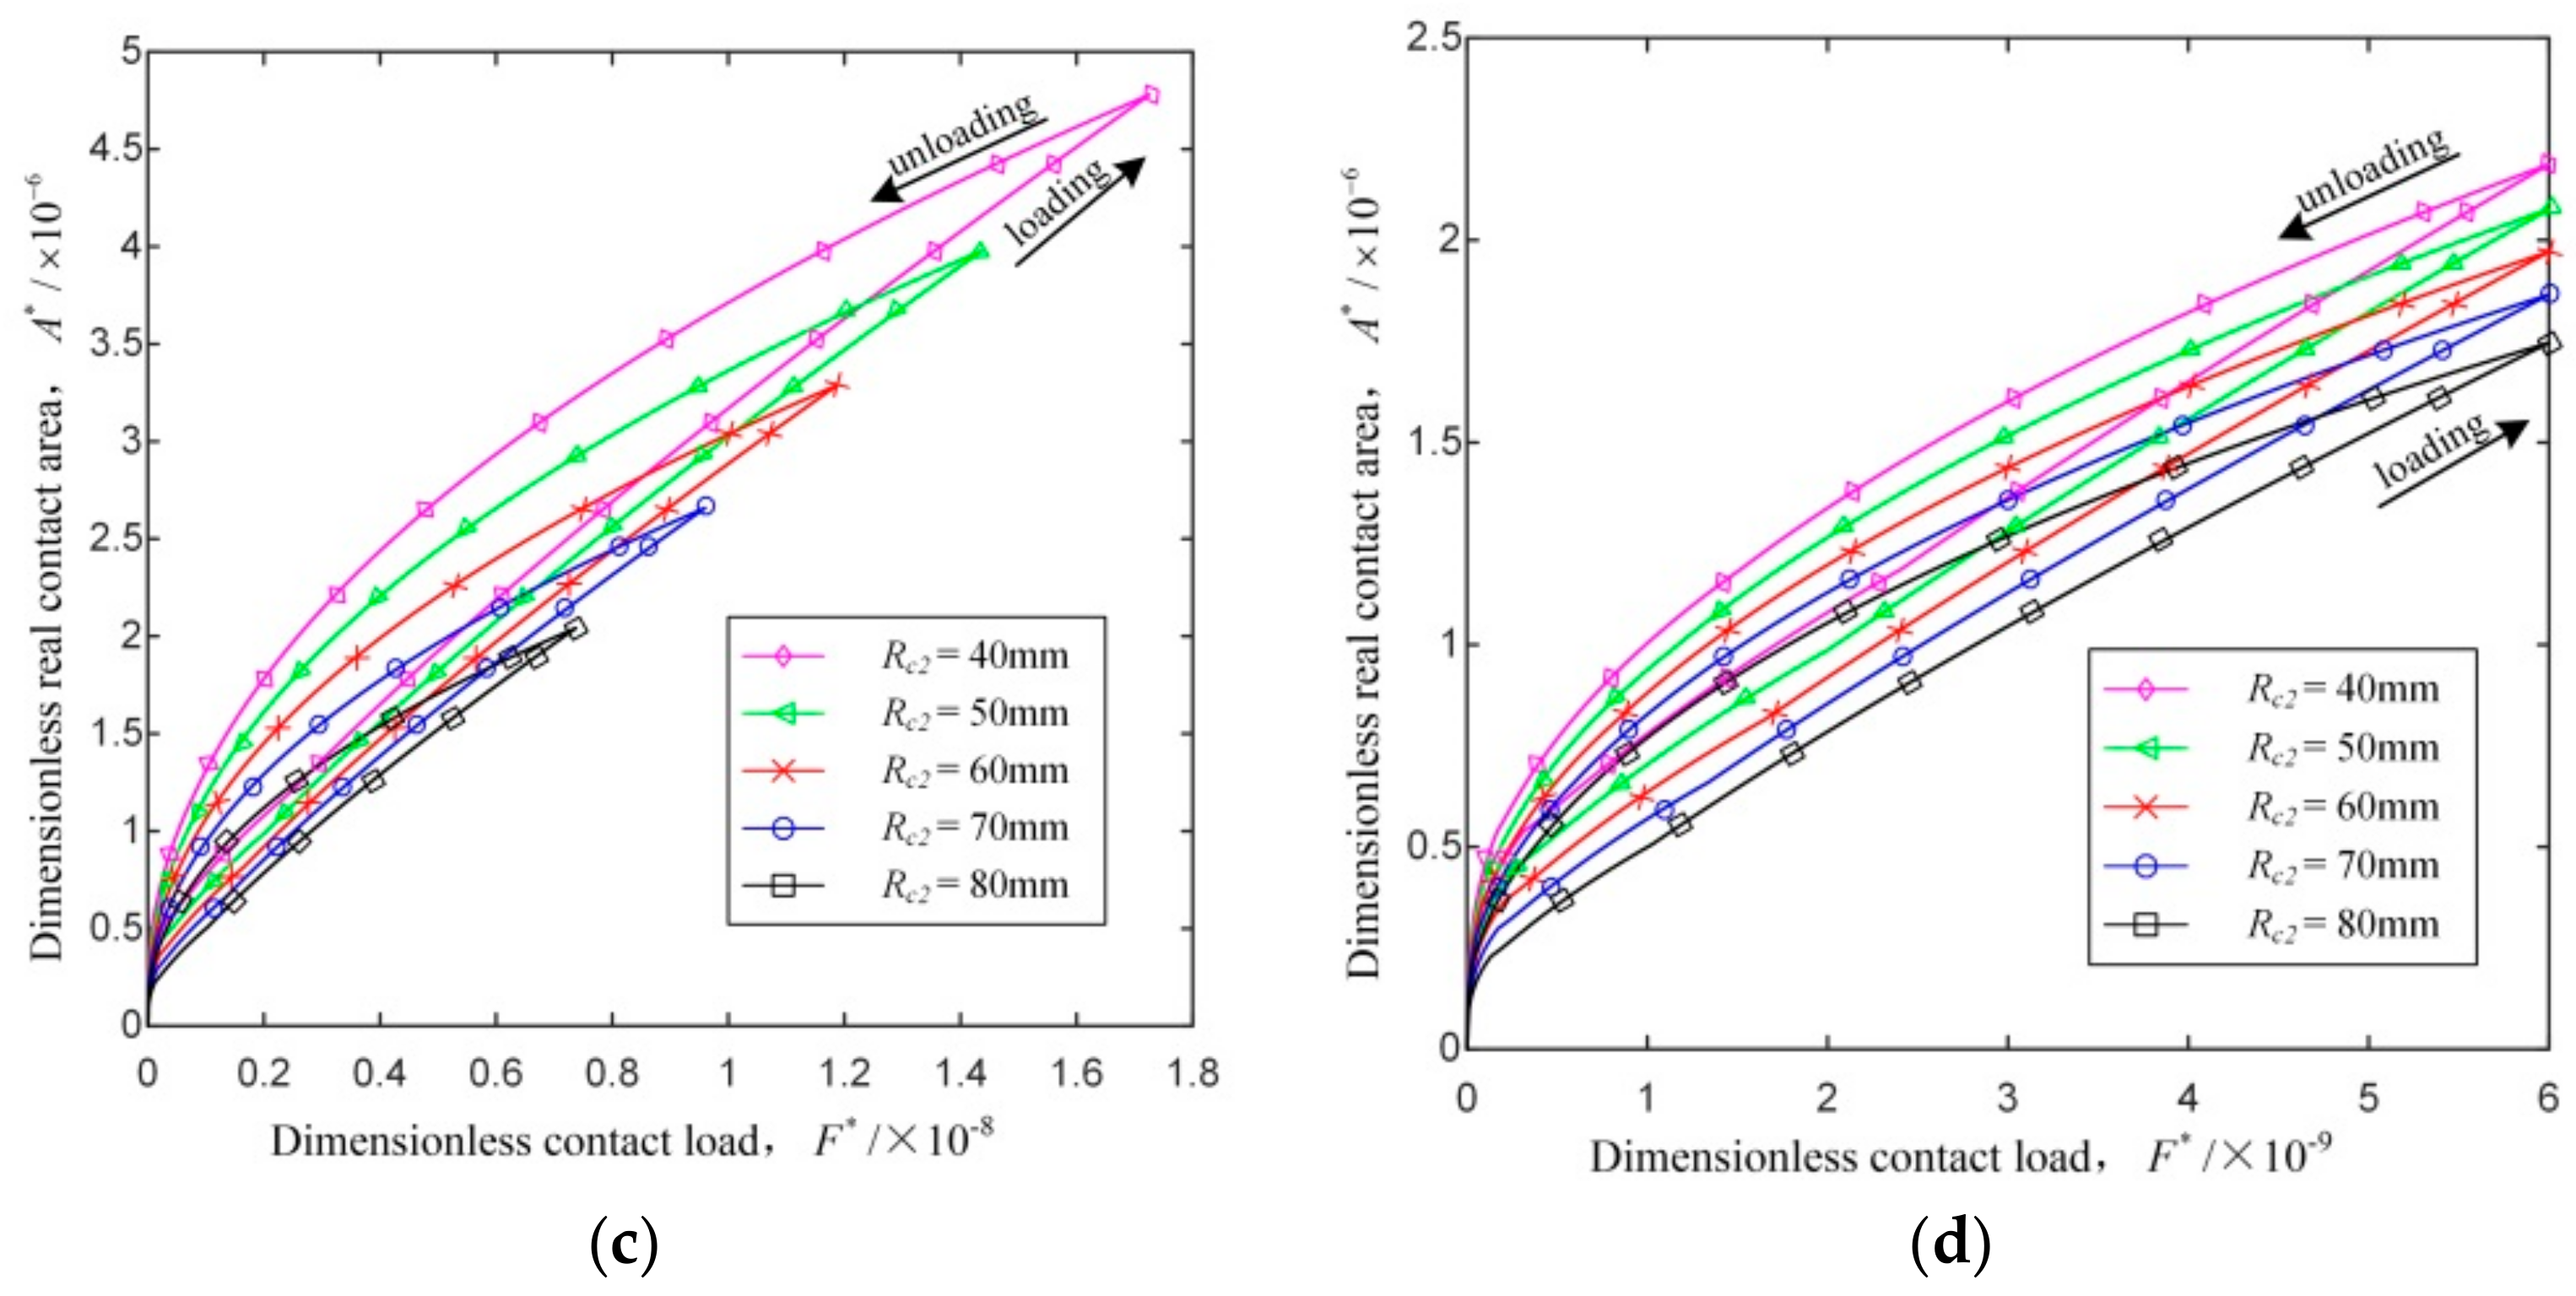
Figure 5 and Figure 6 show the load–unload cycle of two cylindrical surfaces in the second elastoplastic stage with different curvature radii Rc2 and contact types. In each figure, (a) shows the unloading at the dimensional critical contact load, (b) shows the unloading at a dimensional given contact load, (c) shows the unloading at the dimensionless critical contact load and (d) shows the unloading at a given dimensionless contact load.
As Rc2 increases, or internal contact replaces external contact, the dimensional critical real contact area and the dimensional critical contact load increase, while the dimensionless critical real contact area and the dimensionless critical contact load decrease; as Rc2 increases, or internal contact replaces external contact, the dimensional contact area of the loading–unloading process increases, as well as the differences of the dimensional contact area between the loading and unloading processes, for a given dimensional contact load; as Rc2 increases, or internal contact replaces external contact, the dimensionless real contact area of the loading–unloading process decreases, as well as the differences of the dimensionless real contact area between the loading and unloading processes, for a given dimensionless contact load.
For a load–unload cycle of two cylindrical surfaces, the effects of the curvature radius and the contact type on the dimensionless load-area relation are contrary to those on the dimensional load-area relation. The reason is that both A and A0 are influenced by Rc2 and the contact type. The contact load and the contact area are proportional to R in contact theory. According to Equation (48), it is obvious that R increase with Rc2 when Rc1 is constant, and R of internal contact is greater than that of external contact. Therefore, the conclusion from Figure a,b of each figure is convincible.
According to Equation (52), it is obvious that A0 increase with Rc2 when Rc1 is constant, and A0 of internal contact is greater than that of external contact. From Figure a,b of each figure, it can be found that Rc2 and contact type have little effect on the real contact area. Because the real contact area between two surfaces is much smaller than the nominal contact area, so A0 has a greater influence on the tendency of the dimensionless contact area and load. Therefore, the conclusion from Figure c,d of each figure is believable.

4.3. Model Comparison

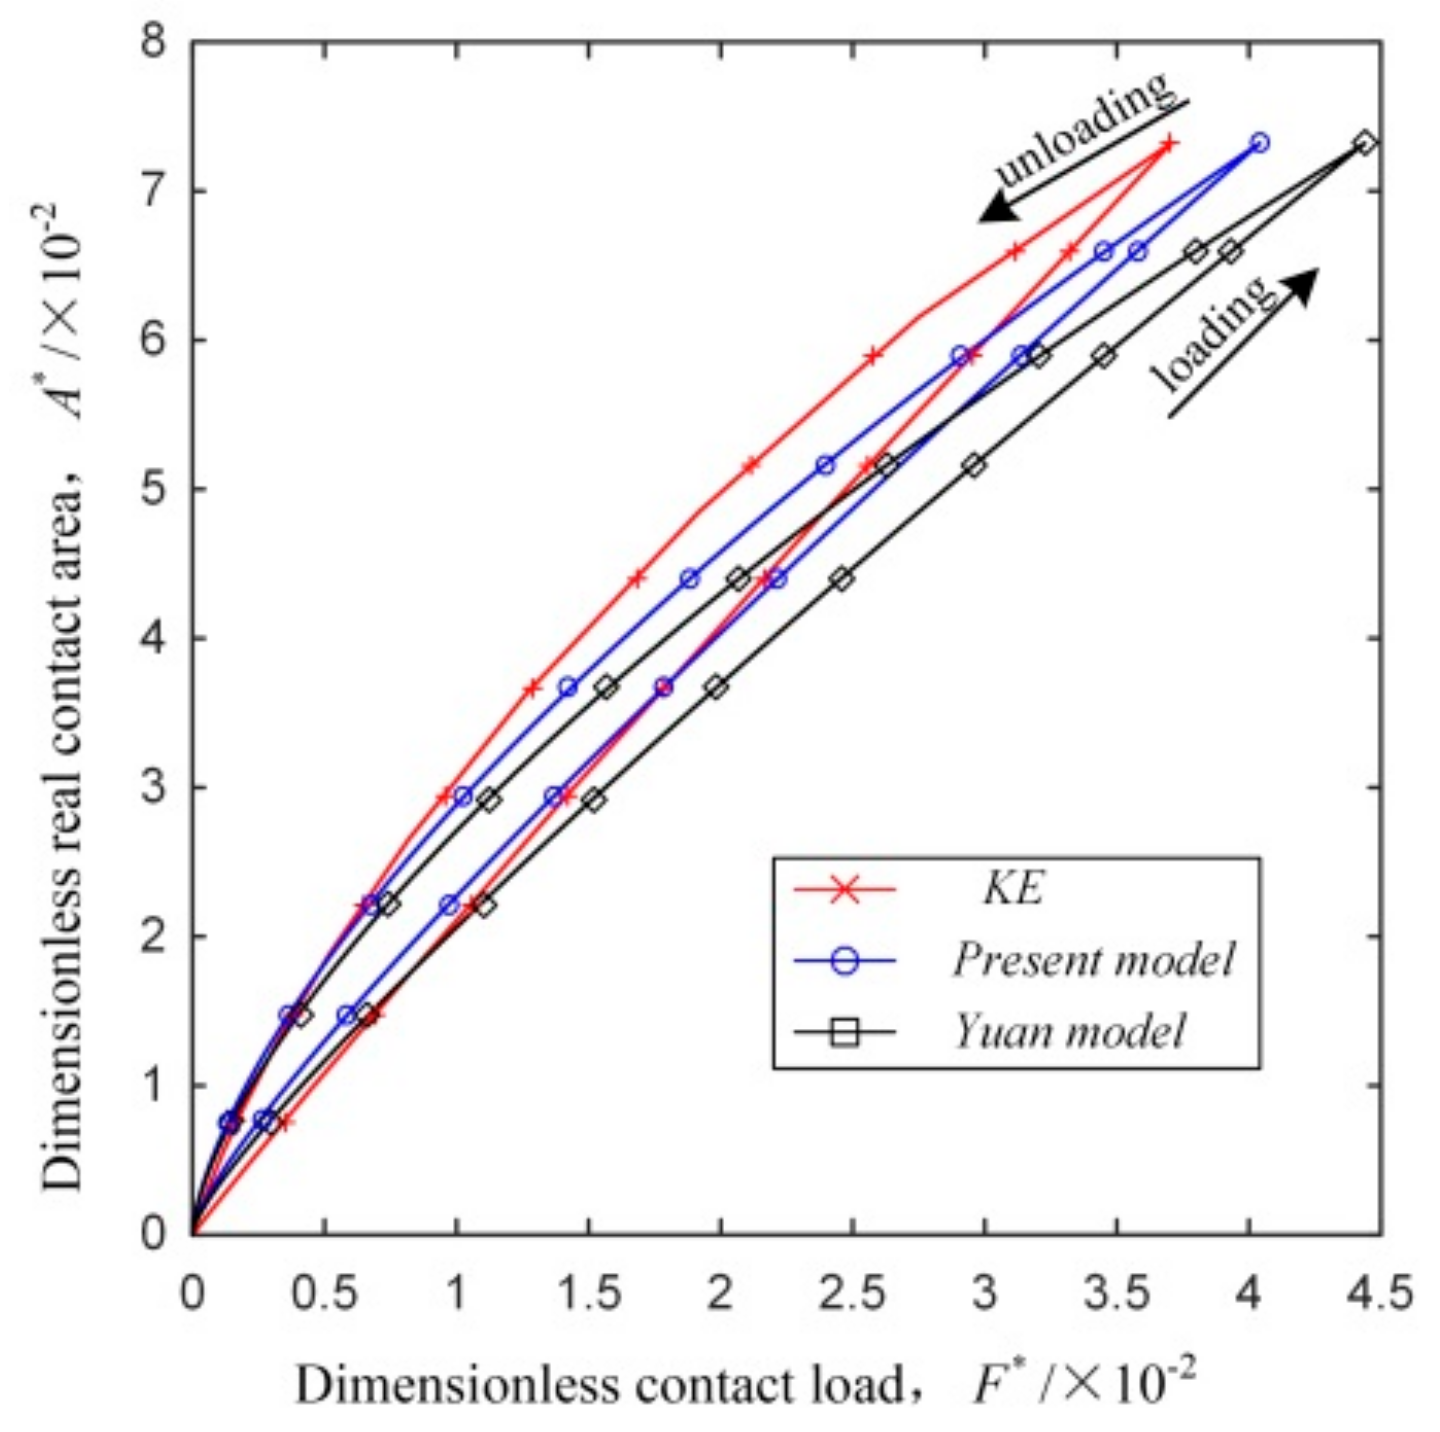
The classical KE model [7] and the Yuan model [39] are the available models for loading and unloading contact process and limited to planar surfaces.
The proposed contact model can be used for the contact of planar surfaces supposing the radius of cylindrical surfaces is infinite.
To ensure the credibility of the comparison, some parameters of KE model have been adopted include E / σ Y = 950 , ν = 0.3 , the plasticity index ψ = 2 , H = 2.8 σ Y , the roughness parameter β = 0.05 , and A * = A / A n = 0.0732 (dm = 0 in KE statistical model). Further, fractal parameters are D = 1.45 and G = 10−10 m.
Figure 7 shows the comparison of the present model, KE model and Yuan model on load-area relation. The calculation results of the present model, KE model and Yuan model have the same trend which shows the feasibility of the model. In loading process, the dimensionless real contact area of present model is greater than that of KE model with F* ≤ 1.786. In the unloading process, the dimensionless real contact area of present model is greater than that of KE model with F* ≤ 0.487. Further, compared with the Yuan model, the present model is closer to KE model with the same fractal parameters.
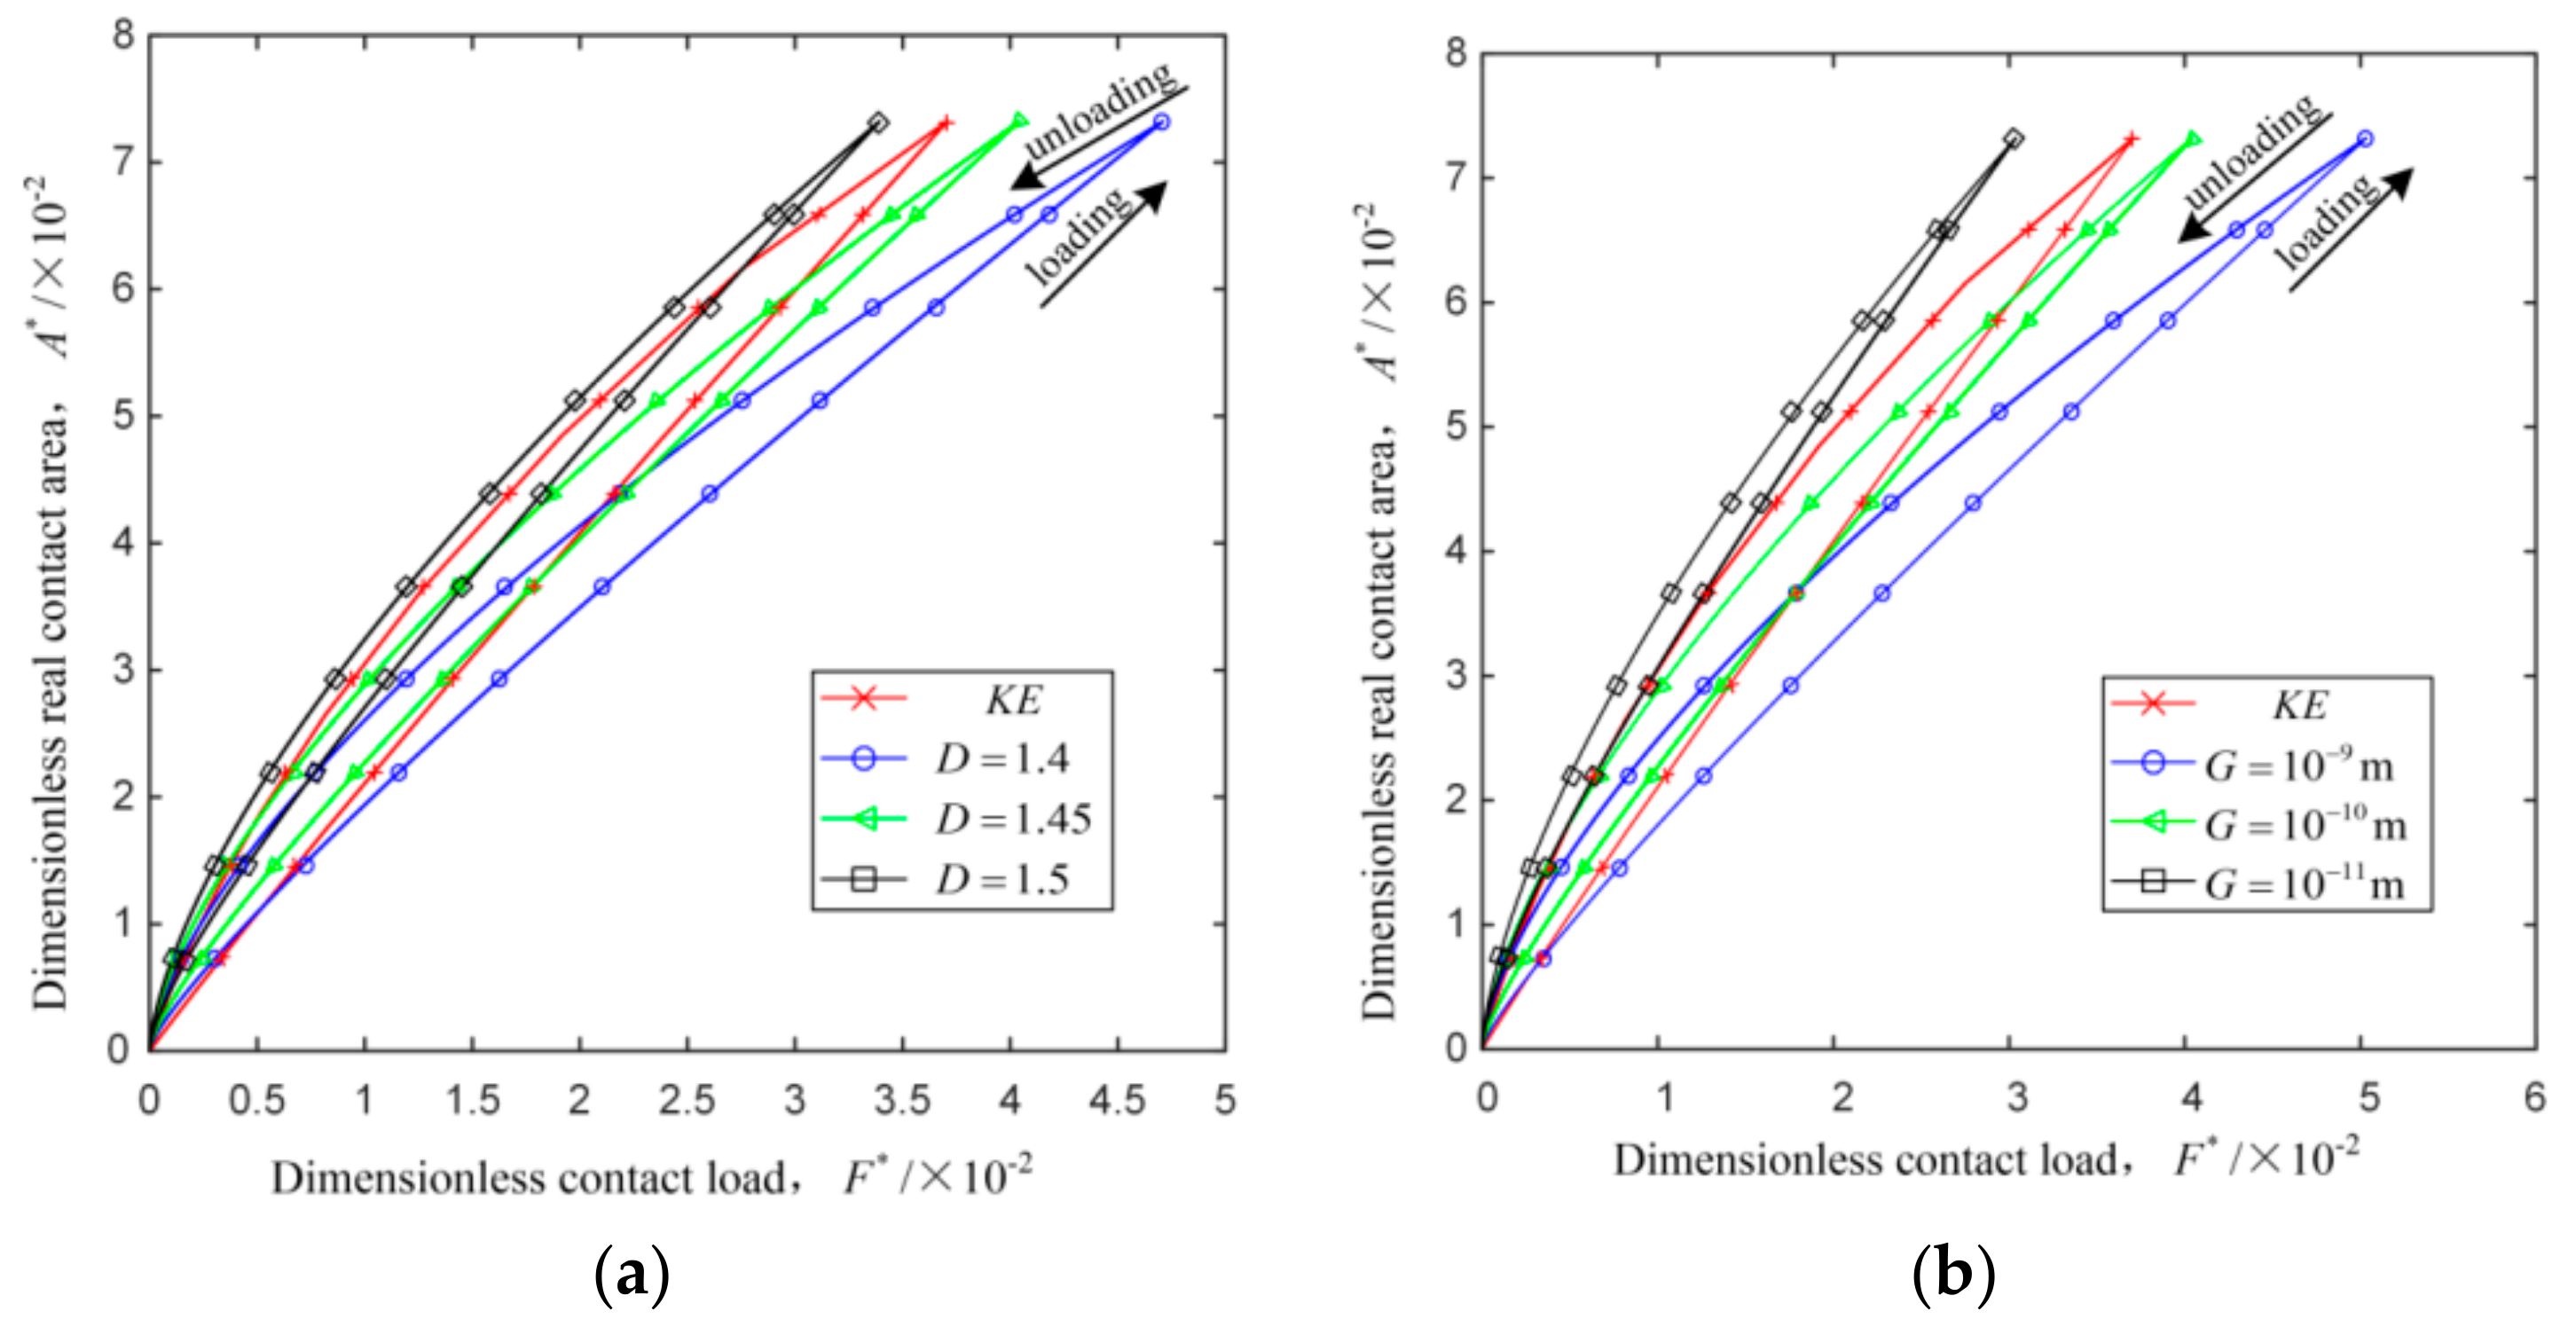
For further analyzing the correlation between the present model and KE model, the relation between the dimensionless contact area and dimensionless contact load is plotted in Figure 8 with G = 10−10 m and 1.4 ≤ D ≤ 1.5 in Figure 8a, D = 1.45 and 10−11 m ≤ G ≤ 10−9 m in Figure 8b. The trend of the dimensionless contact area in loading and unloading process with different fractal parameters agrees with the KE model. The results of the two models are difficult to perfectly coincide with each other, as shown in Figure 8, as the statistical model adopts the Gauss distribution function of asperities height, and the fractal model adopts the size distribution function of asperities. Further, the fractal dimension D and the profile scaling parameter G are not involved in the statistical model, the coincidence of calculation results is affected to some extent. In conclusion, the calculation result of the present model has the same trend with the statistical result. When D = 1.45, G = 10−10 m, the calculation result in the model proposed is close to that of KE model, which shows the validity of the model.

5. Conclusions

This paper developed the first fractal model of the loading–unloading process for cylindrical contact surface with friction in different deformation stages. The loading–unloading contact model for single asperity with friction were obtained firstly, and then deduced the loading–unloading contact model between two cylindrical surfaces with friction. Based on numerical results with MATLAB, the trend of the loading–unloading contact performance between two cylindrical surfaces with friction were obtained by changing the fractal dimension D, the profile scaling parameter G, the curvature radius Rc2 and the contact type. The following conclusions can be drawn:
  • The dimensionless real contact area of the loading–unloading process increases with the dimensionless contact load. In the elastic stage, the unloading process is the same with the loading one. In the elastoplastic stage, the dimensionless real contact area of the unloading process is greater than that of the loading process for a given dimensionless contact load; the dimensionless real contact area of the unloading process, as well as the differences of the dimensionless real contact area between the loading and unloading processes, increase with the loading interference.
  • The dimensionless critical real contact area and the dimensionless critical contact load increase with the increase of the fractal dimension, decrease of the profile scaling parameter and the curvature radius, or the substitution of external contact for internal contact.
  • In the elastoplastic stage, for a given dimensionless contact load, the dimensionless real contact area of the loading-unloading process of cylindrical contact surface with friction, as well as the differences of the dimensionless real contact area between the loading and unloading processes, increase with the increase of the fractal dimension, decrease of the profile scaling parameter and the curvature radius, or the substitution of external contact for internal contact.

Author Contributions

Conceptualization, H.W., P.J. and M.L.; methodology, H.W. and M.L.; writing—original draft preparation, H.W., P.J., L.W. and G.W.; writing—review and editing, P.J., F.Y., M.L. and X.W.; visualization, L.W. and X.W.; supervision, P.J. and L.W.; funding acquisition, P.J., L.W., F.Y. and G.W. All authors have read and agreed to the published version of the manuscript.

Funding

This research was funded by the National Key Research and Development Program of China, grant number 2018YFC0310500; the High-Tech Ship Research Projects sponsored by the Ministry of Industry and Information Technology, grant number 2018GXB01; Fundamental Research Funds for the Central Universities, grant number 3072019CF0705; Yantai Special Fund for School Land Integration Development (development and test platform of subsea production system), grant number 2019-105-13; National Natural Science Foundation of China, grant number 51779064; the Science and Technology Projects Sponsored by the West Coast of Qingdao New District, grant number 2019-157-2018-1-1.

Conflicts of Interest

The authors declare no conflicts of interest.

References

  1. Greenwood, J.A.; Williamson, J.B.P. Contact of nominally flat surfaces. Proc. R. Soc. A 1966, 295, 300–319. [Google Scholar] [CrossRef]
  2. Greenwood, J.A.; Tripp, J.H. The elastic contact of rough spheres. J. Appl. Mech. 1967, 34, 153–159. [Google Scholar] [CrossRef]
  3. Greenwood, J.A.; Tripp, J.H. The contact of two nominally flat rough surfaces. Proc. Inst. Mech. Eng. 1970, 185, 625–634. [Google Scholar] [CrossRef]
  4. Chang, W.R.; Etsion, I.; Bogy, D.B. An elastic-plastic model for the contact of rough surfaces. J. Tribol. 1987, 109, 257–263. [Google Scholar] [CrossRef]
  5. Kogut, L.; Etsion, I. Elastic-plastic contact analysis of a sphere and a rigid flat. J. Appl. Mech. 2002, 69, 657–662. [Google Scholar] [CrossRef] [Green Version]
  6. Etsion, I.; Kligerman, Y.; Kadin, Y. Unloading of an elastic–plastic loaded spherical contact. Int. J. Solids Struct. 2005, 42, 3716–3729. [Google Scholar] [CrossRef]
  7. Kadin, Y.; Kligerman, Y.; Etsion, I. Unloading an elastic–plastic contact of rough surfaces. J. Mech. Phys. Solids 2006, 54, 2652–2674. [Google Scholar] [CrossRef]
  8. Xu, Y.; Jackson, R.L.; Marghitu, D.B. Statistical model of nearly complete elastic rough surface contact. Int. J. Solids Struct. 2014, 51, 1075–1088. [Google Scholar] [CrossRef] [Green Version]
  9. Shi, J.; Cao, X.; Hu, Y.; Zhu, H. Statistical analysis of tangential contact stiffness of joint surfaces. Arch. Appl. Mech. 2015, 85, 1997–2008. [Google Scholar] [CrossRef]
  10. Song, H.; Vakis, A.I.; Liu, X.; Van der Giessen, E. Statistical model of rough surface contact accounting for size-dependent plasticity and asperity interaction. J. Mech. Phys. Solids 2017, 106, 1–14. [Google Scholar] [CrossRef] [Green Version]
  11. Kogut, L.; Etsion, I. A semi-analytical solution for the sliding inception of a spherical contact. J. Tribol. 2003, 125, 499–506. [Google Scholar] [CrossRef]
  12. Kogut, L.; Etsion, I. A Static friction model for elastic-plastic contacting rough surfaces. J. Tribol. 2004, 126, 34–40. [Google Scholar] [CrossRef]
  13. Brizmer, V.; Kligerman, Y.; Etsion, I. Elastic-plastic spherical contact under combined normal and tangential loading in full stick. Tribol. Lett. 2007, 25, 61–70. [Google Scholar] [CrossRef]
  14. Brizmer, V.; Kligerman, Y.; Etsion, I. The effect of contact conditions and material properties on the elasticity terminus of a spherical contact. Int. J. Solids Struct. 2006, 43, 5736–5749. [Google Scholar] [CrossRef] [Green Version]
  15. Brizmer, V.; Zait, Y.; Kligerman, Y.; Etsion, I. The effect of contact conditions and material properties on elastic-plastic spherical contact. J. Mech. Mater. Struct. 2006, 1, 865–879. [Google Scholar] [CrossRef] [Green Version]
  16. Cohen, D.; Kligerman, Y.; Etsion, I. A model for contact and static friction of nominally flat rough surfaces under full stick contact condition. J. Tribol. 2008, 130. [Google Scholar] [CrossRef]
  17. Cohen, D.; Kligerman, Y.; Etsion, I. The effect of surface roughness on static friction and junction growth of an elastic-plastic spherical contact. J. Tribol. 2009, 131. [Google Scholar] [CrossRef]
  18. Li, L.; Etsion, I.; Talke, F. Contact area and static friction of rough surfaces with high plasticity index. J. Tribol. 2010, 132. [Google Scholar] [CrossRef]
  19. Wang, X.; Xu, Y.; Jackson, R.L. Theoretical and finite element analysis of static friction between multi-scale rough surfaces. Tribol. Lett. 2018, 66, 146. [Google Scholar] [CrossRef]
  20. Zheng, X.; Yu, Y. A static friction model for elastic-plastic contacting surfaces using statistically homogenized technique. J. Phys. 2019, 1215. [Google Scholar] [CrossRef]
  21. Etsion, I. Comment on Leonardo da Vinci’s friction experiments: An old story acknowledged and repeated. Tribol. Lett. 2015, 58, 33. [Google Scholar] [CrossRef]
  22. Majumdar, A.; Bhushan, B. Fractal model of elastic-plastic contact between rough surfaces. J. Tribol. 1991, 113, 1–11. [Google Scholar] [CrossRef]
  23. Yan, W.; Komvopoulos, K. Contact analysis of elastic-plastic fractal surfaces. J. Appl. Phys. 1998, 84, 3617–3624. [Google Scholar] [CrossRef]
  24. Gao, Y.; Bower, A. Elastic-plastic contact of a rough surface with Weierstrass profile. Proc. R. Soc. A 2006, 462, 319–348. [Google Scholar] [CrossRef]
  25. Morag, Y.; Etsion, I. Resolving the contradiction of asperities plastic to elastic mode transition in current contact models of fractal rough surfaces. Wear 2007, 262, 624–629. [Google Scholar] [CrossRef]
  26. Miao, X.; Huang, X. A complete contact model of a fractal rough surface. Wear 2014, 309, 146–151. [Google Scholar] [CrossRef]
  27. Chen, Q.; Huang, K.; Zhao, H.; Zhang, Y. Simulation and analysis of the model of calculating contact tangential stiffness between cylinders’ joint interfaces by MATLAB. Appl. Mech. Mater. 2012, 190–191, 177–181. [Google Scholar] [CrossRef]
  28. Liu, P.; Zhao, H.; Huang, K.; Chen, Q. Research on normal contact stiffness of rough surface considering friction based on fractal theory. Appl. Surf. Sci. 2015, 349, 43–48. [Google Scholar] [CrossRef]
  29. Chen, Q.; Xu, F.; Liu, P.; Fan, H. Research on fractal model of normal contact stiffness between two spheroidal joint surfaces considering friction factor. Tribol. Int. 2016, 97, 253–264. [Google Scholar] [CrossRef]
  30. Hanaor, D.A.H.; Gan, Y.; Einav, I. Contact mechanics of fractal surfaces by spline assisted discretisation. Int. J. Solids Struct. 2015, 59, 121–131. [Google Scholar] [CrossRef]
  31. Ma, D.; Hou, L.; Wei, Y.; Chen, J. Sliding friction contact mechanics model of the involute arc cylindrical gear based on fractal theory. J. Mech. Eng. 2016, 52, 121–127. [Google Scholar] [CrossRef]
  32. Wang, R.; Zhu, L.; Zhu, C. Research on fractal model of normal contact stiffness for mechanical joint considering asperity interaction. Int. J. Mech. Sci. 2017, 134, 357–369. [Google Scholar] [CrossRef]
  33. Pan, W.; Li, X.; Wang, L.; Guo, N.; Mu, J. A normal contact stiffness fractal prediction model of dry-friction rough surface and experimental verification. Eur. J. Mech. 2017, 66, 94–102. [Google Scholar] [CrossRef]
  34. Pan, W.; Li, X.; Wang, L.; Mu, J.; Yang, Z. A loading fractal prediction model developed for dry-friction rough joint surfaces considering elastic-plastic contact. Acta Mech. 2018, 229, 2149–2162. [Google Scholar] [CrossRef]
  35. Shen, J.; Xu, S.; Liu, W.; Yang, J. Fractal model of normal contact stiffness between two spheres of joint interfaces with simulation. Mechanika 2017, 23, 703–713. [Google Scholar] [CrossRef] [Green Version]
  36. Guan, D.; Jing, L.; Gong, J.; Shen, H.; Hilton, H.H. Normal contact analysis for spherical pump based on fractal theory. Tribol. Int. 2018, 124, 117–123. [Google Scholar] [CrossRef]
  37. Zhao, Y.; Wu, H.; Liu, Z.; Cheng, Q.; Yang, C. A novel nonlinear contact stiffness model of concrete—Steel joint based on the fractal contact theory. Nonlinear Dyn. 2018, 94, 151–164. [Google Scholar] [CrossRef]
  38. Yuan, Y.; Cheng, Y.; Liu, K.; Gan, L. A revised Majumdar and Bushan model of elastoplastic contact between rough surfaces. Appl. Surf. Sci. 2017, 425, 1138–1157. [Google Scholar] [CrossRef]
  39. Yuan, Y.; Chen, J.; Zhang, L. Loading-unloading contact model between three-dimensional fractal rough surfaces. AIP Adv. 2018, 8. [Google Scholar] [CrossRef] [Green Version]
  40. Xu, K.; Yuan, Y.; Chen, J. The effects of size distribution functions on contact between fractal rough surfaces. AIP Adv. 2018, 8. [Google Scholar] [CrossRef] [Green Version]
  41. Jackson, R.L.; Green, I. A finite element study of elasto-plastic hemispherical contact against a rigid flat. J. Tribol. 2005, 127, 343–354. [Google Scholar] [CrossRef] [Green Version]
  42. Li, X.; Wang, X.; Yun, H.; Gao, J. Investigation into normal contact stiffness of fixed joint surface with three-dimensional fractal. J. South China Univ. Technol. 2016, 44, 114–122. [Google Scholar] [CrossRef]
  43. Tabor, D. The Hardness of Metals; Clarendon Press: Oxford, UK, 1951. [Google Scholar]
  44. Chen, J.; Yuan, Y.; Xu, Y. An analytical model of loading-unloading contact between rough surfaces based on fractal theory. J. Xi’an Jiaotong Univ. 2018, 52, 98–110. [Google Scholar] [CrossRef]
  45. Guan, C. Calculation of critical parameters for Hertz contact between cylinder and rigid plane. Bearing 2013. [Google Scholar] [CrossRef]
  46. Huang, K.; Zhao, H.; Chen, Q. Research on fractal contact model of cylinders’ surface. Adv. Tribol. 2010. [Google Scholar] [CrossRef]
  47. Ge, S.; Tonder, K. The fractal behavior and fractal characterization of rough surfaces. Tribology 1997, 17, 73–80. [Google Scholar] [CrossRef]
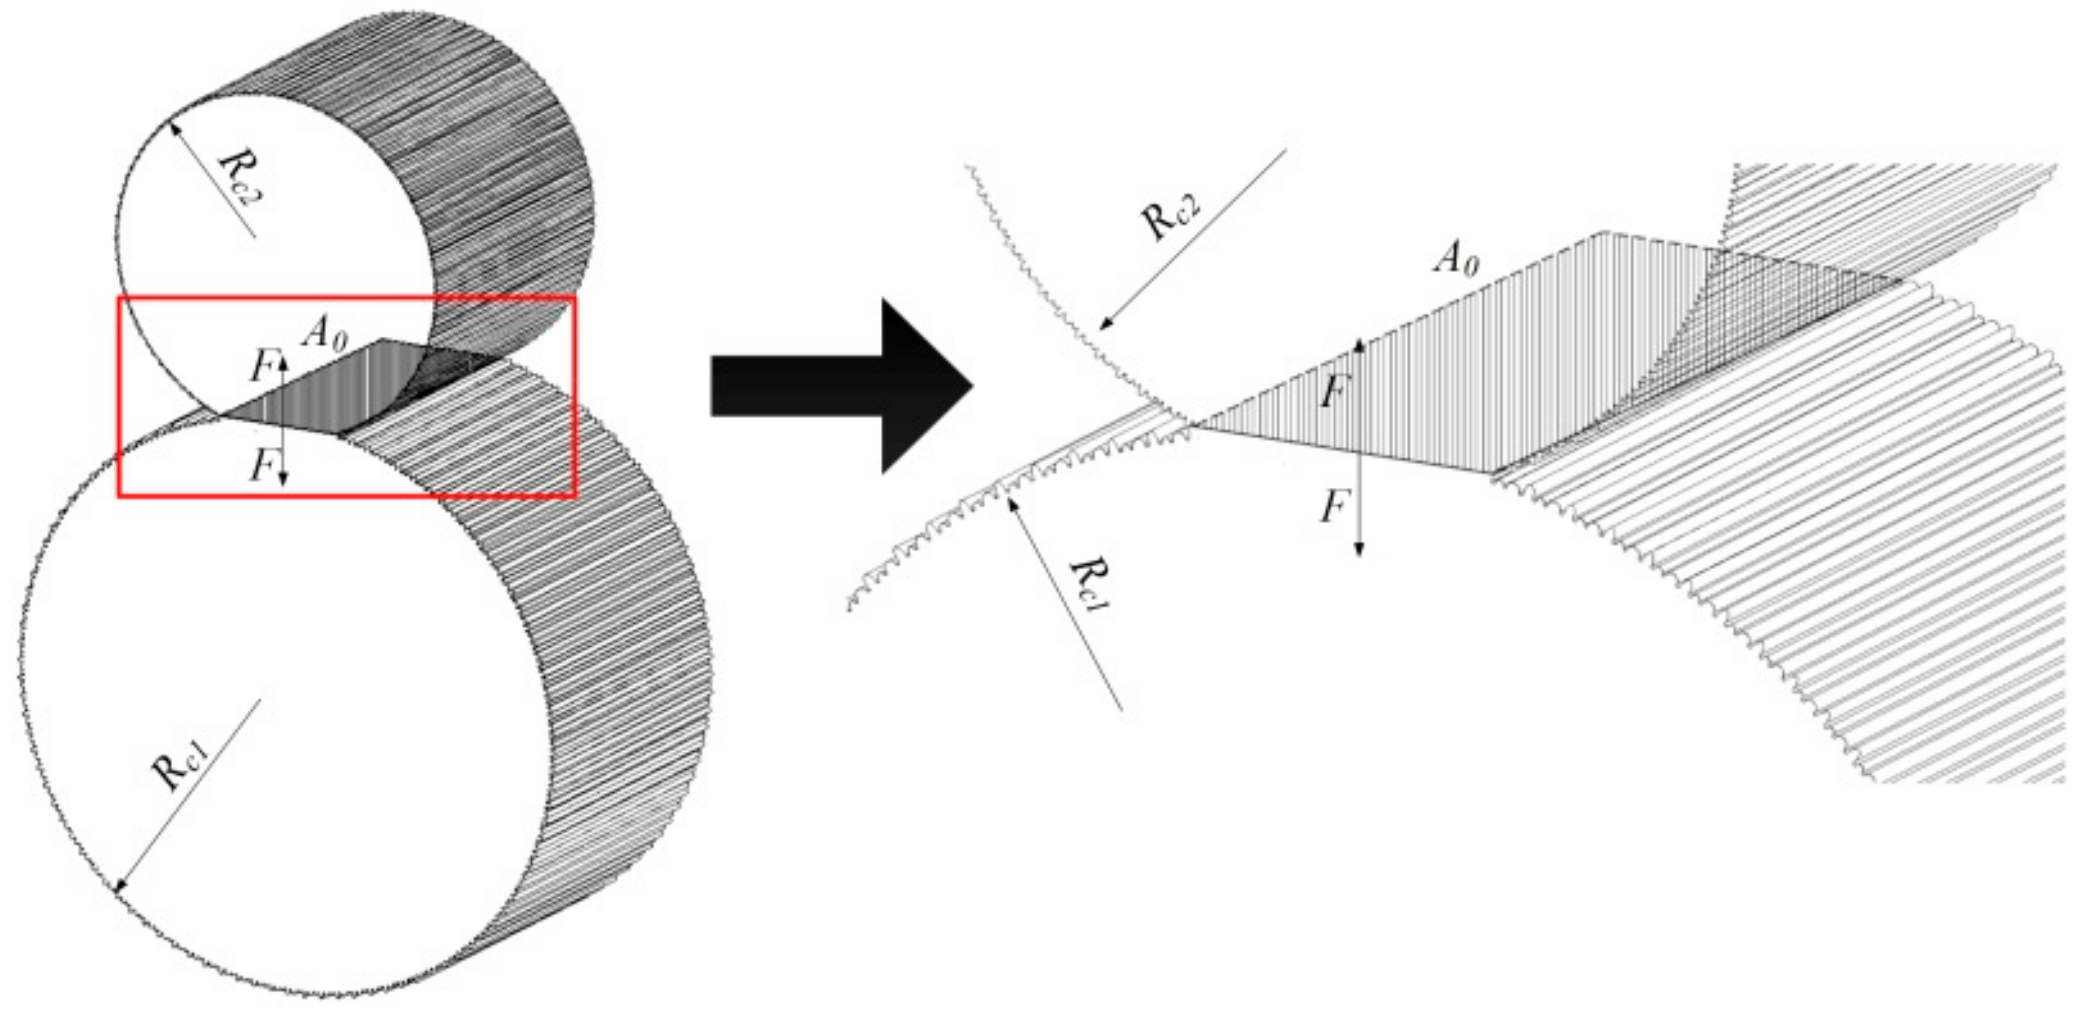
Figure 1. The contact between two cylindrical rough surfaces.
Applsci 10 00742 g001
Figure 2. The relation between dimensionless real contact area and dimensionless contact load of two cylindrical surfaces in different deformation stages with D = 1.5, G = 10−10 mm, Rc1 = 100 mm and Rc2 = 60 mm. (a) The load–unload cycle in the elastic stage; (b) the load–unload cycle in the first elastoplastic stage; (c) the load–unload cycle in the second elastoplastic stage.
Applsci 10 00742 g002aApplsci 10 00742 g002b
Figure 3. The relation between dimensionless real contact area and dimensionless contact load of two cylindrical surfaces in the second elastoplastic stage with different fractal dimensions with G = 10−10 mm, Rc1 = 100 mm and Rc2 = 60 mm. (a) Unloading at the dimensionless critical contact load; (b) unloading at a given dimensionless contact load.
Applsci 10 00742 g003
Figure 4. The relation between dimensionless real contact area and dimensionless contact load of two cylindrical surfaces in the second elastoplastic stage with different profile scaling parameters with D = 1.5, Rc1 = 100 mm and Rc2 = 60 mm. (a) Unloading at the dimensionless critical contact load; (b) unloading at a given dimensionless contact load.
Applsci 10 00742 g004
Figure 5. The relation between real contact area and contact load of two cylindrical surfaces in the second elastoplastic stage with different curvature radii with D = 1.5, G = 10−10 mm and Rc1 = 100 mm. (a) Unloading at the dimensional critical contact load; (b) unloading at a given dimensional contact load; (c) unloading at the dimensionless critical contact load; (d) unloading at a given dimensionless contact load.
Applsci 10 00742 g005aApplsci 10 00742 g005b
Figure 6. The relation between real contact area and contact load of two cylindrical surfaces in the second elastoplastic stage with different contact types with D = 1.5, G = 10−10 mm, Rc1 = 100 mm and Rc2 = 60 mm. (a) Unloading at the dimensional critical contact load; (b) unloading at a given dimensional contact load; (c) unloading at the dimensionless critical contact load; (d) unloading at a given dimensionless contact load.
Applsci 10 00742 g006aApplsci 10 00742 g006b
Figure 7. The comparison between the present model, the Kogut and Etsion (KE) model and the Yuan model.
Applsci 10 00742 g007
Figure 8. The comparison between the present model and KE statistical model. (a) G = 10−10 m, 1.4 ≤ D ≤ 1.5; (b) D = 1.45, 10−11 m ≤ G ≤ 10−9 m.
Applsci 10 00742 g008