Modeling of the Loading–Unloading Contact of Two Cylindrical Rough Surfaces with Friction


Abstract
:1. Introduction
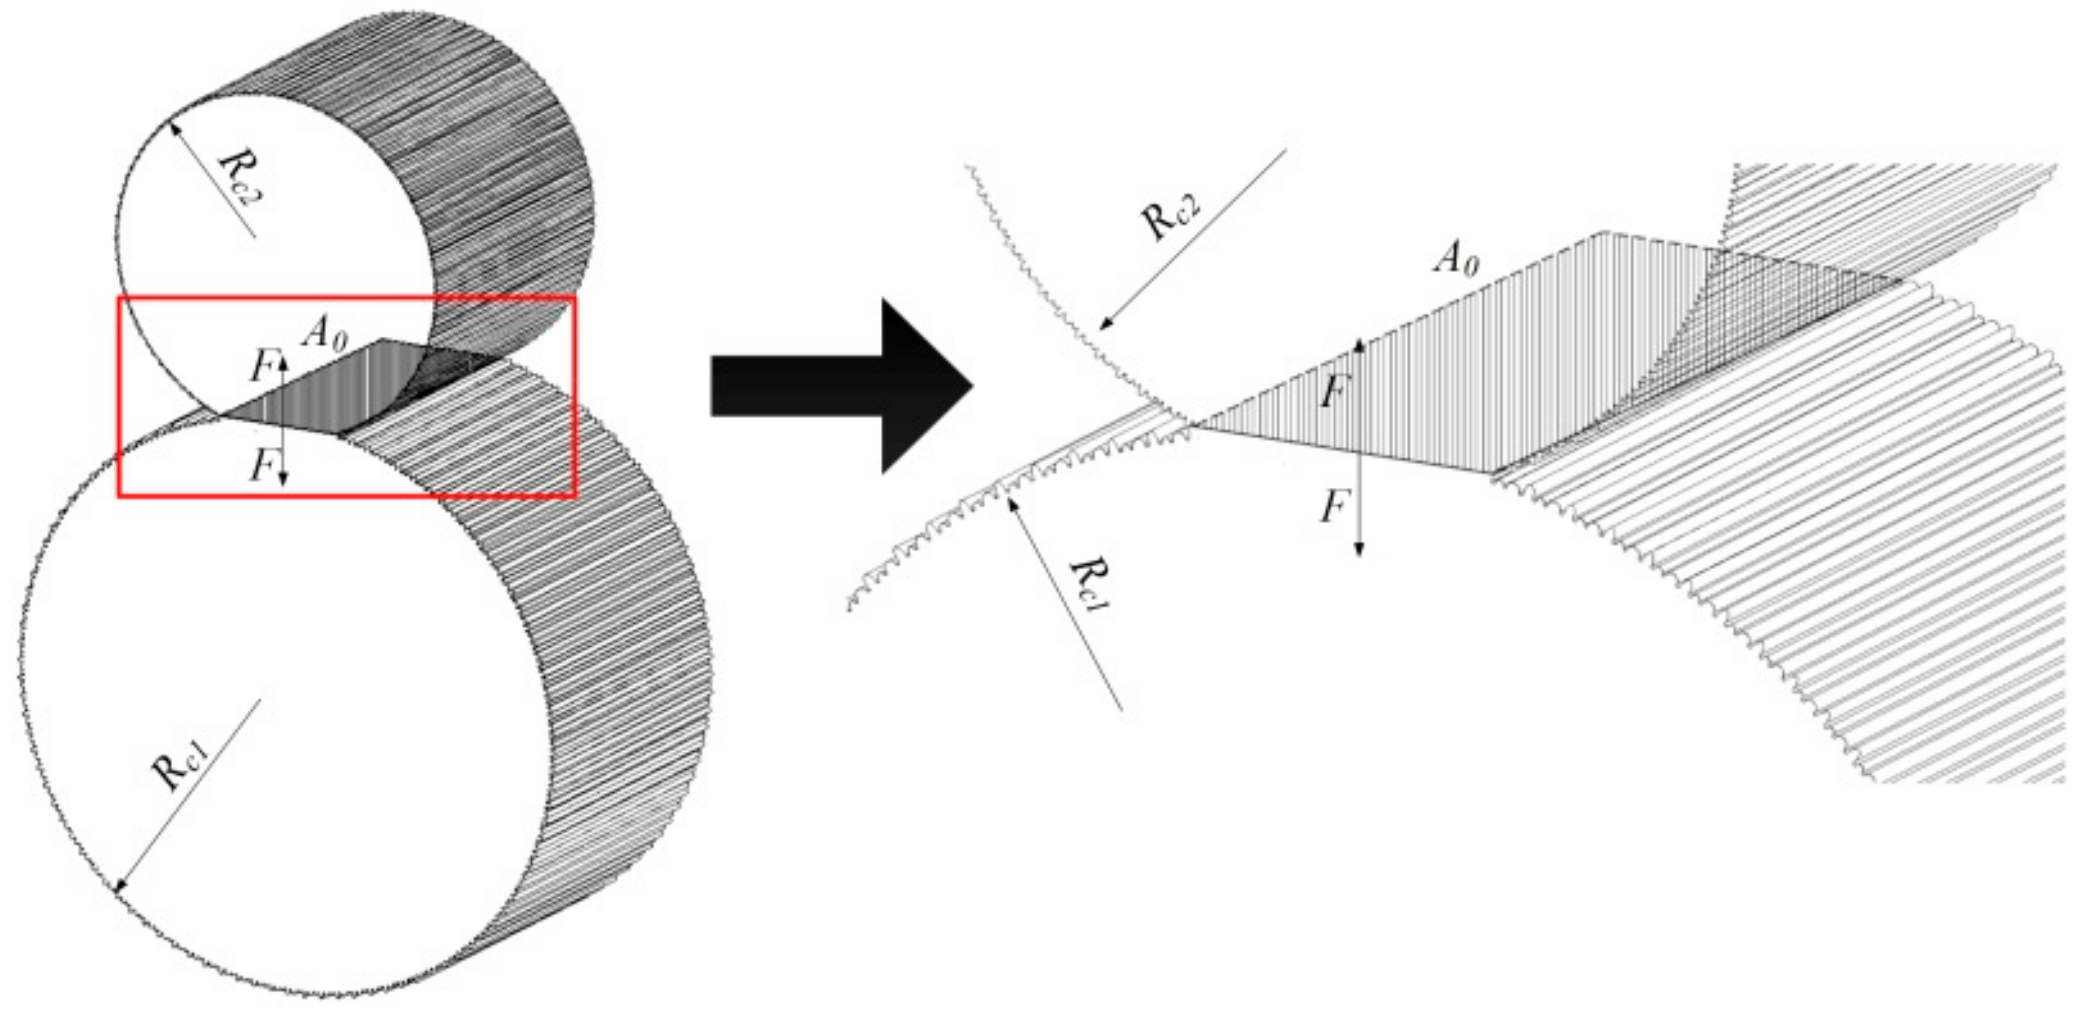
2. Contact Model in the Loading Process with Regard of Friction
2.1. Contact Model of Single Asperity in Loading Process with Regard of Friction
2.2. Fractal Contact Model of Two Cylindrical Surfaces in Loading Process with Regard of Friction
3. Fractal Contact Model in the Unloading Process with Regard of Friction
4. Numerical Results and Discussion
4.1. Normalization
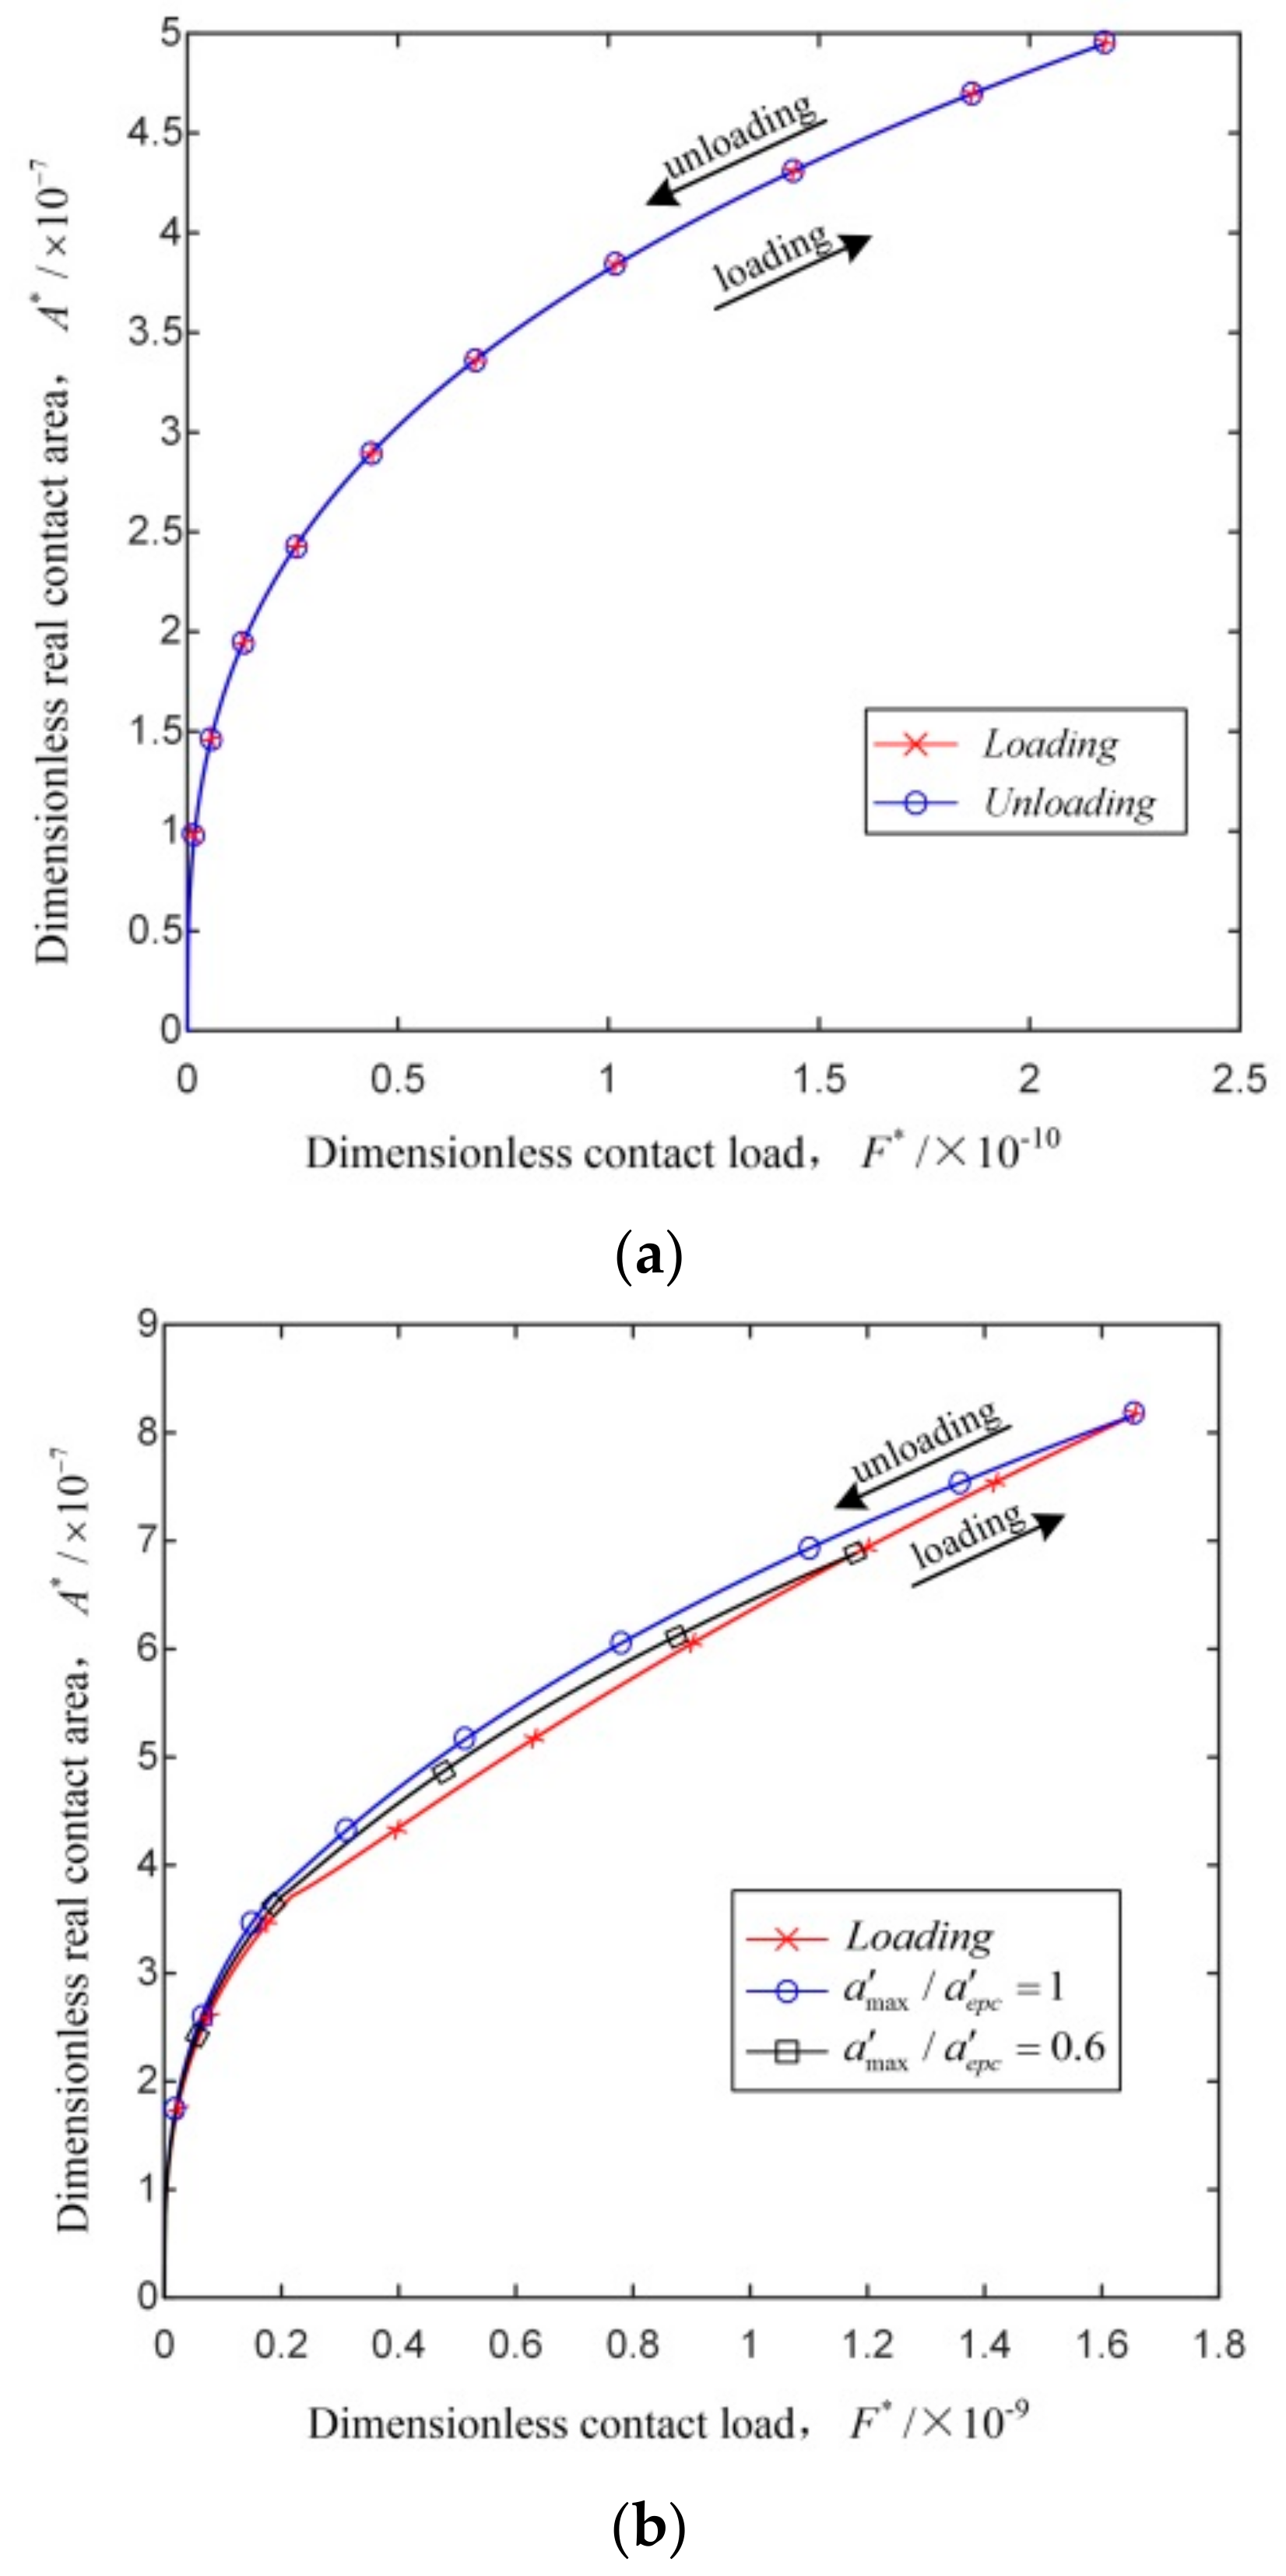
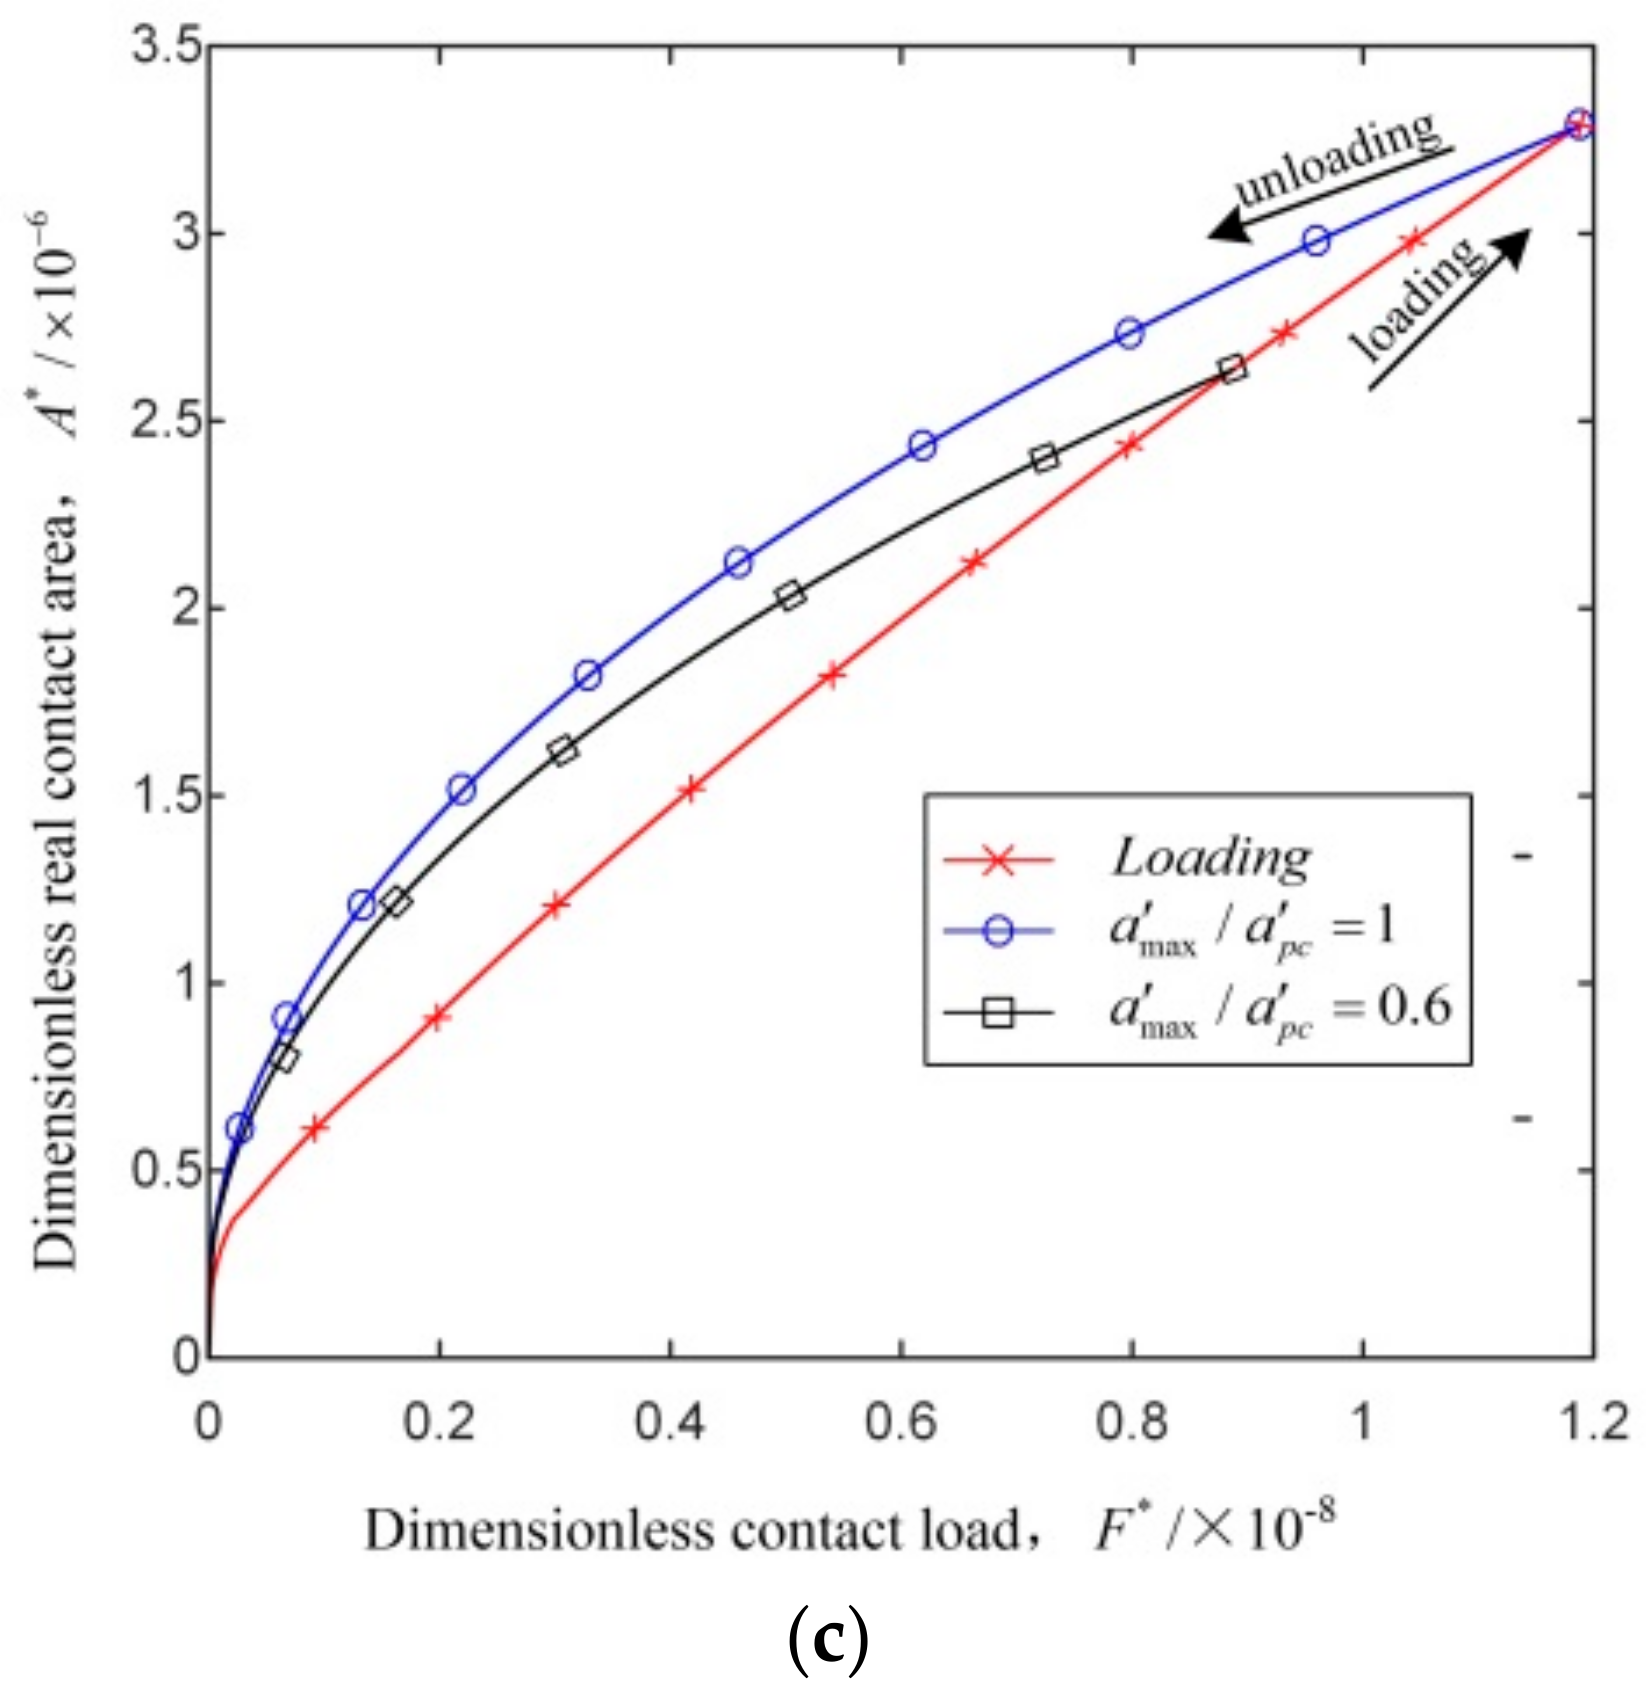
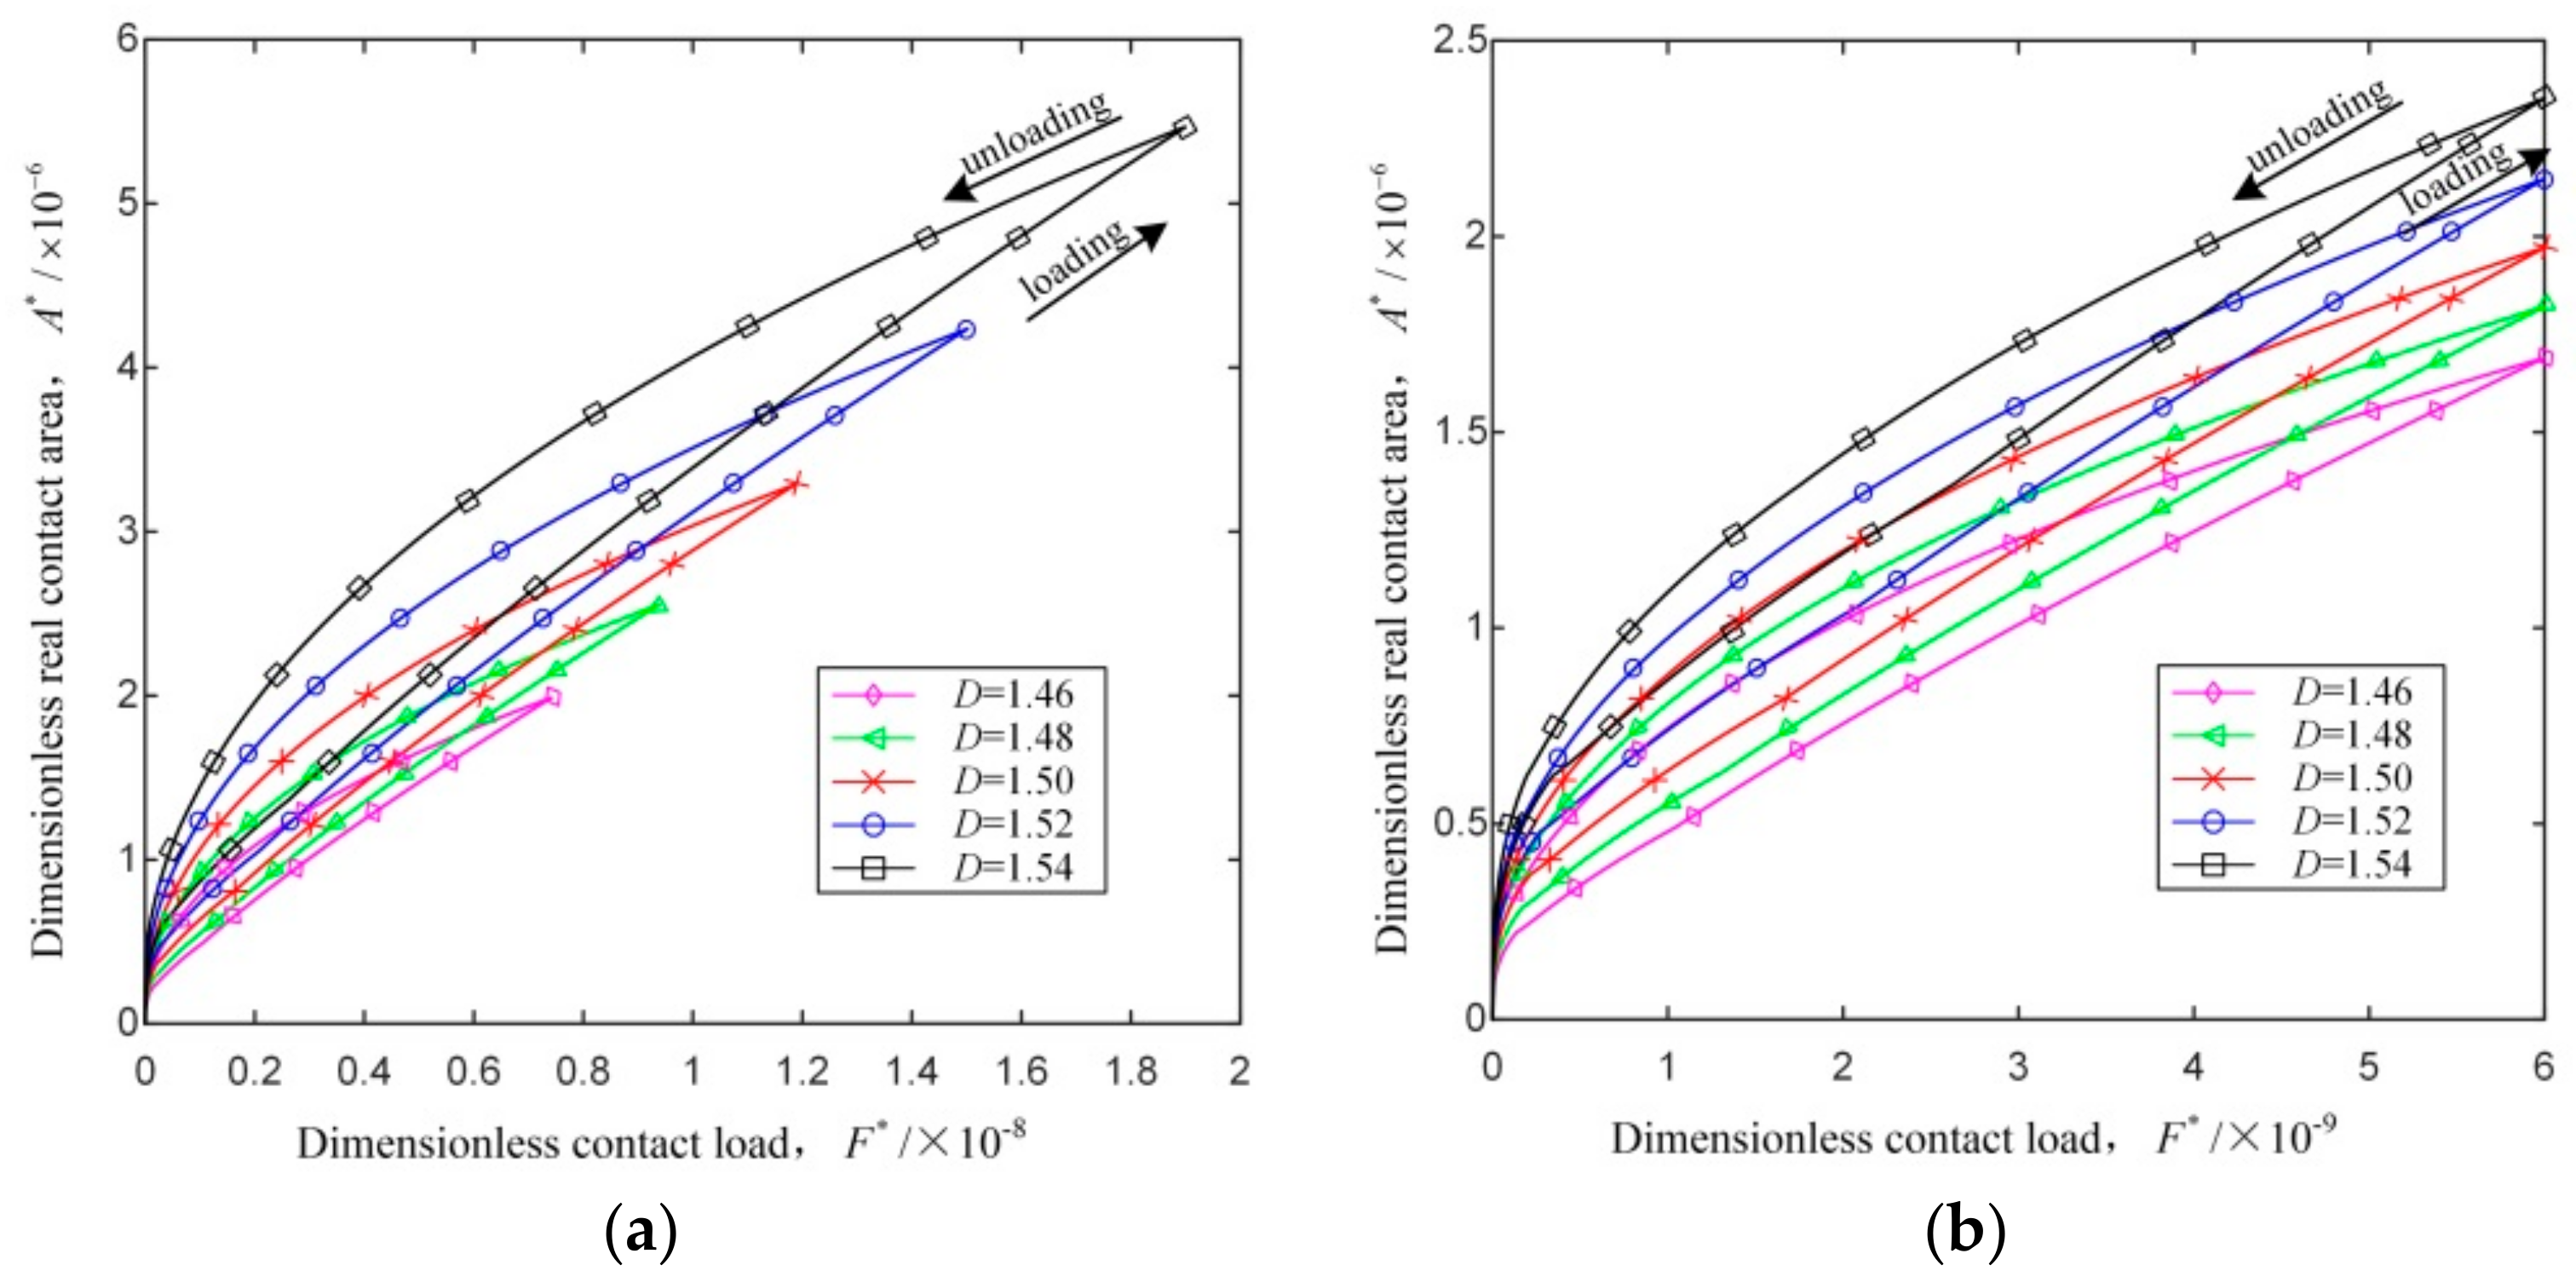
4.2. Load–Unload Cycle Analysis
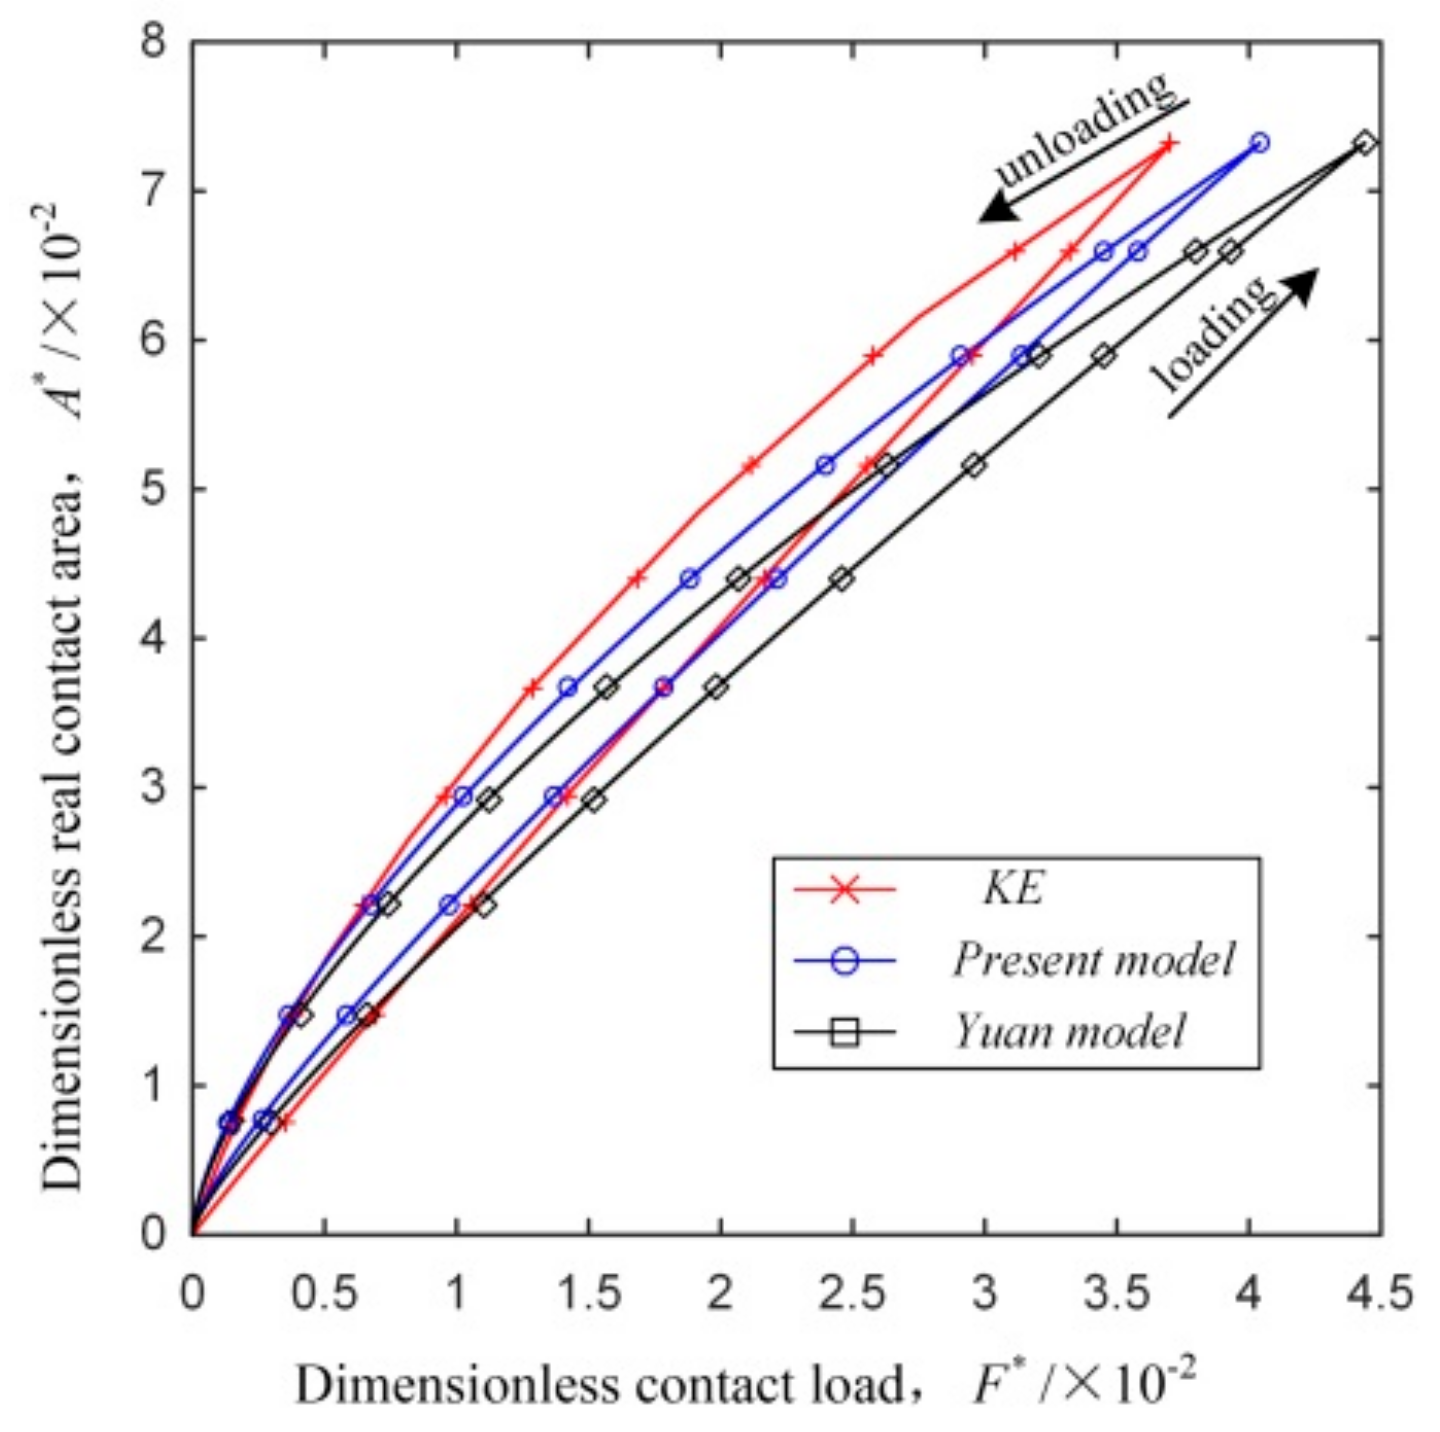
4.3. Model Comparison
5. Conclusions
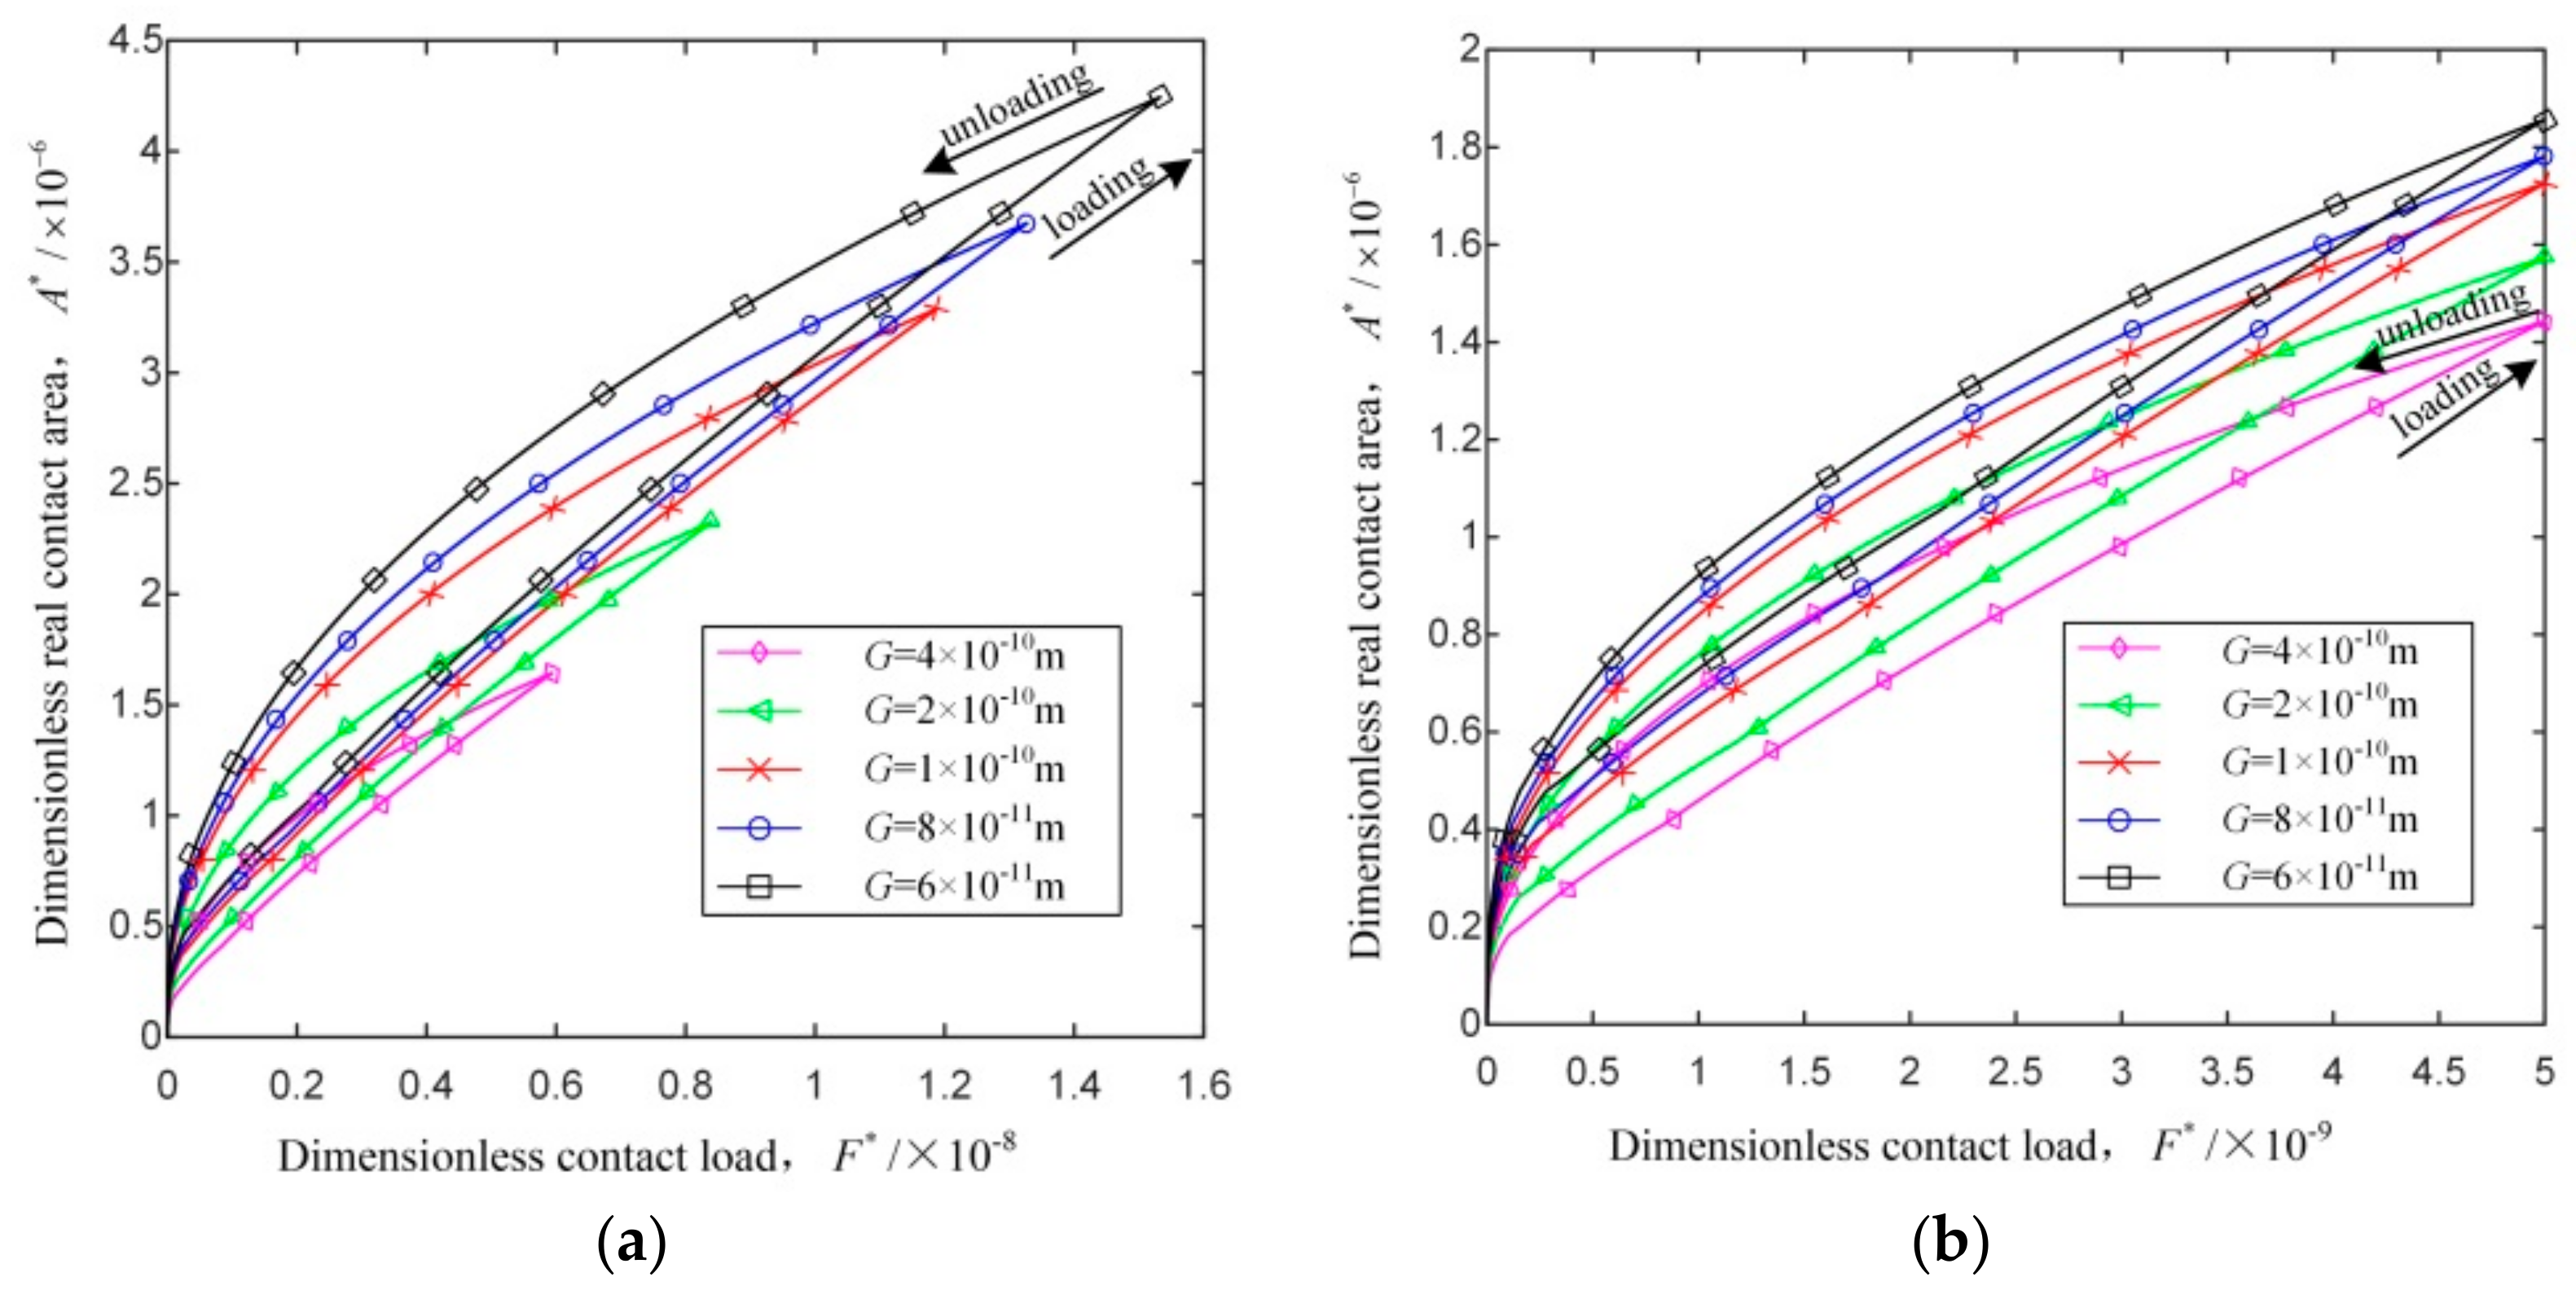
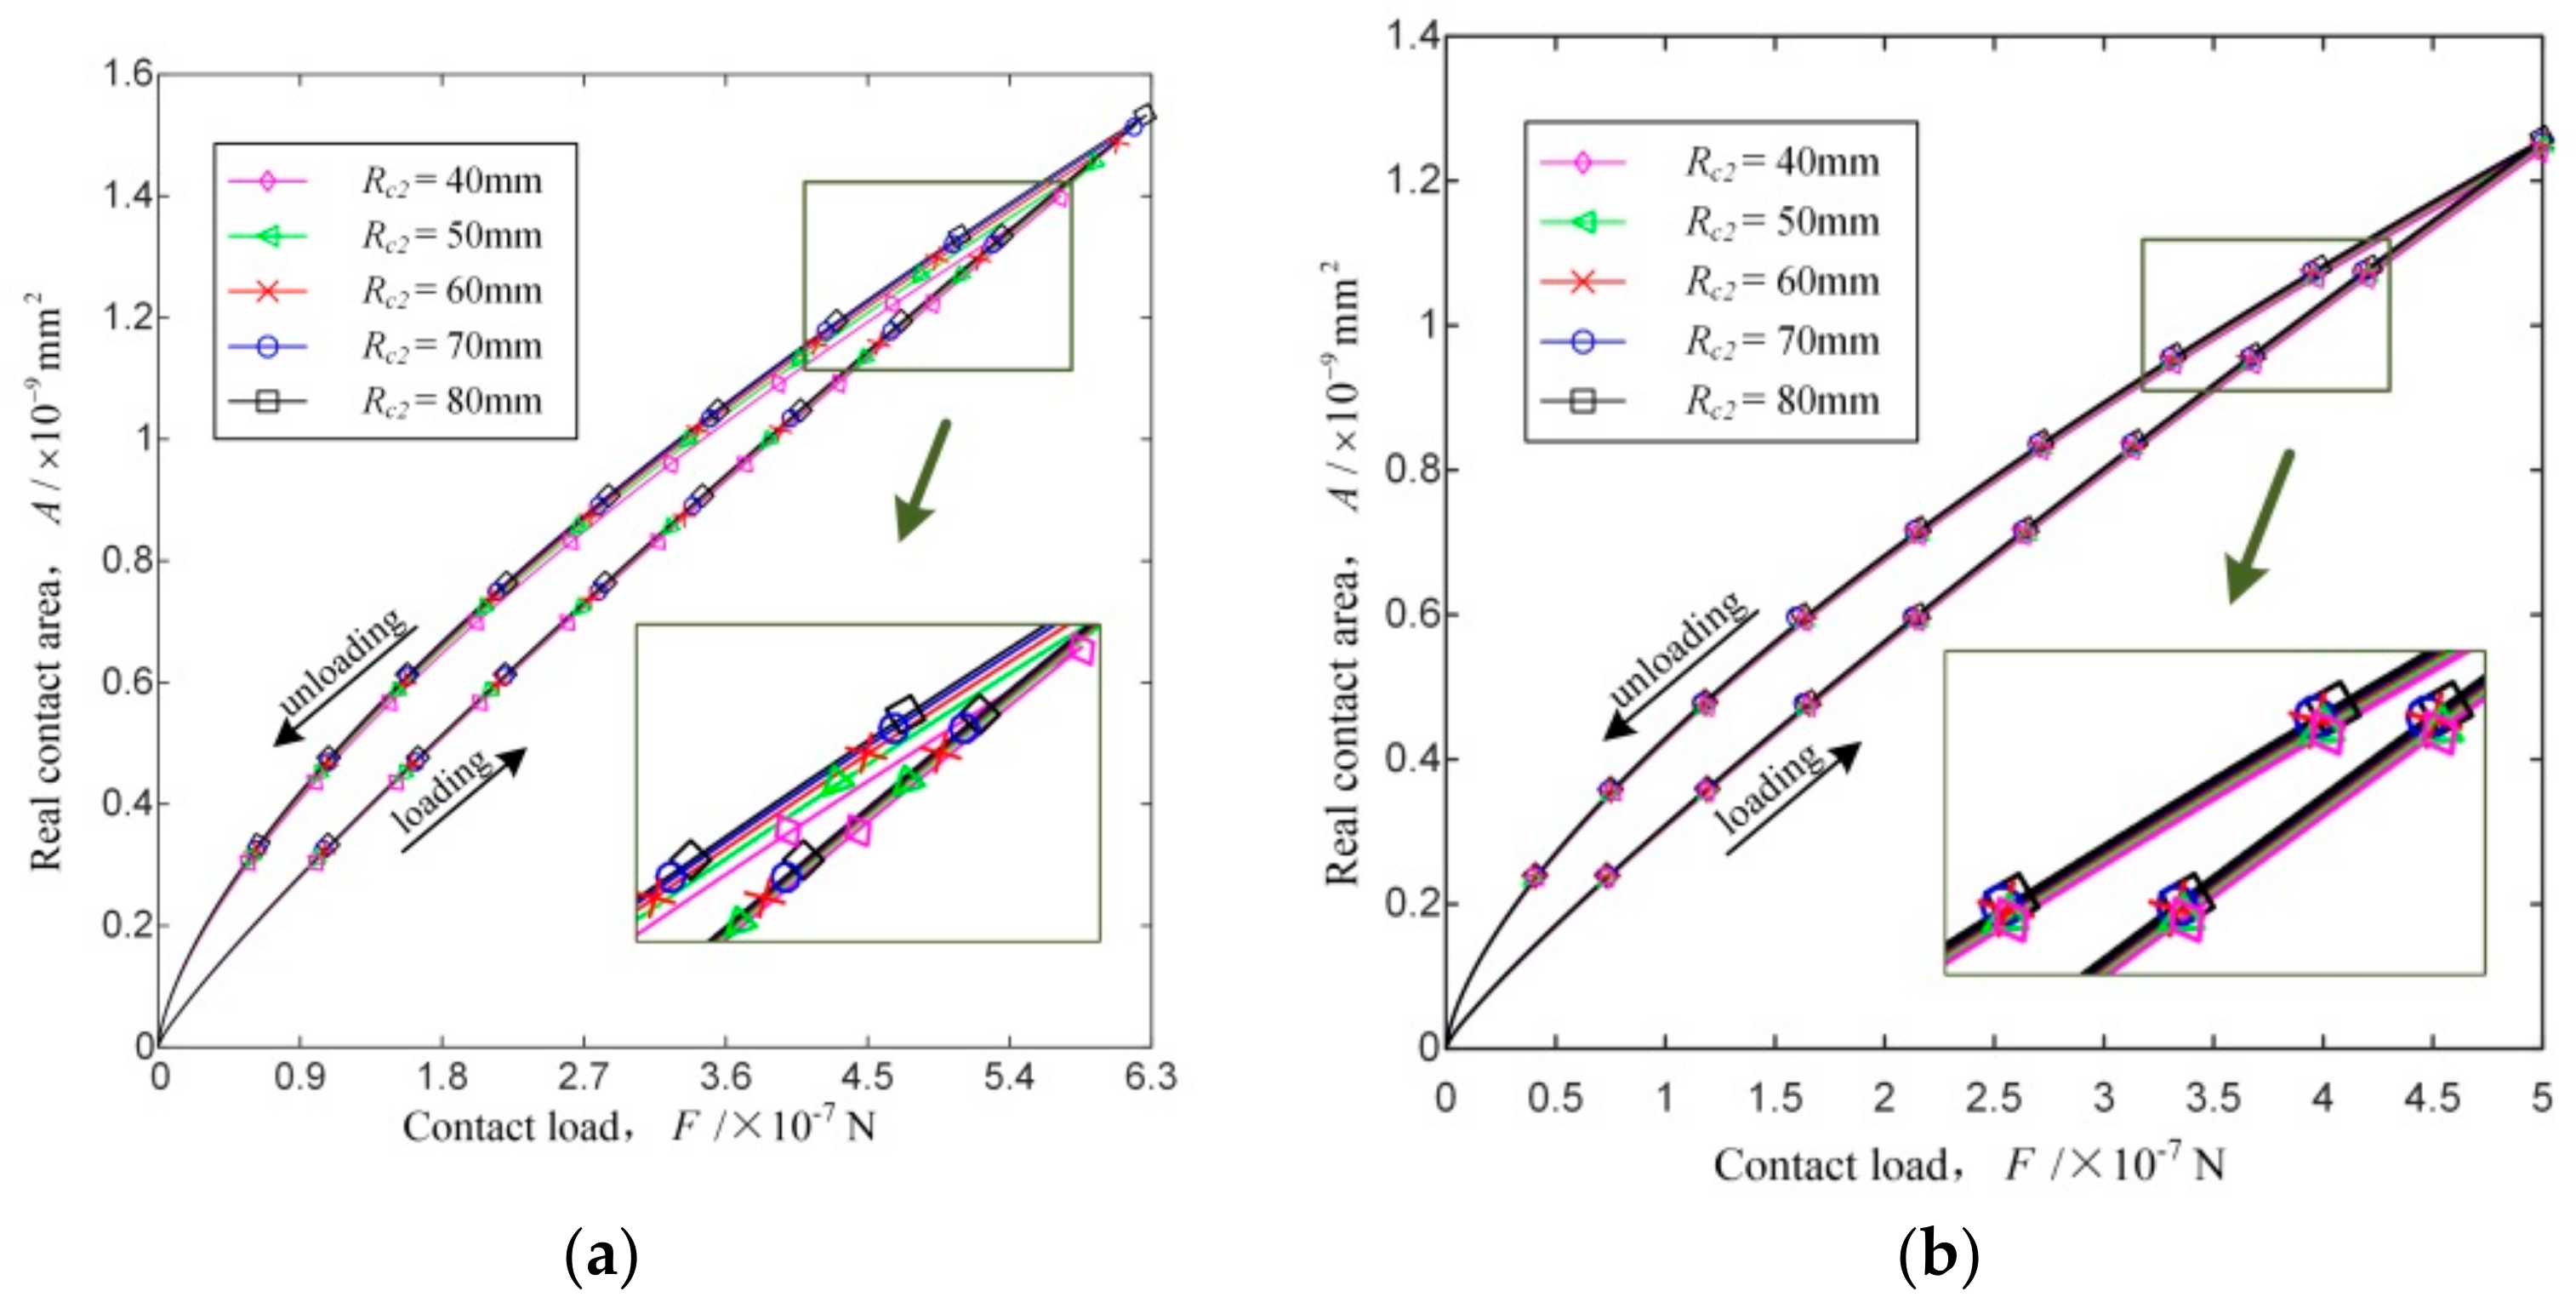
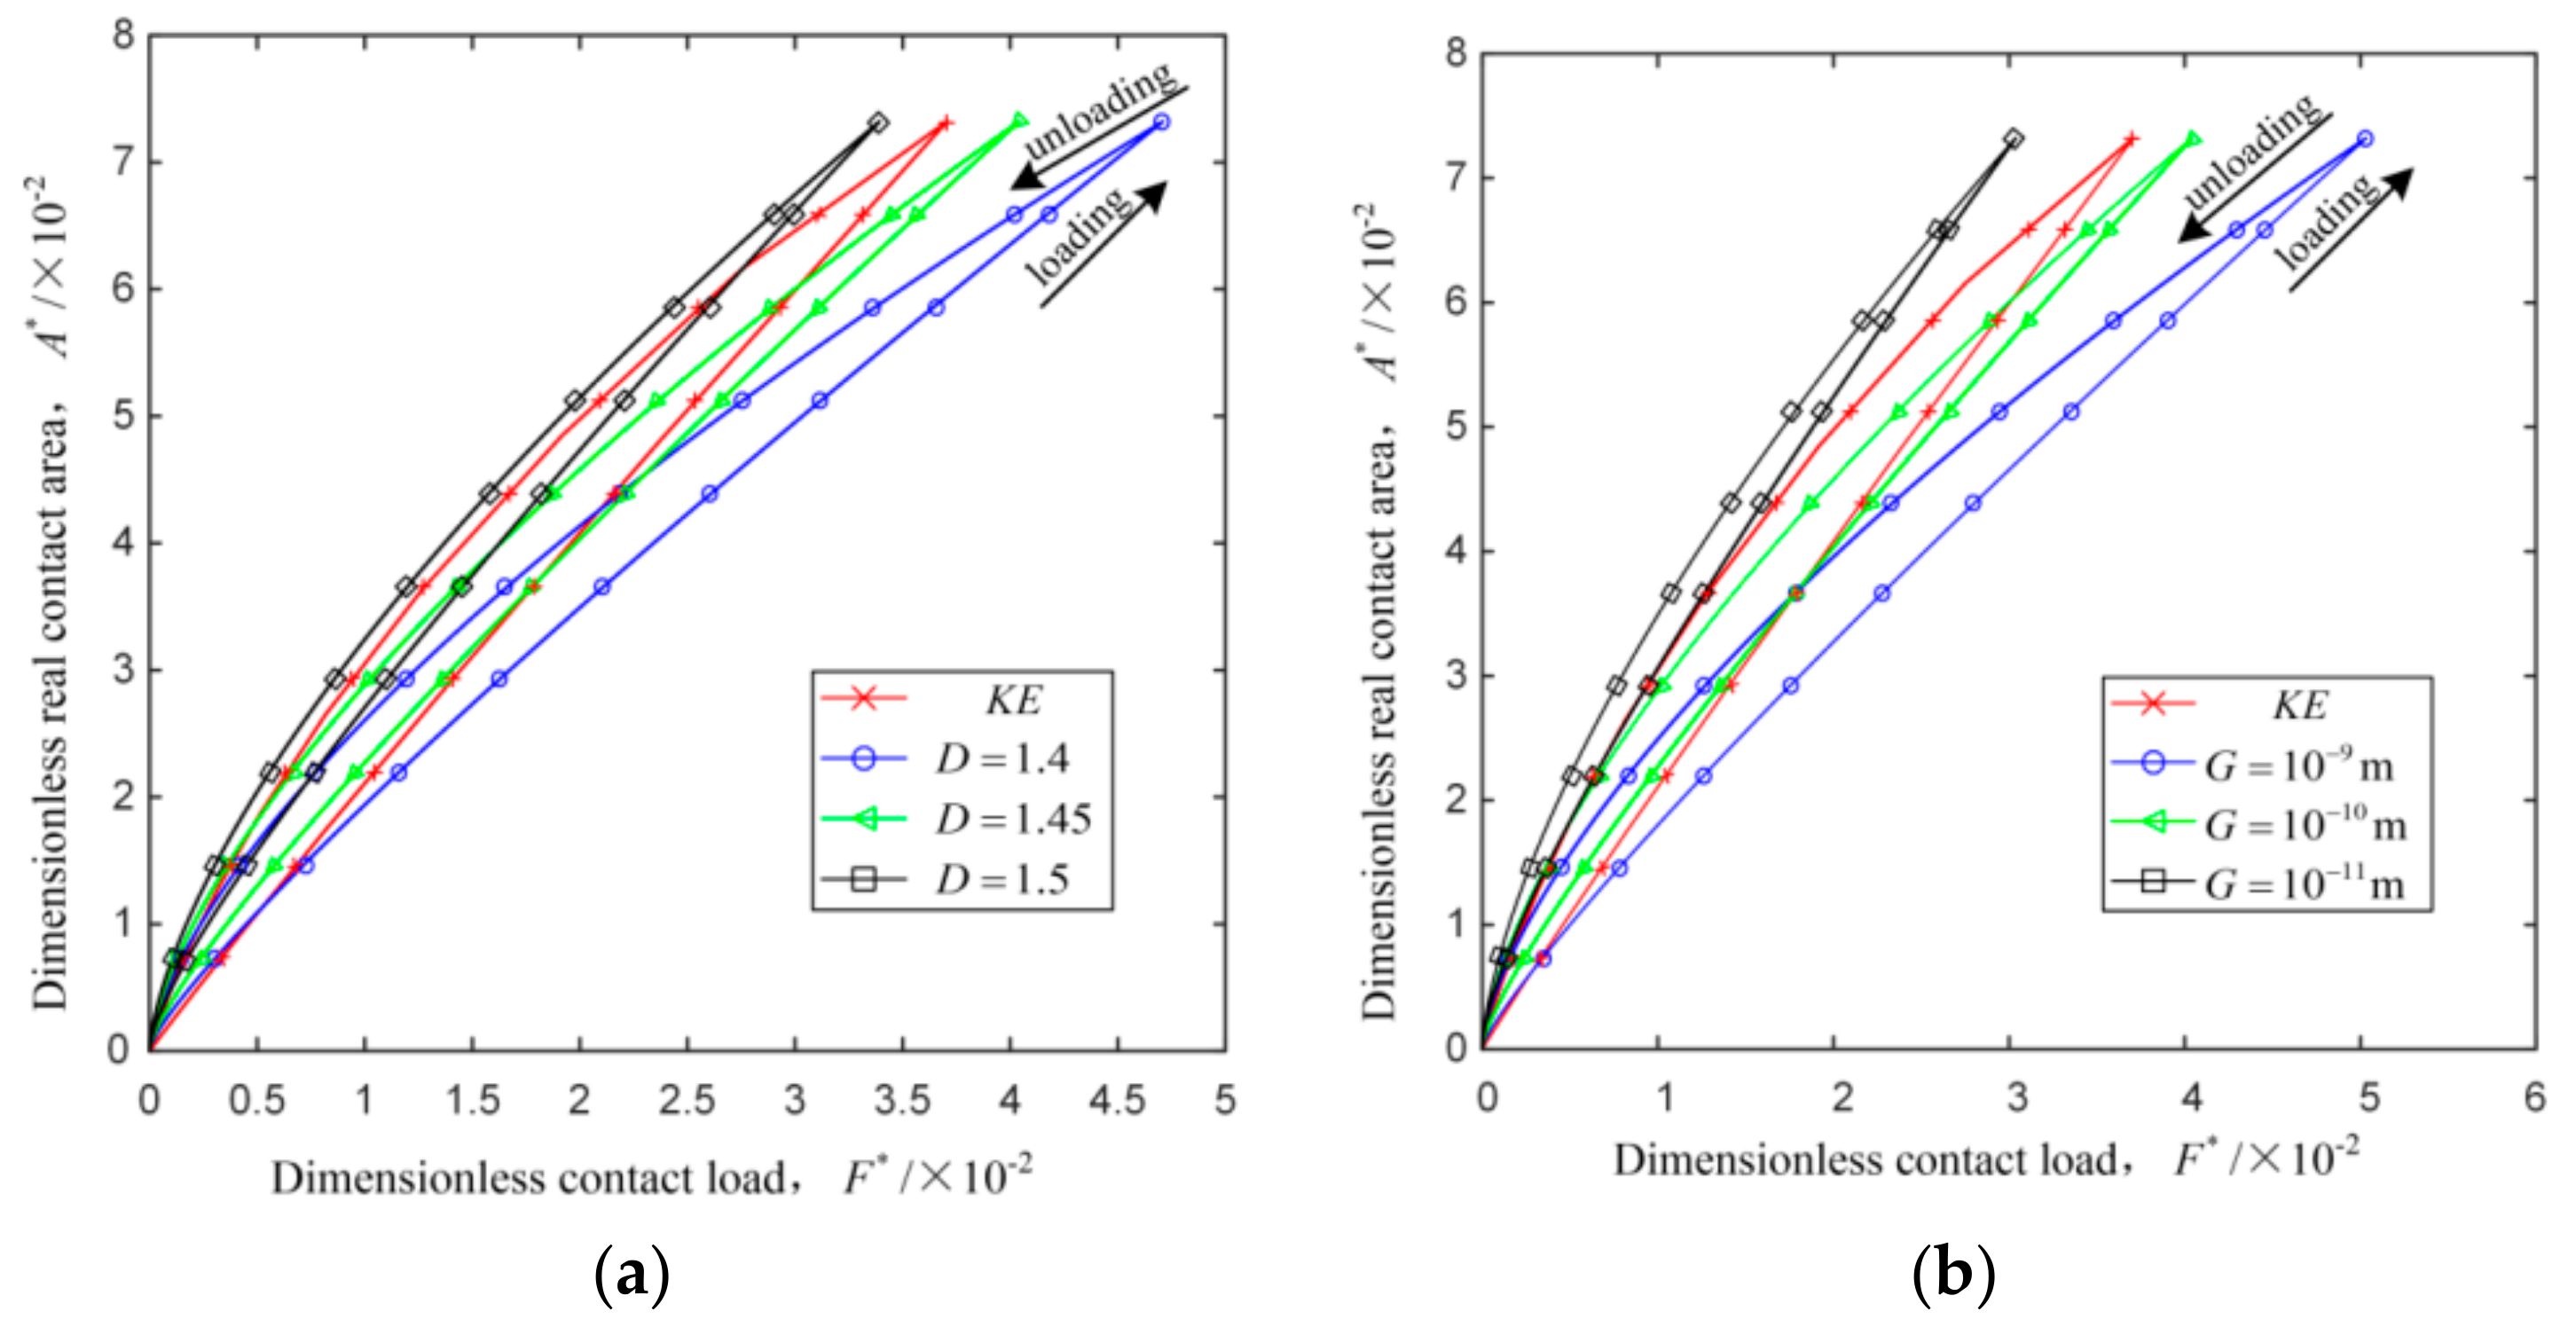
- The dimensionless real contact area of the loading–unloading process increases with the dimensionless contact load. In the elastic stage, the unloading process is the same with the loading one. In the elastoplastic stage, the dimensionless real contact area of the unloading process is greater than that of the loading process for a given dimensionless contact load; the dimensionless real contact area of the unloading process, as well as the differences of the dimensionless real contact area between the loading and unloading processes, increase with the loading interference.
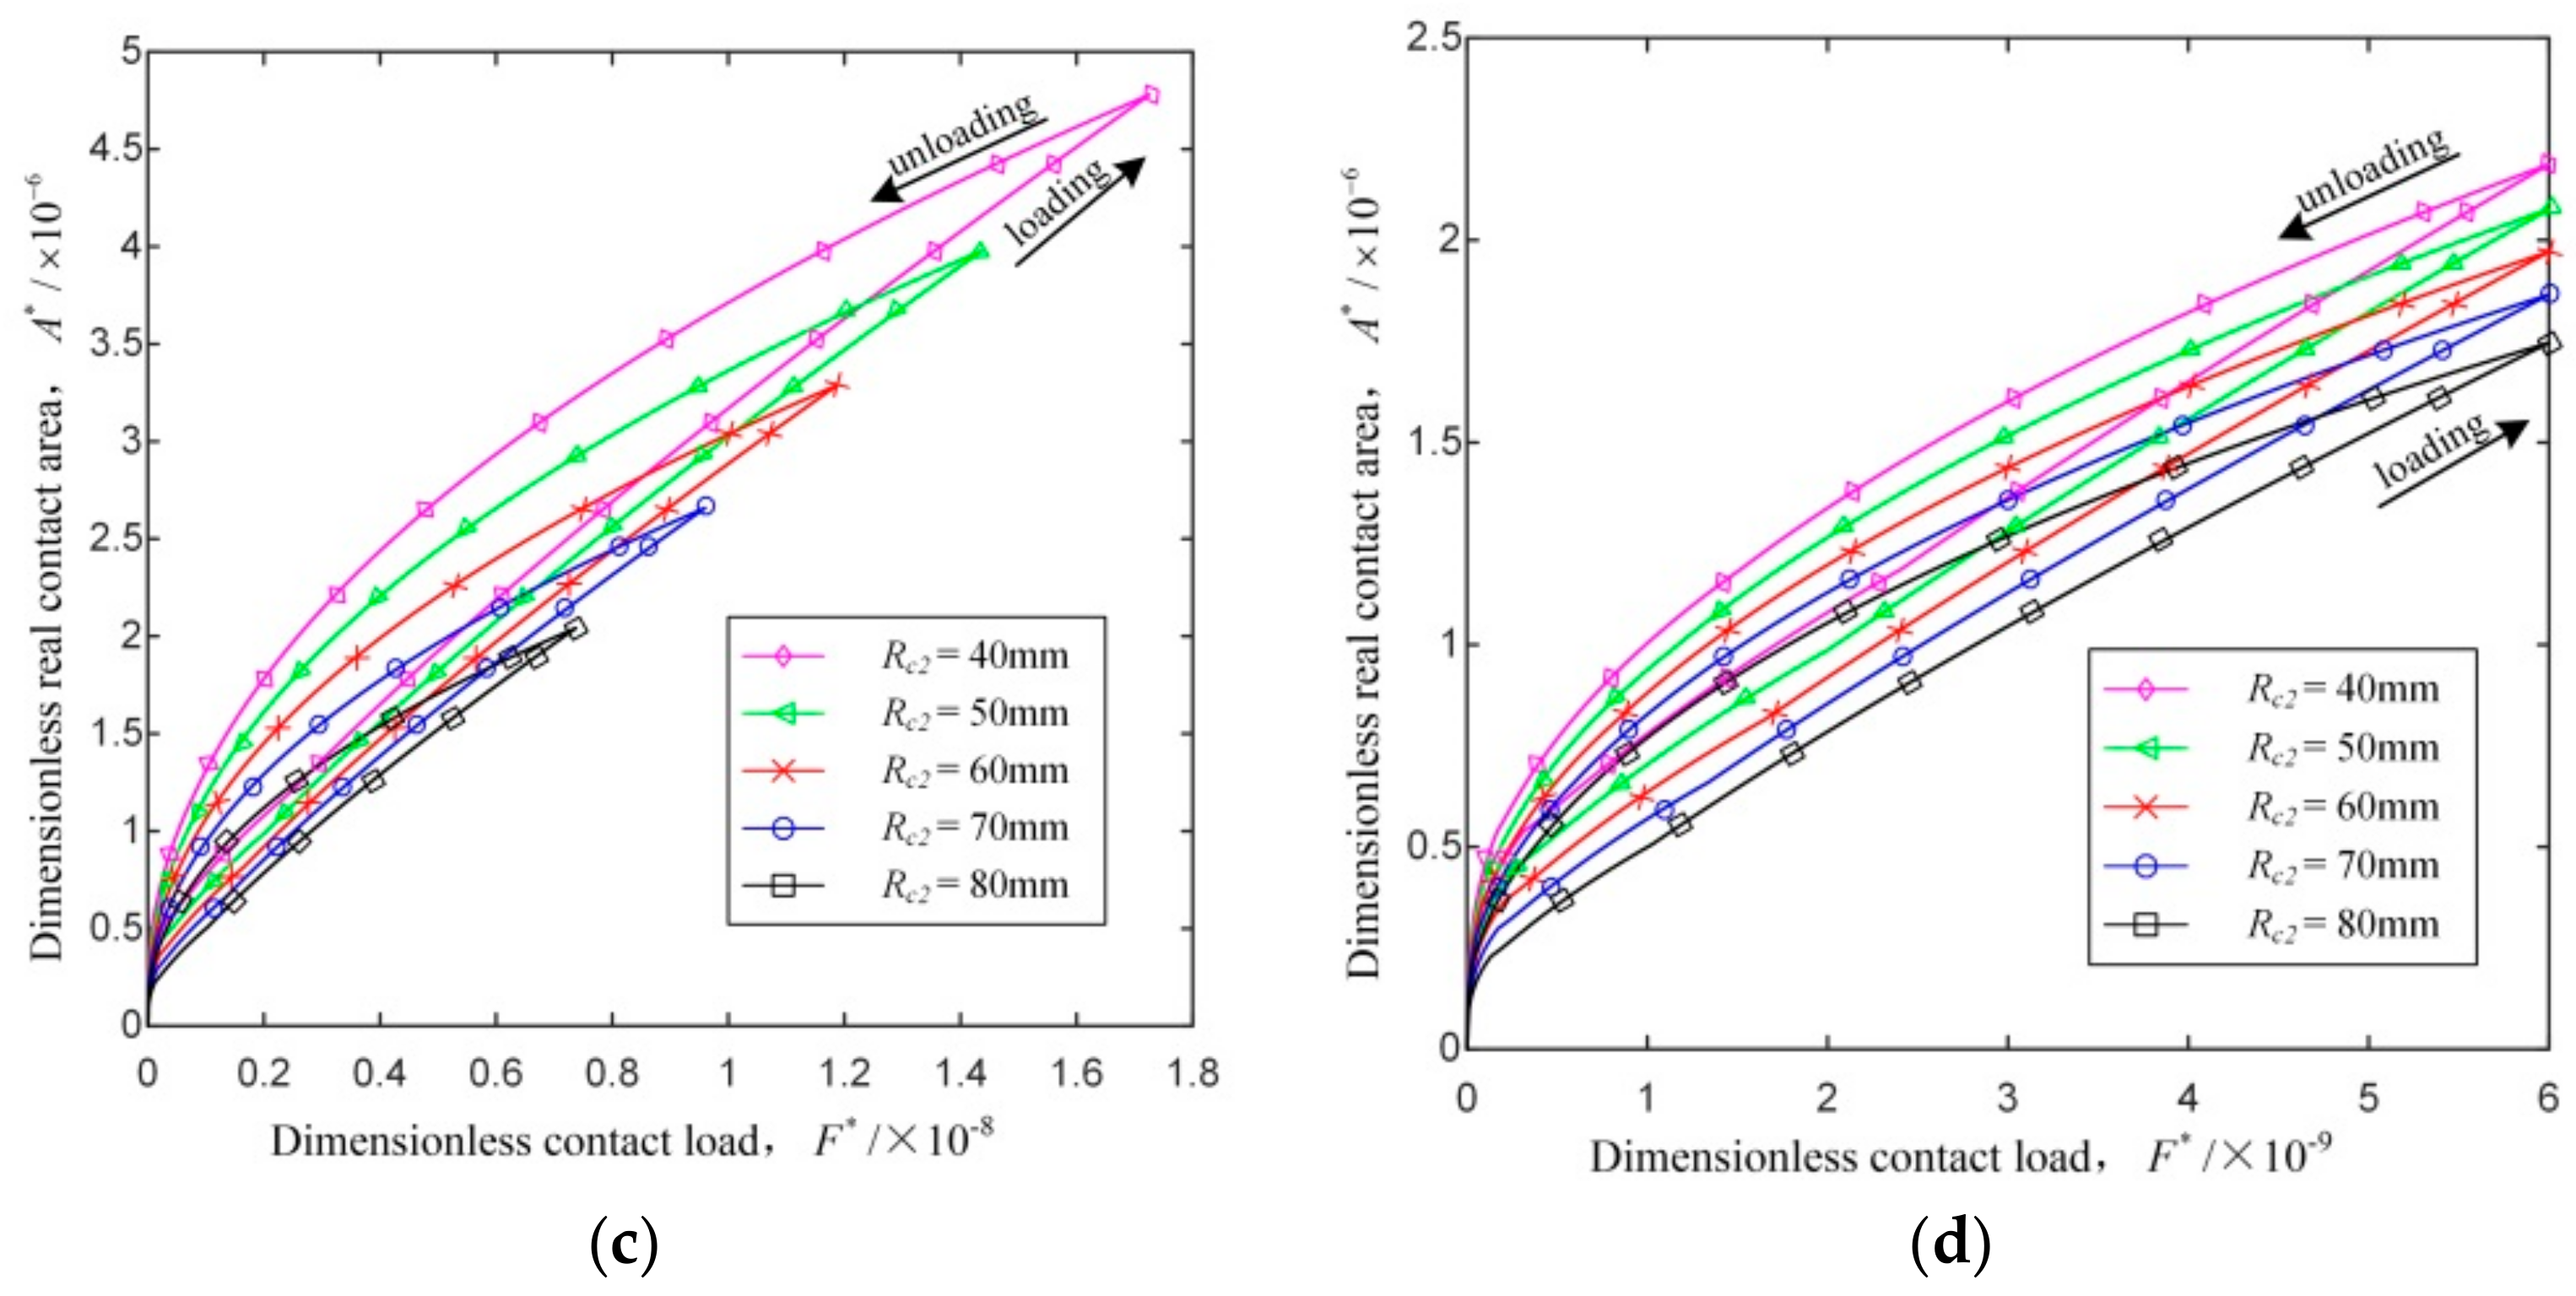
- The dimensionless critical real contact area and the dimensionless critical contact load increase with the increase of the fractal dimension, decrease of the profile scaling parameter and the curvature radius, or the substitution of external contact for internal contact.
- In the elastoplastic stage, for a given dimensionless contact load, the dimensionless real contact area of the loading-unloading process of cylindrical contact surface with friction, as well as the differences of the dimensionless real contact area between the loading and unloading processes, increase with the increase of the fractal dimension, decrease of the profile scaling parameter and the curvature radius, or the substitution of external contact for internal contact.
Author Contributions
Funding
Conflicts of Interest
References
- Greenwood, J.A.; Williamson, J.B.P. Contact of nominally flat surfaces. Proc. R. Soc. A 1966, 295, 300–319. [Google Scholar] [CrossRef]
- Greenwood, J.A.; Tripp, J.H. The elastic contact of rough spheres. J. Appl. Mech. 1967, 34, 153–159. [Google Scholar] [CrossRef]
- Greenwood, J.A.; Tripp, J.H. The contact of two nominally flat rough surfaces. Proc. Inst. Mech. Eng. 1970, 185, 625–634. [Google Scholar] [CrossRef]
- Chang, W.R.; Etsion, I.; Bogy, D.B. An elastic-plastic model for the contact of rough surfaces. J. Tribol. 1987, 109, 257–263. [Google Scholar] [CrossRef]
- Kogut, L.; Etsion, I. Elastic-plastic contact analysis of a sphere and a rigid flat. J. Appl. Mech. 2002, 69, 657–662. [Google Scholar] [CrossRef] [Green Version]
- Etsion, I.; Kligerman, Y.; Kadin, Y. Unloading of an elastic–plastic loaded spherical contact. Int. J. Solids Struct. 2005, 42, 3716–3729. [Google Scholar] [CrossRef]
- Kadin, Y.; Kligerman, Y.; Etsion, I. Unloading an elastic–plastic contact of rough surfaces. J. Mech. Phys. Solids 2006, 54, 2652–2674. [Google Scholar] [CrossRef]
- Xu, Y.; Jackson, R.L.; Marghitu, D.B. Statistical model of nearly complete elastic rough surface contact. Int. J. Solids Struct. 2014, 51, 1075–1088. [Google Scholar] [CrossRef] [Green Version]
- Shi, J.; Cao, X.; Hu, Y.; Zhu, H. Statistical analysis of tangential contact stiffness of joint surfaces. Arch. Appl. Mech. 2015, 85, 1997–2008. [Google Scholar] [CrossRef]
- Song, H.; Vakis, A.I.; Liu, X.; Van der Giessen, E. Statistical model of rough surface contact accounting for size-dependent plasticity and asperity interaction. J. Mech. Phys. Solids 2017, 106, 1–14. [Google Scholar] [CrossRef] [Green Version]
- Kogut, L.; Etsion, I. A semi-analytical solution for the sliding inception of a spherical contact. J. Tribol. 2003, 125, 499–506. [Google Scholar] [CrossRef]
- Kogut, L.; Etsion, I. A Static friction model for elastic-plastic contacting rough surfaces. J. Tribol. 2004, 126, 34–40. [Google Scholar] [CrossRef]
- Brizmer, V.; Kligerman, Y.; Etsion, I. Elastic-plastic spherical contact under combined normal and tangential loading in full stick. Tribol. Lett. 2007, 25, 61–70. [Google Scholar] [CrossRef]
- Brizmer, V.; Kligerman, Y.; Etsion, I. The effect of contact conditions and material properties on the elasticity terminus of a spherical contact. Int. J. Solids Struct. 2006, 43, 5736–5749. [Google Scholar] [CrossRef] [Green Version]
- Brizmer, V.; Zait, Y.; Kligerman, Y.; Etsion, I. The effect of contact conditions and material properties on elastic-plastic spherical contact. J. Mech. Mater. Struct. 2006, 1, 865–879. [Google Scholar] [CrossRef] [Green Version]
- Cohen, D.; Kligerman, Y.; Etsion, I. A model for contact and static friction of nominally flat rough surfaces under full stick contact condition. J. Tribol. 2008, 130. [Google Scholar] [CrossRef]
- Cohen, D.; Kligerman, Y.; Etsion, I. The effect of surface roughness on static friction and junction growth of an elastic-plastic spherical contact. J. Tribol. 2009, 131. [Google Scholar] [CrossRef]
- Li, L.; Etsion, I.; Talke, F. Contact area and static friction of rough surfaces with high plasticity index. J. Tribol. 2010, 132. [Google Scholar] [CrossRef]
- Wang, X.; Xu, Y.; Jackson, R.L. Theoretical and finite element analysis of static friction between multi-scale rough surfaces. Tribol. Lett. 2018, 66, 146. [Google Scholar] [CrossRef]
- Zheng, X.; Yu, Y. A static friction model for elastic-plastic contacting surfaces using statistically homogenized technique. J. Phys. 2019, 1215. [Google Scholar] [CrossRef]
- Etsion, I. Comment on Leonardo da Vinci’s friction experiments: An old story acknowledged and repeated. Tribol. Lett. 2015, 58, 33. [Google Scholar] [CrossRef]
- Majumdar, A.; Bhushan, B. Fractal model of elastic-plastic contact between rough surfaces. J. Tribol. 1991, 113, 1–11. [Google Scholar] [CrossRef]
- Yan, W.; Komvopoulos, K. Contact analysis of elastic-plastic fractal surfaces. J. Appl. Phys. 1998, 84, 3617–3624. [Google Scholar] [CrossRef]
- Gao, Y.; Bower, A. Elastic-plastic contact of a rough surface with Weierstrass profile. Proc. R. Soc. A 2006, 462, 319–348. [Google Scholar] [CrossRef]
- Morag, Y.; Etsion, I. Resolving the contradiction of asperities plastic to elastic mode transition in current contact models of fractal rough surfaces. Wear 2007, 262, 624–629. [Google Scholar] [CrossRef]
- Miao, X.; Huang, X. A complete contact model of a fractal rough surface. Wear 2014, 309, 146–151. [Google Scholar] [CrossRef]
- Chen, Q.; Huang, K.; Zhao, H.; Zhang, Y. Simulation and analysis of the model of calculating contact tangential stiffness between cylinders’ joint interfaces by MATLAB. Appl. Mech. Mater. 2012, 190–191, 177–181. [Google Scholar] [CrossRef]
- Liu, P.; Zhao, H.; Huang, K.; Chen, Q. Research on normal contact stiffness of rough surface considering friction based on fractal theory. Appl. Surf. Sci. 2015, 349, 43–48. [Google Scholar] [CrossRef]
- Chen, Q.; Xu, F.; Liu, P.; Fan, H. Research on fractal model of normal contact stiffness between two spheroidal joint surfaces considering friction factor. Tribol. Int. 2016, 97, 253–264. [Google Scholar] [CrossRef]
- Hanaor, D.A.H.; Gan, Y.; Einav, I. Contact mechanics of fractal surfaces by spline assisted discretisation. Int. J. Solids Struct. 2015, 59, 121–131. [Google Scholar] [CrossRef]
- Ma, D.; Hou, L.; Wei, Y.; Chen, J. Sliding friction contact mechanics model of the involute arc cylindrical gear based on fractal theory. J. Mech. Eng. 2016, 52, 121–127. [Google Scholar] [CrossRef]
- Wang, R.; Zhu, L.; Zhu, C. Research on fractal model of normal contact stiffness for mechanical joint considering asperity interaction. Int. J. Mech. Sci. 2017, 134, 357–369. [Google Scholar] [CrossRef]
- Pan, W.; Li, X.; Wang, L.; Guo, N.; Mu, J. A normal contact stiffness fractal prediction model of dry-friction rough surface and experimental verification. Eur. J. Mech. 2017, 66, 94–102. [Google Scholar] [CrossRef]
- Pan, W.; Li, X.; Wang, L.; Mu, J.; Yang, Z. A loading fractal prediction model developed for dry-friction rough joint surfaces considering elastic-plastic contact. Acta Mech. 2018, 229, 2149–2162. [Google Scholar] [CrossRef]
- Shen, J.; Xu, S.; Liu, W.; Yang, J. Fractal model of normal contact stiffness between two spheres of joint interfaces with simulation. Mechanika 2017, 23, 703–713. [Google Scholar] [CrossRef] [Green Version]
- Guan, D.; Jing, L.; Gong, J.; Shen, H.; Hilton, H.H. Normal contact analysis for spherical pump based on fractal theory. Tribol. Int. 2018, 124, 117–123. [Google Scholar] [CrossRef]
- Zhao, Y.; Wu, H.; Liu, Z.; Cheng, Q.; Yang, C. A novel nonlinear contact stiffness model of concrete—Steel joint based on the fractal contact theory. Nonlinear Dyn. 2018, 94, 151–164. [Google Scholar] [CrossRef]
- Yuan, Y.; Cheng, Y.; Liu, K.; Gan, L. A revised Majumdar and Bushan model of elastoplastic contact between rough surfaces. Appl. Surf. Sci. 2017, 425, 1138–1157. [Google Scholar] [CrossRef]
- Yuan, Y.; Chen, J.; Zhang, L. Loading-unloading contact model between three-dimensional fractal rough surfaces. AIP Adv. 2018, 8. [Google Scholar] [CrossRef] [Green Version]
- Xu, K.; Yuan, Y.; Chen, J. The effects of size distribution functions on contact between fractal rough surfaces. AIP Adv. 2018, 8. [Google Scholar] [CrossRef] [Green Version]
- Jackson, R.L.; Green, I. A finite element study of elasto-plastic hemispherical contact against a rigid flat. J. Tribol. 2005, 127, 343–354. [Google Scholar] [CrossRef] [Green Version]
- Li, X.; Wang, X.; Yun, H.; Gao, J. Investigation into normal contact stiffness of fixed joint surface with three-dimensional fractal. J. South China Univ. Technol. 2016, 44, 114–122. [Google Scholar] [CrossRef]
- Tabor, D. The Hardness of Metals; Clarendon Press: Oxford, UK, 1951. [Google Scholar]
- Chen, J.; Yuan, Y.; Xu, Y. An analytical model of loading-unloading contact between rough surfaces based on fractal theory. J. Xi’an Jiaotong Univ. 2018, 52, 98–110. [Google Scholar] [CrossRef]
- Guan, C. Calculation of critical parameters for Hertz contact between cylinder and rigid plane. Bearing 2013. [Google Scholar] [CrossRef]
- Huang, K.; Zhao, H.; Chen, Q. Research on fractal contact model of cylinders’ surface. Adv. Tribol. 2010. [Google Scholar] [CrossRef]
- Ge, S.; Tonder, K. The fractal behavior and fractal characterization of rough surfaces. Tribology 1997, 17, 73–80. [Google Scholar] [CrossRef]


© 2020 by the authors. Licensee MDPI, Basel, Switzerland. This article is an open access article distributed under the terms and conditions of the Creative Commons Attribution (CC BY) license (http://creativecommons.org/licenses/by/4.0/).
Share and Cite
Wang, H.; Jia, P.; Wang, L.; Yun, F.; Wang, G.; Liu, M.; Wang, X. Modeling of the Loading–Unloading Contact of Two Cylindrical Rough Surfaces with Friction. Appl. Sci. 2020, 10, 742. https://doi.org/10.3390/app10030742
Wang H, Jia P, Wang L, Yun F, Wang G, Liu M, Wang X. Modeling of the Loading–Unloading Contact of Two Cylindrical Rough Surfaces with Friction. Applied Sciences. 2020; 10(3):742. https://doi.org/10.3390/app10030742
Chicago/Turabian StyleWang, Honghai, Peng Jia, Liquan Wang, Feihong Yun, Gang Wang, Ming Liu, and Xiangyu Wang. 2020. "Modeling of the Loading–Unloading Contact of Two Cylindrical Rough Surfaces with Friction" Applied Sciences 10, no. 3: 742. https://doi.org/10.3390/app10030742