Return of Interest Planning for Photovoltaics Connected with Energy Storage System by Considering Maximum Power Demand

 ,
,
Abstract
:1. Introduction
2. Recent Trend of Government Policies on Solar Energy Generation and Saving System
2.1. Recent Trend in Government Policies for Power Producers
2.2. Recent Trend in Government Policies for General Buildings
3. Analysis of Existing Cases
3.1. Case Study of Target Building
3.2. Case Study of Target System
3.3. Result of System Analysis from Case Study
4. Development of the Profit Rate of an ESS-Connected PV Analysis Method
4.1. Development of Economical Evaluation Method
- a(i): the profit from the renewable energy electricity fee discount
- b(i): the profit from the reduced usage fee
- c(i)the profit from the ESS battery capacity
- d(i): the profit from the reduction of power fund
- C0: the initial investment
- OM(i): the annual maintenance fee
- r: the discount rate
- n: the service period
- Energy generated from the PV system is consumed by the building itself and there is no other grid that is connected.
- REC is not considered because the economic evaluation is applied to a general building.
- Annual maintenance cost is set to 6% and it is included in total construction cost.
- Operating hours of the PV system is set from 11:00 h to 14:00 h, and the energy that is generated from sunrise to 11:00 h is not considered in the economic evaluation.
4.2. Analysis of the Result of Economic Evaluation
4.3. Analysis of Economic Feasibility as Price of PV/ESS Changes
4.4. Economic Evaluation with Verifying PV System Generation Times
4.5. Economic Evaluation on a System Only with ESS
4.6. Proposal for the Policies
5. Conclusions
Author Contributions
Funding
Conflicts of Interest
References
- Cha, H.L.; Bhang, B.G.; Park, S.Y.; Choi, J.H.; Ahn, H.K. Power Prediction of Bifacial Si PV Module with Different Reflection Conditions on Rooftop. Appl. Sci. 2018, 8, 1752. [Google Scholar] [CrossRef]
- Kim, G.G.; Choi, J.H.; Park, S.Y.; Bhang, B.G.; Nam, W.J.; Ahn, H.K. Prediction Model for PV Performance with Correlation Analysis of Environmental Variables. IEEE J. Photovolt. 2019, 9, 832–841. [Google Scholar] [CrossRef]
- Bhang, B.G.; Lee, W.; Kim, G.G.; Choi, J.H.; Park, S.Y.; Ahn, H.K. Power Performance of Bifacial c-Si PV Modules With Different Shading Ratios. IEEE J. Photovoltaics. 2019, 9, 1413–1420. [Google Scholar] [CrossRef]
- Korea Energy Agency. Available online: https://www.knrec.or.kr/main/main.aspx (accessed on 21 January 2020).
- Lee, H.G.; Kim, G.-Y.; Bhang, B.G.; Kim, D.K.; Park, N.; Ahn, H.-K. Design Algorithm for Optimum Capacity of ESS Connected With PVs Under the RPS Program. IEEE Access 2018, 6, 45899–45906. [Google Scholar] [CrossRef]
- Cho, C.Y.; Lee, W.; Bhang, B.G.; Choi, J.H.; Lee, S.H.; Woo, S.C.; Ahn, H.K. Convergence Analysis of Capacities for Photovoltaics and Energy Storage System Considering Energy Self-Sufficiency Rates and Load Patterns of Rural Areas. Appl. Sci. 2019, 9, 5323. [Google Scholar] [CrossRef] [Green Version]
- Ministry of Trade, Industry and Energy, the 6th Basic Plan for Electricity Supply and Demand (2013–2027); Ministration of Knowledge and Economy: Seoul, Korea, 2013.
- KOSPO. Necessity of Energy Storage System (ESS) and Policy Implications, Green Project, Bimonthly Magazine; KOSPO: Busan, Korea, 2018; Volume 101. [Google Scholar]
- Won, C.S. Technical trend of floating PV System. Korean Soc. Energy 2015, 13, 18–23. [Google Scholar]
- Gughyeon, Y. Technical Trend of Floating PV System; Konetic Report 2016–2109: Cheonan-si, Chungcheongnam-do, Korea, 2016. [Google Scholar]
- Korea Research Foundation. “Energy Storage Technology”, 2017 Future Promising Technology Program; National Research Foundation of Korea: Seoul, Korea, 2017. [Google Scholar]
- KPX Smart Grid Team. Study on Introduction of BESS to Stabilize Supply and Demand of Electric Power and Invigorate Smart Grid; Korea Power Exchange: Seoul, Korea, 2013. [Google Scholar]
- Khatib, T.; Mohamed, A.; Sopian, K. A review of solar energy modeling techniques. Renew. Sustain. Energy Rev. 2012, 16, 2864–2869. [Google Scholar] [CrossRef]
- Zahedi, A. Development of an electrical model for a PV/battery system for performance prediction. Renew. Energy 1998, 15, 531–534. [Google Scholar] [CrossRef]
- Li, J.; Wei, W.; Xiang, J. A Simple Sizing Algorithm for Stand-Alone PV/Wind/Battery Hybrid Microgrids. Energies 2012, 5, 5307–5323. [Google Scholar] [CrossRef] [Green Version]
- Henbest, S. New Energy Outlook 2018: BNEF’s Annual Long-Term Economic Analysis of the World’s Power Sector Out to 2050; BloombergNEF: 1616 Rhode Island Avenue, NW Washington DC, USA, 2018. [Google Scholar]
- Mellit, A.; Kalogirou, S.A. Artificial intelligence techniques for photovoltaic applications: A review. Prog. Energy Combust. Sci. 2008, 34, 574–632. [Google Scholar] [CrossRef]
- Sulaiman, S.I.; Rahman, T.K.A.; Musirin, I.; Shaari, S.; Sopian, K. An intelligent method for sizing optimization in grid-connected photovoltaic system. Sol. Energy 2012, 86, 2067–2082. [Google Scholar] [CrossRef]
- Khatib, T.; Mohamed, A.; Sopian, K. A review of photovoltaic systems size optimization techniques. Renew. Sustain. Energy Rev. 2013, 22, 454–465. [Google Scholar] [CrossRef]
- Abdulkadir, M.; Samosir, A.; Yatim, A. Modeling and Simulation based Approach of Photovoltaic system in Simulink model. J. Eng. Appl. Sci. 2012, 7, 616–623. [Google Scholar]
- Mellit, A.; Benghanem, M.; Kalogirou, S.A. Modeling and simulation of a stand-alone photovoltaic system using an adaptive artificial neural network: Proposition for a new sizing procedure. Renew. Energy 2007, 32, 285–313. [Google Scholar] [CrossRef]
- Sera, D.; Teodorescu, R.; Rodriguez, P. PV panel model based on datasheet values. In Proceedings of the 2007 IEEE International Symposium on Industrial Electronics, Vigo, Spain, 4–7 June 2007; pp. 2392–2396. [Google Scholar]
- Perez-Gallardo, J.R.; Azzaro-Pantel, C.; Astier, S.; Domenech, S.; Aguilar-Lasserre, A. Ecodesign of photovoltaic grid-connected systems. Renew. Energy 2014, 64, 82–97. [Google Scholar] [CrossRef] [Green Version]
- Lalwani, M.; Kothari, D.; Singh, M. Investigation of solar photovoltaic simulation softwares. Int. J. Appl. Eng. Res. 2010, 1, 585–601. [Google Scholar]
- Näsvall, D. Development of a Model for Physical and Economical Optimization of Distributed PV Systems. Master’s Thesis, Uppsala University, Uppsala, Sweden, 2013. [Google Scholar]
- Eltawil, M.A.; Zhao, Z. Grid-connected photovoltaic power systems: Technical and potential problems—A review. Renew. Sustain. Energy Rev. 2010, 14, 112–129. [Google Scholar] [CrossRef]


| Category | Content |
|---|---|
| Target |
|
| Contract Power Demand |
|
| Power meters |
|
| Rate applied |
|
| Discount rule |
|
| Application period | 77 |
| Category | Content |
| Target |
|
| Installation of power meters |
|
| Discount rule |
|
| Application period | Applied from 1 May 2017 to 1 May 2020 |
| Category | Information |
|---|---|
| Electric power rate | General service (A) (High voltage) |
| Contract demand [kW] | 13,000 |
| Basic Charge [USD] | 7.39 |
| Real demand [kW] | 4124 |
| Monthly base rate [USD] | 30,471.2 |
| Season | Off Peak Load Time | Mid Load Time | Peak Load Time |
|---|---|---|---|
| Spring | 0.05 | 0.07 | 0.1 |
| Summer | 0.05 | 0.1 | 0.17 |
| Autumn | 0.05 | 0.07 | 0.1 |
| Winter | 0.06 | 0.1 | 0.15 |
| Classification | Summer, Spring, Autumn | Winter |
|---|---|---|
| Off peak load time | 23:00–09:00 | 23:00–09:00 |
| Mid. load time | 09:00–10:00 12:00–13:00 17:00–23:00 | 09:00–10:00 12:00–17:00 20:00–22:00 |
| Peak load time | 10:00–12:00 13:00–17:00 | 10:00–12:00 17:00–20:00 22:00–23:00 |
| Month. | Maximum Power Demand [kW] |
|---|---|
| Jan. | 3271 |
| Feb. | 3279 |
| Mar. | 3248 |
| Apr. | 3356 |
| May | 3509 |
| Jun. | 3717 |
| Jul. | 4124 |
| Aug. | 4124 |
| Sep. | 3671 |
| Oct. | 3448 |
| Nov. | 3233 |
| Dec. | 3194 |
| PV Capacity | 200 [kW] | Peak Savings Limitation (30% of Contract Demand) | 3900 [kW] |
|---|---|---|---|
| Solar charging time | 3 h | PCS capacity | 250 [kW] |
| Battery capacity | 586 [kWh] | Battery capacity (Depth of Discharge 90%) | 527.4 [kWh] |
| Operation time at peak load | 3 h | Operation time at mid. load | 1 h |
| Discharge capacity at peak load | 377.4 [kWh] | Discharge capacity at mid. Load | 150 [kWh] |
| Battery charging efficiency | 98.48% | ||
| Battery discharging efficiency | 95.76% | Charge/Discharge efficiency | 97.20% |
| Category | Content |
|---|---|
| Demand charge savings | Peak cut amount × Unit price of demand charge |
| Demand charge discount | The demand charge is discounted by three times the decline in the peak demand. |
| Energy charge savings | [Discharge quantity × (energy charge unit price of peak/mid load condition)] − [Charge quantity × (energy charge unit price of light-load condition)] |
| Energy charge discount | 50% discount to the energy charge when off-peak hour (for ESS charging) is applied. |
| Additional discount | Additional discount is applied differently for each cases: If the capacity of ESS is less than 5% of the contract demand, there are no discount: If the capacity of ESS is between 5% and 10% of the contract demand, additional discount that is 20% of renewable energy discount takes place: If the capacity of ESS is greater than 10% of the contract demand, additional discount, 50% of renewable energy discount, takes place |
| Category | Item | Price [$] |
|---|---|---|
| Investment cost (including VAT) | 545,068.87 | |
| Savings(10years) | Energy charge savings | 210,734.18 |
| Reduced by ESS capacity ratio | 107,977.69 | |
| Reduction of power-based funds | 11,792.34 | |
| Sub total | 330,504.21 | |
| Total savings (including VAT) | 406,195,958 | |
| Payback period (years) | 17.55 | |
| Item | Capacity | Unit Price | Price [$] |
|---|---|---|---|
| ESS [kWh] | 586 | 340.12 | 222,680,000 |
| PCS [kW] | 250 | 40,277.83 | 40,277.83 |
| PMS | - | 40,277.83 | 40,277.83 |
| Construction Cost | - | 44,753.14 | 44,753.14 |
| PV [kW] | 200 | 1102.36 | 220,471.88 |
| Sum | - | - | 545,093.27 |
| Case | PV [kW] | ESS [kWh] | PCS [kW] | ROI [Year] | Initial Investment [$] |
|---|---|---|---|---|---|
| Case 1 | 200 | 705 | 250 | 10.45 | 676,599.55 |
| Case 2 | 250 | 846 | 250 | 8.62 | 796,706.94 |
| Case 3 | 300 | 987 | 300 | 9.72 | 988,402.68 |
| Case 4 | 350 | 1128 | 350 | 9.32 | 1,072,715.88 |
| Case 5 | 400 | 1128 | 500 | 9.46 | 1,157,727.07 |
| Case 6 | 500 | 1142 | 500 | 10.56 | 1,371,794.18 |
| Case 7 | 800 | 1692 | 800 | 12.77 | 1,996,098.43 |
| Category | Battery | PV | ||
|---|---|---|---|---|
| Year(20xx) | Standard | Drop Ratio | Standard | Drop Ratio |
| 18 | 302 | 1 | 0.93 | 1 |
| 19 | 282 | 0.93 | 0.9 | 0.97 |
| 20 | 262 | 0.87 | 0.86 | 0.92 |
| 21 | 245 | 0.81 | 0.79 | 0.85 |
| 22 | 228 | 0.75 | 0.76 | 0.82 |
| 23 | 212 | 0.7 | 0.73 | 0.78 |
| 24 | 197 | 0.65 | 0.7 | 0.75 |
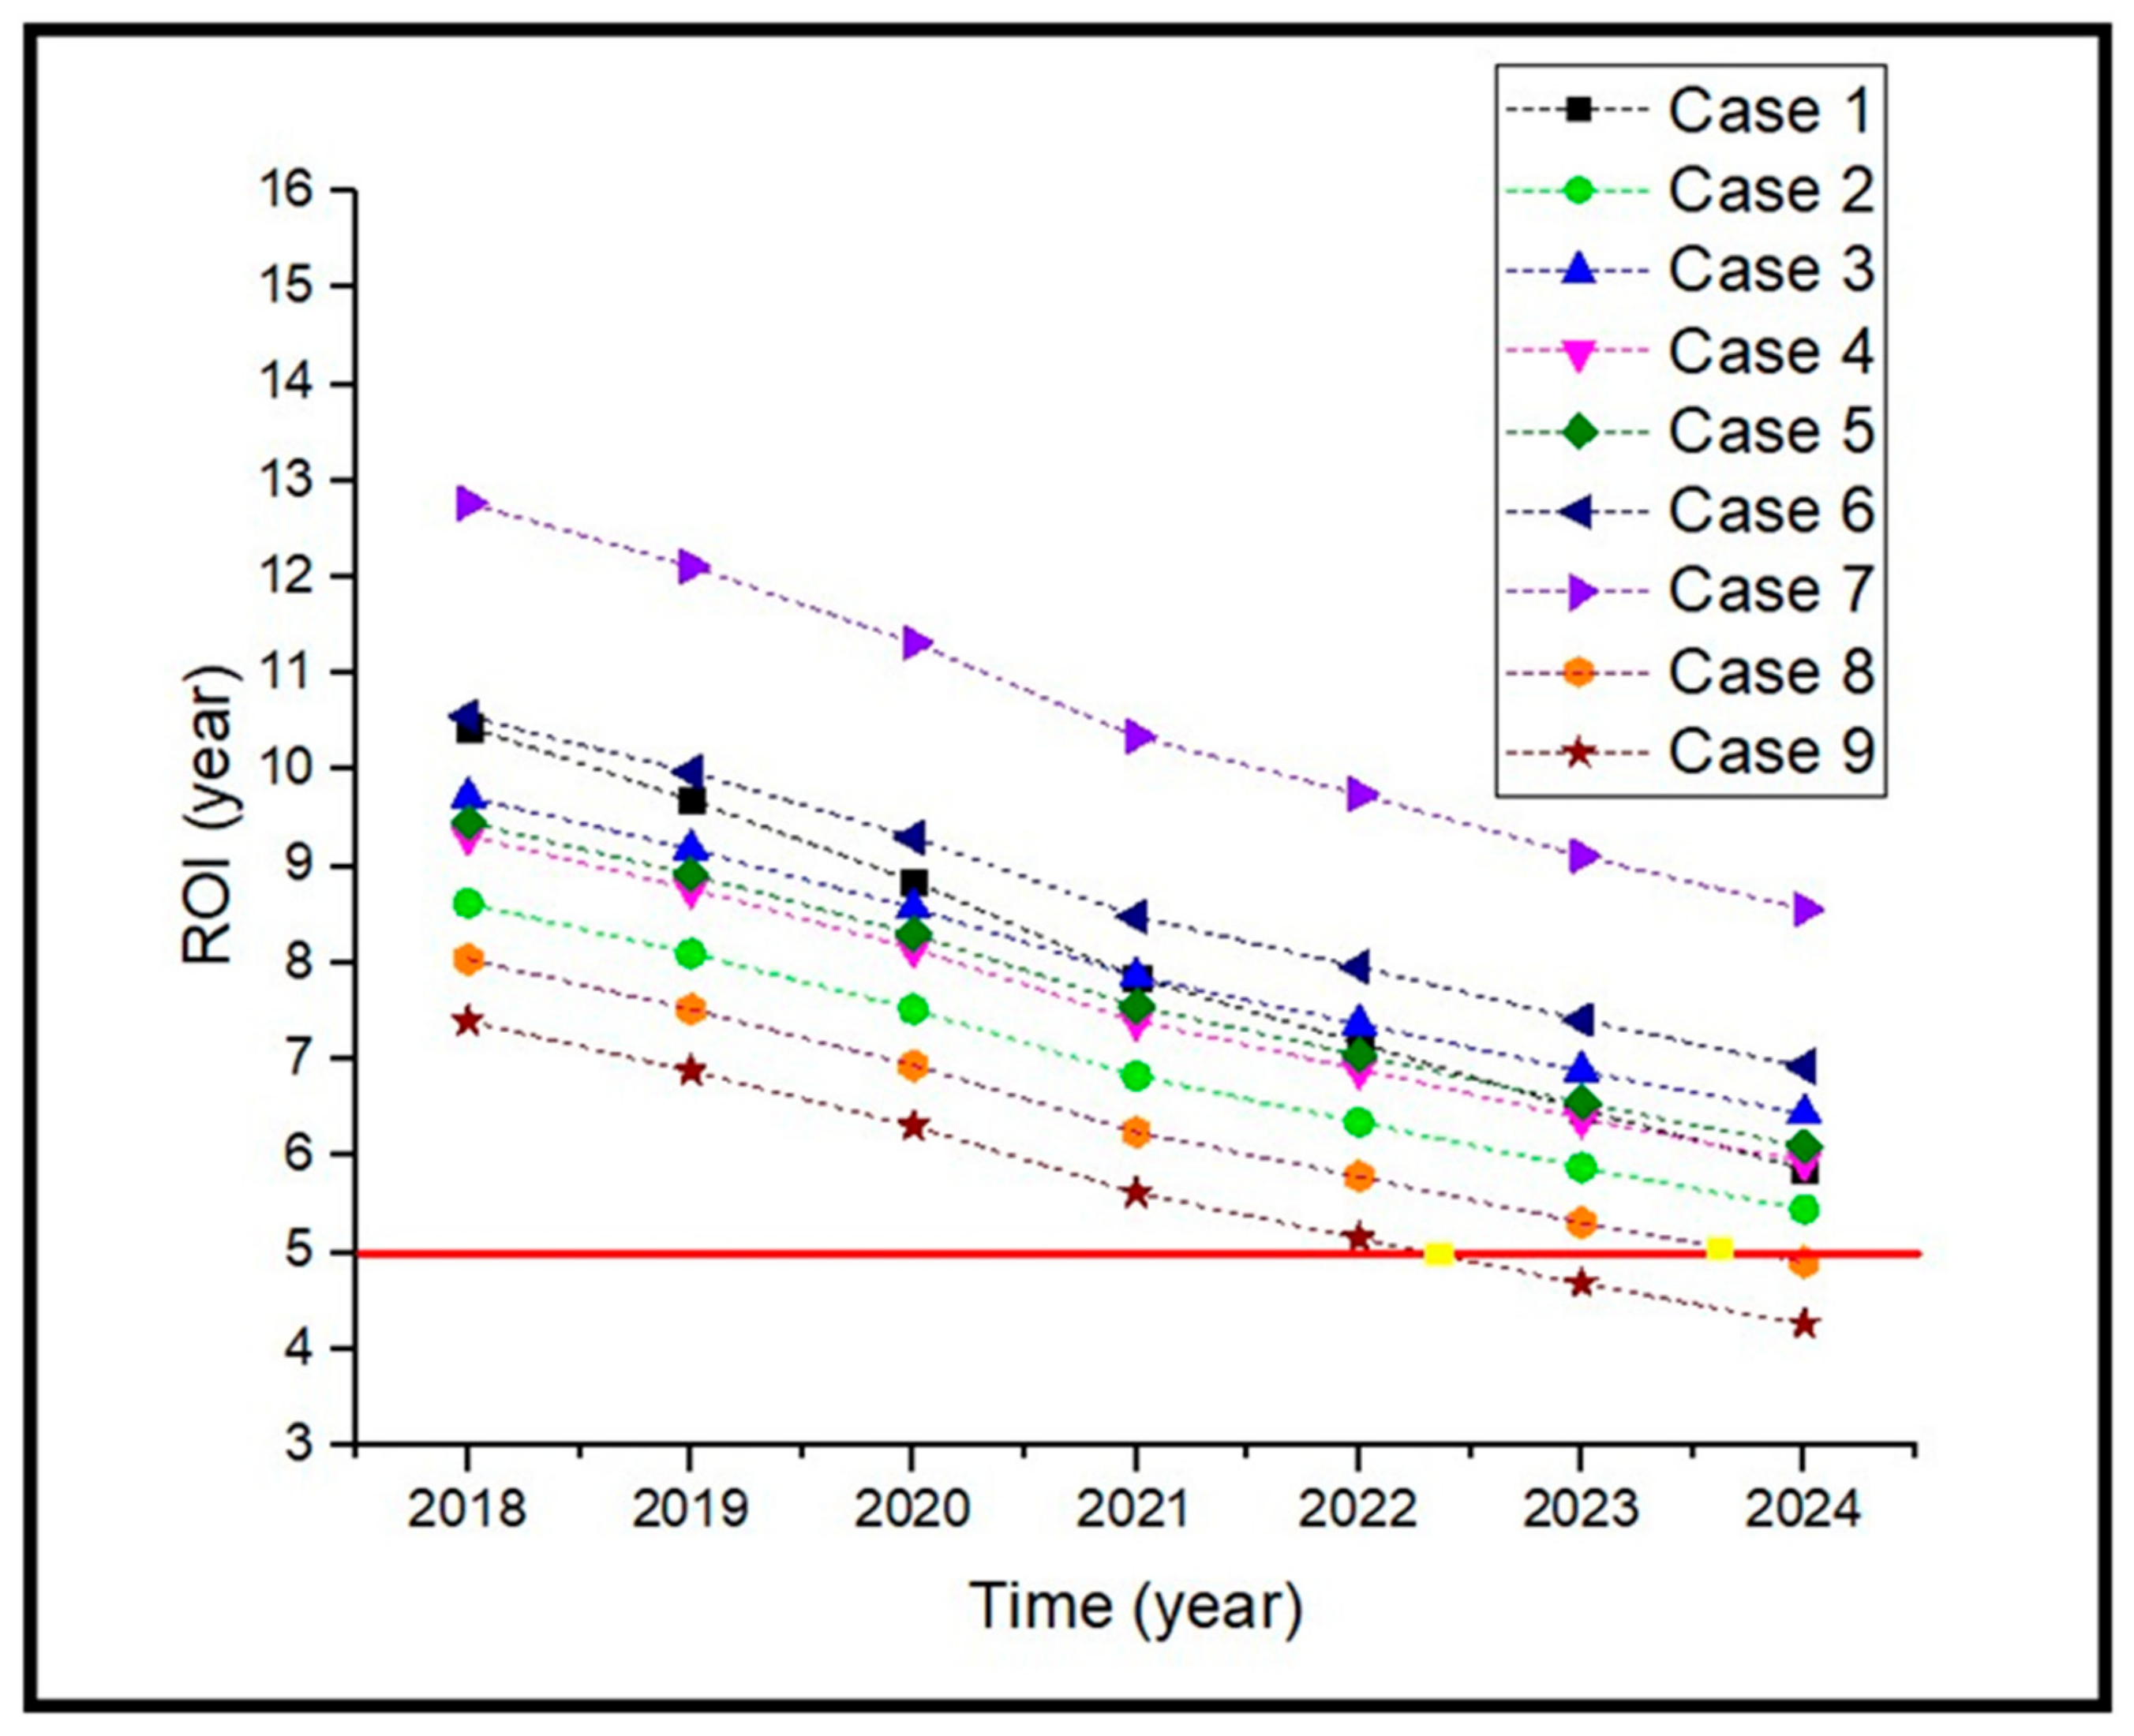
| Case NO. PV [kW]/ESS [kWh]/PCS [kW] | 2018 | 2019 | 2020 | 2021 | 2022 | 2023 | 2024 |
|---|---|---|---|---|---|---|---|
| [Case 1] 200/705/250 | 10.45 | 9.69 | 8.85 | 7.85 | 7.17 | 6.48 | 5.87 |
| [Case 2] 250/846/250 | 8.62 | 8.10 | 7.52 | 6.83 | 6.35 | 5.88 | 5.45 |
| [Case 3] 300/987/300 | 9.72 | 9.18 | 8.57 | 7.86 | 7.37 | 6.88 | 6.44 |
| [Case 4] 350/1128/350 | 9.32 | 8.77 | 8.15 | 7.40 | 6.9 | 6.39 | 5.94 |
| [Case 5] 400/1128/500 | 9.46 | 8.92 | 8.30 | 7.55 | 7.05 | 6.55 | 6.10 |
| [Case 6] 500/1669/500 | 10.56 | 9.98 | 9.30 | 8.48 | 7.96 | 7.41 | 6.93 |
| [Case 7] 800/1,692/800 | 12.77 | 12.11 | 11.32 | 10.35 | 9.75 | 9.11 | 8.56 |
| [Case8] 500/1667/500 | 8.04 | 7.52 | 6.94 | 6.25 | 5.79 | 5.31 | 4.90 |
| [Case9] 800/2667/500 | 7.4 | 6.88 | 6.31 | 5.62 | 5.15 | 4.68 | 4.26 |
| Insolation [h] | ROI [year] | ||||
|---|---|---|---|---|---|
| PVCapacity [kW] | 3 | 4 | 5 | 6 | |
| 200 | 10.45 | 10.09 | 11.16 | 13.24 | |
| 250 | 8.62 | 8.81 | 9.19 | 9.59 | |
| 300 | 9.72 | 9.8 | 10.39 | 10.76 | |
| 350 | 9.32 | 9.92 | 10.44 | 10.77 | |
| 400 | 9.46 | 10.26 | 10.24 | 10.56 | |
| 500 | 10.56 | 10.62 | 10.9 | 11.19 | |
| 800 | 12.77 | 14.28 | 12.8 | 13.04 | |
| Cases with PV + ESS | Cases with ESS Only | ||||||
|---|---|---|---|---|---|---|---|
| Cases | Case2 | Case4 | Case7 | Case2-1 | Case4-1 | Case 7-1 | |
| Facility Condition | PV [kW] | 250 | 350 | 800 | 0 | 0 | 0 |
| ESS [kWh] | 846 | 1128 | 1692 | 846 | 1128 | 1692 | |
| PCS [kW] | 250 | 350 | 800 | 250 | 350 | 800 | |
| Case Number | ROI [year] | |||
|---|---|---|---|---|
| Specifics | 2 | 4 | 7 | |
| Case with PV + ESS | 8.62 | 9.32 | 12.77 | |
| Case with ESS only | 7.12 | 6.96 | 7.28 | |
| Reduction rate [%] | 17.4 | 25.3 | 43.0 | |
| Average reduction rate [%] | 28.6 | |||
| Case | Improvement Plan |
| Contract demand Related | Exclusive ESS plan 5 years grace period Lowering the 30% limit to 20% |
| Discount on renewable energy electricity | The validity period until 2023 |
| ESS exclusive plan | Maintaining the current system |
© 2020 by the authors. Licensee MDPI, Basel, Switzerland. This article is an open access article distributed under the terms and conditions of the Creative Commons Attribution (CC BY) license (http://creativecommons.org/licenses/by/4.0/).
Share and Cite
Kim, S.-S.; Lee, W.; Bhang, B.G.; Choi, J.H.; Lee, S.H.; Woo, S.C.; Nam, W.J.; Ahn, H.K. Return of Interest Planning for Photovoltaics Connected with Energy Storage System by Considering Maximum Power Demand. Appl. Sci. 2020, 10, 786. https://doi.org/10.3390/app10030786
Kim S-S, Lee W, Bhang BG, Choi JH, Lee SH, Woo SC, Nam WJ, Ahn HK. Return of Interest Planning for Photovoltaics Connected with Energy Storage System by Considering Maximum Power Demand. Applied Sciences. 2020; 10(3):786. https://doi.org/10.3390/app10030786
Chicago/Turabian StyleKim, Sung-Soo, Wonbin Lee, Byeong Gwan Bhang, Jin Ho Choi, Sang Hun Lee, Sung Cheol Woo, Woo Jun Nam, and Hyung Keun Ahn. 2020. "Return of Interest Planning for Photovoltaics Connected with Energy Storage System by Considering Maximum Power Demand" Applied Sciences 10, no. 3: 786. https://doi.org/10.3390/app10030786