1. Introduction
With the rapid development of consumer products such as mobile phones, notebook computers, and MP4 players, audio transducers have been recognized as multifunctional assets with which to increase the convenience of multimedia products. According to the working-principle difference, there are electrostatic [
1,
2], balanced armature [
3,
4] piezoelectric [
5,
6,
7], and moving coil speakers. A speaker enclosure is used to separate the sound from the front and back to avoid sound cancelation by speakers. A closed speaker enclosure uses a vent structure or passive radiator to improve the low-frequency response.
Tools for analysis of speaker performance were investigated in previous works. Physically, the loudspeaker consists of electromagnetic, mechanical, and acoustic domains. The three domains can be described with second-order differential equations that are modeled using a combination of resistance, capacity, and inductance; thus, the equivalent-circuit method is used in the electromagnetic, mechanical, and acoustic domains [
8]. Based on the equivalent-circuit method, Small et al. analyzed the passive radiator loudspeaker [
9,
10]. In addition, Jiang et al. came up with the two DOF modeling methods to analyze speaker boxes with passive radiators [
11]. The acoustic part is modeled as the piston model. The inner shape of speaker enclosure was not considered.
The originality of the proposed work is the analysis method used to consider the standing wave of the speaker box. Based on the analysis tool, a screen is used to reduce the effect of the standing wave and improve the frequency response.
The main content of the paper is as follows. First, the electromagnetic and mechanical domains are described by a lumped-parameter method that uses an equivalent circuit. The acoustic domain uses the finite element method to consider the inner shape and structure of the enclosure. Second, based on the combination of lumped-parameter method and finite element method, a screen is used and analyzed in the enclosure to reduce the peak caused by the standing wave. Finally, the speaker enclosure with a passive radiator and screen sample is manufactured. The sound pressure level (SPL) simulation result is matched with the experimental result. The dip and peak in the frequency response curve are canceled using a screen, and thus the SPL performance is improved.
2. Analysis Method
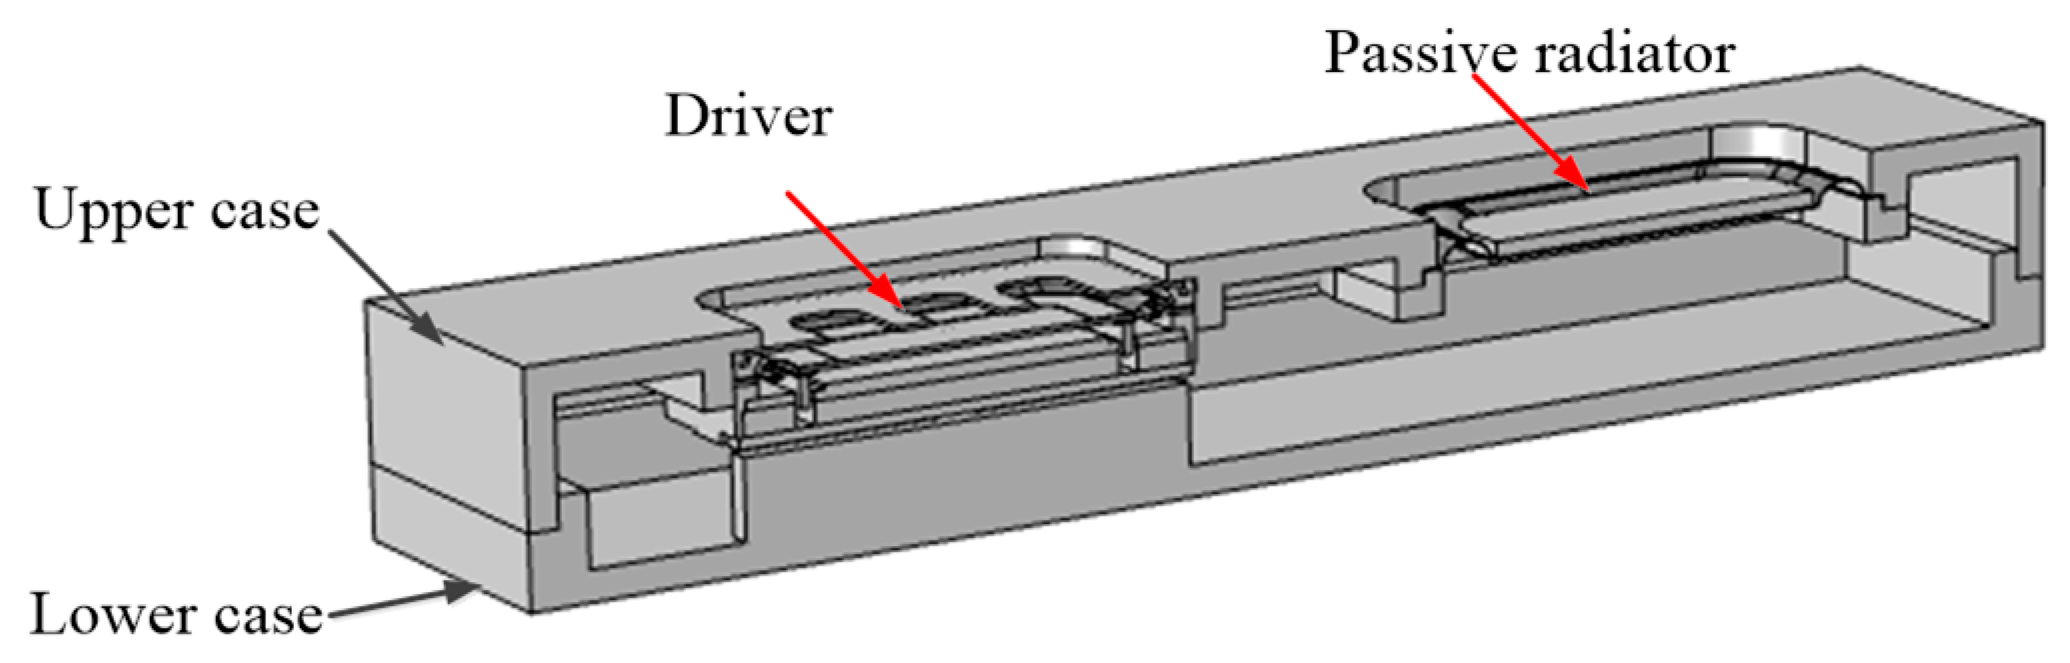
A speaker enclosure with a passive radiator is depicted in
Figure 1. It consists of a driver, passive radiator, and enclosure. The components of the driver and passive radiator are depicted in
Figure 2. The working principle of the speaker enclosure with a passive radiator is described as follows. The input current in the coil of the driver causes a Lorentz force in the coil. This force causes the diaphragm to vibrate; thus, the sound in the front of the driver is radiated. Simultaneously, the pressure behind the driver diaphragm changes, which leads to vibration of the passive radiator. The inner space in the enclosure contributes to the acoustic vibration mode.
2.1. Electromagnetic Modeling
The electromagnetic part is depicted in
Figure 3. The mathematical equation is as follows.
where
RE,
LE,
V and
i are the electrical voice-coil resistance, the voice-coil inductance, the voltage, and the current.
2.2. Mechanical Modeling
The 1-DOF vibration system depicted in
Figure 4 is adopted for the mechanical domain.
The governing equation is as follows.
where
Mms is the mechanical mass of the vibration system which includes the driver diaphragm, suspension, and coil,
Rms the mechanical resistance of the total-driver losses, and
Cms the mechanical compliance of the driver suspension.
2.3. Acoustic Modeling
Acoustic waves are created by the propagation of small, linear fluctuations in pressure over a stationary background (atmospheric) pressure [
12]. The governing equation is described in Equation (3). The equation describes the relationship between velocity and sound pressure.
where
w is the angular frequency,
ρ0 the background density,
the node velocity, and
c the sound velocity. In addition to the governing equation, there is boundary condition to solve the governing equation. The impedance boundary condition describes the pressure drop across the boundary to the velocity at the boundary.
where
Zi is the acoustic impedance, which is the ratio between the pressure drop and the normal particle velocity. There are two opposite limits. One is that acoustic impedance becomes zero. The other is that acoustic impedance becomes infinite. This boundary condition is identical to the sound hard and sound soft boundary conditions, respectively. The surface of speaker and speaker box are treated as rigid wall, which means the acoustic impedance is infinite. The acoustic impedance of air in the enclosure is zero.
ρc,
pt, qd, pt,left and
pt,right are the density of air, sound pressure of air, zero dipole source, acoustic pressure on the left and right surface.
2.4. Electromagnetic-Mechanical-Acoustic Coupling
2.4.1. Electromagnetic–Mechanical Coupling
The electromagnetic and mechanical domains are coupled by the force factor which is the product of flux density and coil length. The vibration force is contributed by the electric current in the driver unit. The force can be calculated as
where
F is the vibration force,
Bl the force factor, and
i the current. In Equation (5), the current is solved in the electrical domain. The calculation method is demonstrated in Equation (1). Conversely, the back EMF in electrical domain is contributed by the diaphragm velocity. The back EMF is calculated as
where
V is the back EMF and
the velocity. In Equation (6), the velocity is solved by the 1-DOF equation in the mechanical domain.
2.4.2. Mechanical–Acoustic Coupling
The mechanical and acoustic domains are coupled by the diaphragm of driver and passive radiator. For the acoustic domain, the input is the velocity, which is in a direction normal for the diaphragm. The velocity is described as
where
,
X and φ are the velocity, displacement, and displacement phase, respectively. By solving the standard acoustic governing equation, the sound pressure in every node of air region can be solved. The pressure is calculated in the following equations
The lower part and upper part air pressure forces are defined as
Flower and
Fupper, respectively.
Flower and
Fupper are obtained by integrating the node pressure force over the diaphragm surface. The difference between the lower part and upper part air pressures is defined as
Fair. The air-pressure force is depicted in
Figure 5. In addition, a current force drives the unit, except for the air-pressure force. This current force is defined as
Fcurrent. The total force acting on the vibration system is
F. It is concluded that the total force influences the mechanical velocity. Therefore, the mechanical and acoustic domains are considered to be coupled with each other.
Based on this description, the simulation tool of the speaker box with the passive radiator is depicted in
Figure 6. The electromagnetic and mechanical parameters are listed in
Table 1, based on the parameter-identification method described in [
13]. The inductance and force factor are calculated by electromagnetic FEM. The effective mass and stiffness are calculated by mechanical FEM. The SPL simulation results of the enclosure are obtained after the parameters are applied in the equivalent circuit. The experiment is conducted after the sample is manufactured. In the previous method, the acoustic domain is modeled by the piston radiation model [
11]. In the proposed method, the acoustic domain is modeled by finite element method which can consider the enclosure inner shape.
According to the SPL comparison of the simulation and experimental results shown in
Figure 7, the simulation tool is verified experimentally and can be used to analyze the performance of the speaker enclosure with the passive radiator. From 100 Hz to 3 kHz in the SPL curve comparison, the previous method and proposed method both can predict the SPL, because there is no standing wave in the enclosure. In addition, the wavelength of sound in low frequency satisfies the requirement of piston sound source model. After 3 k, the previous method cannot predict the SPL of the speaker enclosure with a passive radiator, whereas the proposed method can. This is because the proposed method considers the acoustic geometry, whereas the previous method cannot.
3. FEM Modeling of Standing Wave
The three dimension wave equation describes the sound pressure and velocity relationship. The wall of enclosure is treated as hard sound boundary condition, which means velocity is zero. The three dimension wave equation is solved based on the boundary conditions. According to the sound pressure solution, the sound pressure resonance is calculated as [
12]
where
is the acoustic-enclosure resonance frequency;
nx, ny, and
nz are the integers for the corresponding resonance modes;
lx,
ly, and
lz are the lengths of the enclosure in the
x,
y, and
z directions, respectively; and
c is the air velocity. Thus, the resonance frequency of the standing wave is related to the dimensions of the speaker box. The resonance decreases with increase in speaker-box dimensions.
When the enclosure dimension is substituted into Equation (10), the resonance of the speaker box is calculated as 3253 Hz, which is caused by the longest dimension of the speaker box. This frequency is close to the experimental resonance peak frequency of 3150 Hz. The difference in values is because the speaker box is not an exact rectangular box.
The standing wave can be explained as an acoustic wave that stands at a certain position and does not move in the speaker box. Before the frequency reaches 3150 Hz, the sound pressure under the diaphragm of the driver reaches a minimum, which means that the force acting on the driver diaphragm is a minimum. Thus, the acceleration is at a minimum, causing a dip in the SPL curve. Similarly, the peak at 3150 Hz occurs because the standing wave under the diaphragm of the driver is at a maximum. Thus, the force and acceleration are at a maximum, causing a peak in the SPL curve.
Figure 8 shows the sound-pressure distribution. The sound pressure under the driver diaphragm is at the minimum at 3000 Hz and at the maximum at 3150 Hz; the latter contributes to the peak in the SPL curve.
Figure 9 shows the force curve in terms of the frequency domain. The current force is defined as the force caused by the input current in the coil. It is at a minimum around the resonance frequency because the current is at a minimum. The dip and peak of the pressure force at approximately 3000 Hz is because of the sound-pressure distribution in the enclosure. The detail explanation is listed in the following sentence.
The total force acting on the driver is the summation of the current force and pressure force on the driver. The acceleration of the driver and passive radiator is demonstrated in
Figure 10, based on the forces acting on them. The dip and peak remain at approximately 3000 Hz because of the acting force.
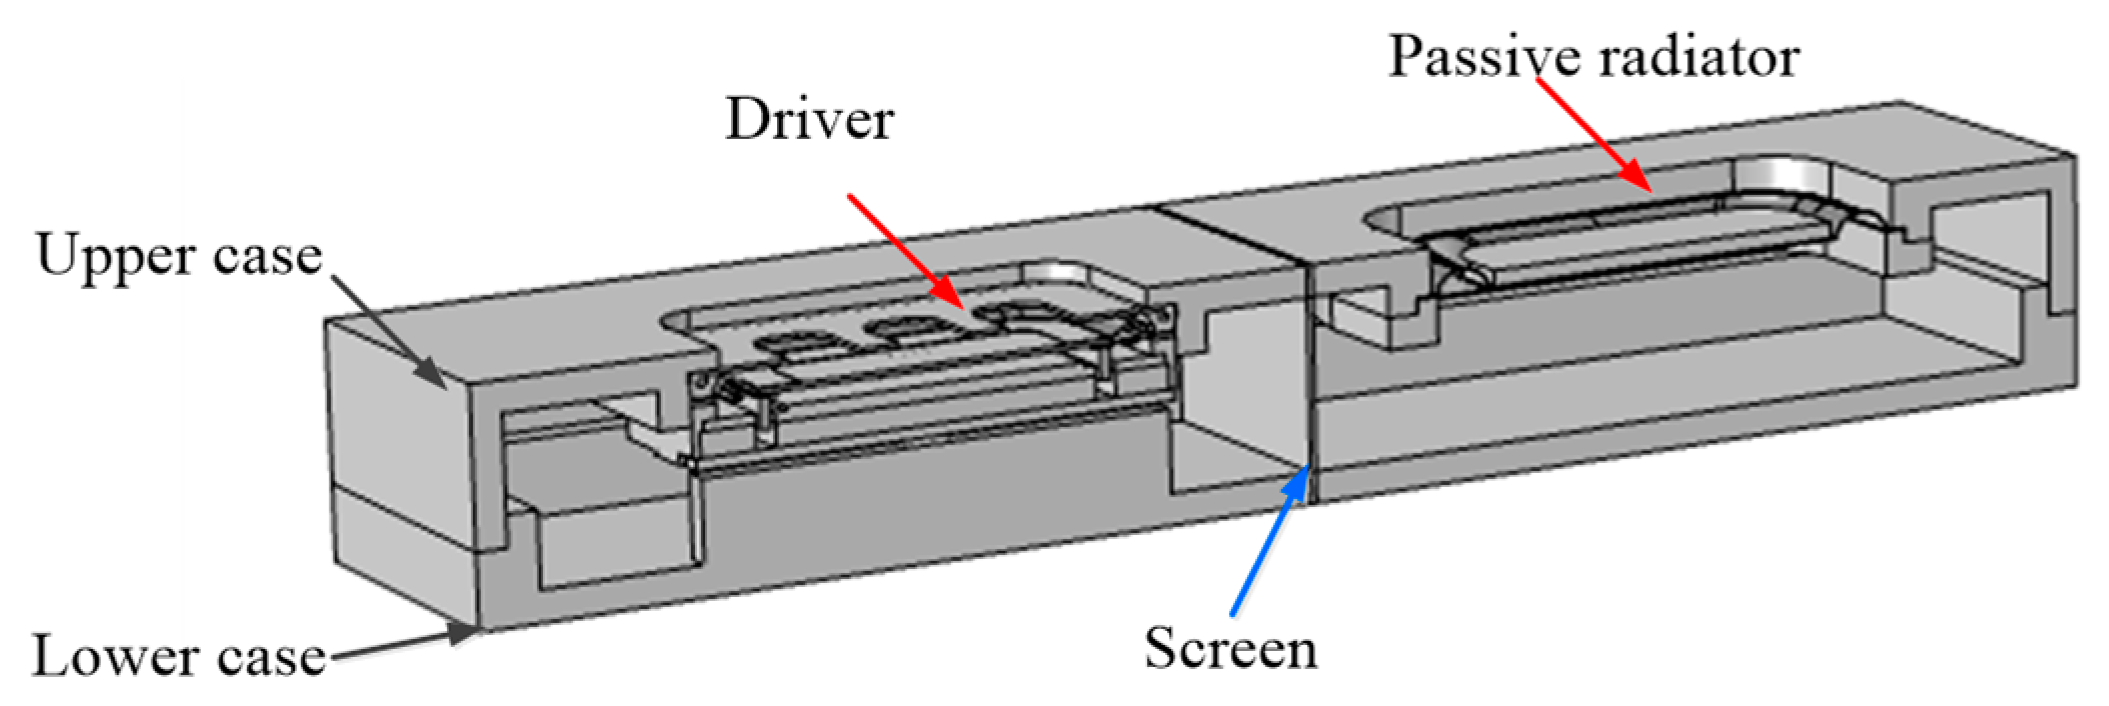
The dip and peak in the SPL curve can be explained with the acceleration which is caused by the sound-pressure distribution in the enclosure as a result of the standing wave. The dips and peaks caused by the standing wave need to be reduced to improve the response curve of the speaker box with the passive radiator. The screen is used to cancel the standing-wave effect. The screen, demonstrated in
Figure 11, is made using ventilation material that has small holes to allow sound to penetrate. The screen detail is listed in
Table 2. According to
Table 2, the acoustic impedance of screen is 145 MKS Rayls which can be substituted in Equation (4).
The sound-pressure distribution is depicted in
Figure 12 after the screen was applied to the enclosure. It can be seen that the sound pressure variation under the driver diaphragm with screen is smaller compared with that without the screen.
A simulation was run to determine the influence of the screen. The proposed method was used to consider the standing-wave effect. The simulation shows that the peak and dip in SPL is cancelled with the screen. The simulation result is depicted in
Figure 13.
4. Experiment
Samples were manufactured as shown in
Figure 14. The screen was inserted in the speaker box. The left side was the driver and the right side was the passive radiator.
Figure 15 demonstrates the screen. There were holes in the screen.
Figure 16 depicts the setup of the SPL experiment using B&K equipment. The speaker box was put in the open field. The microphone was put 10 cm away from the speaker box. The testing frequency range was 100 Hz to 20 kHz, and a swept sine signal was used. In the B&K equipment, there was a power amplifier (B&K, 2718), analyzer (B&K, 2718), preamplifier (B&K, 2669) and microphone (B&K, 4191). The received sound signal was transformed to the frequency domain by fast Fourier transform (FFT).
Figure 17 shows the experimental SPL result. From 100 Hz to 1 kHz, there was no change because there was no standing wave between this range. It can be seen there are two peaks. The first peak is the resonance of passive radiator with speaker box. The second peak is the resonance of driver with speaker box. The dip and peak at 3 and 3.1 kHz are due to the standing wave and are cancelled by the screen because the driver diaphragm and passive radiator diaphragm vibrates on left and right side, respectively. Therefore, the first acoustic mode is excited and the other acoustic resonance modes are not excited obviously after 3 k. Therefore, there is not much change after 3 kHz.
5. Conclusions
This work modeled a speaker box with a passive radiator as an electrical element and applied the equivalent-circuit method to model the electromagnetic and mechanical domains. The acoustic domain was modeled by a finite element method to consider the acoustic geometry. Compared with the method which uses equivalent-circuit method, the proposed method can be used to predict the standing wave caused by enclosure shape. According to the analysis method, there are dips and peaks at 3 and 3.1 kHz because of the standing wave. A screen was designed and applied to decrease the dip and peak values. The samples were manufactured and experiments was conducted. Comparison with the simulation result shows that the analysis was verified by the experimental result. Moreover, the screen can be used to decrease the peak value of SPL and improve the sound quality.
Author Contributions
Conceptualization, Y.-W.J. and S.-M.H.; methodology, Y.-W.J., D.-P.X.; software, Y.-W.J., Z.-X.J.; validation, Y.-W.J., Z.-X.J., D.-P.X., K.-H.P. and Z.-X.J.; formal analysis, Y.-W.J., J.-H.K.; investigation, Y.-W.J.; resources, Y.-W.J.; data curation, Y.-W.J.; writing—original draft preparation, Y.-W.J., K.-H.P.; writing—review and editing, Y.-W.J., Z.-X.J., K.-H.P. and J.-H.K.; visualization, Y.-W.J.; supervision, S.-M.H.; project administration, S.-M.H., J.-H.K.; funding acquisition, S.-M.H. All authors have read and agreed to the published version of the manuscript.
Funding
This research received no external funding.
Conflicts of Interest
The authors declare no conflict of interest.
Abbreviations
The following abbreviations are used in this manuscript:
| SPL | Sound pressure level |
| FFT | Fast Fourier transform |
| DOF | Degree of freedom |
| EMF | Electromotive force |
| FEM | Finite element method |
References
- Chiang, H.Y.; Huang, Y.H. Vibration and sound radiation of an electrostatic speaker based on circular diaphragm. J. Acoust. Soc. Am. 2015, 137, 1714–1721. [Google Scholar] [CrossRef] [PubMed]
- Sanders, R.R. The Electrostatic Loudspeaker Design Cookbook; Audio Amateur, Inc.: Peterborough, NH, USA, 2017. [Google Scholar]
- Jiang, Y.W.; Xu, D.P.; Jiang, Z.X.; Kim, J.H.; Hwang, S.M. Comparison of Multi-Physical Coupling Analysis of a Balanced Armature Receiver between the Lumped Parameter Method and the Finite Element/Boundary Element Method. Appl. Sci. 2019, 9, 839. [Google Scholar] [CrossRef] [Green Version]
- Jiang, Y.W.; Xu, D.P.; Hwang, S.M. Electromagnetic-mechanical analysis of a balanced armature receiver by considering the nonlinear parameters as a function of displacement and current. IEEE Trans. Magn. 2018, 54, 1–4. [Google Scholar]
- Zhao, C.; Knisely, K.E.; Grosh, K. Design and fabrication of a piezoelectric MEMS xylophone transducer with a flexible electrical connection. Sens. Actuators A Phys. 2018, 275, 29–36. [Google Scholar] [CrossRef]
- Zhao, C.; Hake, A.; Sung, W.K.; Grosh, K. Miniature implantable low noise piezoelectric diaphragm sound sensor. J. Acoust. Soc. Am. 2018, 143, 1804. [Google Scholar] [CrossRef]
- Zhao, C.; Knisely, K.E.; Colesa, D.J.; Pfingst, B.E.; Raphael, Y.; Grosh, K. Voltage readout from a piezoelectric intracochlear acoustic transducer implanted in a living guinea pig. Sci. Rep. 2019, 9, 3711. [Google Scholar] [CrossRef] [PubMed] [Green Version]
- Leach, W.M. Introduction to Electroacoustics and Audio Amplifier Design; Kendall/Hunt Publishing Company: Dubuque, IA, USA, 2003. [Google Scholar]
- Small, R.H. Passive-radiator loudspeaker systems. Part 1: Analysis. J. Audio Eng. Soc. 1974, 22, 592–601. [Google Scholar]
- Small, R.H. Passive-radiator loudspeaker systems. Part 2: Synthesis. J. Audio Eng. Soc. 1974, 22, 683–689. [Google Scholar]
- Jiang, Y.W.; Kwon, J.H.; Kim, H.K.; Hwang, S.M. Analysis and optimization of micro speaker-box using a passive radiator in portable device. Arch. Acoust. 2017, 42, 753–760. [Google Scholar] [CrossRef]
- Kinsler, L.E.; Frey, A.R.; Coppens, A.B.; Sanders, J.V. Fundamentals of Acoustics, 4th ed.; Wiley-VCH: Weinheim, Germany, 1999. [Google Scholar]
- Jiang, Y.W.; Xu, D.P.; Jiang, Z.X.; Kim, J.H.; Hwang, S.M. Analysis and Design of Helmholtz Protector to Improve High-Frequency Response of Insert Earphone. Appl. Sci. 2019, 9, 2541. [Google Scholar] [CrossRef] [Green Version]
© 2020 by the authors. Licensee MDPI, Basel, Switzerland. This article is an open access article distributed under the terms and conditions of the Creative Commons Attribution (CC BY) license (http://creativecommons.org/licenses/by/4.0/).

 ,
, 


