Article

Segmented Composite Optical Parametric Amplification

by
Mouhamad Al-Mahmoud
1,
Andon A. Rangelov
1,
Virginie Coda
2 and
Germano Montemezzani
2,*
1
Department of Physics, Sofia University, James Bourchier 5 blvd., 1164 Sofia, Bulgaria
2
CentraleSupélec, Université de Lorraine, LMOPS, F-57000 Metz, France
*
Author to whom correspondence should be addressed.
Appl. Sci. 2020, 10(4), 1220; https://doi.org/10.3390/app10041220
Submission received: 7 January 2020 / Revised: 26 January 2020 / Accepted: 6 February 2020 / Published: 11 February 2020
(This article belongs to the Section Optics and Lasers)

Abstract

:
We propose a novel optical parametric amplification scheme that combines quasi-phase-matching with a composite pulse approach that involves crystal segments of specific lengths. The presented scheme highly increases the robustness of the frequency conversion against variations of the nonlinear coupling and of the pump, idler, or signal wavelengths, and has therefore the potential to enhance high amplification and broadband operation. Simulation examples applied to LiNbO 3 are given.

1. Introduction

Some optical applications require short optical pulses with large peak power, which may be obtained with the help of optical parametric amplifiers (OPAs) [1,2,3,4] that are among the most useful nonlinear optical devices. Optical parametric amplification consists of the nonlinear interaction of three waves. In this process, the two waves at the longer wavelengths—the input signal wave as well as the idler wave—gain power at the expense of the pump wave being at the shortest wavelength. In OPA, the main obstacle encountered when short pulses are used is to combine a high signal amplification and a sufficiently broad amplification bandwidth. The latter is limited because material dispersion imposes that, for a given wave interaction configuration, the exact phase-matching condition can be strictly satisfied only for a single set of wavelengths of the three waves. Presently, the most common way to achieve the combination of broadband and high amplification is to use chirped quasi-phase-matching [5,6,7,8,9,10]. Even though chirped quasi-phase-matching approaches have the advantage of being broadband, they require high pump input intensity and/or very long nonlinear crystals. Very high pump intensities have the drawback of a possible damage of the nonlinear crystal when they approach its damage threshold.
In this paper, we explore an alternative method to achieve broadband amplification bandwidth together with high amplification. The technique involves a combination of quasi-phase-matching (QPM) gratings together with a segmentation of the crystal that implements the equivalent to the composite pulses approach used in Nuclear Magnetic Resonance (NMR) to prepare given quantum states in a robust way [11,12,13] (see Appendix A). The present approach leads to a highly increased robustness of the nonlinear amplification process with respect to both the phase mismatch (associated to a change of wavelength or of temperature) and the coupling strength. Note that the approach presented here does not involve the stretching and chirping of the pulses before the parametric amplification and a final recompression, as used in Optical Parametric Chirped Pulse Amplification (OPCPA) [14,15,16,17]. Such steps are generally necessary for the shortest (few cycles) pulses and the highest pulse energies to avoid excessive third order nonlinear effects and/or a damage of the samples.
The paper is organized as following. Section 2 gives the general theory, and Section 3 describes the numerical approach and the simulation results obtained with the best crystal segmentation. Some practical examples are given for the important case of MgO-doped quasi phase-matched LiNbO 3 . Finally, Section 4 summarizes.

2. Theory

We start with the simmetrized coupled wave equations for collinear three-wave mixing in the slowly varying envelope approximation [18,19],
i z A 1 = Ω ˜ A 2 * A 3 exp i Δ k z ,
i z A 2 = Ω ˜ A 1 * A 3 exp i Δ k z ,
i z A 3 = Ω ˜ A 1 A 2 exp i Δ k z ,
where Ω ˜ = ( 2 χ ( 2 ) / π c ) ω 1 ω 2 ω 3 / n 1 n 2 n 3 is the effective nonlinear coupling coefficient for first-order QPM, z is the position along the propagation axis, ω j are the frequencies of the three involved waves, and n j are their refractive indices. Here j = 1 , 2 , 3 refer to the signal, idler and pump waves, respectively. The quantity χ 2 in Ω ˜ is the effective second-order susceptibility and c is the speed of light in vacuum. The amplitudes A j n j / ω j E j in (1) are proportional to the amplitudes E j of the wave electric fields; | A j | 2 is proportional to the number of photons associated to the jth wave. Note that Equation (1) is written in a form that assumes that quasi-phase-matching is implemented and that the quasi-phase matching period is sufficiently short as compared to the interaction length. Therefore, the phase mismatch parameter Δ k already contains the mismatch compensation term associated to the periodic grating, that is,
Δ k = k 1 + k 2 k 3 + 2 π / Λ Δ k ˜ + 2 π / Λ .
where Λ is the quasi-phase-matching period, that is, the first-order local poling period in the case of periodically poled crystals. Obviously, for the central operation wavelengths at which the device is designed, one has Δ k = 0 . Concurrently, the true phase mismatch Δ k ˜ = k 1 + k 2 k 3 , which depends only on the wave-vectors k j of the three interacting waves, is generally quite far from vanishing. The set of Equation (1) could have been written also by using the quantities Δ k ˜ instead of Δ k , however in this case Ω ˜ would need to switch its sign after each distance Λ / 2 and the term 2 / π would need to be dropped in the nonlinear coupling coefficient.
Depending upon the initial conditions A j z = 0 , different processes can arise: sum frequency generation (SFG), difference frequency generation (DFG) or OPA. Here, we consider the OPA case, we assume that ω 3 = ω 1 + ω 2 and we treat first Equation (1) in the limit of validity of the undepleted pump approximation ( A 3 = const). In this limit the set of Equation (1) turns into
i z A 1 = Ω A 2 * exp i Δ k z ,
i z A 2 = Ω A 1 * exp i Δ k z ,
with Ω = Ω ˜ A 3 being a modified coupling coefficient. When the wave vector mismatch Δ k and the coupling coefficient Ω are constant, then Equation (3) possess exact analytic solutions [20],
A 1 z = e i Δ k z / 2 A 1 0 cosh g z i Δ k 2 g sinh g z + i Ω g A 2 * 0 sinh g z ,
A 2 z = e i Δ k z / 2 A 2 0 cosh g z i Δ k 2 g sinh g z + i Ω g A 1 * 0 sinh g z ,
where g = Ω 2 Δ k 2 2 is a gain coefficient. In the case Δ k = 0 , and for a vanishing idler wave at the input ( A 2 ( 0 ) = 0 ), from the last equations one can easily see that both signal and idler increase initially exponentially in a parallel way as
A 1 z A 2 z A 1 0 2 exp Ω z
In this work, we are interested in an optimization of the signal intensity amplification factor a, defined as the ratio of the intensity of the signal wave ( A 1 ) taken at distance z to its intensity at the entrance of the crystal
a = A 1 z 2 A 1 0 2 = I 1 z I 1 0 .
The above argumentation, in connection with Equation (5), indicates that, when the phase-matching condition is satisfied ( Δ k = 0 ), the OPA process is the most efficient. However, this is not entirely true, because the solutions (5) are derived only in the limit of the undepleted pump approximation. If one considers the depleted pump regime, the nonlinear Equation (1) has solutions in terms of Jacobi elliptic functions [21,22]. These, like trigonometric functions, are periodic functions, and thus the energy transfer oscillates back and forth between pump field and signal field. The chirped quasi-phase-matching techniques [5,6,7,8,9], in addition to the improvement of the bandwidth, eliminate the problem of back conversion and can be used even in the case of the depleted pump regime.
Here, in analogy with the technique of composite pulses from quantum physics [11,12,13,23,24,25,26,27,28], we propose to use segmented composite crystals for OPA. We note that the composite pulse analogy was already used in nonlinear optics, but for the sum frequency generation or second harmonic generation (SHG) [29,30,31]. In these cases, in the undepleted pump approximation the differential equations governing the spatial dynamics have a SU(2) symmetry [32,33], which is exactly the same symmetry possessed by quantum systems with two states [27,28]. Therefore, the mapping between two-state quantum systems and SFG in the undepleted pump regime is complete and one can use the known analytic solutions from quantum physics to find robust solutions in nonlinear optics [29,30,31]. In the case of OPA, there is no SU(2) symmetry and it is thus not possible to exploit known composite pulses analytic solutions. Instead, we are going to derive numerically solutions that achieve broadband amplification bandwidth together with high amplification in the depleted pump regime.

3. General Numerical Approach and LiNbO 3 Crystal Simulations

The procedure that we track is the following. The period of the flip sign of the nonlinear susceptibility χ 2 is such that the phase mismatch for the OPA process will be zero in Equation (2) due to QPM, resulting in a local modulation period Λ (Figure 1a). However, in contrast to the periodic design, we induce additional sign flips of the coupling coefficient at specific boundaries. In practice, at each segment boundary, there are two domains with the same orientation that merge in a single double-as-long domain, as shown in Figure 1b. The periodic sign switch of χ 2 ensures the phase matching for OPA ( Δ k = 0 ) and the additional sign switches of χ 2 at the segment boundaries will change the sign of Ω ˜ in the whole crystal segment in a similar fashion as in Shaka–Pines pulses from NMR [12,13] discussed in the Appendix A. We denote the intervals between two double length domains as l 1 , l 2 , l 3 l N , as shown in Figure 1b. The determination of the optimum segment lengths l k is done using Monte Carlo simulations in the depleted pump regime. In practice, it consists in a maximization of the integral Q of the (normalized) amplification a over a surface of interest in the ( Δ k , Ω ˜ ) -space, where the values of Δ k and Ω ˜ are in units of the reciprocal crystal length 1 / L . The Figure-of-Merit integral Q is bounded by 1 and is given as
Q 1 r 1 2 Ω ˜ m a x Δ k m a x Δ k m a x Δ k m a x 0 Ω ˜ m a x a Ω ˜ , Δ k   d ( Δ k )   d Ω ˜ ,
where r is the initial pump-to-signal photon-intensity ratio, r I 3 ( 0 ) / I 1 ( 0 ) . In our case, we have chosen Δ k m a x = 15 / L and Ω ˜ m a x = 30 / L , the optimization of the integral Q is done over 10 5 random sets of the segment lengths l 1 , l 2 , l 3 l N . Those corresponding to the best solutions are listed in Table 1. We have found that the use of a small number of composite segments (two, three, and partly four) do not lead to any strong improvement with respect to the standard QPM case. In contrast, already, for a moderate number of segments between six and eight, we find a significant improvement of the robustness of the amplification process. In this case, our analysis shows that there are different solutions for the optimum segment configurations (given in Table 1), which works better depending on the initial amplitude of the signal wave A 1 ( 0 ) (as compared to the pump wave amplitude taken as A 3 ( 0 ) = 1 ).
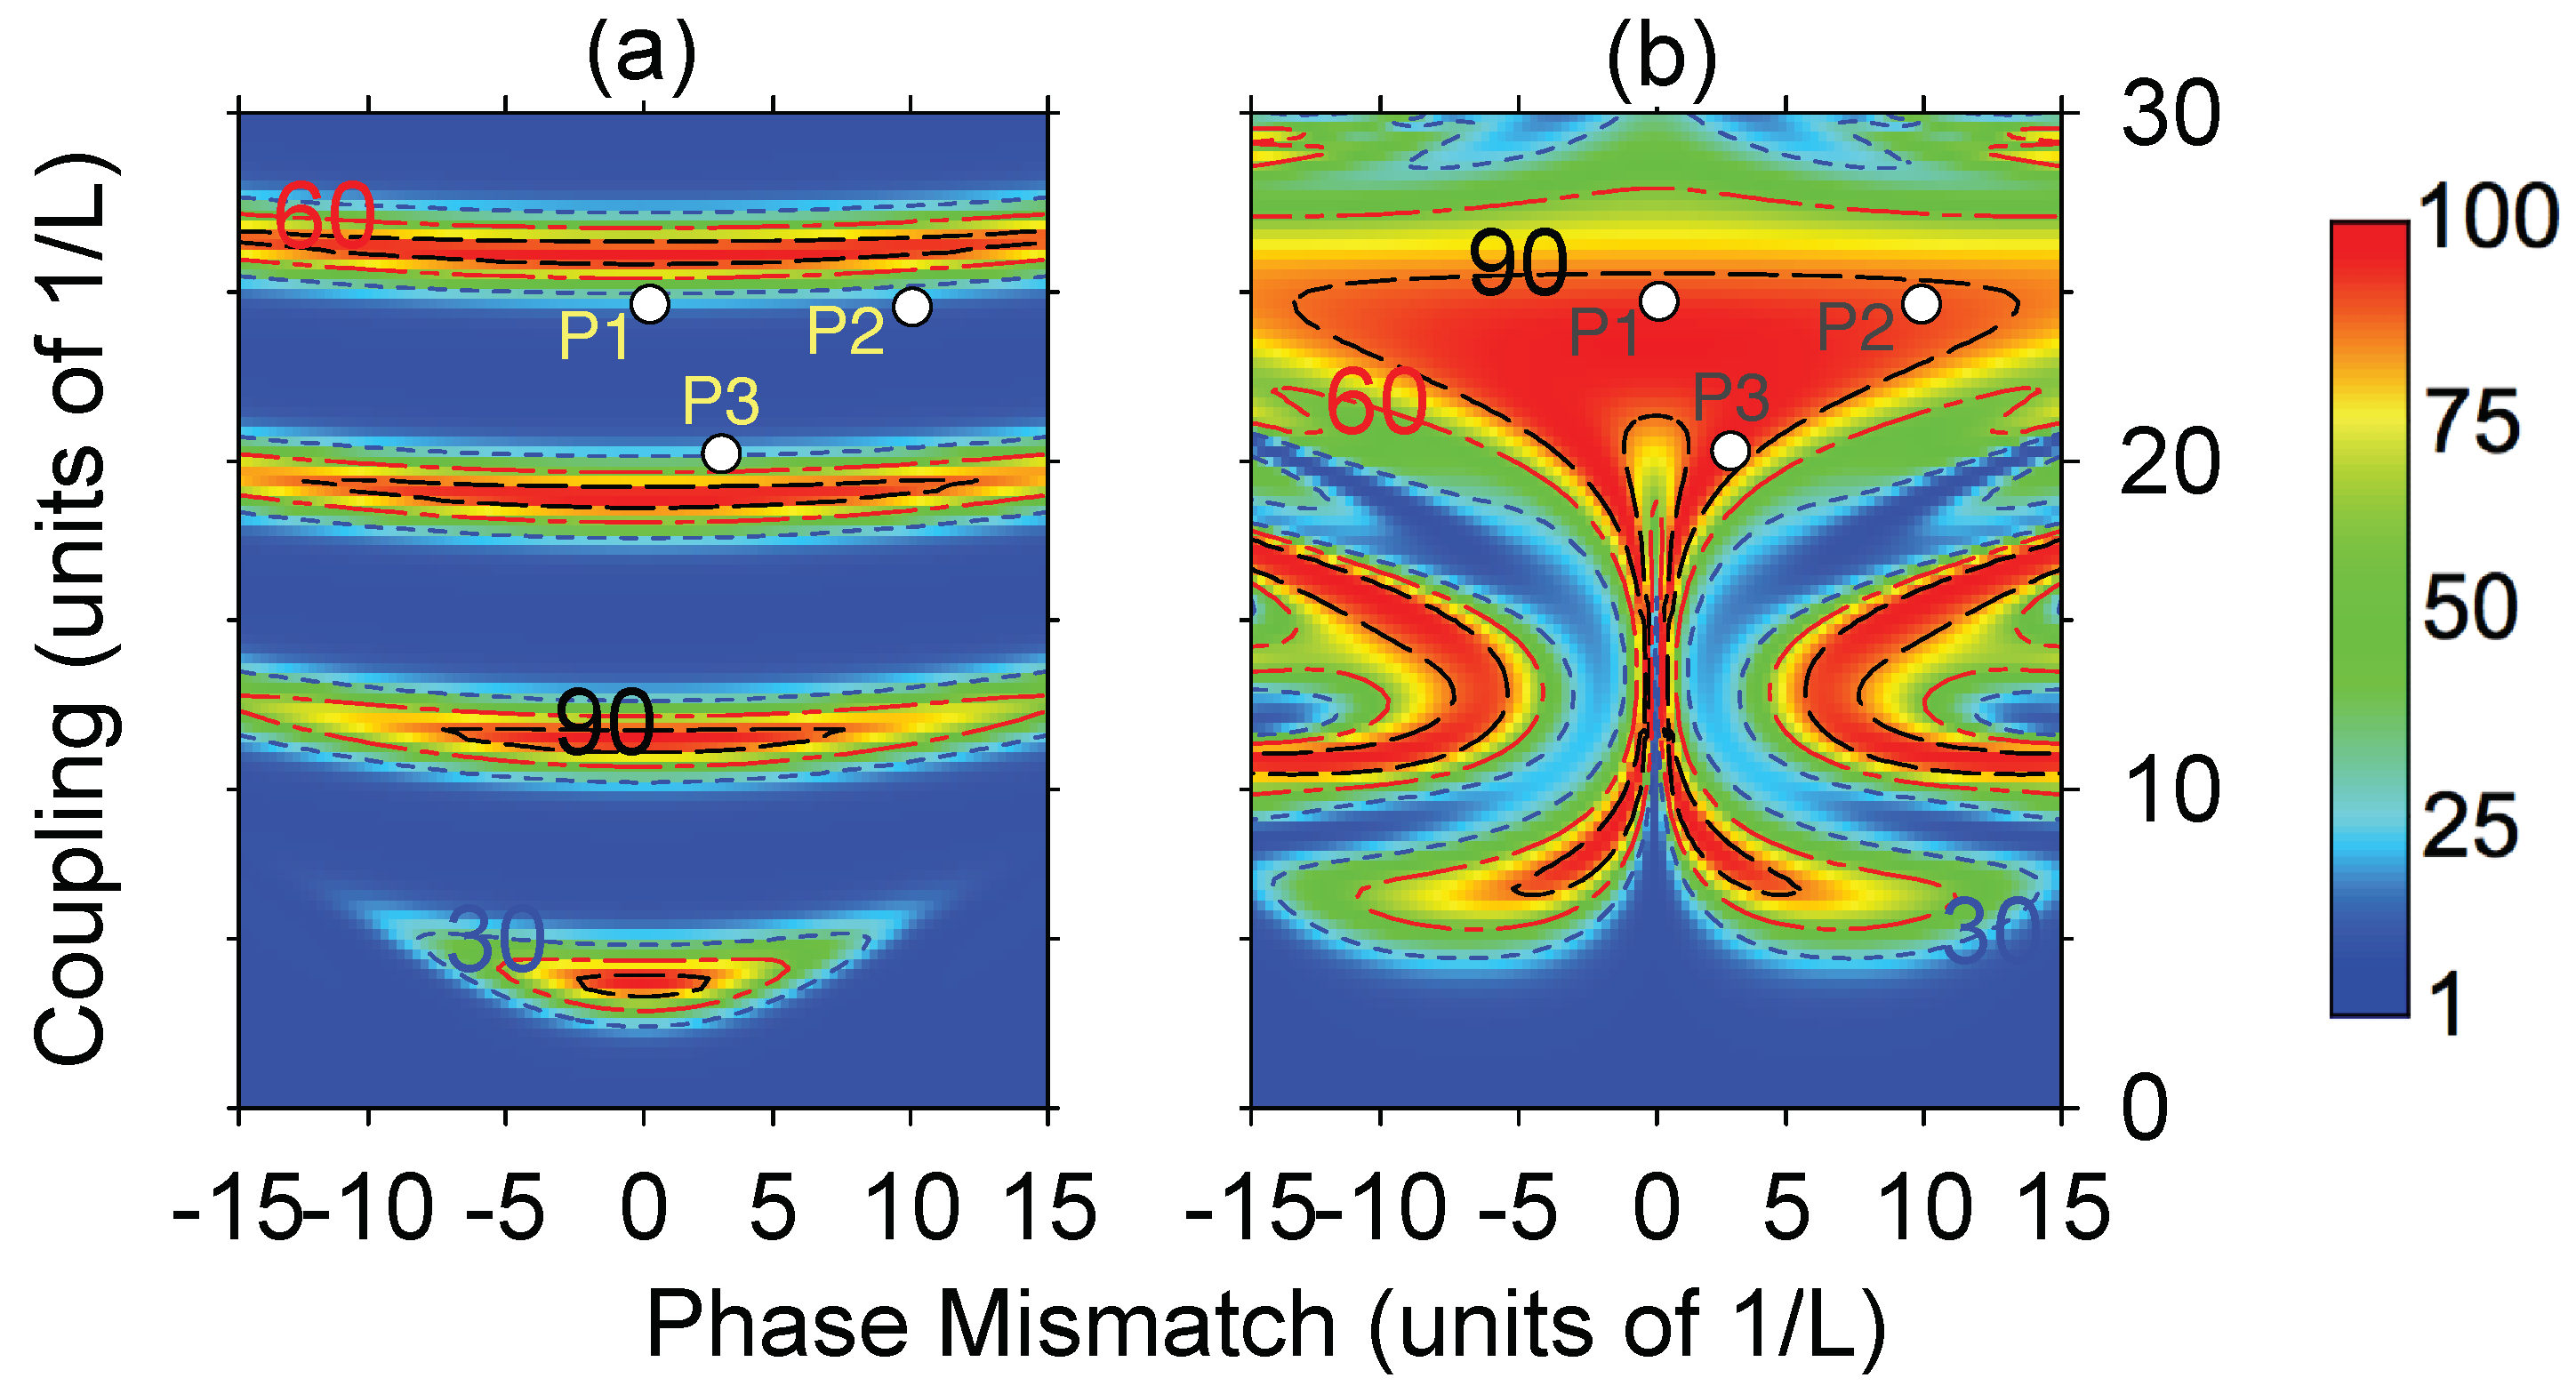
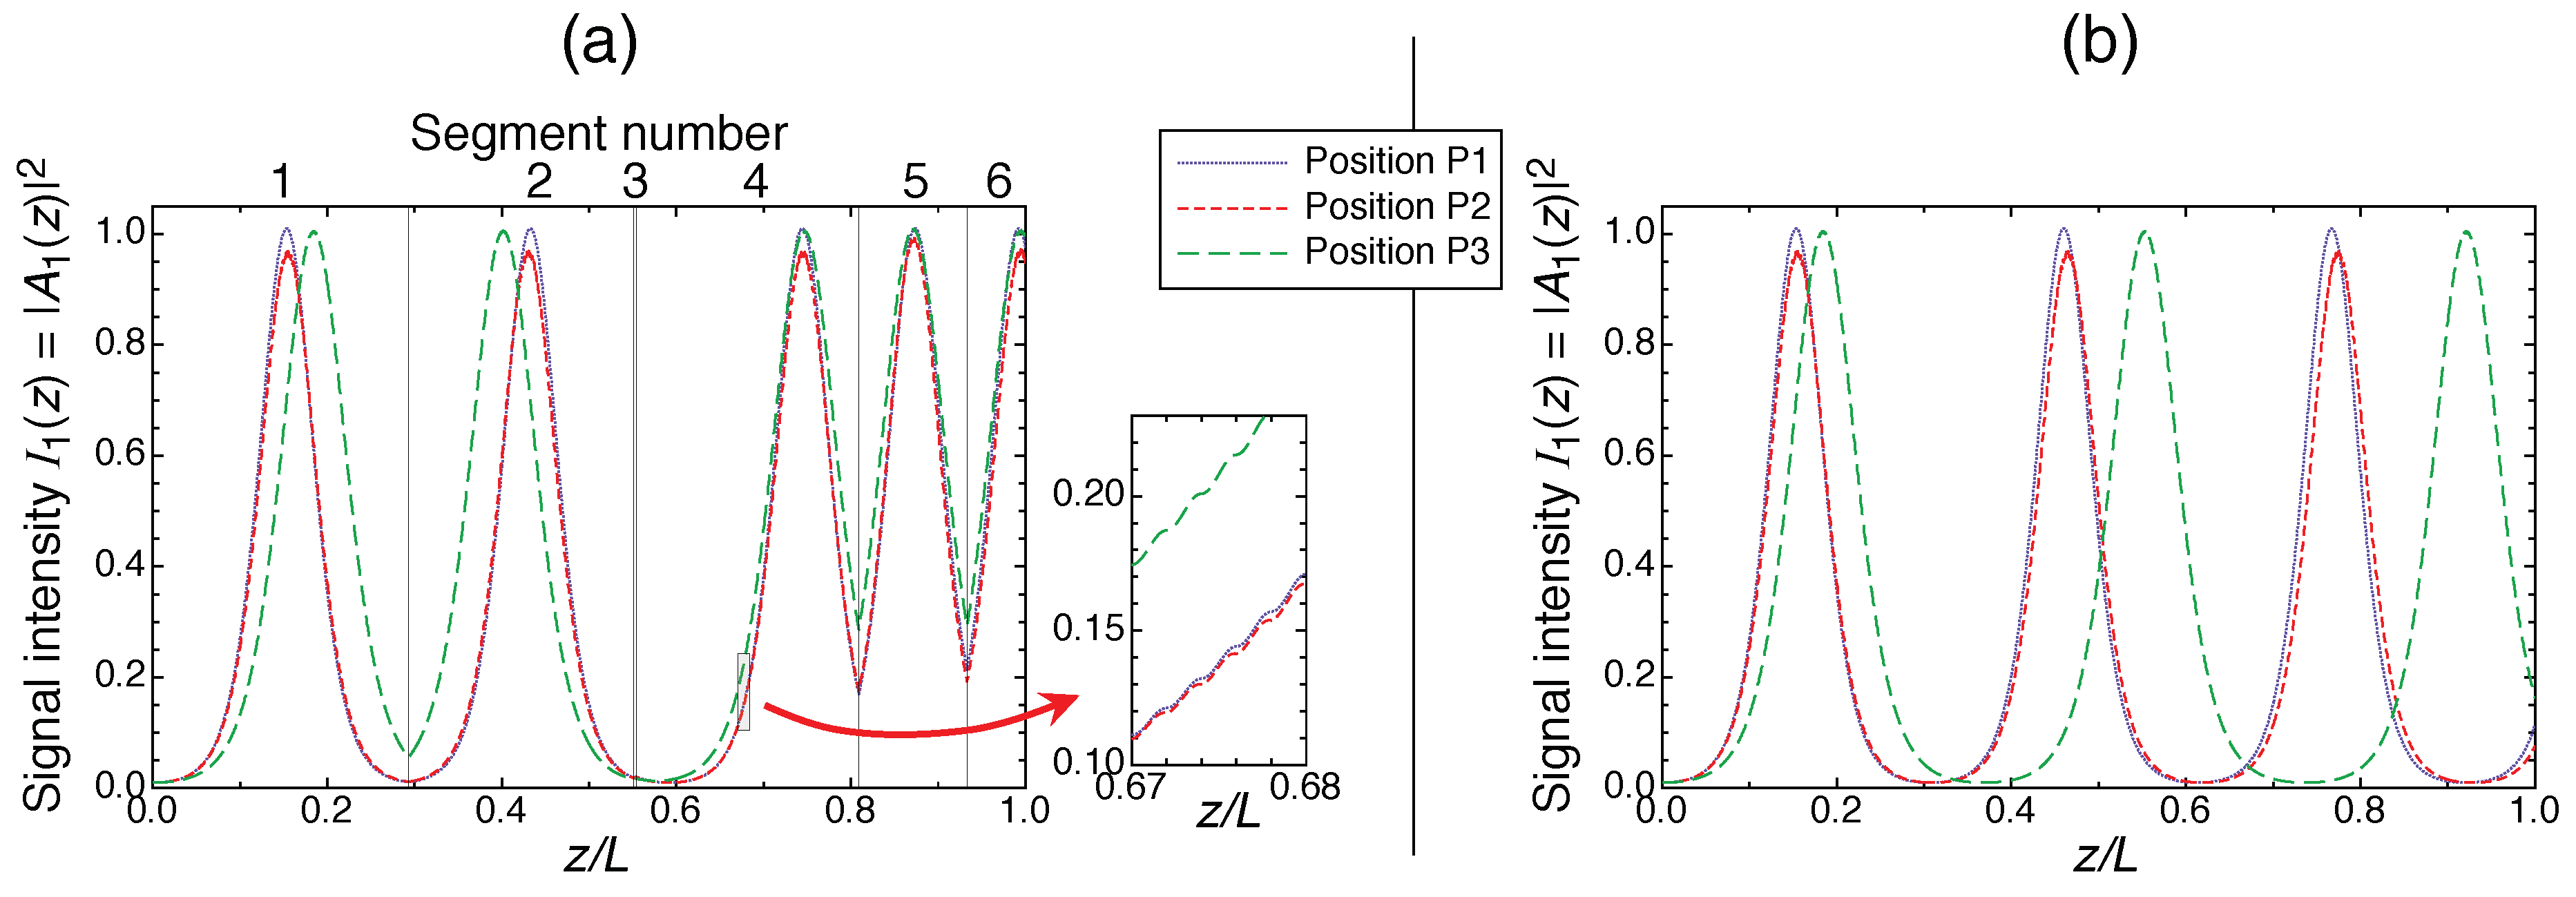
Figure 2 illustrates the performance of the composite crystals with six segments (6a from Table 1) compared to standard periodic design. The amplification values are calculated numerically from Equation (1) in the cases when A 1 0 = 0.1 , A 2 0 = 0 , and A 3 0 = 1 , and thus a pump-to-signal photon-intensity ratio r = 100 . Figure 2 shows clearly that the region of high signal intensity amplification expands strongly for the segmented composite crystal compared to standard periodic design. In other words, the composite crystals exhibit much broader acceptance bandwidths compared to a standard quasi-phase-matching. The working principle of the composite concept can be recognized directly with the help of Figure 3, which depicts the evolutions of the signal wave intensity for the conditions associated to the three positions P1, P2, and P3 given in Figure 2. Clearly, each segment boundary gives rise to a “kick” for such evolutions. By choosing the z-positions of the frontiers appropriately, one can achieve that the spatial evolutions corresponding to points in the big red area in Figure 2a get very close (nearly “in phase”) near the end of the device at distance L with a high final signal wave amplification, as seen in Figure 3a. In contrast, for pure QPM without composite segments such a “re-phasing” cannot occur, as can be recognized in Figure 3b.
The simulations of Figure 2 and Figure 3 illustrate the general approach for finding the best composite sequence as compared to standard QPM. Next, we will prove the concept further by applying these results to specific practical examples and we make the numerics for a real crystal: 5 mol. % Magnesium Oxide doped Lithium Niobate (MgO:LiNbO 3 ). This ferroelectric nonlinear crystal possesses higher damage threshold compared to undoped LiNbO 3 , high nonlinear optical coefficient, broad transparency range, and is suitable for domain poling [34]. We compare the standard quasi phase matching with the composite approach for OPA when the three interacting beams share the same extraordinary polarisation (Type 0 configuration, all beams polarized parallel to crystal c-axis) associated to the largest element of the nonlinear tensor d 333 = χ ( 2 ) = 27 pm/V.
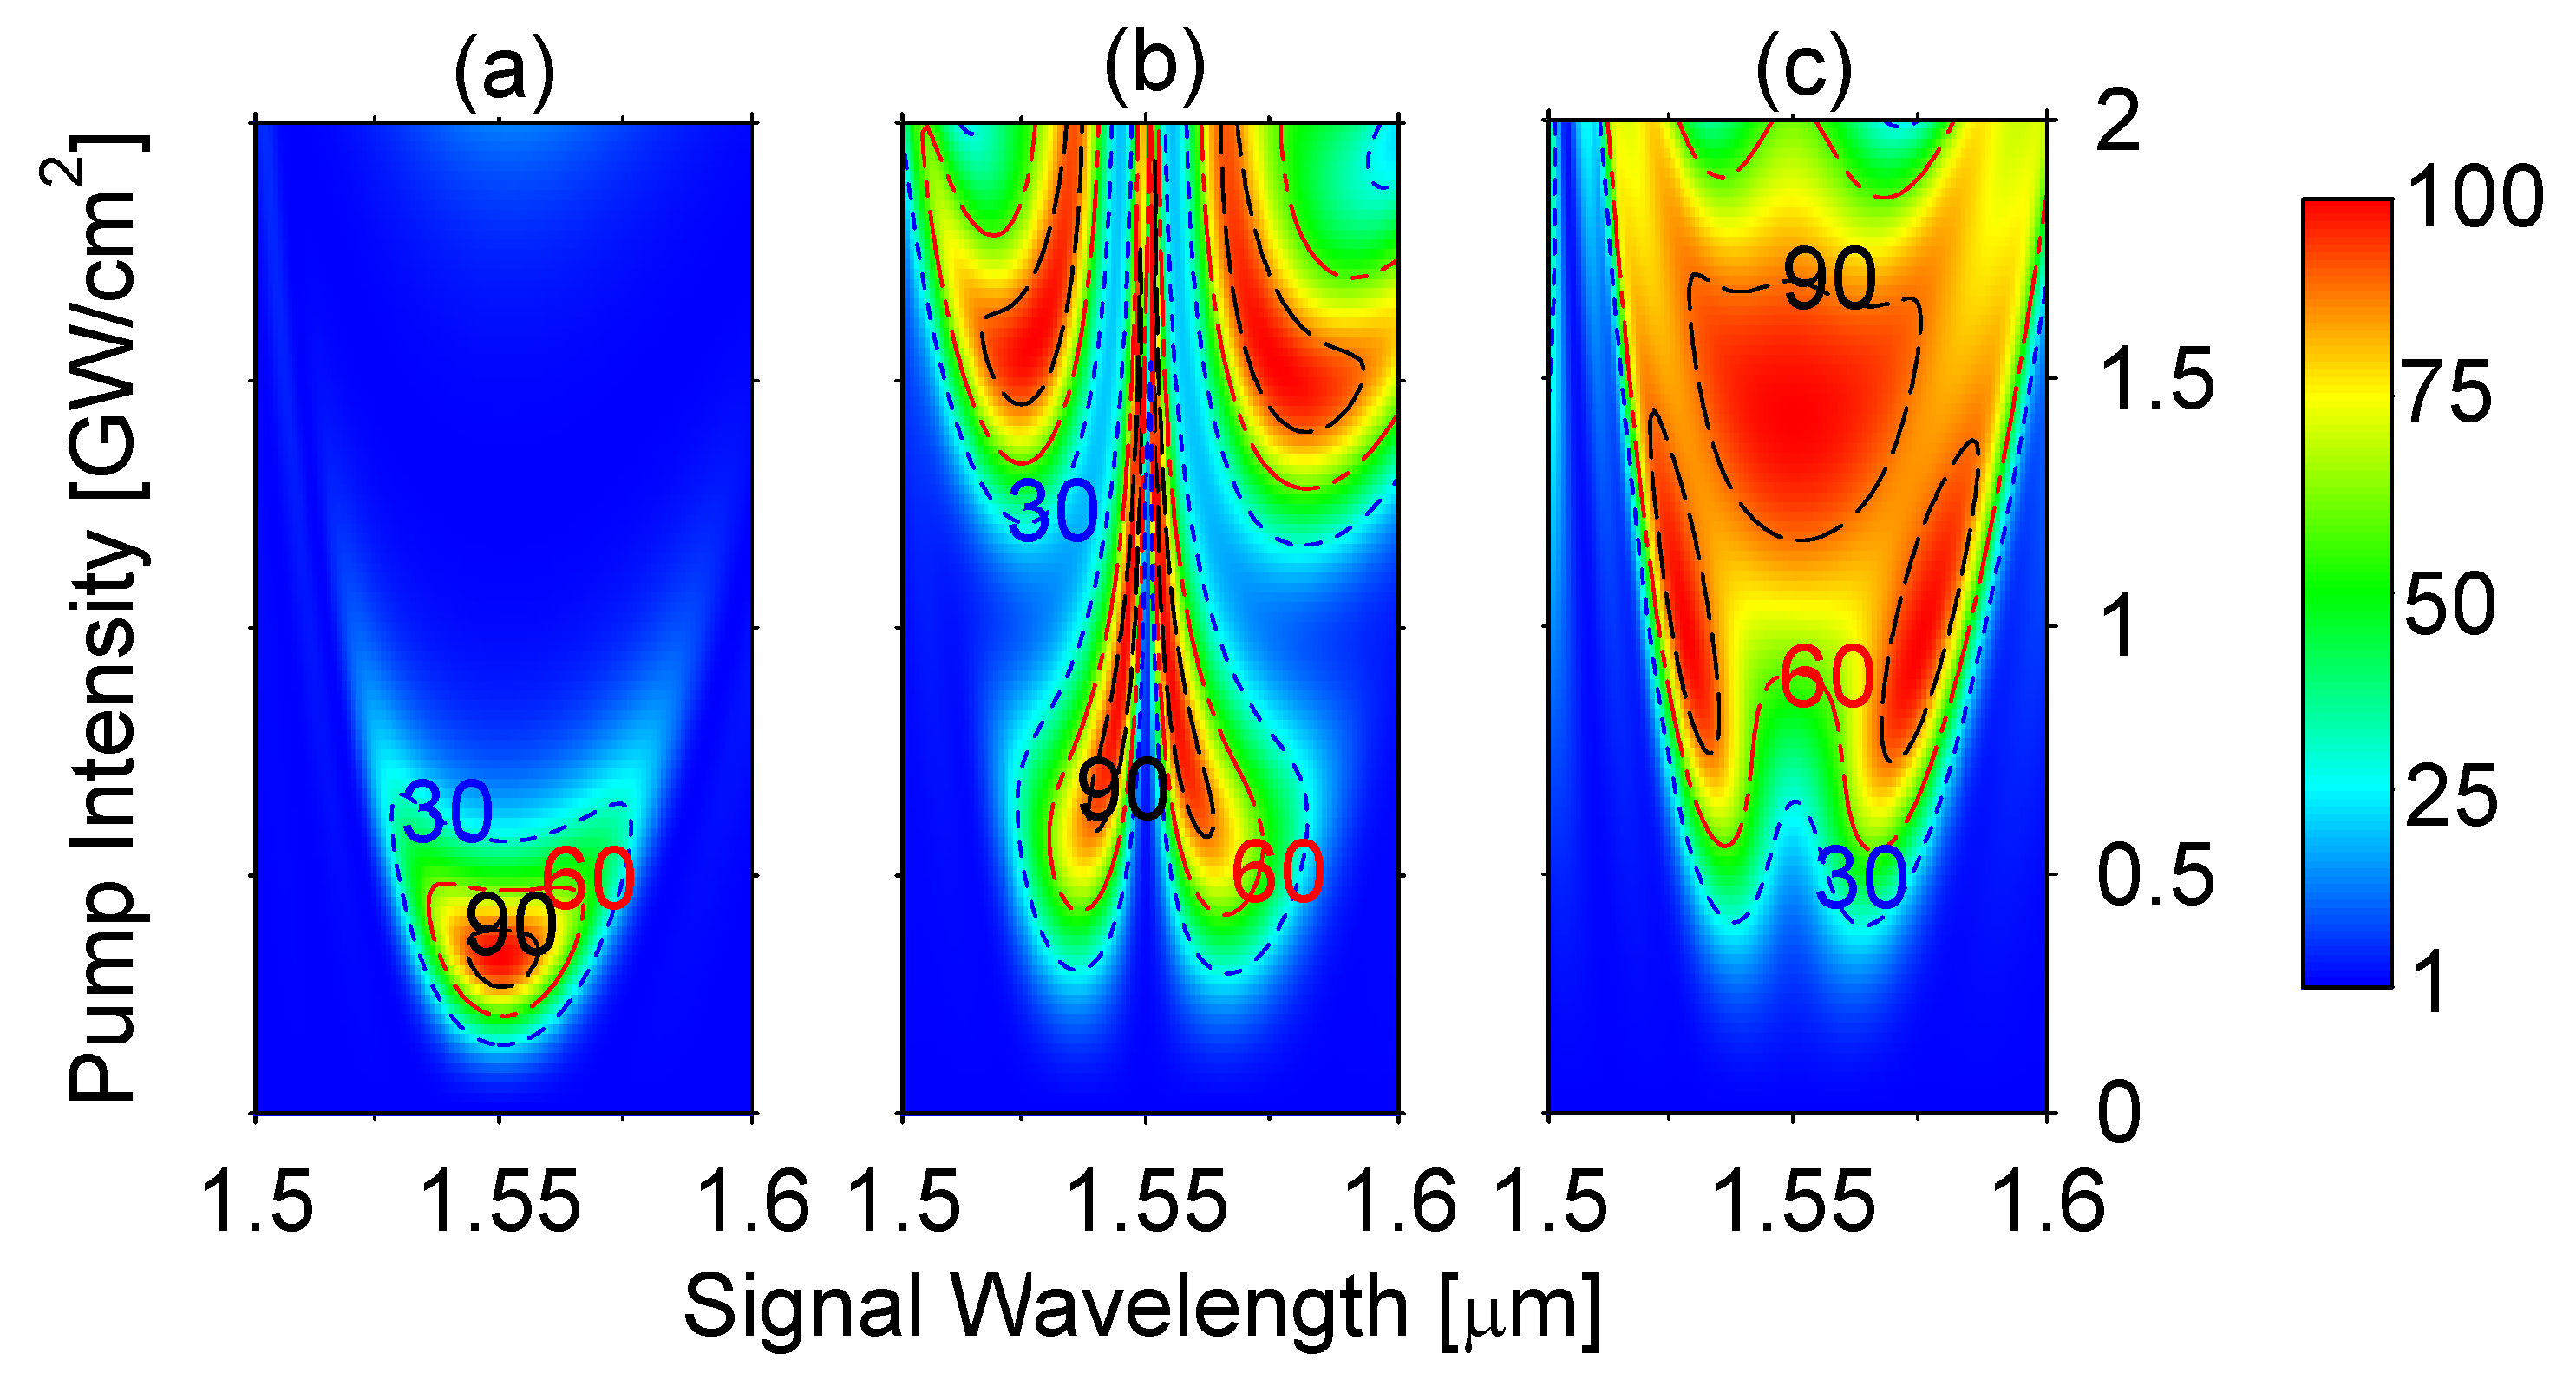
The color plots in Figure 4 and Figure 5 compare the signal intensity amplification a for MgO:LiNbO 3 for standard QPM ( Λ = 29.71 μ m) and for a composite crystal made of six segments. Figure 4 is for intermediate pump-to-signal intensity ratio r while Figure 5 is for large r. Figure 4 also shows the less optimum case where there are only three composite segments. The nonlinear susceptibility is fixed and the plots are represented for varying input pump intensity (at the fixed wavelength of 1064 nm) and for varying signal wavelength (with center at λ 1 = 1550 nm). Note that here, to keep the ratio r constant for each plot, the input signal intensity changes in the same way as the input pump intensity. Note also that the pump intensity (y-axis) takes the role of the coupling in Figure 2. Similarly, as a variation of the signal wavelength with respect to the central one gives rise to a phase mismatch Δ k ; here, the signal wavelength (x-axis) takes the role of Δ k in Figure 2. The total crystal length is L = 5 mm. The amplification values are calculated numerically from Equation (1) in the cases when A 1 ( 0 ) = 0.1 , A 2 ( 0 ) = 0 , and A 3 ( 0 ) = 1 for Figure 4 and A 1 ( 0 ) = 0.01 , A 2 ( 0 ) = 0 , and A 3 ( 0 ) = 1 for Figure 5. Clearly, a greatly enhanced robustness and frequency bandwidth of the six-segment composite OPA compared to the standard QPM OPA can be recognized. The plots in Figure 5c compare directly the signal intensity amplification spectrum for the optimal range for composite crystal (red line) and optimal range for standard periodic design (blue dash line). These are slices at the pump intensity values of 3.75 GW/cm 2 and 0.8 GW/cm 2 in Figure 5a,b, respectively.
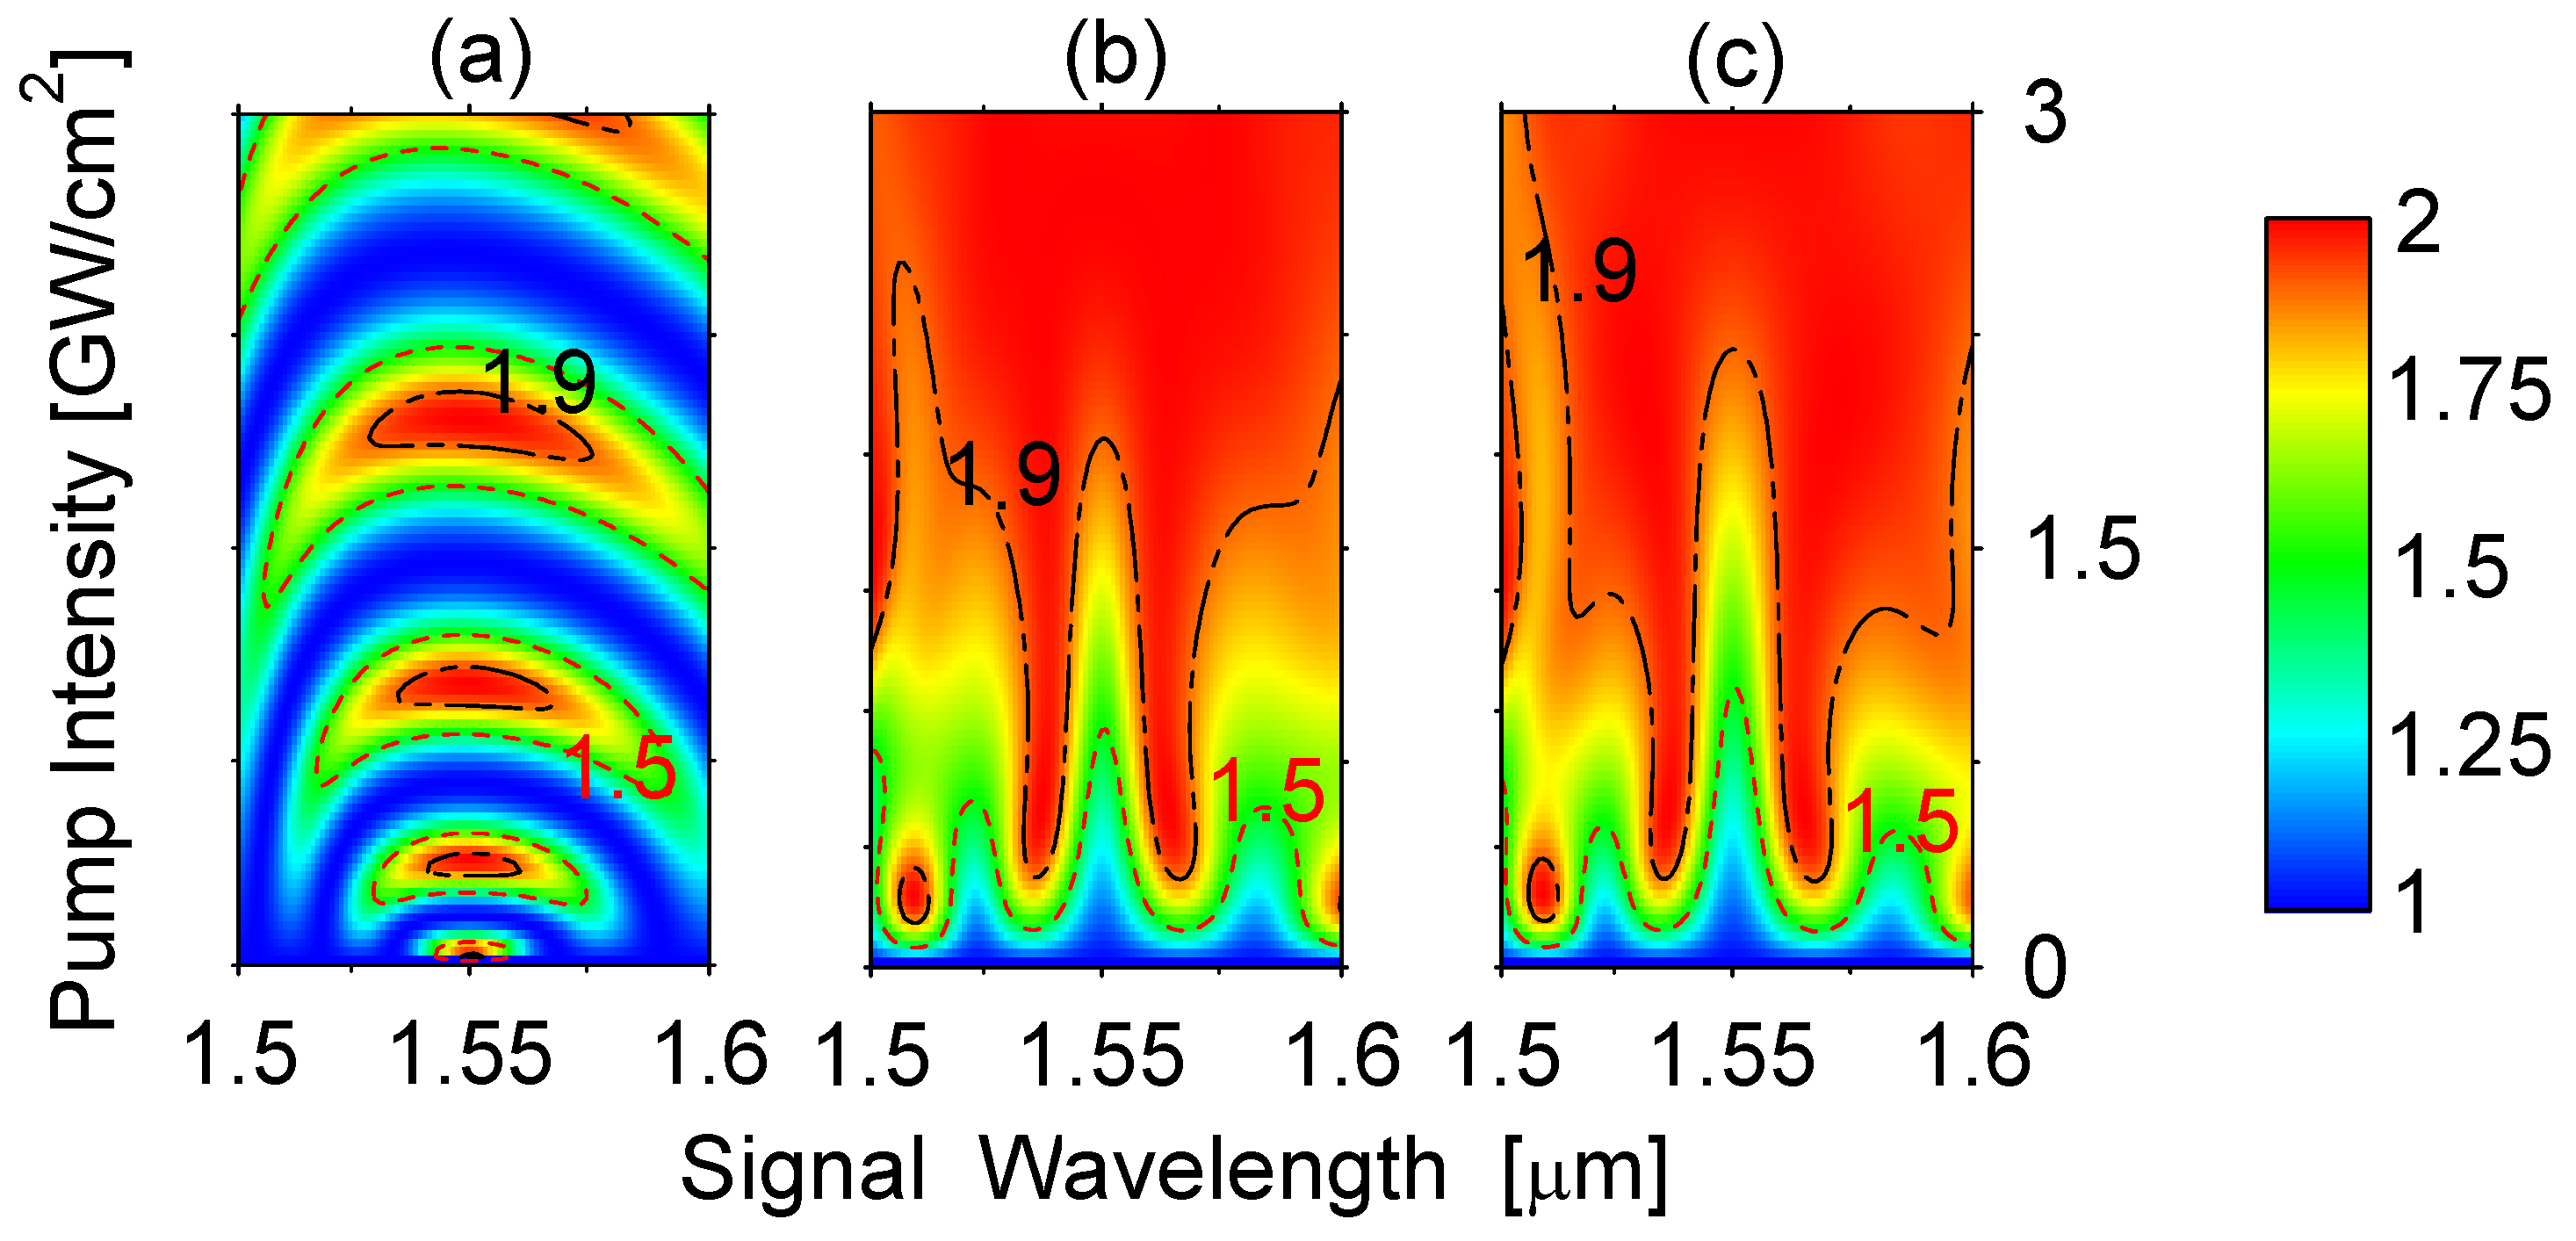
Finally, Figure 6 gives the color plots for the signal intensity amplification a as in Figure 4 and Figure 5, but for the case where the initial signal intensity is as strong as the pump ( r = 1 , A 1 ( 0 ) = 1 , A 2 ( 0 ) = 0 and A 3 ( 0 ) = 1 ). This is a highly depleted regime, and the real advantages of the segmented composite approach over the standard QPM in the depleted pump regime can be recognized by the very large red area in the two right panels. In general, a laser beam spot has an intensity distribution with strong intensity in the center of the spot and smaller intensity at the wings (Gaussian beam for example). Therefore, averaging the amplification value for the big red island of the central panel (b) in Figure 6 will lead to a significantly higher average amplification than averaging the amplification values for the oscillation islands seen for standard QPM in Figure 6a. In Figure 6, we also show that the composite approach is very tolerant with respect to errors in the segment lengths, which is typical also of composite pulse techniques in quantum physics. The color plot in Figure 6c is obtained with the sequence 8 of Table 1) like Figure 6b after adding a large random error on each segment length within ± 5 % of the segment length itself. After this procedure each segment length was renormalized by a common factor in order to maintain the same total length of 5 mm like for Figure 6b. It can be seen that the large robust red area is maintained nearly unchanged despite for the rather large allowed errors. More realistic random errors of the order of 1–2% give landscapes almost indistinguishable from the one in Figure 6b.
We can conclude from Figure 4, Figure 5 and Figure 6 that the present composite OPA approach works very well in the depleted pump case, because, in all these cases, one has a significant pump depletion, and thus a signal amplification approaching the maximum theoretically possible.

4. Summary and Conclusions

In summary, we used the similarity between the three wave mixing equations and the time-dependent Schrödinger equation to transfer concepts from quantum physics to nonlinear optics. Specifically, we have suggested to use segmented composite crystals for optical parametric amplification in analogy with the composite pulses in NMR and quantum optics. The approach used here is based on sign-alternating dual-compensating composite pulse sequences similar to those of Shaka and Pines [12,13]. These are particularly suited for optical parametric amplification because besides the standard quasi-phase-matching they require only additional sign flips of the nonlinear optical susceptibility at specific locations corresponding to the segment frontiers. We have demonstrated numerically that this technique is especially powerful for broadband OPA. The present approach does not require very long crystals and, for the given example of MgO:LiNbO 3 , is compatible with pump intensities significantly below the damage threshold for ps or sub-ps illumination [35,36]. Note that the derivation of the optimum segment lengths was done in the general dimensionless case and is therefore independent of the material being selected for the implementation. Therefore, the technique presented here can be applied in principle to any nonlinear material permitting phase matching at the central wavelengths of the envisaged frequency conversion process. In combination with QPM, the technique can thus be applied to any material that can be structured by periodic poling (such as LiNbO 3 , LiTaO 3 , or KTiOPO4) or by orientation patterning during the growth process such as GaAs. However, QPM is not always necessary and the phase matching at the central wavelengths may be realized also by birefringence phase matching in the cases where this is possible. In such cases, it is sufficient to stack a small number of nonlinear crystals of the appropriate thicknesses with mutually reversed axes orientations, as discussed earlier in connection to SFG [30]. In contrast to periodically poling or orientation patterning that generally lead to a limited input aperture, the crystal stacking approach may therefore permit also to realize devices being addressable by very large area pump beams.

Author Contributions

Conceptualization, A.A.R.; methodology and simulations, M.A.-M., A.A.R., and G.M.; validation, V.C.; manuscript preparation, M.A.-M., A.A.R., and G.M.; reviewing and editing, all authors; coordination: G.M., V.C. All authors have read and agree to the published version of the manuscript.

Funding

This research was funded by the EU Horizon-2020 ITN project LIMQUET (contract number 765075) and by the Bulgarian Science Fund Grant No. DN 18/14.

Conflicts of Interest

The authors declare no conflicts of interest.

Abbreviations

The following abbreviations are used in this manuscript:
OPAOptical Parametric Amplifier
QPMQuasi-phase-matching
NMRNuclear Magnetic Resonance
SFGSum Frequency Generation
DFGDifference Frequency Generation
SHGSecond Harmonic Generation

Appendix A. Mapping between Two State Quantum System and SFG in Case of Undepleted Pump Approximation

In this appendix, we show the relationship between three-wave mixing frequency conversion process and the quantum dynamics of a driven two-state quantum system. As mentioned above, the analogy is exact only for the case of SFG and in the undepleted pump approximation, where the three wave interaction can be reduced to an effective interaction of only two waves, which is the reason for illustrating this case here. Nevertheless, the related quantum-inspired approaches can be extended to the depleted regime and to other nonlinear interactions, as shown in the main text.
The three nonlinear coupled Equations (1) can be simplified in the case of sum-frequency generation ( ω 1 + ω 2 = ω 3 ) if the incoming pump wave at frequency ω 1 is much stronger than the signal wave at frequency ω 2 so that its amplitude remains constant during evolution ( A 1 = const). This leads to the simplified equations system,
i z C ( z ) = H C ( z ) ,
where C ( z ) = C 2 ( z ) , C 3 ( z ) T , C 2 ( z ) = A 2 ( z ) e i Δ k z / 2 , C 3 ( z ) = A 3 ( z ) e i Δ k z / 2 e i ϕ , and ϕ is the complex phase of the pump wave amplitude, i.e., A 1 = | A 1 | e i ϕ . The above space-dependent matrix H ( z ) is given by
H ( z ) = 1 2 Δ k Ω Ω Δ k ,
where here Ω = 2 Ω ˜ | A 1 | .
As a further step, one can map the the z-dependence onto a time dependence, z = c t . By doing so, Equation (A1) becomes the conventional time-dependent Schrödinger equation for a two-state atom driven by an oscillatory field in the rotating-wave approximation [37,38,39,40]. The two amplitudes C 2 and C 3 correspond to the probability amplitudes of the ground state and the excited state. The off-diagonal element Ω in Equation (A2) is well known as the Rabi frequency, whereas the component Δ k correlates with the detuning [37,38].
The solution of Equation (A1) is particularly straightforward when Δ k = 0 , i.e., when exact phase matching occurs, which corresponds to the resonance case for a two-state atom. With the following initial conditions (at z = z i )
C 2 z i = 1 ,   C 3 z i = 0 ,
which mean that the field at the sum frequency ω 3 is not present at the input, the solution is
C 2 z = cos 1 2 S ,
C 3 z = i sin 1 2 S ,
where S = z i z Ω ( z ) d z . Therefore, if S = 0 or an even-integer multiple of 2 π , no energy transfer from the signal to the wave at the sum frequency ω 3 (called idler here) occurs. In contrast, full energy transfer signal → idler takes place when S = π or an odd-integer multiple of π . As a result, the conversion efficiency in the case of exact phase matching is easily affected by variations in the crystal length, temperature, wavelength, and pump intensity.
Two robust alternatives to the phase-matched case may be given if one use the techniques of adiabatic evolution or composite pulses from nuclear magnetic resonance. Adiabatic evolution in a dynamical system occurs when an external perturbation of the system varies very slowly compared to its internal dynamics, allowing the system the time to adapt to the external changes. Mathematically, it means that for the entire dynamical evolution, the system remains at one of the system’s eigenmodes. This analogy was developed by Suchowski et al. [32,33,41,42], who, in a set of experiments, demonstrate a robust broad bandwidth conversion with high efficiency for sum frequency generation from the near-IR into the visible spectrum.
Composite pulses are solutions to arbitrary optimization problems in a quantum system, driven by an external radiation field. The basic idea is to improve the performance of single-pulse excitation processes by applying multi-pulse (i.e., “composite pulse”) processes. In quantum physics, nearly all composite pulses use the relative phases between the constituent pulses to yield a better performance of the composite excitation process compared to the single-pulse excitation [43,44]. In nonlinear optics, the only possibility is to flip the sign of the coupling Ω , which is done by changing the sign of χ ( 2 ) , this limitation gives advantage only to the composite pulses of Shaka and Pines [12,13], which use exclusively sign flips from pulse to pulse (i.e., phases 0 and π ) and the control parameters are the pulse durations. These composite sequences, was adapted to composite nonlinear crystals recently [30,31].

References

  1. Joosen, W.; Agostini, P.; Petite, G.; Chambaret, J.P.; Antonetti, A. Broadband femtosecond infrared parametric amplification in β-BaB2O4. Opt. Lett. 1992, 17, 133–135. [Google Scholar] [CrossRef] [PubMed]
  2. Gale, G.M.; Cavallari, M.; Driscoll, T.J.; Hache, F. Sub-20-fs tunable pulses in the visible from an 82-MHz optical parametric oscillator. Opt. Lett. 1995, 20, 1562–1564. [Google Scholar] [CrossRef] [PubMed]
  3. Gale, G.M.; Hache, F.; Cavallari, M. Broad-bandwidth parametric amplification in the visible: Femtosecond experiments and simulations. IEEE J. Sel. Top. Quantum Electron. 1998, 4, 224–229. [Google Scholar] [CrossRef]
  4. Schmidt, B.E.; Thiré, N.; Boivin, M.; Laramée, A.; Poitras, F.; Lebrun, G.; Ozaki, T.; Ibrahim, H.; Légaré, F. Frequency domain optical parametric amplification. Nat. Commun. 2014, 5, 3643. [Google Scholar] [CrossRef] [PubMed]
  5. Harris, S.E. Chirp and compress: Toward single-cycle biphotons. Phys. Rev. Lett. 2007, 98, 063602. [Google Scholar] [CrossRef] [PubMed] [Green Version]
  6. Charbonneau-Lefort, M.; Afeyan, B.; Fejer, M.M. Optical parametric amplifiers using chirped quasi-phase-matching gratings. I: Practical design formulas. J. Opt. Soc. Am. B 2008, 25, 463–480. [Google Scholar] [CrossRef] [Green Version]
  7. Charbonneau-Lefort, M.; Afeyan, B.; Fejer, M.M. Optical parametric amplifiers using nonuniform quasi-phase-matched gratings. II: Space-time evolution of light pulses. J. Opt. Soc. Am. B 2008, 25, 680–697. [Google Scholar] [CrossRef]
  8. Phillips, C.R.; Fejer, M.M. Adiabatic optical parametric oscillators: Steady-state and dynamical behavior. Opt. Express 2012, 20, 2466–2482. [Google Scholar] [CrossRef]
  9. Phillips, C.R.; Langrock, C.; Chang, D.; Lin, Y.W.; Gallmann, L.; Fejer, M.M. Apodization of chirped quasi-phasematching devices. J. Opt. Soc. Am. B 2013, 30, 1551–1568. [Google Scholar] [CrossRef]
  10. Suchowski, H.; Krogen, P.R.; Huang, S.W.; Kärtner, F.X.; Moses, J. Octave-spanning coherent mid-IR generation via adiabatic difference frequency conversion. Opt. Express 2013, 21, 28892–28901. [Google Scholar] [CrossRef]
  11. Levitt, M.H.; Freeman, R. NMR population inversion using a composite pulse. J. Magn. Reson. 1979, 33, 473–476. [Google Scholar] [CrossRef]
  12. Shaka, A. Composite pulses for ultra-broadband spin inversion. Chem. Phys. Lett. 1985, 120, 201–205. [Google Scholar] [CrossRef]
  13. Shaka, A.; Pines, A. Symmetric phase-alternating composite pulses. J. Magn. Reson. 1987, 71, 495–503. [Google Scholar] [CrossRef] [Green Version]
  14. Dubietis, A.; Jonusauskas, G.; Piskarskas, A. Powerful femtosecond pulse generation by chirped and stretched pulse parametric amplification in BBO. Opt. Commun. 1992, 88, 4437–4440. [Google Scholar] [CrossRef]
  15. Dubietis, A.; Butkus, R.; Piskarskas, A.P. Trends in chirped pulse optical parametric amplification. IEEE J. Sel. Topics Quantum Electr. 2006, 12, 163–172. [Google Scholar] [CrossRef]
  16. Deng, Y.; Schwartz, A.; Fattahi, H.; Ueffing, M.; Gu, X.; Ossiander, M.; Metzger, T.; Pervak, V.; Ishizuki, H.; Taira, T.; et al. Carrier-envelope-phase-stable 1.2 mJ, 1.5 cycle laser pulses at 2.1 μm. Opt. Lett. 2012, 37, 4973–4975. [Google Scholar] [CrossRef] [Green Version]
  17. Toth, G.; Palfalvi, L.; Tokodi, L.; Hebling, J.; Fülöp, J.A. Scalable broadband OPCPA in Lithium Niobate with signal angular dispersion. Opt. Commun. 2016, 370, 250–255. [Google Scholar] [CrossRef]
  18. Boyd, R.W. Nonlinear Optics, 3rd ed.; Academic Press: New York, NY, USA, 2007. [Google Scholar]
  19. Yariv, A.; Yeh, P. Photonics: Optical Electronics in Modern Communications, 6th ed.; Oxford University Press: New York, NY, USA, 2007. [Google Scholar]
  20. Shen, Y.R. The Principles of Nonlinear Optics; John Wiley and Sons: Hoboken, NJ, USA, 1984. [Google Scholar]
  21. Baumgartner, R.; Byer, R. Optical parametric amplification. IEEE J. Quantum Electron. 1979, 15, 432–444. [Google Scholar] [CrossRef]
  22. Jacobi Elliptic Functions. Available online: http://mathworld.wolfram.com/JacobiEllipticFunctions.html (accessed on 28 December 2019).
  23. Levitt, M.H. Composite pulses. Prog. Nucl. Magn. Reson. Spectrosc. 1986, 18, 61–122. [Google Scholar] [CrossRef]
  24. Freeman, R. Spin Choreography; Spektrum: Oxford, UK, 1997. [Google Scholar]
  25. Schmidt-Kaler, F.; Häffner, H.; Riebe, M.; Gulde, S.; Lancaster, G.P.T.; Deuschle, T.; Becher, C.; Roos, C.F.; Eschner, J.; Blatt, R. Realization of the Cirac–Zoller controlled-NOT quantum gate. Nature (Lond.) 2003, 422, 408–411. [Google Scholar] [CrossRef]
  26. Timoney, N.; Elman, V.; Glaser, S.; Weiss, C.; Johanning, M.; Neuhauser, W.; Wunderlich, C. Error-resistant single-qubit gates with trapped ions. Phys. Rev. A 2008, 77, 052334. [Google Scholar] [CrossRef] [Green Version]
  27. Torosov, B.T.; Guerin, S.; Vitanov, N.V. High-Fidelity Adiabatic Passage by Composite Sequences of Chirped Pulses. Phys. Rev. Lett. 2011, 106, 233001. [Google Scholar] [CrossRef] [PubMed] [Green Version]
  28. Schraft, D.; Halfmann, T.; Genov, G.T.; Vitanov, N.V. Experimental demonstration of composite adiabatic passage. Phys. Rev. A 2013, 88, 063406. [Google Scholar] [CrossRef]
  29. Genov, G.T.; Rangelov, A.A.; Vitanov, N.V. Efficient broadband frequency generation in composite crystals. J. Opt. 2014, 16, 062001. [Google Scholar] [CrossRef]
  30. Rangelov, A.A.; Vitanov, N.V.; Montemezzani, G. Robust and broadband frequency conversion in composite crystals with tailored segment widths and χ(2) nonlinearities of alternating signs. Opt. Lett. 2014, 39, 2959–2962. [Google Scholar] [CrossRef]
  31. Erlich, Y.; Rangelov, A.A.; Montemezzani, G.; Suchowski, H. Robust, efficient, and broadband SHG of ultrashort pulses in composite crystals. Opt. Lett. 2019, 44, 3837–3840. [Google Scholar] [CrossRef]
  32. Suchowski, H.; Porat, G.; Arie, A. Adiabatic processes in frequency conversion. Laser Photonics Rev. 2014, 8, 333–367. [Google Scholar] [CrossRef]
  33. Suchowski, H.; Oron, D.; Arie, A.; Silberberg, Y. Geometrical representation of sum frequency generation and adiabatic frequency conversion. Phys. Rev. A 2008, 78, 063821. [Google Scholar] [CrossRef] [Green Version]
  34. Nikogosyan, D.N. Nonlinar Optical Crystals; Springer: New York, NY, USA, 2005. [Google Scholar]
  35. Bach, F.; Mero, M.; Chou, M.-H.; Petrov, V. Laser induced damage studies of LiNbO3 using 1030-nm, ultrashort pulses at 10-1000 kHz. Opt. Mater. Express 2017, 7, 240–252. [Google Scholar] [CrossRef]
  36. Meng, Q.; Zhang, B.; Zhong, S.; Zhu, L. Damage threshold of lithium niobate crystal under single and multiple femtosecond laser pulses: Theoretical and experimental study. Appl. Phys. A 2016, 122, 582. [Google Scholar] [CrossRef]
  37. Allen, L.; Eberly, J.H. Optical Resonance and Two-Level Atoms; Dover: New York, NY, USA, 1987. [Google Scholar]
  38. Shore, B.W. The Theory of Coherent Atomic Excitation; Wiley: New York, NY, USA, 1990. [Google Scholar]
  39. Vitanov, N.V.; Halfmann, T.; Shore, B.W.; Bergmann, K. Laser-induced population transfer by adiabatic passage techniques. Annu. Rev. Phys. Chem. 2001, 52, 763–809. [Google Scholar] [CrossRef] [PubMed]
  40. Vitanov, N.V.; Fleischhauer, M.; Shore, B.W.; Bergmann, K. Coherent manipulation of atoms and molecules by sequential laser pulses. Adv. At. Mol. Opt. Phys. 2001, 46, 55–190. [Google Scholar]
  41. Suchowski, H.; Prabhudesai, V.; Oron, D.; Arie, A.; Silberberg, Y. Robust efficient sum frequency conversion. Opt. Express 2009, 17, 12731–12740. [Google Scholar] [CrossRef] [PubMed]
  42. Suchowski, H.; Bruner, B.D.; Ganany-Padowicz, A.; Juwiler, I.; Arie, A.; Silberberg, Y. Adiabatic frequency conversion of ultrafast pulses. Appl. Phys. B 2011, 105, 697–702. [Google Scholar] [CrossRef]
  43. Abragam, A. The Principles of Nuclear Magnetism; Oxford University Press: Oxford, UK, 1961. [Google Scholar]
  44. Slichter, C.P. Principles of Magnetic Resonance; Springer: Berlin, Germany, 1990. [Google Scholar]
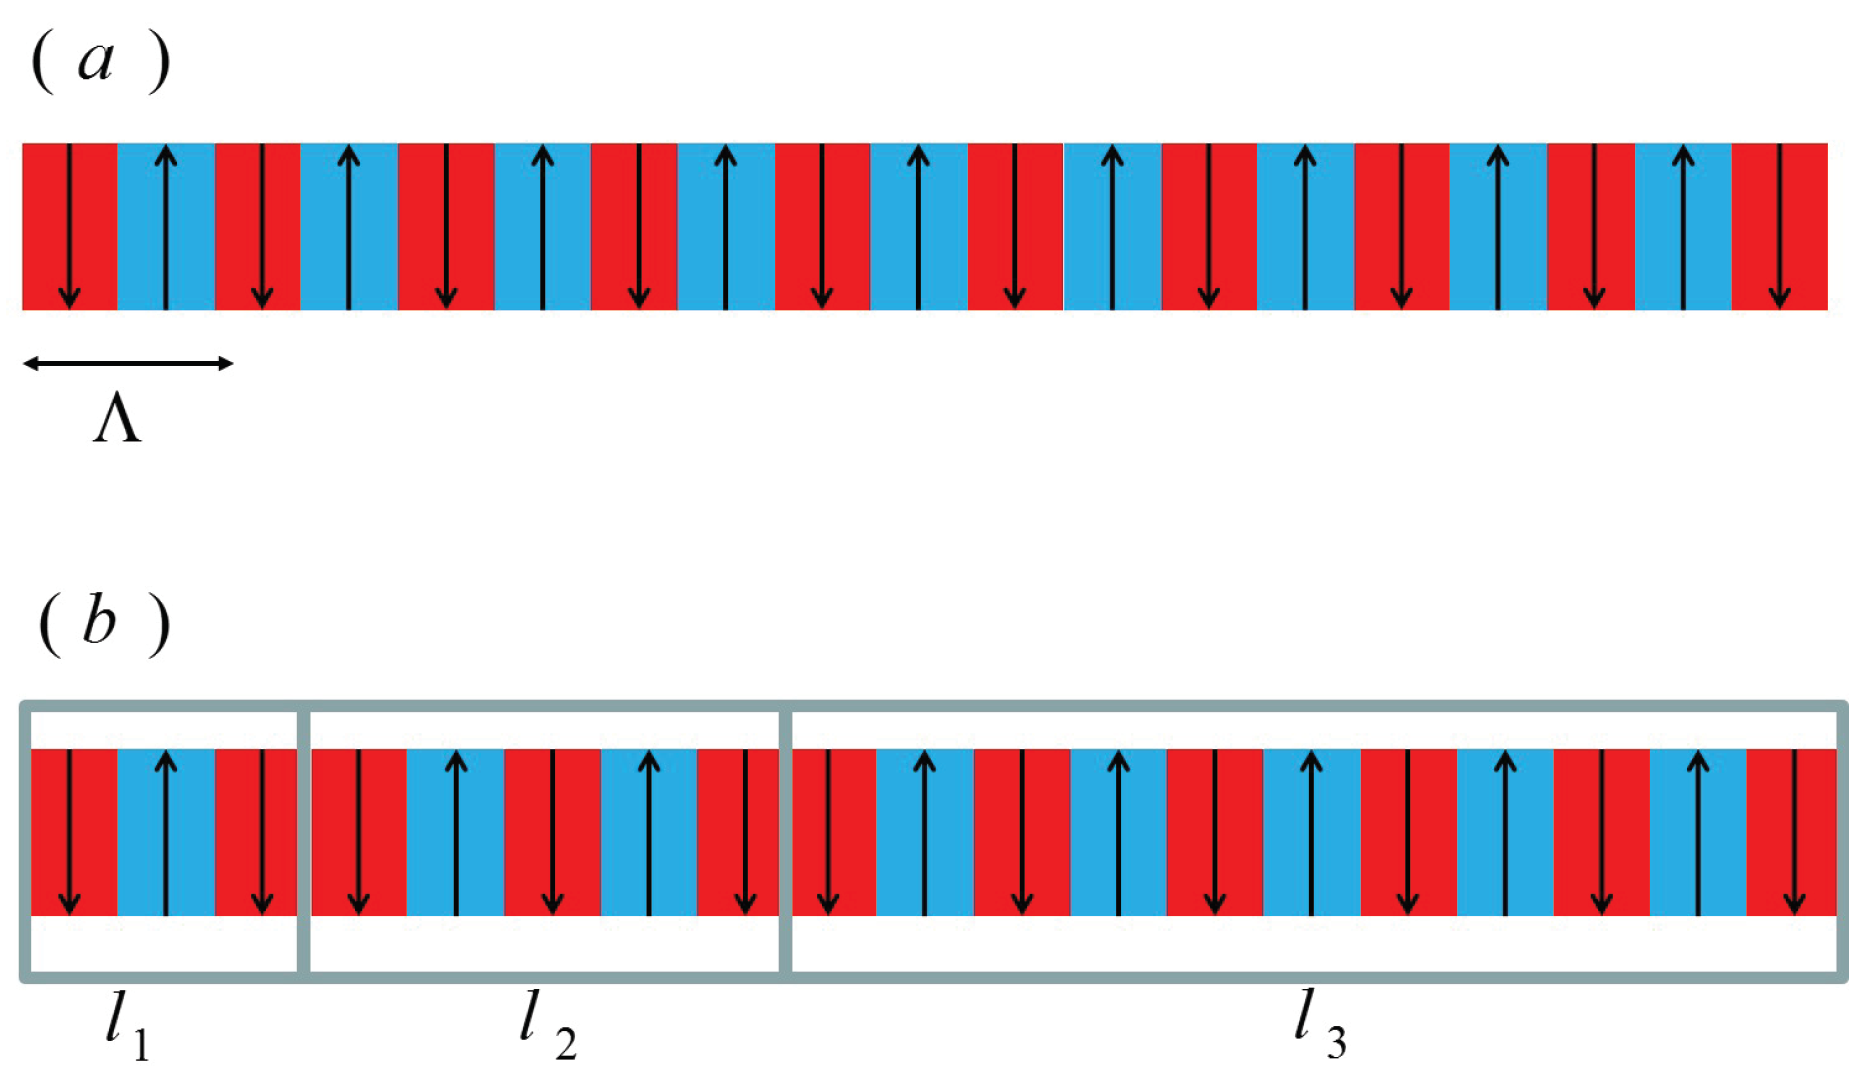
Figure 1. Sign reversal of χ ( 2 ) nonlinear coefficient for (a) standard quasi-phase matching (QPM) technique with local modulation period Λ . (b) Composite segmented periodically poled design, with example of 3 segments. All segments are periodically poled with the same period Λ , however once a new segment begins, the sign reversal order of χ ( 2 ) is changed.
Applsci 10 01220 g001
Figure 2. (Color online) Signal intensity amplification a vs. the phase mismatch Δ k and the coupling Ω ˜ . (a) Standard periodic quasi-phase matching (QPM) design. (b) Composite crystal with six segments (6a from Table 1). The color bar on the right-hand side gives the values of a for the different colors. The points P1, P2, and P3 are selected positions used to illustrate the behavior in Figure 3. The three isolines mark intensity amplification levels of 30, 60, and 90. The input wave amplitudes are A 1 0 = 0.1 , A 2 0 = 0 and A 3 0 = 1 . An amplification a = 90 means that 90 (out of 100) pump photons are transformed into 90 signal photons, as well as 90 idler photons.
Applsci 10 01220 g002
Figure 3. (Color online) Spatial evolution of the signal wave intensity for the three points indicated as P1, P2 and P3 in Figure 2 for the cases of a segmented composite crystal (a) and of QPM only (b). The input wave amplitudes are as in Figure 2. In panel (a) the segment boundaries are indicated by vertical lines. The zoom in panel (a) shows the oscillations in the intensity due to each individual QPM periodic domain. Towards the end of the crystal, by the effect of the discontinuities the evolutions get essentially in phase for the three positions in the case of panel (a), but not in the case of panel (b). The parameters are position P1: Ω ˜ = 24 / L , Δ k = 0 ; position P2: Ω ˜ = 24 / L , Δ k = 10 / L ; and position P3: Ω ˜ = 20 / L , Δ k = 3 / L . For both graphs, the quasi-phase matching period was chosen to be Λ = L / 250 . The three-wave mixing equations were integrated using the full version of Equation (1) that takes into account the effect of each periodic domain (see text).
Applsci 10 01220 g003
Figure 4. (Color online) Color plots of the signal intensity amplification a as a function of the input pump intensity I 3 and the signal wavelength λ 1 for the case of MgO:LiNbO 3 and with initial conditions A 1 ( 0 ) = 0.1 , A 2 ( 0 ) = 0 , and A 3 ( 0 ) = 1 so that r = 100 . The total crystal length is L = 5 mm. A pump intensity of 1 GW/cm 2 corresponds to a modified coupling coefficient Ω = 1.32 1/mm at the central wavelength of 1.55 μ m. (a) QPM periodic design only. (b) Composite crystal with three segments (3 from Table 1). (c) Composite crystal with six segments (6b from Table 1). In all cases, the poling period is Λ = 29.71 μ m. The color code for the amplification a is given in the color bar on the right-hand side. The three isolines mark intensity amplification levels of 30, 60, and 90.
Applsci 10 01220 g004
Figure 5. (Color online) (a,b) Color plots of the signal intensity amplification a vs. the input pump intensity I 3 and the signal wavelength λ 1 for the case of MgO:LiNbO 3 . The initial conditions are A 1 ( 0 ) = 0.01 , A 2 ( 0 ) = 0 , and A 3 ( 0 ) = 1 so that r = 10,000 and the remaining parameters are as in Figure 4. (a) QPM periodic design only. (b) Composite crystal with six segments (6c from Table 1). The color bar is given on the top. The three isolines mark intensity amplification levels of 3000, 6000, and 9000. The right-hand panel (c) show the signal amplification spectrum for the two cases at the optimum level of pump intensity I 3 corresponding to the two horizontal lines in panels (a,b), I 3 = 0.8 GW/cm 2 and I 3 = 3.75 GW/cm 2 , respectively. The red solid line is for the segmented composite crystal while the blue dashed line for standard QPM only.
Applsci 10 01220 g005
Figure 6. (Color online) Color plots of the signal intensity amplification a vs. the input pump intensity I 3 and the signal wavelength λ 1 for the case of MgO:LiNbO 3 . The initial conditions are A 1 ( 0 ) = 1 , A 2 ( 0 ) = 0 , and A 3 ( 0 ) = 1 so that r = 1 and the remaining parameters are as in Figure 4. (a) QPM periodic design only. (b) Composite crystal with eight segments (8 from Table 1). (c) Same as panel (b) but with a random error within ± 5 % of the segment lengths. The two isolines mark intensity amplification levels of 1.5 and 1.9, respectively.
Applsci 10 01220 g006
Table 1. Numerically found segment lengths l i (in units of total crystal length L) for composite segmented periodically poled design with N segments. The given values for l i are such as to optimize the robustness of the OPA process against variations of the nonlinear coupling coefficient and of the phase mismatch Δ k .
NNameSegment Lengths l 1 ; l 2 ; ; l N in Units of L
330.373; 0.594; 0.033
440.303; 0.522; 0.124; 0.051
66a0.293; 0.258; 0.003; 0.255; 0.124; 0.067
66b0.168; 0.035; 0.345; 0.023; 0.222; 0.207
66c0.223; 0.005; 0.404; 0.175; 0.113; 0.080
880.022; 0.064; 0.046; 0.205; 0.270; 0.096; 0.222; 0.075