2.1. Sampling Sites and Methods
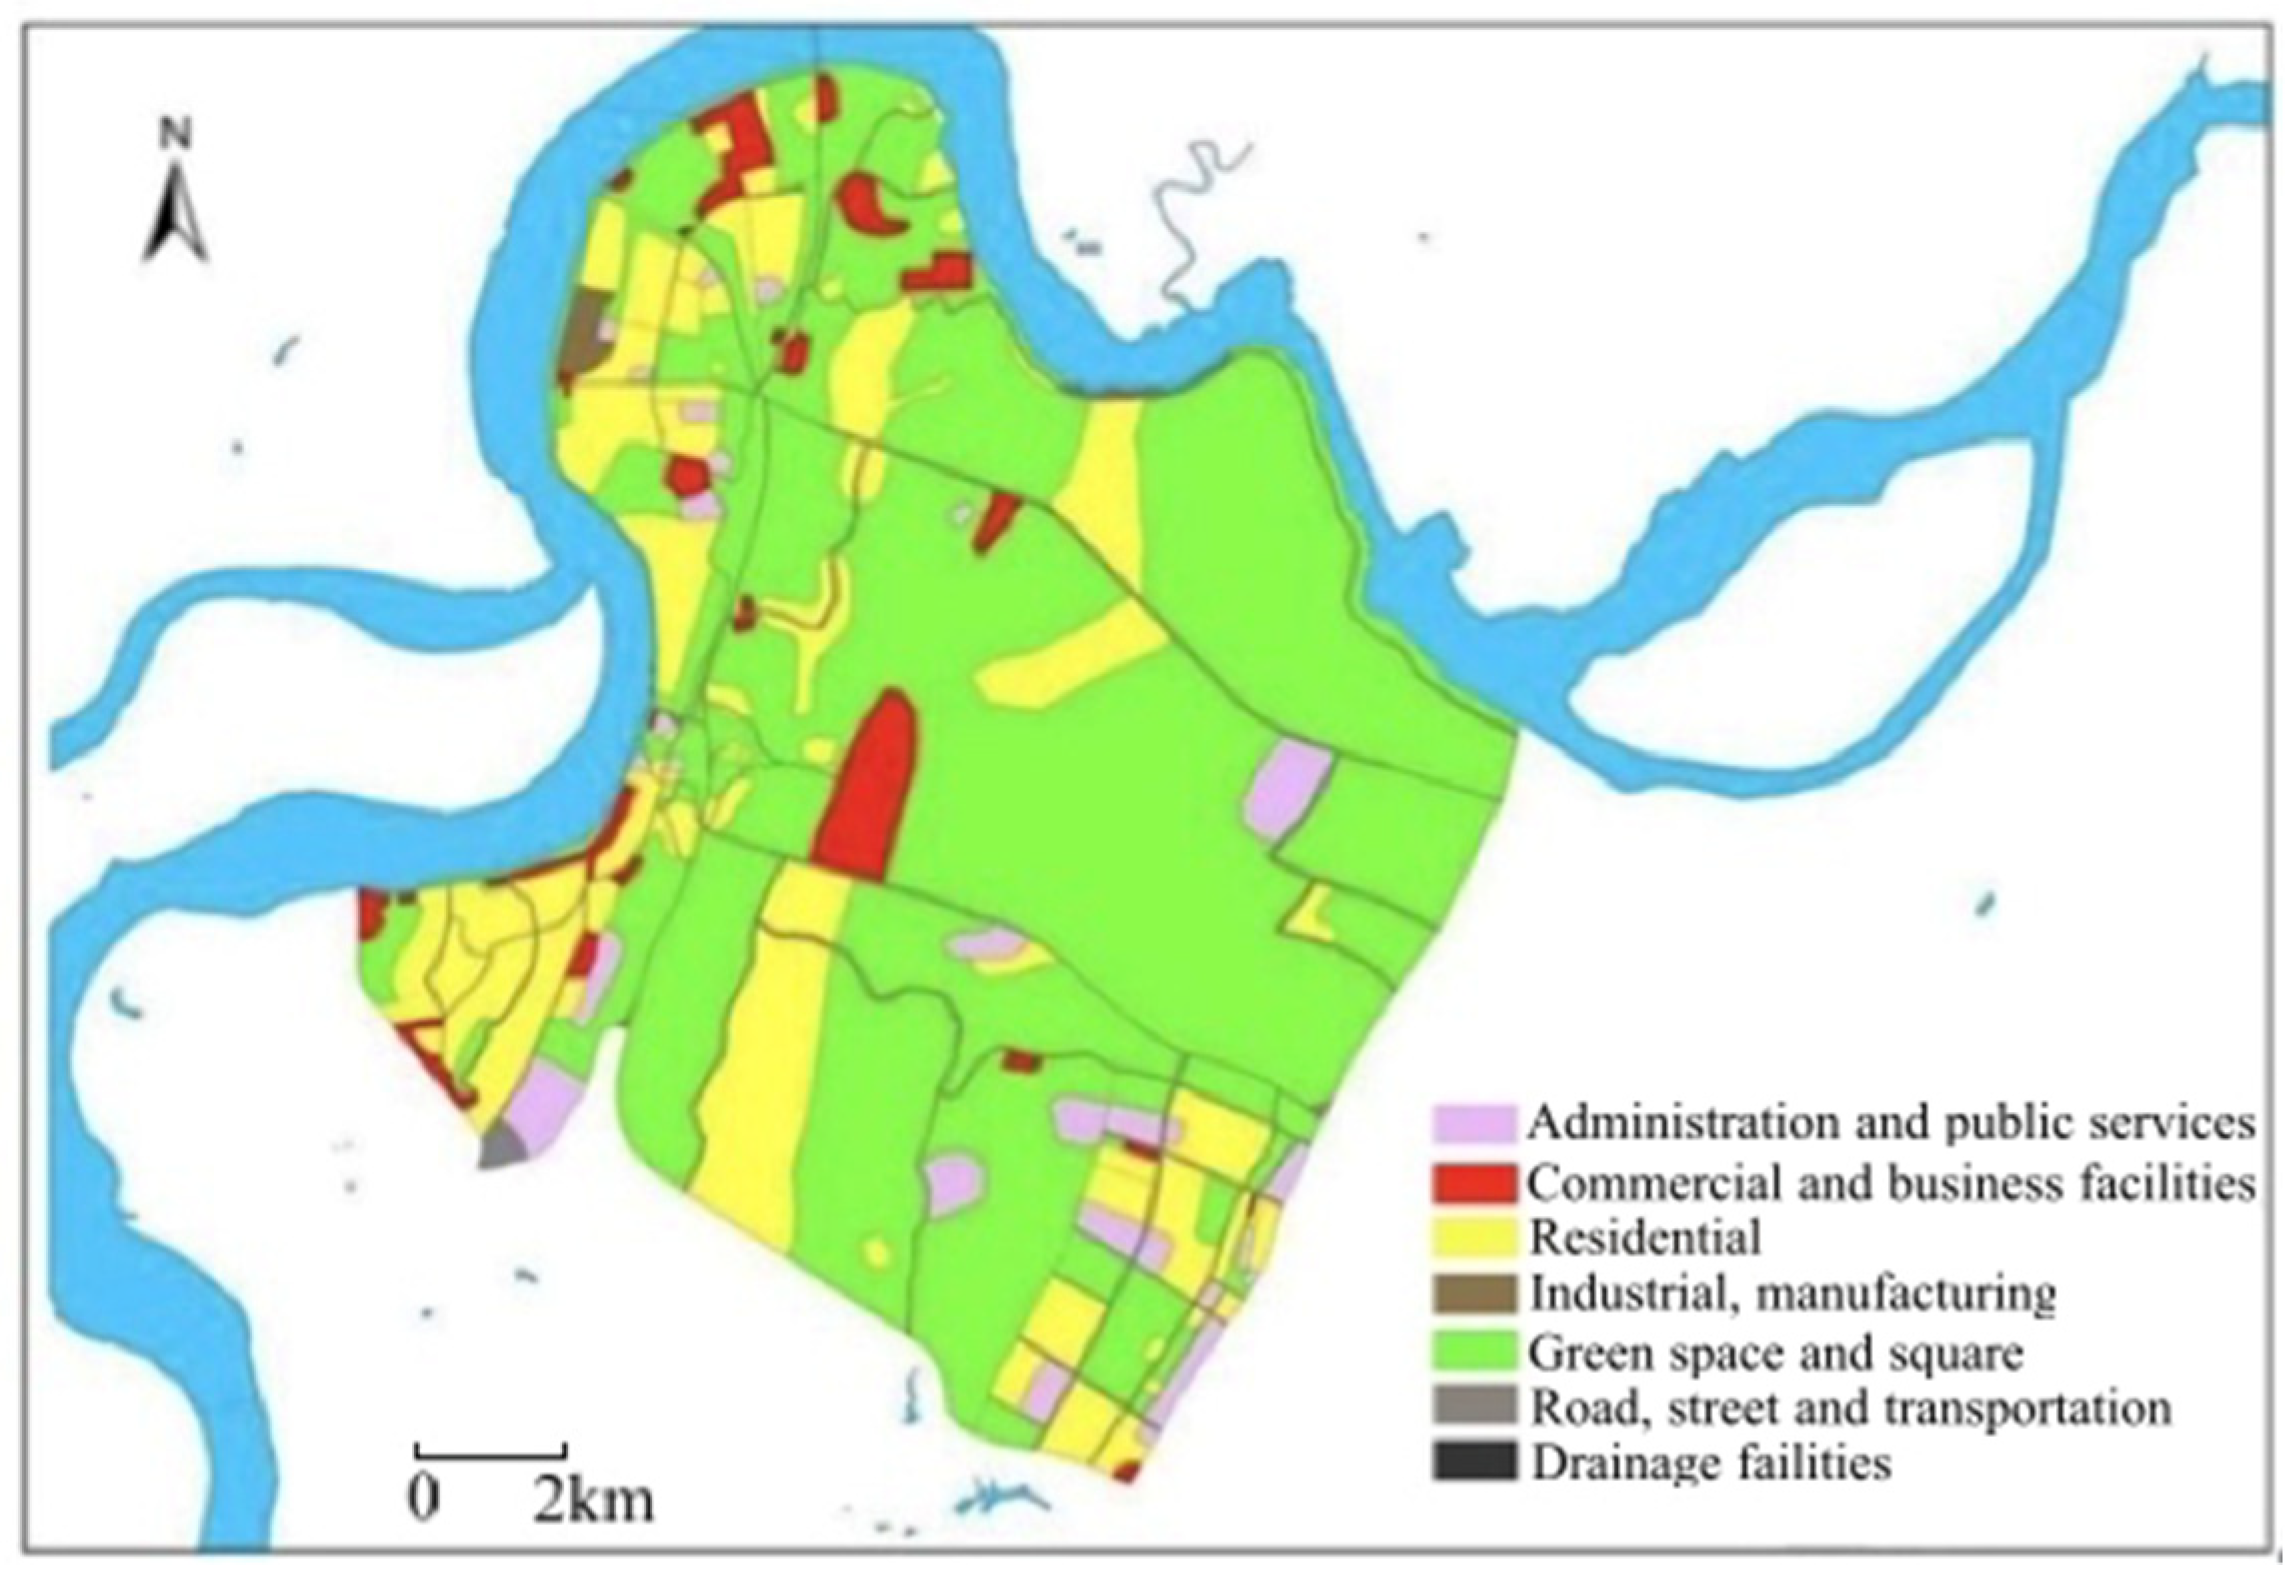
The total length of the river section considered in this study was 15 km. Satellite images were used as the basic information source, and remote sensing images were interpreted and vectored to obtain vector data of the south bank area. Based on the current land use, urban functional zoning, and the field investigation results, we drew a schematic diagram of land use and functional zoning is, as shown in
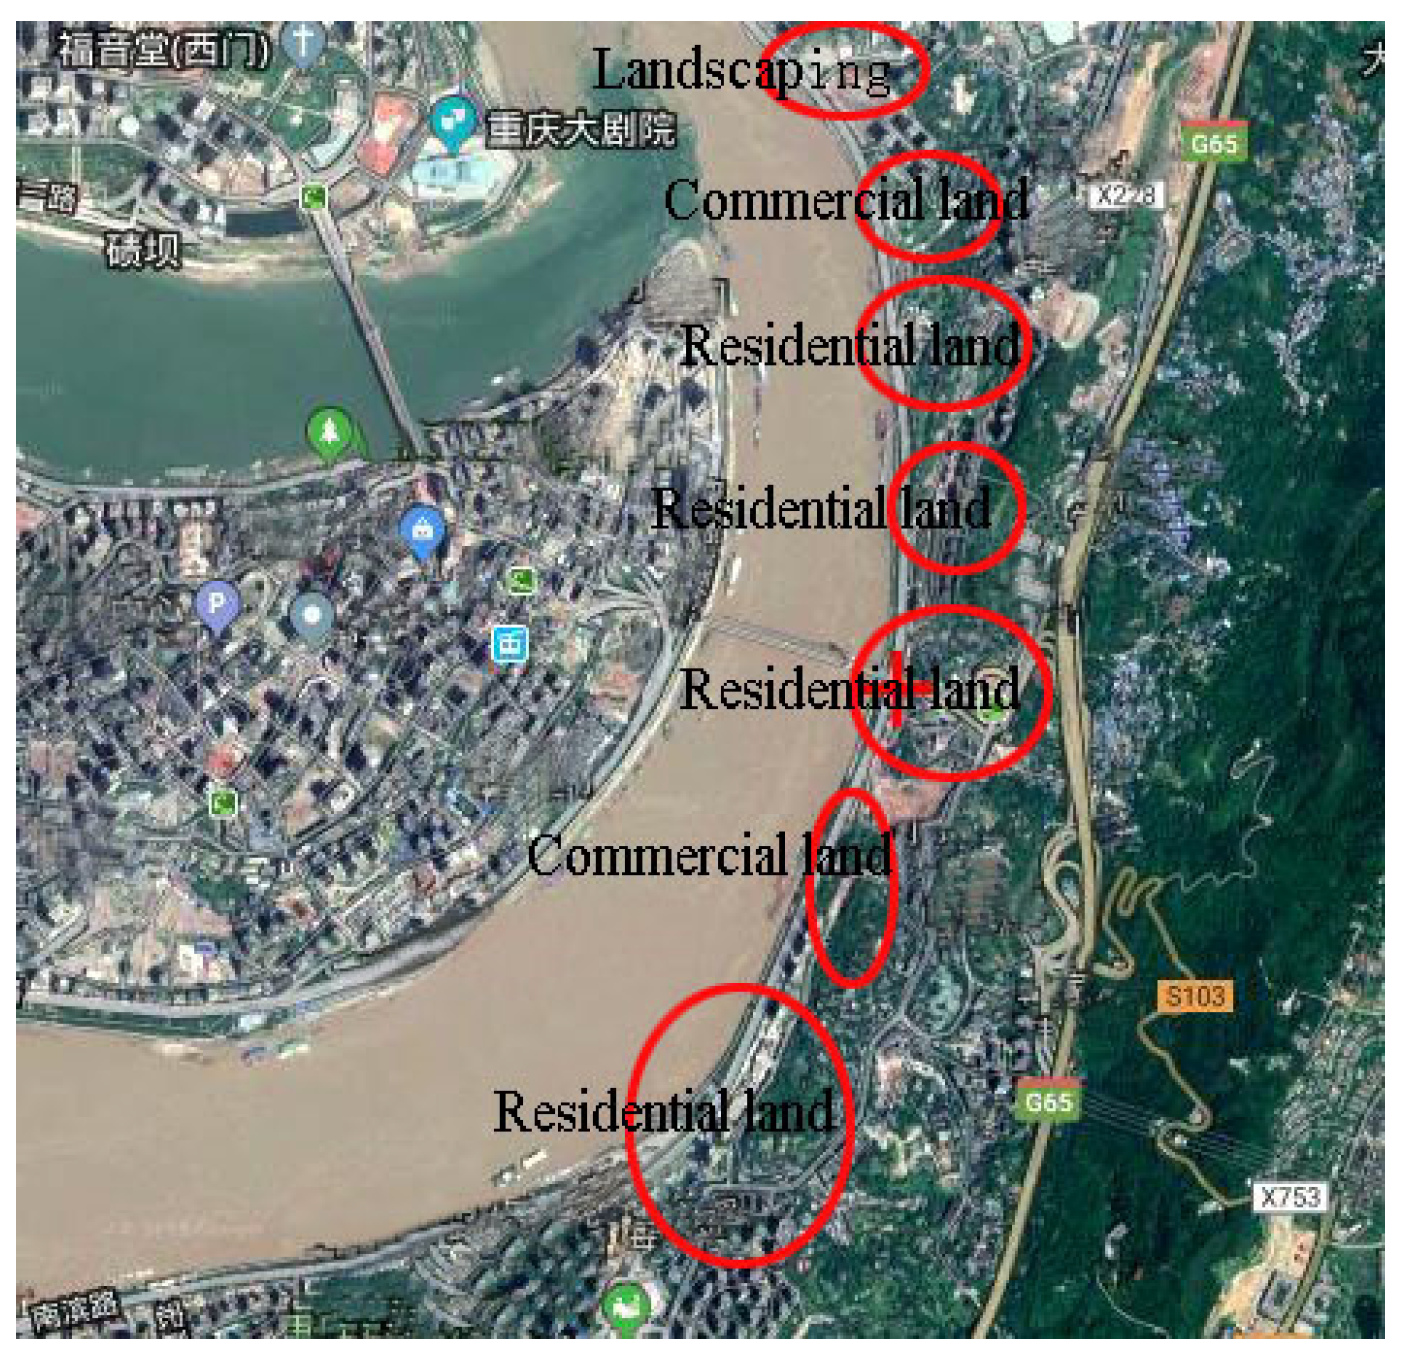
Figure 2. Combined with the construction land planning of the main urban area in 2014, the main types of land used in the riverside section of south bank were divided into residential land, commercial service facility land, green land and square land, and public management and public service facility land. Large residential areas included Coral Water Bank, Haitang Xiaoyue, Wuyi Riverside, Sunshine 100 International New City, etc. Large commercial areas included Dongyuan 1891, Changjiahui shopping park, etc. (
Figure 3). The study area included seven sewage outlets and two drinking water protection areas, which are the first and secondary protected area, respectively, located on the left and right side of Dongshuimen Bridge, respectively.
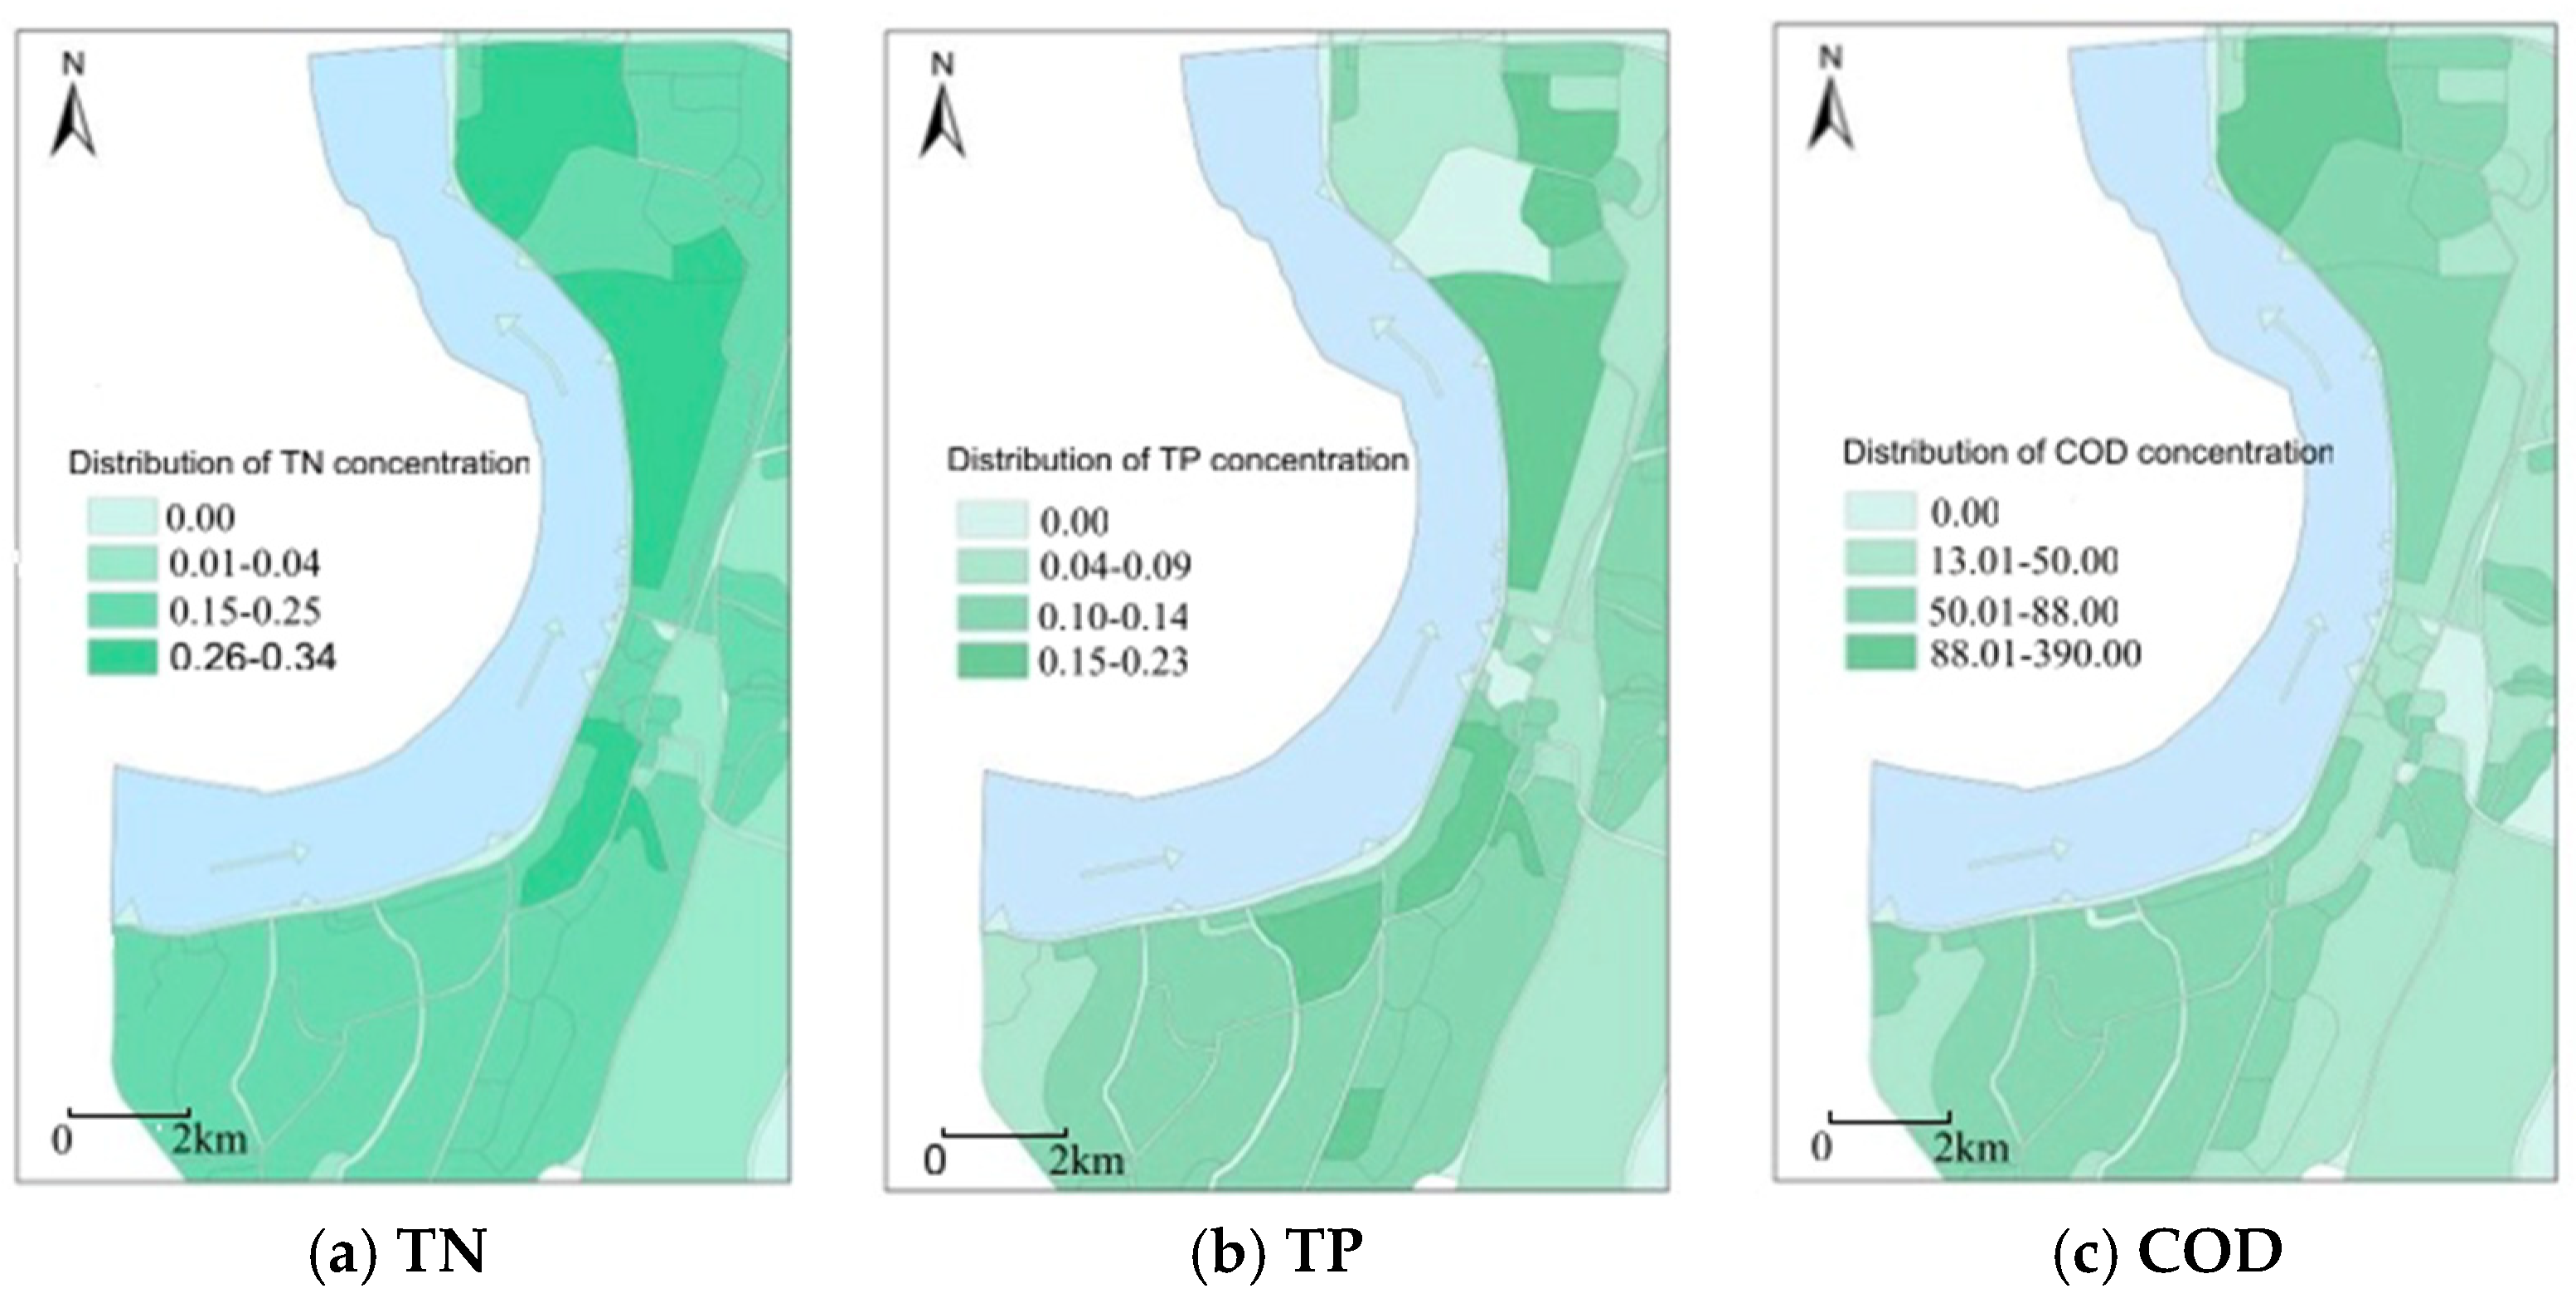
In this study, we focused on total phosphorus (TP), total nitrogen (TN), and chemical oxygen demand (COD) due to their recognized impacts on aquatic ecosystems and typical association with urban areas across the region (regulations on the division of drinking water source protection zones in Chongqing, 2002).
First, the waters in the study were monitored for one year. After a long-term sampling test, we found that within the studied shoreline length, the data at each sampling point did not change significantly in some time periods. Secondly, due to the three periods of high water, low water, and flat water, the main body of economic development along the Yangtze River differs, resulting in different sources of pollution during different water periods. Therefore, we discussed problems according to different water periods. The study area has high construction density, which is a typical urban center/riverside area, different from the whole city (the area studied is relatively large). Finally, considering the uncertainties of long-term observation data sampling, three samples were obtained at the same sampling point each time. If the error difference between two groups of samples was 5%, resampling was conducted. If the error difference was less than 5%, the average value of the three groups was taken as the final measurement result.
For these four reasons above, water samples were collected from 10 different areas along Nanbin Road along the Yangtze River in May and October 2019. The two sampling times were selected because May and October are before and after the Yangtze River flood season. Analyses were undertaken by accredited laboratories using standard methods and procedures: HJ 495—2009, TP and heavy metals–GB 11893-89, and HJ 636-2012 in China. According to Water Quality-Guidance on Sampling Techniques of Rivers, HJ/T 52-1999, the sewage discharged into most rivers can be fully vertically mixed within 1 km. In this case, a sampling point can be arranged at any depth in the vertical direction.
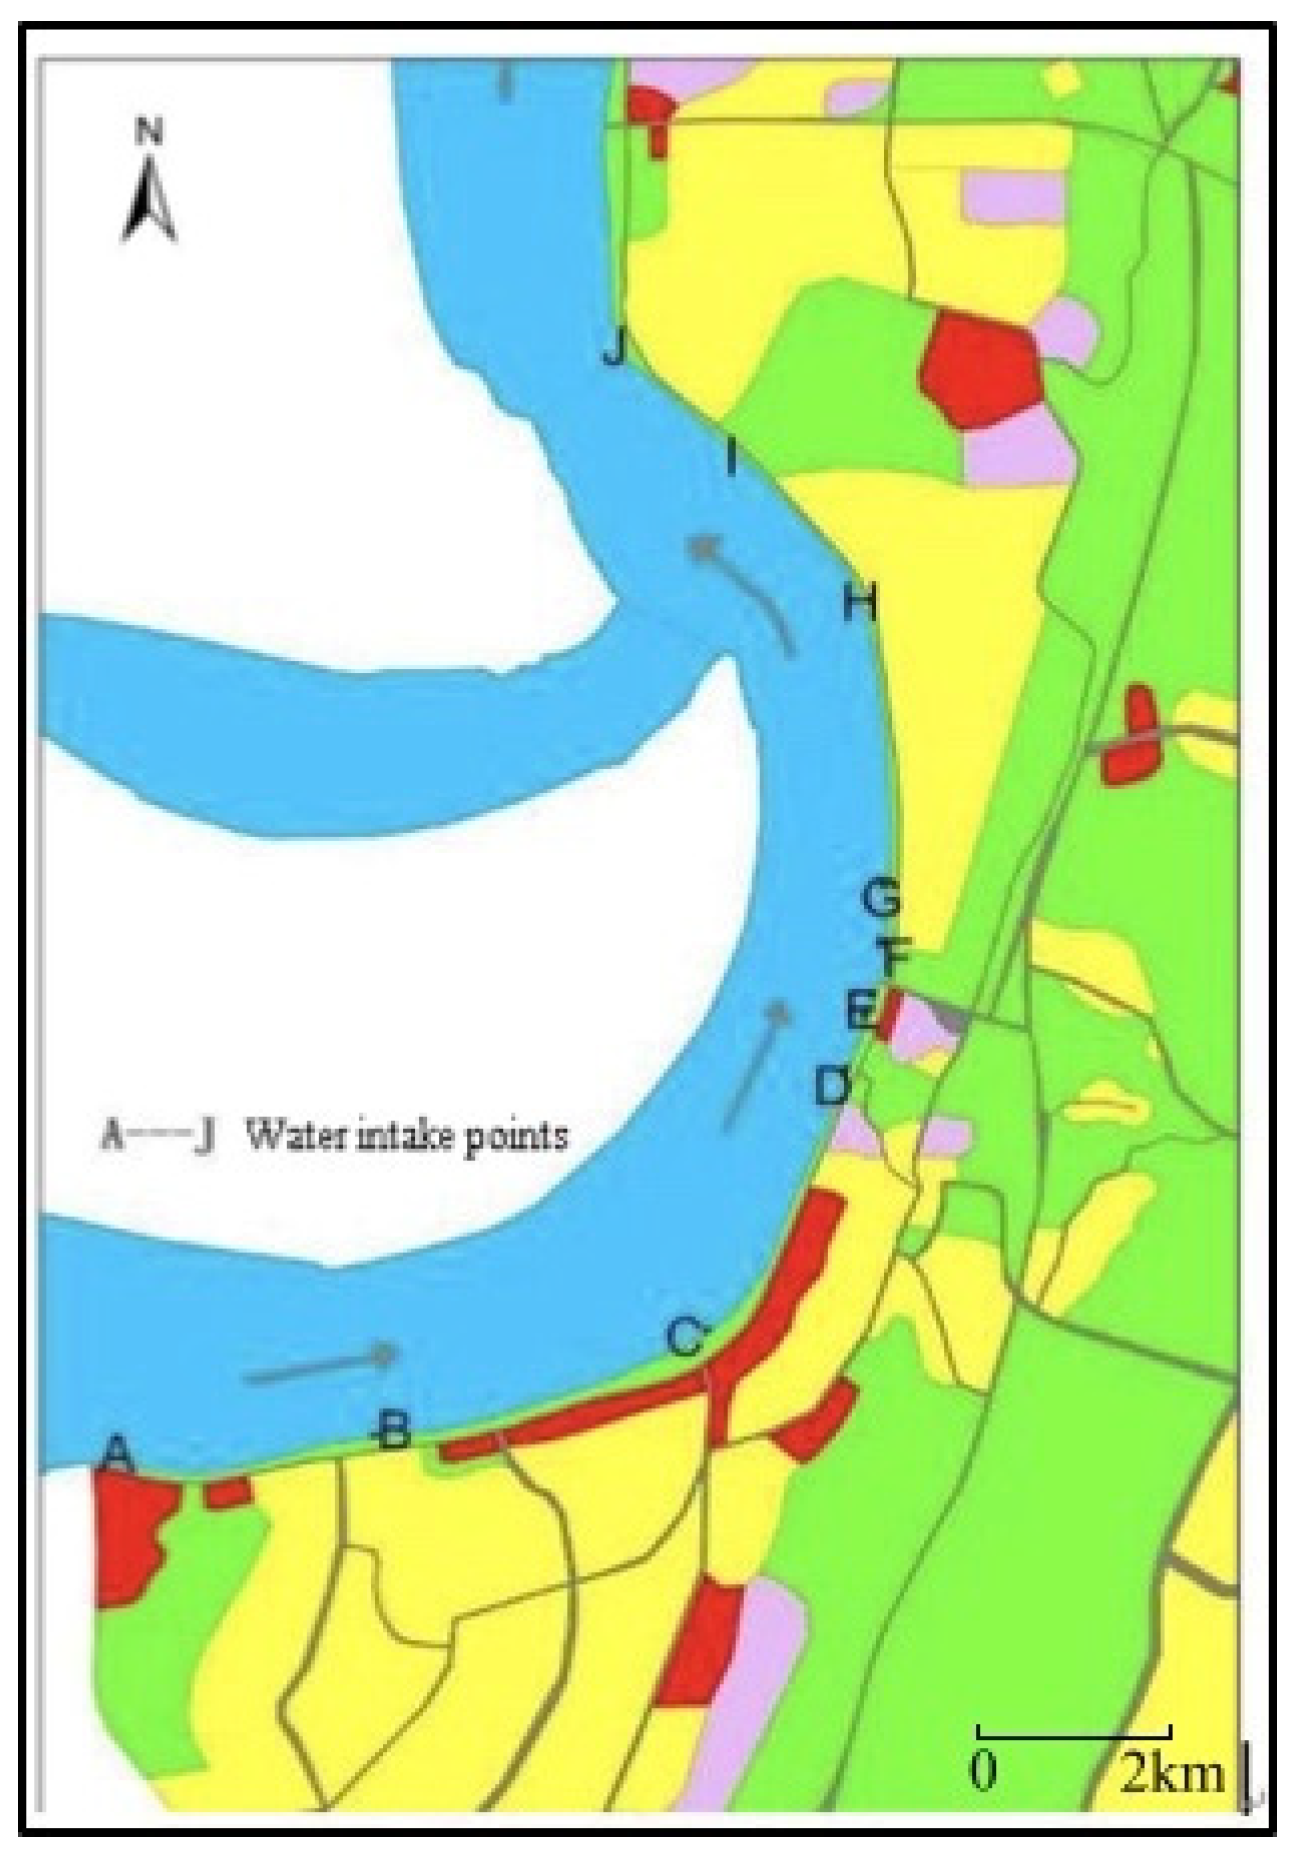
Ten water extraction points were selected in this study, as shown in
Figure 4. Point A is a gathering place for hotels and other commercial service facilities, located under the Yangtze River bridge. Point B is a sewage outlet in Huangge Wandu, surrounded by high-rise residential areas and several super high-rise hotels. Point C is located in Yanyu Park; nearby are high-rise residential groups and supporting businesses along the street; a sewage outlet exists near point D, which is a secondary protection area for drinking water. Point E is at the lower left of East Watergate. A sewage outlet is nearby and a university is 1 km away (Chongqing Institute of Socialism). Point F is located on the right side of Dongshuimen Bridge, near a sewage outlet. The water pollution is serious, and the water surface is yellowish. Point G is 100 m from point F. There is a sewage outlet nearby. Point H is located in Sunshine 100 International New City, surrounded by small super high-rise residential areas. Point I is located in Changjiang Art Plaza, with the Chongqing Cigarette Factory and Experimental Middle School within 1 km; Point J is located in Changjiahui shopping park (a large commercial center), surrounded by high-rise residential areas.
To facilitate the research and protection of urban environment and water quality, Chongqing municipality has unified the monitoring time of surface water quality in the Yangtze, Jialing, and Wujiang Rivers since 2011. The samples were taken 48 h after rain to avoid the dilution of water pollutants by rain, which would interfere with the research results. The sampling occurred from 07:00 to 10:00 a.m. to avoid volatilization caused by sunlight on the collected water samples. According to the sample volume regulation (
Table 1) of the standard inspection index for drinking water, the water receiver was a 380 mL plastic bottle. Sampling occurred in hydrometric sections in the waterbed cross-section. Before sampling water, the water sampler was flushed three times with the substitute sample to ensure the water sample filled the container. After collecting the water sample, we measured the pH of the water sample immediately, then added concentrated sulfuric acid and adjusted the water sample to pH ≤ 2, then refrigerated it at 4 °C to inhibit the metabolic process of microorganisms. The samples were sent to a laboratory for testing as soon as possible to prevent the deterioration of the sample. To prevent sudden changes in water quality at the intake point from affecting the measurement results, three samples were collected around each intake point for analysis. Research shows that such sampling method can reflect the average variation of concentration [
18].
In addition to the water quality data set, we collected 15 other types of data (summarized in
Table 1) on planning, infrastructure, land use, topography, and climate indicators to serve as our independent variables for the analysis.
2.2. Analysis of Laboratory Results
The pH value of all sampling points was 6–9, and all samples met the environmental quality standards for surface water. At sampling point B, COD > 45 failed to meet the water quality safety index. The measuring point was surrounded by high-grade residential areas. At D point, COD > 45. Nearby is a university, with a total construction area of 900,000 m
2, and a five-star city tourist attraction project. As shown in
Table 2, the COD value of point H was higher than 45, with small high-rise residential groups, a middle school (Chongqing Binjiang Experimental Middle School, Binjiang, China), and a hospital nearby. The COD at point J was 390, which is much higher than the standard limit for COD concentration. To verify the results, another sampling was conducted and the detection results were similar to the first. The urban functions near point J include high-rise residential areas and commercial centers, with a concentrated population. The other indexes of each measuring point met the environmental quality standards for surface water.
As shown in
Figure 5, the residential group near point B is close to the river, with a plot ratio of less than 2.0, and has sufficient green areas. High-rise buildings and multi-story buildings are adjacent to the river. This kind of layout is more common in riverside areas. The aerial picture shows that there was a large amount of unused land near the river at point D, with few traces of human activity. In addition, there is a basketball court. The shoreline here has not been over-developed. The government has strictly stipulated the floor area ratio and building height of this area.


