Abstract
This paper proposes a new vibration isolation mounting system, with spherical balls and vertical spring dampers, that provides seismic protection from horizontal and vertical ground excitation. To characterize the system, nonlinear governing equations are derived by considering the kinematics and interaction forces of the structures, and the dynamic characteristics of the design parameters are investigated by numerical analysis. The condition of contact stability for sustaining continuous friction of the isolation device is discussed, along with the design parameters. The vibration transfer characteristics are analyzed for the displacement transfer ratio obtained for the design parameters satisfying the sustainable contact condition, when the base is harmonically excited. The results confirm that the relative motion occurrence satisfies the conditional expression, and a jump in which the transfer ratio suddenly increases at a specific frequency is identified. Finally, design variables that are suitable for the horizontal and vertical acceleration of the El Centro earthquake are set, and a simulation confirms the vibration reduction effect in both the horizontal and vertical motions.
1. Introduction
There is an increasing demand for the protection of equipment from damage caused by vibrations and earthquakes in the environment [1]. In recent years, the scale of the damage and incidents resulting from earthquakes and vibrations have been increasing, not only for buildings, but also for industrial equipment. Therefore, various seismic isolation systems have been introduced and actively studied to deal with threats from earthquakes and vibrations [2,3].
The isolation system incorporates basic mechanical devices to reduce the structural response owing to the shaking and vibration of earthquakes and similar events. Various types of mechanical isolation systems are available, such as sliding bearings, rubber bearings, spring-damper rolling bearings, and ball bearing isolation systems [4,5,6]. In recent years, numerous vibration isolation methods have been developed with a combination of technologies, including energy dissipation, vibration control, and base insulation [7,8,9].
Initial research on the rolling bearing seismic isolation system (RIS) was carried out by Lin and Hone in 1993 [10,11]. Their model consists of a flat plate and cylindrical rolling bearings and is used extensively owing to its protective effect against earthquakes [12,13]. To overcome the disadvantages of re-centering, Tsai [14] constructed an RIS with cylindrical rollers between two V-shaped rolling surfaces and applied these to a bridge structure.
Although the RIS exhibits excellent seismic performance, the problem is that the seismic table moves easily in the horizontal direction, even in the case of weak earthquakes or small vibrations around the RIS, in addition to issues regarding resonance. Moreover, no vibration insulation exists in the vertical direction, and when vibration occurs in the horizontal direction, the phenomenon of vertical vibration amplification occurs, as a result of the geometric structure of the isolator. To overcome the limitations of traditional friction pendulum insulators, Krishnamoorthy developed a variable curvature pendulum isolator and variable friction pendulum isolator and studied the effects of this isolating system [15,16,17]. Hong and Hur [18] published a study on systems with the addition of concave and springs to solve convergence problems. Shaikhzadeh presented a numerical simulation and a comparison of the effects of four sliding isolators with variable curvature insulators [19]. Research on RIS using spherical balls instead of cylindrical rollers has also been conducted and applied to light loads [20,21,22,23]. Furthermore, variable frequency pendulum isolators and variable curvature friction pendulum systems have been proposed by Pranesh and Sinha, and Tsai et al. [24,25]. However, these studies did not address the problem of insulation against vertical vibration. Therefore, studies using springs and dampers for horizontal vibration control have also been conducted. Representative energy dissipation methods include the use of dampers and rubber, and numerous studies have been published in this area [26,27,28]. A representative study was conducted on the anti-vibration rubber bearing as a method for vibration control by means of damping. Such investigations have been carried out continually to increase the damping force of materials, and their probabilistic reliability has been studied [29,30,31,32,33,34]. However, problems are encountered with the durability and natural aging of rubber materials for high loads [35]. Therefore, it is necessary to study isolators that can simultaneously insulate horizontal and vertical vibration for earthquakes and excitations. Wei et al. [36,37,38] published a related study on a vertical spring-viscous damper–concave Coulomb friction isolation system. However, this method was structurally simplified and optimized by the relation of force for the one-degree-of-freedom motion of the superstructure. Moreover, this method exhibits the disadvantage that it is difficult to control the frictional force realistically by changing the geometric spring force owing to the theoretical behavior. Therefore, it is necessary to study the structural design of multiple degrees of freedom and the characteristics of the motion in which spring-damper geometry is fully coupled with motion.
To solve this problem, in this study, a new isolation unit structure was designed, with a spherical ball and vertical spring damper, as illustrated in Figure 1. The purpose of this research was to study the characteristics of the isolator to design the shape and physical properties of the new isolation system in the design stage. The following aspects are presented in this paper to characterize the new isolator for improved performance:
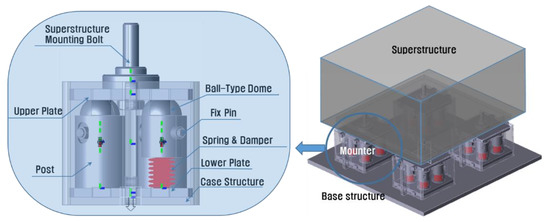
Figure 1.
Configuration and installation diagram of the proposed vibration isolation mounting system.
- (1)
- Proposal of a new RIS system with vertical spring-damper for horizontal and vertical vibration improvement;
- (2)
- Derivation of theoretical equations for horizontal and vertical vibrations;
- (3)
- The relationship between the design parameters of the behavior characteristics of the spring-dampers;
- (4)
- The control of resonance and design parameters.
In this study, the theoretical governing equations for isolation systems are derived and nonlinear problems are analyzed using the fourth- and fifth-order Runge–Kutta methods. Furthermore, the dynamic behavior is examined with respect to the structural movement, the occurrence of relative motion and resonance, and the contact condition for sliding, according to various parameters, such as the spring constant and excitation input magnitude.
2. Equations of Motion
2.1. Description of Vibration Isolator Model
The practical system is a complex structure in which multiple isolation devices support the superstructure, as shown in Figure 1. The one device is a symmetrical structure in which multiple spring dampers, to each of which a ball-type dome is attached, are vertically fixed to the lower plate to support an upper plate made of a concave surface. To consider the theoretical vibration characteristics of this system, structural simplification is needed. If we consider only two degrees of freedom in the vertical and horizontal directions without rotational motion, the behavior of multiple isolators is the same motion, so the system can be simplified to the distributed mass at one isolator and isolator, as shown in Figure 2a. The rotational motion is ignored because several mounts on the horizontal plane are used symmetrically on the vertical plane and the vertical displacement is small in the seismic excitation. The base structure also receives ground excitation, while the superstructure contains the equipment to be protected.
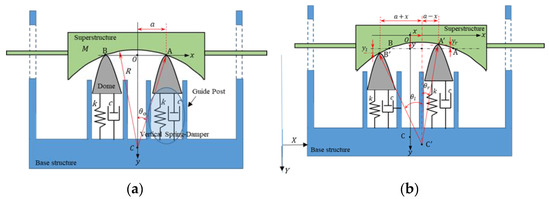
Figure 2.
Model of isolator system with double spring-dampers: (a) Geometry configuration. (b) Displacement relationship of motion.
When relative motion occurs between the base structure and superstructure, energy loss takes place, owing to the changes in the vertical potential energy, friction force, and viscous damping force. In Figure 2, point is the origin of the x–y coordinate system set in static equilibrium, in which the system sets the x-axis as the horizontal line through the contact points of the dome and superstructure, and the y-axis as the vertical line passing through the center of the base structure.
According to the geometric relationship in Figure 2b, the deflection of the right and left dampers is, respectively, expressed as follows:
where,
When the superstructure only moves horizontally, the vertical traveling velocity of two domes or contact points that are used to predict the damping force of the spring-viscous damper can be obtained by differentiating Equation (1) with respect to time, and the results are as follows:
In the design, is possible in the range of 0.5 or less. On the other hand, this value must be properly selected to ensure the maximum permissible moving displacement of the superstructure. So, the deflection of the spring with the displacement x varies in the isolation system with a = 0.2, owing to the fact that the range of −0.3 ≤ x ≤ 0.3 was numerically interpreted and is shown in Figure 3. Figure 4 illustrates that if the spring is not preloaded, the dome and superstructure may not make contact. Therefore, the spring must be properly preloaded, because the dome and superstructure must always be in contact for the vertical spring-viscous damper to function effectively.
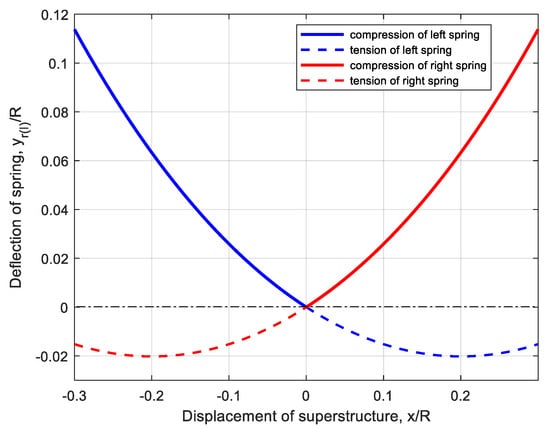
Figure 3.
Deflection of spring owing to relative displacement x of superstructure.
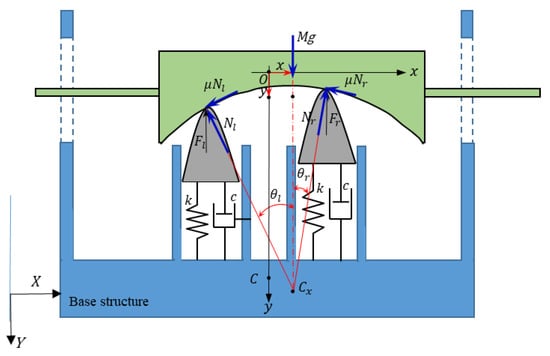
Figure 4.
Free-body diagram of isolation mounting system.
2.2. Derivation of Equations of Motion
As illustrated in Figure 4, the forces are the normal reactions acting on the concave surface of the dome, the frictional forces caused by the relative motion of the dome and concave surface, and the gravitational load of the superstructure. Moreover, and are the forces exerted by the spring-viscous damper and gravitational acceleration, respectively. To derive the motion equation, assume that the superstructure with mass is a rigid body, the dome is always in contact, and its mass is ignored or included in the mass of the superstructure. The superstructure moves within the range of curvature.
According to Figure 4, the equilibrium equations of force for the horizontal and vertical directions can be expressed as follows:
where ‘’ denotes the sign of the parameter in parentheses, and the vertical component of the normal forces acting on the contact surface serves as the vertical force of the spring-viscous damper. The relationship between these forces is expressed as follows:
The forces and acting on the spring-viscous damper are expressed as the sum of the spring and damping forces of each damper, as follows:
where is the dynamic vertical displacement and is the static deflection, which refers to the preload amount of the spring, and is expressed as:
The contact between the dome and superstructure can be confirmed by observing the sign of the following spring deflection equation, as expressed in Equation (6):
A positive sign in Equation (8) indicates that the spring is compressed, while a negative signifies tension. If the sign of Equation (8) is negative, as in the example in Figure 4, the dome and superstructure exist in the unstable contact state, because the spring cannot actually be tensioned. Thus, the contact between the dome and superstructure can be confirmed by observing the sign of Equation (8) during the numerical analysis.
Substituting Equation (5) into Equation (4) and dividing the result by the mass , the motion equations in the horizontal and vertical directions can, respectively, be obtained as follows:
In Equation (9), and are expressed as follows, respectively:
where is the linearized natural frequency of the vertical motion and is the damping ratio, which are respectively defined as follows:
2.3. Natural Frequency Relationships in a Linearized System
The equations of motion (9) are nonlinear, and include viscous damping and sliding friction. To understand the characteristics of this nonlinear motion, assuming that the displacements are small, the undamped linearized equations of motion can be obtained:
where . In this result, the natural frequency of the horizontal motion is expressed as:
The relationship between and is determined by the radius of the concave surface and installation distance ratio of the spring-damper, as indicated in Equation (13).
In order to numerically investigate the natural frequency variation in the x direction due to the influence of the design parameters, it was analyzed for R = 0.6 m and = 5 Hz and is shown in Figure 5. As illustrated in Figure 5a, the change in is insignificant in the area where is small, but when is large, increases rapidly, and it changes more steeply as α increases. It can be observed that, when α is large, the change in with respect to is large, resulting in the same effect as the small curvature radius . That is, a larger installation distance ratio () results in greater stiffness in the x direction.
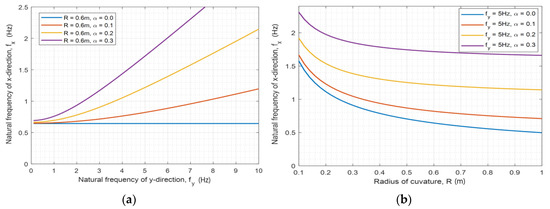
Figure 5.
Natural frequency of direction, : (a) when m. (b) Curvature radius when Hz.
If α = 0 in Equation (13), this is equivalent to using a single spring-damper. In this case, the natural frequency of the x direction becomes , independent of the vertical motion, which is the same as that of the rolling (sliding) type isolation system [18].
2.4. Occurrence Condition of Relative Motion
Relative motion of the superstructure and base structure occurs under conditions of excitation greater than friction in the equilibrium state. The equilibrium state of friction and inertia forces becomes and from Equations (1) and (2), and can be obtained from Equation (10). Substituting these values into Equation (9) yields the following equation for equilibrium with excitation:
Given the excitation of the sine wave function of the frequency and amplitude , the minimum excitation frequency causing the relative motion from Equation (14) can be obtained as follows:
In Equation (15), denotes the frequency at which relative motion begins to occur, so we refer to it as the starting frequency. Moreover, as is a function of the excitation amplitude and friction coefficient (friction force), the desired value can be adjusted by determining the friction coefficient in accordance with the excitation amplitude condition. Figure 6 illustrates the changes in according to the amplitude and any friction coefficients. These data are very useful for initial design.
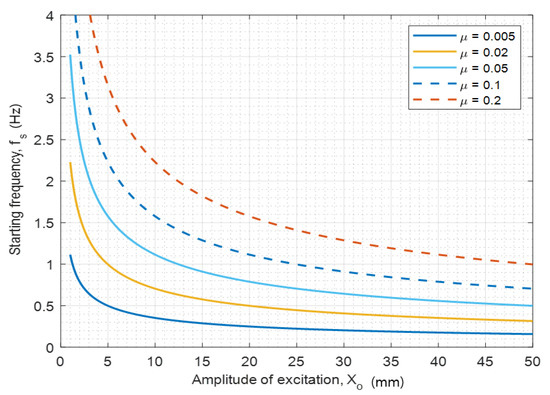
Figure 6.
Relationship between starting frequency and excitation amplitude for several friction coefficients.
3. Numerical Analyses
In actual situations, the model presented will be subjected to an applied load of approximately 20 kgf per mount unit, and several combinations of these models will be used for larger applied loads. In this section, the numerical simulation that was performed to investigate the vibration transfer ratio according to the design variables is discussed, and the vibration isolation characteristics for basic design application are identified and analyzed. Numerical simulations were performed using the fourth- and fifth-order Runge–Kutta methods, taking into account the nonlinear nature of the equations of motion (9). The range of design parameters examined is displayed in Table 1.

Table 1.
Main design parameters.
3.1. Contact Stability for Design Parameters
Depending on the vertical natural frequencies and design factors, such as the geometry and friction, breaking of the contact between the superstructure and dome of the spring-viscous damper may occur. That is, if an unstable contact state occurs in a real situation, a momentary collision occurs, and effective performance of the vibration isolation device cannot be achieved. Therefore, a preliminary review should be conducted to predict when unstable contact will occur during the design phase, and the vibration isolation device must be operated while maintaining a stable contact state at all times. This unstable contact state is determined by environmental factors (,) and design factors (, , , ). Therefore, these factors were analyzed by the numerical simulation, which can serve as very useful data early in the design. Figure 7 presents a stability chart indicating the stable contact area when the design parameters are 0.6 m, = 0.02, = 0.3, and = 0.1. As illustrated in Figure 7, a higher value results in a larger unstable contact area appearing. An increasing value means that the spring becomes stiffer. Therefore, it is advantageous to design the spring to be sufficiently soft.
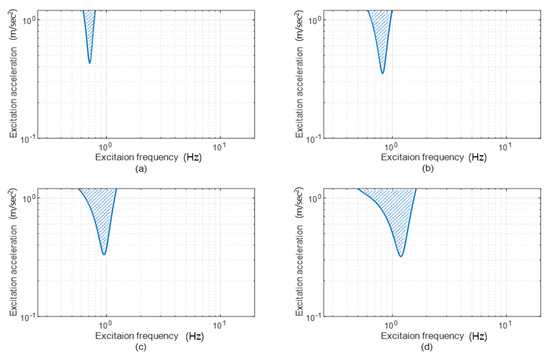
Figure 7.
Contact stability chart for excitation frequency and acceleration domains, when m, , , and ( : unstable contact zone,
  : stable contact zone): (a) Hz. (b) Hz. (c) Hz. (d) Hz.
: unstable contact zone, : stable contact zone): (a) Hz. (b) Hz. (c) Hz. (d) Hz.
However, unstable contact areas occurred around the natural frequencies of the x direction, where the amplitudes are greater than the static deflection. For example, in Figure 7d, resonance occurs near 0.8 Hz of the excitation frequency, because the natural frequency in the x direction is 0.8 Hz, as indicated in Figure 5 and Equation (13). Moreover, as the friction coefficient decreased, the unstable region increased, as illustrated in Figure 8, and as the friction coefficient increased, the unstable region decreased. Figure 9 presents the changes in the unstable region with respect to the damping ratio: as the damping ratio increased, the stable region increased. The viscous damping coefficient or friction coefficient acts as damping of the system that controls the amplitude at resonance, thereby increasing the stable contact area.
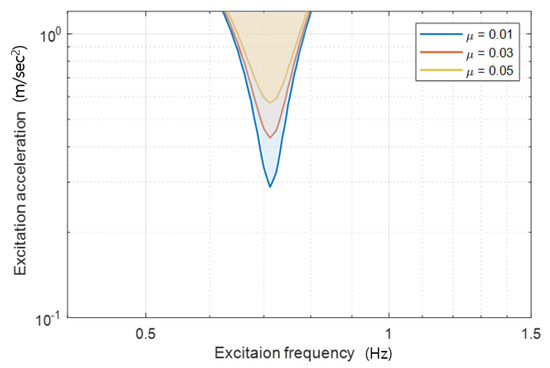
Figure 8.
Unstable contact region change due to friction coefficient when m, , and .
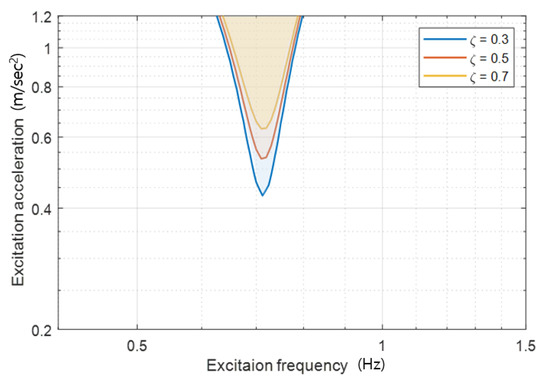
Figure 9.
Unstable contact region change owing to damping ratio when m, , and .
This analysis reveals under which design parameter conditions unstable contact occurs. Therefore, the design parameters can be determined and reflected in the design so that they are always in stable contact.
3.2. Steady-State Response for Horizontal Excitation
To investigate the response characteristics of seismic and vibration isolators with spring-viscous dampers, we analyzed the steady-state response of the superstructure when a horizontal sine wave disturbance occurs in the base structure. This disturbed displacement of the base structure can be expressed as , where and are the excitation amplitude and frequency, respectively. Figure 10 illustrates the steady-state responses of the isolation device to the horizontal excitation at certain specific frequencies with an amplitude mm, where the design parameters were Hz, , , m, and . Figure 10a indicates that when the excitation frequency was 0.55 Hz, the horizontal excitation and absolute displacement of the superstructure were the same. That is, horizontal relative displacement of the superstructure does not occur with respect to the horizontal vibration, which means that the superstructure does not slip against the dome. As the horizontal excitation force was less than the horizontal friction force, it can be observed that no sliding occurred, and the superstructure moved with the same displacement as the horizontal excitation displacement, and because there was no relative movement, no vertical displacement occurred. The response at an excitation frequency of 0.82 Hz is illustrated in Figure 10b. As indicated in Equation (14) and Figure 7, when m, , and Hz, the response in Figure 10b is resonance, because is 0.82 Hz. The steady-state response was approximately 1.8-times larger than the excitation amplitude. Owing to the nonlinear effect, the horizontal response exhibited harmonics, which were thrice the excitation frequency, while the vertical response exhibited dominant harmonics, which were twice the excitation frequency. Figure 10c,d illustrate the steady-state response of the system to base excitation at 1 and 2 Hz, respectively. In the horizontal response of Figure 10c,d, harmonics that are three times the excitation frequency dominate, and in the horizontal response, harmonics that are twice the excitation frequency dominate. Furthermore, in the case of Figure 10, the sign of the spring deformation in Equation (8) is always observed to be positive, so that the spring remained compressed and the dome was always in contact with the superstructure.
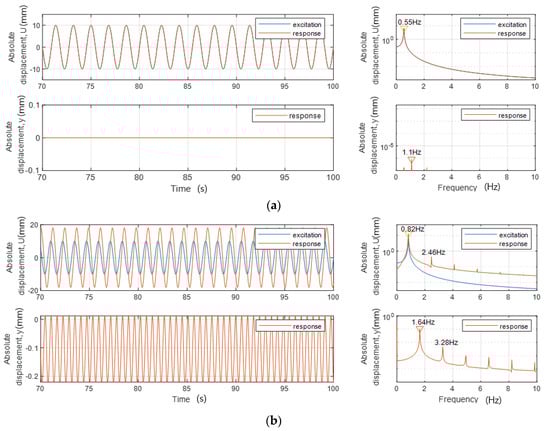
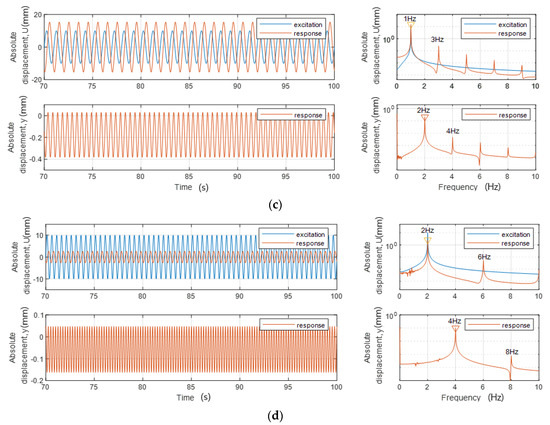
Figure 10.
Steady-state response of harmonic excitation under Hz, , , m, and : (a) Excitation conditions: mm and Hz. (b) Excitation conditions: mm and Hz. (c) Excitation conditions: mm and Hz. (d) Excitation conditions: mm and Hz.
Figure 11 presents a case in which only the amplitude of the excitation was changed to 20 mm under the conditions of Figure 10. Figure 11a indicates that no relative motion occurred until the excitation amplitude increased. As the excitation amplitude increased, relative movement is believed to have occurred because the excitation force became larger than the horizontal friction force. Figure 11b illustrates the response of the resonance state as indicated in Figure 10b, and a response that is 12.8-times larger than the excitation amplitude was exhibited. Figure 11c illustrates the deformation of the spring-viscous damper spring under the conditions of Figure 11b. As indicated in Figure 11c, the springs on the left and right were deformed alternately around the static deflection in Equation (11). Therefore, as indicated in Equation (8), it can be observed from Figure 11c that the spring was tensioned at approximately 12 mm (the negative sign of deflection). This means that the dome and superstructure were not in contact. In Figure 11b, the excitation amplitude is 20 mm and the excitation frequency is 0.82 Hz; thus, the maximum acceleration is 0.53 m/s2. The projection of these values in Figure 7 reveals that they lie in the unstable contact area. The occurrence of unstable contact can also be observed in Figure 7. If the vibration isolator is designed to be capable of applying an additional preload in addition to the static deflection, it is considered that the problem of contact stability can be solved to a certain extent.
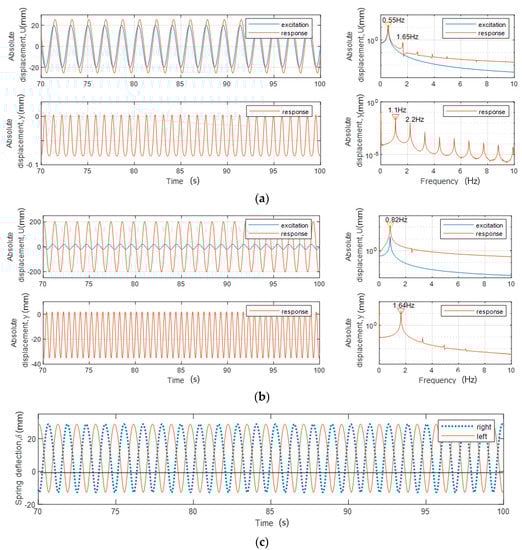
Figure 11.
Steady-state response and spring deflection under Hz, , , m, and : (a) Excitation conditions: mm and Hz. (b) Excitation conditions: mm and Hz. (c) Spring deflection: mm and Hz.
3.3. Displacement Transfer Ratio for Horizontal Excitation
This section analyzes the characteristics of the vibration isolation system by calculating the displacement transfer ratio during the steady-state response, while maintaining the contact state. As illustrated in Figure 7, unstable contact does not occur when the excitation acceleration or amplitude is small, so the analysis of was performed with an excitation amplitude mm.
Figure 12 illustrates the values of the horizontal and vertical motions for various friction coefficients. The results obtained were for a seismic isolator with Hz, = 0.6 m, and , where was 0.82 Hz for this device, according to Equation (13). In the case of the friction coefficient of in Figure 12a, relative motion did not occur, as until the excitation frequency reached 0.51 Hz, following which relative motion occurred. Moreover, resonance appeared at 0.82 Hz, and it is represented as a frequency response function of the one-degree-of-freedom system, where at times the resonance frequency. For frequency ranges greater than 1.16 Hz, was less than 1, and it decreased as the excitation frequency increased. In Figure 12b, which presents the vertical transfer ratio with the same friction coefficient, does not appear because no horizontal relative motion occurred until 0.51 Hz. However, as horizontal relative motion occurred in the frequency range greater than 0.51 Hz, is displayed in this case. The vertical value also reached its maximum at of 0.82 Hz with the maximum horizontal .
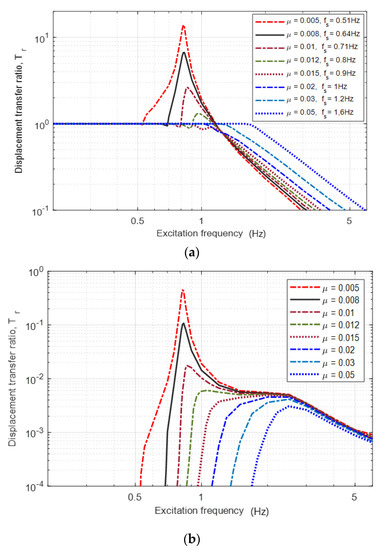
Figure 12.
Displacement transfer ratio of peak–peak value of the steady-state response to that of the excitation displacement for friction coefficient , when Hz, m, , , and mm: (a) Horizontal direction (peak–peak value of versus that of ). (b) Vertical direction (peak–peak value of versus that of ).
In Figure 12, where the coefficients of friction were 0.008 to 0.05, it can be observed that as the friction coefficient increased, the excitation frequency at which the relative motion began also increased. This means that as the frictional force increases, the excitation force must also increase to induce relative motion. The starting frequencies obtained from Equation (14) are displayed in Figure 12a.
Furthermore, in the cases with a friction coefficient of 0.008 to 0.015, an unusual phenomenon was observed in which was slightly less than 1 at an excitation frequency slightly above . This is owing to the small relative motion resulting from slight sliding of the superstructure, as well as the phase difference between the relative motion and excitation. In cases with a friction coefficient of approximately 0.008 to 0.012, a jump phenomenon could be observed, whereby was suddenly increased. As the excitation frequency increased, decreased to slightly less than 1, following which the relative motion rapidly became active, and the jump of occurred at a specific frequency. The jump frequencies for = 0.008, 0.01, and 0.012 were 0.69, 0.79, and 0.9 Hz, respectively. This jump phenomenon is similar to that mentioned in the study of an RIS with a position restoring device [18].
In Figure 12a, when is 0.51 Hz (μ = 0.005), the maximum is 14 at 0.82 Hz. However, for of 0.64, 0.71, and 0.8 Hz, the maximum decreases rapidly to 6.68, 2.64, and 1.3, respectively, as the magnitude approaches . This is because the frictional force interferes with the relative motion to suppress the resonance. In cases where was between 0.9 and 1.6 Hz, which is greater than the natural frequency, the maximum was less than 1. Therefore, as approaches , the maximum decreases drastically. When is larger than , the maximum becomes less than or equal to 1, but when is greater than √2 times the natural frequency, increases relatively.
Figure 13, Figure 14 and Figure 15 illustrate the values for the design parameters of , α, and ζ, respectively. As the excitation amplitude and friction coefficient μ were 5 mm and 0.01, respectively, the values were all equal to 0.71 Hz from Equation (15) or Figure 6, regardless of . Thus, did not change until the excitation frequency reaches 0.71 Hz, as indicated in Figure 13, Figure 14 and Figure 15.
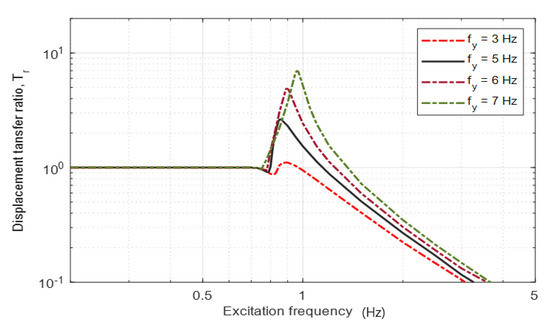
Figure 13.
Displacement transfer ratio of horizontal direction when m, , , , and mm.
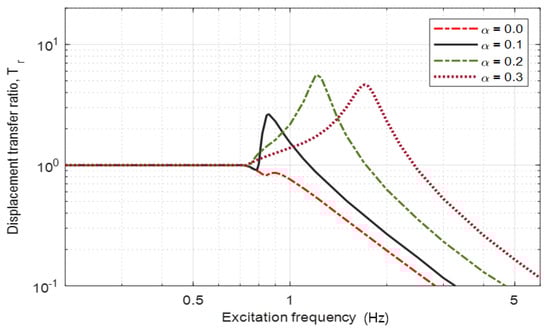
Figure 14.
Displacement transfer ratio of horizontal direction when , m, , , and mm.
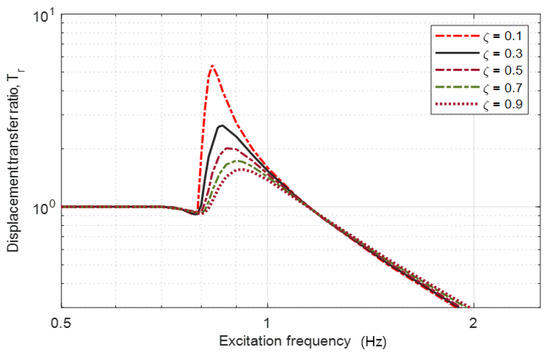
Figure 15.
Displacement transfer ratio of horizontal direction when , m, , and mm.
Figure 13 illustrates when was 3, 5, 6, and 7 Hz and was 0.72, 0.82, 0.89, and 0.96 Hz from Equation (13) or Figure 5, respectively. In the case of = 3 Hz, because was 0.71 Hz, which is almost equal to the natural frequency 0.72 Hz, the resonance was suppressed and the maximum was 1.1, which is slightly larger than 1. However, as indicated in Figure 13, in the other cases, the maximum also increased because the difference between and increased.
Figure 14 illustrates the values for various values. When = 0, that is, a single-column damper, was 0.64 Hz, which is less than , so is less than or equal to 1. If = 0.1 ( = 0.82 Hz), the relative motion was suppressed up to of 0.71 Hz, following which a jump occurred at 0.79 Hz. In the case of = 0.2 ( = 1.27 Hz) and α = 0.3 (= 1.72 Hz), was substantially higher than , which has little effect on the suppression of after 0.71 Hz. Furthermore, the maximum was smaller in the case of = 0.3 than in the case of = 0.2. This is because a larger results in a larger in Equation (2), so that the lateral reaction force acting on the concave surface of the superstructure prevents horizontal movement. Figure 15 illustrates the values with the changes in the damping ratio. In this case, also remained unchanged, while was the same as that of the general viscous damping system. The resonance control of this vibration isolator enables two energy dissipation factors (friction and viscous attenuation) to be used simultaneously.
3.4. Response Characteristics for Vertical Excitation
The vibration isolator in this study had the structural characteristic of the superstructure moving in the horizontal and vertical directions; therefore, it could exhibit vibration isolation performance in both directions. Thus, we considered the response characteristics for the vertical excitation. As can be observed in Figure 2, the device structure was symmetrical, so no horizontal movement occurred when only vertical excitation was applied. Therefore, from Equation (9), the motion equation for vertical excitation can be expressed as follows:
where Equation (16) is the typical motion equation of the base excitation model [39]. Therefore, if the excitation is vertical in the sinusoidal function, the displacement transfer ratio is:
where and is the excitation frequency.
Thus, the principle of Equation (17) can be applied to protect the superstructure from vertical excitation.
4. System Response for El Centro Earthquake
This section evaluates the proposed isolation system using data of the El Centro earthquake. Firstly, for the design parameter settings, the two seismic signals and superimposed power spectral densities of the stable region were verified, as illustrated in Figure 16. As indicated in the figure, it was recommended to select a design parameter below 5 Hz, because the excitation force at 10 Hz overlapped with the unstable region, while at = 7 Hz, it was in the stable region but close to the boundary. Therefore, in this study, = 3 Hz was selected to ensure sufficient stability.
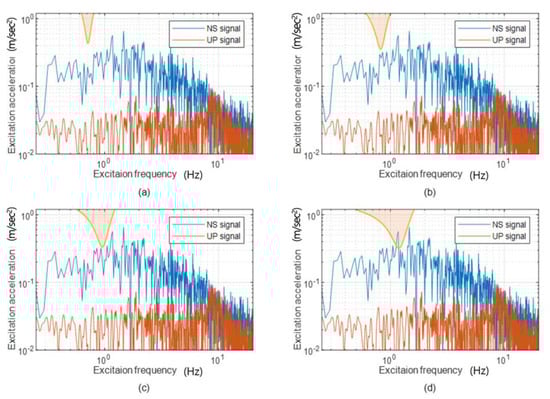
Figure 16.
Overlaps of contact stability charts of Figure 9 and power spectral density of two El Centro earthquake waveforms (NS signal and UP signal): (a) Hz. (b) Hz. (c) Hz. (d) Hz.
Figure 17 illustrates the horizontal and vertical responses of a device with the design parameters in Figure 7a, when the NS (North–South components) signal and UP (vertical components) signal of the El Centro earthquake (http://www.vibrationdata.com/elcentro.htm) were excited horizontally and vertically, respectively [40]. Moreover, Table 2 compares the maximum response values for the device of Figure 7b. The maximum acceleration response of the isolator (I) was reduced by 45% (▼0.15 g) and 40% (▼0.091 g) in the horizontal and vertical directions, respectively, compared to the maximum acceleration input. In isolator (II), it was decreased by 40% (▼0.131 g) and 17% (▼0.039 g), respectively. These results can be further improved by changing the damping ratio or friction coefficient. Therefore, it can be concluded that the proposed device is effective for excitation in both the horizontal and vertical directions.
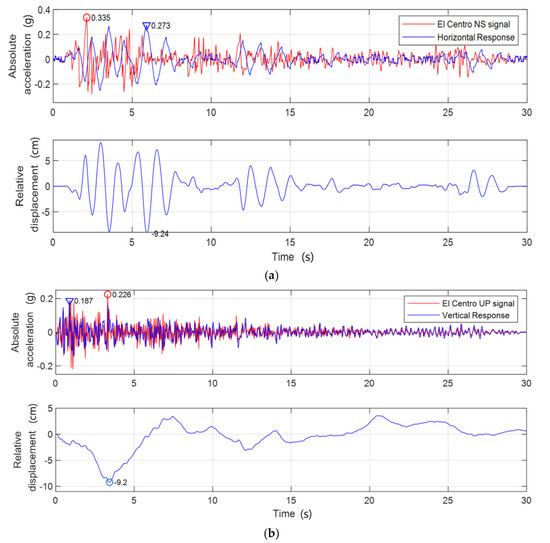
Figure 17.
System response to two directional earthquake excitations in case of Hz, , , m, and : (a) Horizontal response. (b) Vertical response.
Table 2.
Comparison of maximum vibration response values.
Also, it was compared with a rolling bearing isolation system (RIS) without a vertical spring damper. Figure 18 compares the horizontal response of the RIS and the isolator (I) due to horizontal excitation of an El Centro horizontal earthquake signal. The design parameters of RIS were 0.6 m, a natural frequency of 0.66 Hz, and rolling resistance coefficient 0.004, and the design parameters of the isolator (I) were = 3 Hz, α = 0.1, μ = 0.02, 0.6 m, and ζ = 0.3. The maximum acceleration of RIS decreased 0.101 g (30%) to 0.233 g, while the isolator (I) decreased 0.15 g (45%) to 0.184 g. Even when only horizontal excitation works, the isolator (I) with vertical damper performs better than the RIS.
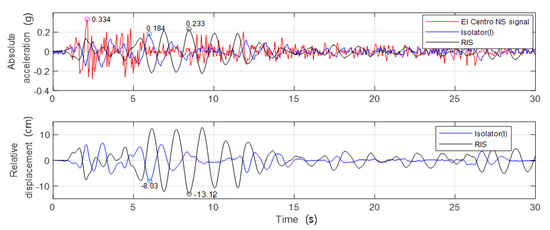
Figure 18.
Comparison of responses of RIS and the proposed system to horizontal seismic excitation.
5. Conclusions
We studied a two-degrees-of-freedom isolation system, considering the geometrical nonlinearity and the coupling between the vertical and horizontal vibrations; the system was configured to slide on a dome or ball attached to a column damper under a concave plate. The following conclusions can be drawn:
- (1)
- In the case of the RIS, vertical vibration caused by horizontal vibration occurs, and the control method for large vertical vibration is limited. However, the structure proposed in this study demonstrates effective control of the horizontal and vertical vibrations;
- (2)
- The starting frequency at which relative motion occurs was obtained as a function of the friction coefficient and excitation amplitude. This value increases as the friction coefficient increases and the excitation amplitude decreases. This is the primary design parameter for controlling the relative motion because the displacement transfer ratio can be controlled by the relationship between the natural frequency and the system;
- (3)
- The contact stability chart was obtained in the frequency and acceleration amplitude domains. As the unstable region of the stability chart appears near the resonance frequency where the vibration response is large, the region decreases as the friction coefficient and viscosity coefficient increase. The stability chart can be used to select design parameters to ensure stable contact in the isolator design;
- (4)
- The steady-state response to horizontal excitation indicated that harmonic components of n and 2n orders, which are nonlinear, appear in the vertical and horizontal responses;
- (5)
- The displacement transfer ratios were obtained to perceive the characteristics of the isolation system against the design parameters. The relative motion is locked until the excitation frequency is equal to , and a jump occurs as the excitation frequency increases. Furthermore, as approaches the natural frequency, the transfer ratio decreases significantly, and when the frequency is larger than the natural frequency, it becomes 1 or less. Resonance can be avoided or controlled by setting the design factors of the friction and viscous damping coefficients, vertical natural frequency, and interval between dampers;
- (6)
- Considering the above, the design factors were set using actual earthquake data, and effective vertical and horizontal vibration reduction was achieved by the numerical analysis. Therefore, if the spring stiffness and the number of insulators are set properly, the application of the isolation system presented in this study can be applied from light to heavy equipment.
For the isolation proposed in this study, vibration control characteristics exhibited by the design parameters, such as the vertical design natural frequency, damping coefficient, friction coefficient, post spacing, and concave plate curvature, were presented. Setting and predicting the design factors was made possible in virtual space. Future work will investigate factors such the various concave plate curvatures and shapes, and will build a prototype with a detailed design. The numerical results of the isolator will be experimentally performed and verified using the prototype.
Author Contributions
All authors discussed and agreed on the idea, made equal scientific contributions, and participated in the writing. All authors have read and approved the final manuscript.
Funding
This research was funded by Korea Institute of Energy Technology Evaluation and Planning (KETEP), the Ministry of Trade, Industry & Energy (MOTIE), the Korea Electric Power Corporation, and Korea Western Power Co. Ltd. under grant number 20172020108700.
Conflicts of Interest
The authors declare no conflicts of interest.
Nomenclature
| A, B | contact point of the dome and superstructure |
| C | center of curvature of the concave surface |
| mass of the superstructure | |
| radius of the concave surface of the superstructure | |
| friction coefficient between the superstructure and dome | |
| spring constant of the spring damper | |
| viscous damping coefficient | |
| half space between two spring dampers | |
| horizontal relative displacement | |
| vertical displacement | |
| horizontal excitation displacement | |
| vertical excitation displacement | |
| horizontal absolute displacement | |
| The angle between the vertical line and the line passing through the contact point and the center of curvature in static equilibrium. | |
| The angle between the vertical line and the line passing through the contact point and the center of curvature in dynamic equilibrium | |
| displacement of the right (left) dome due to horizontal relative displacement | |
| installation distance ratio, or ratio of the half space between two post-dampers to the radius of the concave surface | |
| natural frequency of y-direction, or vertical natural frequency | |
| natural frequency of x-direction, or horizontal natural frequency | |
| gravitational acceleration | |
| right (left) normal reaction force | |
| force acting on the right (left) spring-viscous damper | |
| static deflection | |
| total deflection of spring, or total deflection of spring-viscous damper | |
| mass normalized force acting on the right (left) spring-viscous damper | |
| angular natural frequency of y-direction, or vertical natural frequency | |
| viscous damping ratio | |
| starting frequency, or frequency at which relative motion starts to occur | |
| amplitude of excitation | |
| excitation frequency | |
| displacement transfer ratio, or ratio of peak-peak value of the steady-state response to that of the excitation displacement |
References
- Esfeh, M.A.; Caldera, H.J.; Heshami, S.; Moshahedi, N.; Wirasinghe, S.C. The severity of earthquake events-statistical analysis and classfication. Int. J. Urban Sci. 2016, 20, 4–24. [Google Scholar] [CrossRef]
- Tsai, C.S. Advanced base isolation systems for light weight equipments. In Earthquake Resistant Structures–Design, Assessment and Rehabilitation; In-Tech: Guangdong, China, 2012; pp. 79–130. [Google Scholar]
- Patil, S.J.; Reddy, G.R. State Of Art Review - Base Isolation Systems For Structures. Int. J. Emerg. Technol. Adv. Eng. 2012, 2, 438–453. [Google Scholar]
- Girish, M.; Pranesh, M. Sliding Isolation Systems: State-of-the-Art Review. IOSR-JMCE 2013, 6, 30–35. [Google Scholar]
- Hosseini, M.; Kangarloo, K. Introducing Orthogonal Roller Pairs as an effective isolating system for low rise buildings. In Seismic Control System; WIT Press: London, UK, 2013; pp. 65–76. [Google Scholar]
- FukahoriQueen, Y. Use of natural rubber (NR) for vibration isolation and earthquake protection of structures. Chem. Manuf. Appl. Nat. Rubber 2014, 1, 371–381. [Google Scholar] [CrossRef]
- Lu, Z.; Chen, X.Y.; Zhou, Y. An equivalent method for optimization of particle tuned mass damper based on experimental parametric study. J. Sound Vib. 2018, 419, 571–584. [Google Scholar] [CrossRef]
- Dai, K.S.; Wang, J.Z.; Mao, R.F.; Lu, Z.; Chen, S.E. Experimental investigation on dynamic characterization and seismic control performance of a TLPD system. Struct. Des. Tall Spec. Build. 2016, 26, e1350. [Google Scholar] [CrossRef]
- Lu, Z.; Chen, X.Y.; Lu, X.L.; Yang, Z. Shaking table test and numerical simulation of an RC frame-core tube structure for earthquake-induced collapse. Earthq. Eng. Struct. Dyn. 2016, 45, 1537–1556. [Google Scholar] [CrossRef]
- Lin, T.W.; Chern, C.C.; Hone, C.C. Experimental study of base isolation by free rolling rods. Earthq. Eng. Struct. Dyn. 1995, 24, 1645–1650. [Google Scholar] [CrossRef]
- Lin, T.W.; Hone, C.C. Base isolation by free rolling rods under basement. Earthq. Eng. Struct. Dyn. 1993, 22, 261–273. [Google Scholar] [CrossRef]
- Mosleh, A.; Rodrigues, H.; Varum, H.; Costa, A.; Arêde, A. Seismic behavior of RC building structures designed according to current codes. Structures 2016, 7, 1–13. [Google Scholar] [CrossRef]
- Mosleh, A.; Varum, H.; Jara, J.; Razzaghi, M.S. Development of fragility curves for RC bridges subjected to reverse and strike-slip seismic sources. Eng. Struct. 2016, 11, 517–538. [Google Scholar] [CrossRef]
- Tsai, M.H.; Wu, S.Y.; Chang, K.C.; Lee, G.C. Shaking table tests of a scale bridge model with rolling-type seismic isolation bearings. Eng. Struct. 2007, 29, 694–704. [Google Scholar] [CrossRef]
- Krishnamoorthy, A. Seismic Control of Continuous Bridges Using Variable Radius Friction Pendulum Systems and Viscous Fluid Dampers. Int. J. Acoust. Vib. 2015, 20, 24–60. [Google Scholar] [CrossRef]
- Krishnamoorthy, A. Variable curvature pendulum isolator and viscous fluid damper for seismic isolation of structures. Int. J. Vib. Control 2011, 17, 1779–1790. [Google Scholar] [CrossRef]
- Krishnamoorthy, A. Seismic isolation of bridges using variable frequency and variable friction pendulum isolator system. Struct. Eng. Int. 2010, 20, 178–184. [Google Scholar] [CrossRef]
- Hong, S.C.; Hur, D.-J. Dynamic Behavior of a Simple Rolling Seismic Isolator with a Position Restoring Device. Appl. Sci. 2018, 8, 1910. [Google Scholar] [CrossRef]
- Shaikhzadeh, A.A.; Karamodin, A. Effectiveness of sliding isolators with variable curvature in near-fault ground motions. Struct. Design Tall Spec. Build. 2016, 25, 278–296. [Google Scholar] [CrossRef]
- Harvey, P.S., Jr.; Gavin, H.P. The nonholonomic and chaotic nature of a rolling isolation system. J. Sound Vib. 2013, 332, 3535–3551. [Google Scholar] [CrossRef]
- Cross, R. Energy losses in a rolling ball. Eur. J. Phys. 2019, 40. [Google Scholar] [CrossRef]
- Sui, J.Y.; Gong, Y.W.; Liu, W.F. Research on a New Type of Rolling Ball Isolator. Adv. Mater. Res. 1929, 194–196, 1929–1932. [Google Scholar] [CrossRef]
- Guerreiro, L.; Azevedo, J.; Muhr, A. Seismic Tests and Numerical Modeling of a Rolling-ball Isolation System. J. Earthq. Eng. 2007, 11, 49–66. [Google Scholar] [CrossRef]
- Pranesh, M.; Sinha, R. VFPI: An isolation device for aseismic design. Earthq. Eng. Struct. Dyn. 2000, 29, 603–627. [Google Scholar] [CrossRef]
- Tsai, C.S.; Chiang, T.C.; Chen, B.J. Finite element formulations and theoretical study for variable curvature friction pendulum system. Eng. Struct. 2003, 25, 1719–1730. [Google Scholar] [CrossRef]
- Kelly, J.M.; Konstantinidis, D.A. Mechanics of Rubber Bearings for Seismic and Vibration Isolation; John Wiley & Sons, Ltd.: Hoboken, NJ, USA, 2011. [Google Scholar]
- Menga, N.; Bottiglione, F.; Carbone, G. The nonlinear dynamic behavior of a Rubber-Layer Roller Bearing (RLRB) for vibration isolation. J. Sound Vib. 2019, 463. [Google Scholar] [CrossRef]
- Martini, A.; Troncossi, M.; Vincenzi, N. Structural and elastodynamic analysis of rotary transfer machines by Finite Element model. J. Serb. Soc. Comput. Mech. 2017, 11, 1–16. [Google Scholar] [CrossRef]
- Martini, A.; Bellani, G.; Fragassa, C. Numerical assessment of a new hydro-pneumatic suspension system for motorcycles. Int. J. Automot. Mech. Eng. 2018, 15, 5308–5325. [Google Scholar] [CrossRef]
- Muhamad, F.I.; Kang, H.S.; Lee, K.Q.; Siow, C.L. Experimental analysis on variable stiffness and variable damping device. In Proceedings of the 2nd Multidisciplinary Conference on Mechanical Engineering, Skudai, Malaysia, 16 October 2017; pp. 269–277. [Google Scholar]
- Hu, Y.; Liu, L.; Rahimi, S. Seismic Vibration Control of 3D Steel Frames with Irregular Plans Using Eccentrically Placed MR Damper. Sustainability 2017, 9, 1255. [Google Scholar] [CrossRef]
- Shin, Z.; Cheng, Z.; Xiang, H. Seismic isolation foundations with effective attenuation zones. Int. J. Soil Dyn. Earthq. Eng. 2014, 57, 143–151. [Google Scholar]
- Castaldo, P.; Palazzo, B.; Vecchia, P.D. Seismic reliability of base-isolated structures with friction pendulum bearings. Eng. Struct. 2015, 95, 80–93. [Google Scholar] [CrossRef]
- Kanyilmaz, A.; Castiglioni, C.A. Reducing the seismic vulnerability of existing elevated silos by means of base isolation devices. Eng. Struct. 2017, 143, 477–497. [Google Scholar] [CrossRef]
- Kohjiya, S. Improving the sustainable development of natural rubber (NR). Chem. Manuf. Appl. Nat. Rubber 2014, 1, 385–394. [Google Scholar] [CrossRef]
- Wei, B.; Wang, P.; He, X.; Jiang, L. Seismic response of spring-damper-rolling systems with concave friction distribution. Earthq. Struct. 2016, 11, 25–43. [Google Scholar] [CrossRef]
- Wei, B.; Zhuo, Y.; Li, C.; Yang, M. Parameter Optimization of a Vertical Spring-Viscous Damper-Coulomb Friction System. Shock Vib. 2019, 2019. [Google Scholar] [CrossRef]
- Wei, B.; Wang, P.; He, X.; Jiang, L. The Impact of the Convex Friction Distribution on the Seismic Response of a Spring-friction Isolation System. KSCE J. Civ. Eng. 2018, 22, 1203–1213. [Google Scholar] [CrossRef]
- Inman, D.J. Engineering Vibration, 4th ed.; Pearson India: Bengaluru, India, 2013. [Google Scholar]
- Najar, B.A.; Najar, I.A. Comparative Seismic Analysis of EL Centro and Japan Earthquakes using Response Spectra Method. Int. J. Curr. Eng. Technol. 2016, 6, 1–6. [Google Scholar]


© 2020 by the authors. Licensee MDPI, Basel, Switzerland. This article is an open access article distributed under the terms and conditions of the Creative Commons Attribution (CC BY) license (http://creativecommons.org/licenses/by/4.0/).