Article

Investigation on Recycled Sawdust in Controlling Sulphate Attack in Cemented Clay

1
Department of Civil Engineering, Curtin University of Technology, Kent Street, Bentley, Perth, Western Australia 6102, Australia
2
Arup Australia, 61–73 Sturt Street, Suncorp Tower, Townsville, QLD 4810, Australia
3
General Office for Work and Maintenance (G.O.W.M), Ministry of Construction and Housing and Municipalities and Public Works, Tikrit, Iraq
*
Author to whom correspondence should be addressed.
Appl. Sci. 2020, 10(4), 1441; https://doi.org/10.3390/app10041441
Submission received: 19 December 2019 / Revised: 16 February 2020 / Accepted: 17 February 2020 / Published: 20 February 2020

Abstract

:
Application of sawdust in civil engineering projects, specifically those with geotechnical applications, has been the interest of many studies. This study focuses on exposure of soil samples treated with sawdust to MgSO4. This study was conducted in three stages. The first stage was compaction. In this stage, the compaction characteristics of each mixture were derived. The second stage was to run unconfined compressive strength (UCS) testing and report the UCS peaks relevant to each mixture. The third stage was microstructural examination (i.e., SEM) conducted on the chosen samples before and after sulphate exposure to highlight the reactions during exposure. The results of first stage (i.e., compaction tests) suggested that increasing sawdust content, the OMC (Optimum moisture content) decreased and MDD (Maximum dry density) decreased. In the second stage, the UCS (Unconfined compressive strength) testing was conducted on 640 samples [including reliability tests] and the outcome suggested that sawdust increased the resistance of samples against sulphate attack. In stage three, the micro analysis backed the main body results, suggesting that sawdust had a positive effect on helping to form a better connection between the particles and therefore more resistance noted.

1. Introduction

The application of recycled materials into soil and pavement system has been an interest of many researchers [1,2,3,4]. It has been reported that normally 50% of wooden logs turn into waste materials [5,6]. Whilst application of cement forms a very strong pozzolanic reaction, this is not the case with sawdust [7]. Application of sawdust in civil engineering has been the focus of many studies. Ahmed et al. [8] worked on adding sawdust to concrete mix in light and normal weight concrete. They summarized that sawdust can be a good alternative for fine-grain materials. A different study was conducted by Bruscato et al. [9] to address the application of sawdust in a broader action to help waste reduction. In addition to the above, another study suggested that replacing sand with 5% to 30% sawdust as fine aggregate in concrete produces the same mechanical properties as sand [10]. In another study by Uchechukwu and Elinwa [11], the strength of clay bricks was investigated by incorporating sawdust. The study supported the idea of water absorption increasing due to adding the sawdust. Whilst many studies showed effectiveness of the sawdust addition, some other studies have shown different results, where mechanical performance is reduced [12].
Application of sawdust in soils in terms of its settlement factors has been investigated in previous research [13]. In the previous study, the potential effect of sawdust on a slurry mixture of sand-bentonite was investigated, which showed sawdust to be a promising avenue to investigate further for geotechnical applications. In terms of strength changes of a soil specimen by adding sawdust, a study run by Jasim and Çetin [14] showed that undrained strength was increased by 41.437% by adding 3% of sawdust.
According to Kalipcilar et al. [15], the occurrence of sulphate in soils is mostly challenging for chemically treated soils. An external attack can happen due to sulphate reacting with the stabilizer in treated soil. Yi et al. [16] indicated that carbide slag-ground granulated blast furnace slag (CS-GGBS) stabilized soil helps to resist sulphate attack, and that opens an area for further investigation as to what other material can be sustainable and effective in adding resistance. As an example, Sriram, Karthick, Raja and Thyagaraj [17] investigated the effect of lime on the resistance of soil against sulphate attack. Chegenizadeh et al. [18] also investigated the sulphate attack on tyre-stabilised clay. Review of the previous studies conducted on effect of sawdust addition on mechanical properties of the soil showed that this material has been effective in numerous occasions; however, some other studies showed that they have not been always effective, and there is a need to addition of cementitious agent along with the sawdust. This study aims to investigate the effect of sawdust on mechanical behaviour of the soil when exposed to sulphate.

2. Materials

The soil in this study was categorized as bentonite clay with Atterberg liquid limit (LL) of 455%, a plastic limit (PL) of 387%. It is good to mention the Atterberg test has been repeated for 5 times to address repeatability of the results. Figure 1 presents the particle size distribution (PSD) of the employed bentonite clay and the used sawdust. The sawdust (SD) used for this study was sourced from Western Australian Greenbushes in Manjimup and was untreated Jarrah sawdust. Non-treated Plantation Softwood has many applications in industry such as bedding and packing. The apparent density of the dried sawdust was measured as 239 kg/m3. The water absorption rate for SD was 220% with the activation energy of 87 ± 3 kJ mol−1. Figure 2a represents a scanning electron microscopic (SEM) illustration of the used bentonite and Figure 2b represents the SEM for the used Portland cement (PC). Table 1 and Table 2 also show the chemical characteristics of the used Portland cement (PC) and bentonite, respectively. The PC was sourced from Australia Cement. This study carried on from a research project in Curtin University [19], in continuation of our previous work [18,20].

3. Sample Preparation and Methodology

3.1. Sample Preparation

The unconfined compressive strength (UCS) tests were conducted on the samples when the compaction curves were obtained for each mixture. The compaction tests were standard proctor testing and have been done in three layers in standard mould as per ASTM D698-07 standard [23] (i.e., 50 mm × 100 mm). The unconfined compressive testing was conducted as per ASTM D2166 [24]. The samples were prepared in three layers and compacted to the target density. The sample then cured in plastic in accordance to our plan of 7, 14, 28 and 90 days. The addition of cement was in accordance with Cabalar [25]. Table 3 presents the testing plan. The sample preparation in each stage was repeated for 5 times to ensure acquiring the right values. The sample preparation room was isolated and had constant temperature of 22 °C. It should be noted that all soil samples underwent a hand-sifted process to be assured of clean soil as per ASTM standard. In total, 50 compaction mixes were prepared as well as 640 UCS testing samples including repeat tests under exposed and non-exposed conditions.

3.2. Testing Procedure

As outlined earlier, in order to evaluate the sulphate exposure effect on the soil samples, untreated and treated samples with sawdust were prepared. This enabled proper comparison before and after applying SD treatment. The soil specimens were exposed to sulphate concentration of 42.2 g/L, as was used by Chegenizadeh et al. [18] and Yi et al. [16]. All the specimens were submerged to the sulphate solution for 5 h in a similar condition. Figure 3 shows the specimens after sulphate attack. In order to perform the above-mentioned, compaction test, UCS tests and micro analytical observation were carried.

3.2.1. Compaction Test

Standard compaction was carried out in accordance with ASTM D698 [21]. The test objectives were to acquire the values of OMC (Optimum Moisture Content) and MDD (Maximum Dry Density) for each of the mixes. The mixes were checked visually to be sure of homogeneous nature. Then, samples were sealed in a bag to stop evaporation of moisture content. The prepared mixes were placed into mould in 3 layers and compacted with a hammer of 2.5 kg and 25 below.

3.2.2. UCS Test

The UCS samples were prepared with controlled density approach. The results obtained from stage 1 (i.e., compaction) were then used to prepare UCS samples. The test was conducted in accordance with ASTM 2166 [22]. While the utmost care was taken to achieve those values in practical laboratory conditions, after checking, OMC was reported ±0.25% and MDD was reported ±0.5%. In order to eliminate the size effect, the ratio of height to diameter kept at 2. The diameter of samples were 50 mm and the height was 100 mm. The effect of sulphate attack on the sample was considered by running UCS tests for mixtures before and after exposure to sulphate. The sulphate attack solution was prepared in our laboratory by sulphate concentration of 42.2 g/L which forms MgSO4. The effect of adding SD on the improvement of qu was evaluated by using Equation (1). This equation has been widely used in previous work to assess the mechanical effects of mixing soil with different agents. [18]
I M P ( % ) = q u , S D q u , P C q u , P C × 100 %
where IMP = percentage of the improvement; qu, SD = peak UCS value for SD included mixture; and qu, PC = peak UCS value for the PC treated mixture before addition of the SD.

3.2.3. Micro Examination

Once the UCS finalised, the next step was to get representative samples and take them to material laboratory. The objective of this observation was to evaluate the particle sizes, interaction and more importantly bonding information of mixes.

4. Results and Discussion

4.1. Evaluation of Compaction Tests

The results of compaction tests can be found in Figure 4 and Figure 5. The compaction results followed the same trend as previous literature of adding material below the specific gravity of soil. As can be seen from the results, the MDD decreased by increasing the sawdust content. This can be attributed to the fact that soil particles were replaced by a lower specific gravity (SG). On the other hand, the OMC was reported to decrease as well. This trend is attributed to the reduction in contact surface in accordance with explanations provided by current literature [3].

4.2. Evaluation of UCS Tests

4.2.1. Effect of Sawdust on Sulphate Resistance for 3 Days Curing

The effect of adding SD on the UCS peak (qu) values after 3 days curing time for MgSO4 exposed and benchmark samples was shown in Figure 6. qu values for 3% PC treated benchmark samples increased from 180 to 401 kPa when SD content increased from 3% to 15%. Samples treated with 5% PC and 7% PC showed a similar increasing trend in a range of 296 ≤ qu ≤ 473 kPa and 352 ≤ qu ≤ 574 kPa, respectively [see Figure 6a–c]. For samples exposed to the MgSO4, the same increasing trend was observed but in a lower range. For example, specimens that treated with 3% PC and mixed with different SD content 3% to 15% showed increases in the qu values from 20 kPa to 157 kPa. The values of qu for SD treated benchmark samples increased with increasing PC content. qu values increased from 73 to 223.5 kPa and from 102 kPa to 340 kPa when PC increased to 5% and 7%, respectively [see Figure 6b,c]. The observed results can be attributed to production of the hydration and pozzolanic products that increases the bonds strength amongst soil and PC particles. Hence, this causes a higher unconfined compressive strength for the samples with higher PC content.
Table 4 and Table 5 present the effect of SD content on the improvement of USC values for PC treated specimens at 3 days curing time for benchmark and exposed specimens, respectively. Table 4 indicates that the qu values of 3% PC treated samples increased from 241 kPa for 3% SD to 401 kPa for 15% SD inclusion. The same trend was observed with 5% cement and 7%, which showed increases from 322 to 473 and from 391 to 574 kPa, respectively. Table 5 presents the IMP index and actual UCS values after sample exposed to sulphate. As can be seen, the samples all showed improvement in resistance from vanished condition for non-treated samples to a positive UCS strength. It should be noted that IMP in Table 5 is not calculated as non-treated samples all dissolved quickly after exposed to sulphate. The calcium silicate hydrate (CSH) is one of the main hydration products that affected when the specimens exposed to the sulphate. In fact, the existing sulphate exhausts the formed calcium in CSH. This process is known as decalcification, which is the main reason for the strength reduction.
The results present improvement in the values of UCS by adding in SD content linearly. It is worthy of mentioning, as can be seen in the results for 3 days of curing, the sample without any sawdust was easily dissipated once exposed to sulphate [18]. This may be attributed to weak bonding formation compared to actual sulphate attack to the sample [18]. Once the sawdust takes effect, higher levels of sawdust incorporated show better resistance to attack. Comparing the amount of cement addition from 3% to 7% also confirmed that having more cement in the sample makes the exposure of sulphate become less effective. That means better resistance was observed with higher percentage of cement.

4.2.2. Effect of Sawdust on Sulphate Resistance for 7 Days Curing

Sulphate resistance of specimens prepared by adding SD to the specimens treated with 3%, 5% and 7% PC after 7 days curing time is shown in Figure 7. It is apparent from this figure that all samples showed an increasing trend in UCS with increasing SD content. For example, the values of UCS of 3% PC treated specimens increased from 710 kPa to 751 kPa with increasing SD content from 3% to 15%, respectively. Specimens treated with 5% and 7% PC showed the same increasing trend. UCS values increased from 715 kPa to 947.16 kPa and from 1050 kPa to 1391 kPa when PC content increased to 5% and 7%, respectively. Specimens exposed to the MgSO4 showed the same increasing trend in UCS values with increasing SD content, but with lower range compared to benchmark samples. From the data in Figure 7a, the UCS values of 3% PC treated specimens increased from 150 to 401 kPa with increasing SD content from 3% to 15%. The increasing trend was lower, at a range of 223.37 ≤ UCS ≤ 485.96P kPa and 480 ≤ UCS ≤ 810 kPa for 5% and 7% PC treated specimens as shown in Figure 7a,b. Table 6 and Table 7 present the effect of SD content on the improvement of USC values for PC treated specimens at 7 days curing time for benchmark and exposed specimens, respectively.
To summarise, the 7 days curing behaviour, for 3% of cement, the samples showed firstly increases up to 3% of sawdust and right after the behaviour was slightly increased with increase in cement percentage from 3% to 7%; then again, the increase in UCS values could be attributed to hydration reaction of the mixture. Once again, the sample without sawdust in 7 days of curing dissolved fully or had very low UCS value in sulphate attack.

4.2.3. Effect of Sawdust on Sulphate Resistance for 28 Days Curing

Figure 8a–c shows the influence of SD effect on the soil resistance against exposure to sulphate after 28 days. In Figure 8 there is a clear trend of increasing in UCS of benchmark specimens with a range of 962 ≤ UCS ≤ 1407 kPa, 1194 ≤ UCS ≤ 1807 kPa and 1489 ≤ UCS ≤ 2159 kPa for 3%, 5% and 7% PC treated specimens when 3% to 15% SD was added to the specimens. The increasing trend in UCS of SD treated specimens was observed even after exposure to the MgSO4. For example, UCS of 3% PC treated samples increased from 145 to 520 kPa with increasing SD content from 3% to 15%. The same increasing trend from 649 to 1275 kPa and from 1105 to 1812 kPa was observed for 5% and 7% PC treated specimens respectively.
The effect of mixing cemented samples with different SD contents on the improvement of UCS for benchmark and exposed samples cured at 28 days is shown in Table 8 and Table 9. As illustrated in Table 8, adding 3% to 15% SD increased the improvement of benchmark 3% PC treated specimens. As shown in Table 9, the improvement of 3% PC treated samples continued at an increasing rate of 21% to 333% after exposure to the MgSO4. However, the improvement was 124.56% ≤ IMP ≤ 341% and 170% ≤ IMP ≤ 343% for 5% and 7% PC treated specimens.
For 28 days curing, the samples for 3% cement without sawdust vanished while exposed to sulphate, and the samples with higher sawdust generally showed better performance in terms of resistance against sulphate. Once the cement percentage increased, we could see better results with respect to sulphate exposure resistance.

4.2.4. Effect of Sawdust on Sulphate Resistance for 90 Days Curing

The effect of SD content on UCS of PC treated specimens after 90 days curing time is shown Figure 9. From the data in Figure 9a, it is apparent that the UCS value of the benchmark specimens was enhanced with increasing curing time. For example, UCS values for 3%, 5% and 7% PC treated specimens increased from 1297 to 1925 kPa, from 1680 to 2240 kPa and from 1906 to 2450 kPa when 3% to 15% SD was added to specimens. MgSO4 exposed specimens exhibited the same increasing trend for qu values.
Table 10 presents the UCS values before exposure to sulphate. The results clearly followed the same trend as the previous curing time (i.e., 3, 7, 28 days). The results showed that with increase in SD content, the UCS values increased accordingly. Table 11 also presents the values of UCS and IMP% after exposure to sulphate with inclusion of different SD%. The results also support that the IMP% increased with increasing in both cement percentage and SD percentage.
Generally, the samples for 90 days more show the effect of sulphate resistance with higher percentage of cement. Once again, samples of 3% without sawdust easily dissolved, while with increasing sawdust percentage, a better resistance was observed.

4.3. Discussion of Results by Means of Comparative Charts

4.3.1. Effect of SD on the Mixture before Exposure

As can be seen in the below figure (Figure 10a), implementation of SD increased the strength of the mixtures. From the figure, increment of SD from 3% to 15% in 3 days curing time shows an increase in strength. In addition, the same trend was observed with increasing cement percentage from 3% to 7%. Similar to 3 days curing time, the same trend was observed for 7 days curing time. The strength increase is clear within the 7 days curing time. In 28 days curing time, the same trend of increase was observed. Similar to the other curing times, 90 days curing time exhibited the same trend as the others (Figure 10b–d).

4.3.2. Effect of Cement on the Sulphate Resistance

From the results, it can be seen that in 90, 28 and 7 days the cement caused increment in IMP percentage of sulphate resistance. The figure for 3% is not provided, as the samples mainly vanished after exposure. Vanishing of samples in 3 days curing was attributed to lack of hydration process in 3 days. However, as curing increased, the bonding forces increased and signalled the higher IMP. (Figure 11a–c).

4.3.3. Effect of SD and Curing Time on Sulphate Resistance

At all percentages of cement and in each curing time, the results show improvement in the sample response to sulphate attack. In all cases, IMP showed an increase due to increase of SD and curing time. This behaviour was observed in all curing times. As an example, the samples for curing time of 90 days and 7% cement is evaluated. (Figure 12a–c).

4.4. Microstructural Study and SEM Characterisations

The reported SEM patterns for 7PC-10SD specimen after exposure to the sulphate solution confirmed the presence of the hydration products, but they showed a lower reflection than the results before exposure to the sulphate solution. This reduction in the reflections of hydration products might be due to diffusion of the sulphate molecules in the specimens that caused a reduction of the hydration product generation. The fluctuated structure can be seen well, especially in Figure 13a because the image was taken with an electron detector. There is a strong connection amongst the generated CSH and SD in benchmark specimens as shown in Figure 13a. In addition, Figure 13b shows that the connections amongst the CSH and SD particles decreased when the specimens were exposed to the MgSO4.
Generation of the hydration products such as CSH and CAH are apparent in Figure 13a before exposure of the specimens to the sulphate concentration. However, presence of the grooves, holes and perforations in the specimen is more apparent when the specimen was exposed to the sulphate, which might be the main reason for reduction of the sample compression strength [26,27,28,29,30].

5. Conclusions

Sulphate attacks are a major issue for infrastructures, especially in coastal lands, and cause significant damages every year. On the other hand, sawdust is an abundant by-product, and previous studies have shown its potential usage in civil engineering projects. As described earlier, the curing time was 3, 7, 28 and 90 days. The following conclusions can be drawn from this study:
  • The effect of SD was considered to be linear with decreasing effect on MDD and OMC. This means that optimum moisture content (OMC) decreased with increasing SD. At the same time, maximum dry density (MDD) was decreased with increasing SD. This result was attributed to lighter density of SD in this case compared to soil density.
  • SD helped the samples to resist more while exposed to sulphate attack. This was concluded based on UCS peak results. It is noted that SD addition increased the resistance of samples by more than 3 times in some cases.
  • Curing time affects the resistance of mixed soil against sulphate attack. The process can be attributed to the hydration process: With an increase in curing from 7 days to 90 days, proper hydration occurred, increasing the actual strength without exposure and increasing the resistance after exposure.
  • From a microanalytical point of view, the hydration process while cement is present generally causes the UCS to increase with increased curing time.
  • The decrease in strength of the mixture/soil after exposure to the MgSO4 was due to the decalcification process by substitution of the calcium in calcium silicate hydrate (CSH) with magnesium and production of the magnesium silicate hydrate (MSH), which is not cohesive.
In this study, the effect of sawdust on improvement of sulphate exposed soils has been investigated, and the results showed that addition of sulphate is effective to reduce the destructive effects of sulphate.

Author Contributions

Conceptualization, A.C. and H.N.; methodology, M.K. and A.C.; validation, A.S.S., M.K. and A.C.; formal analysis, A.C.; investigation, S.M.; resources, A.C.; data curation, S.M.; writing—original draft preparation, A.C., M.K., S.M.; writing—review and editing, A.S.S.; visualization, S.M.; supervision, A.C.; project administration, M.K. All authors have read and agreed to the published version of the manuscript.

Funding

This research received no external funding.

Acknowledgments

The authors acknowledge the use of Curtin University’s Microscopy and Microanalysis Facility, whose instrumentation has been partially funded by the University and State and Commonwealth Governments.

Conflicts of Interest

The authors declare no conflict of interest.

References

  1. Arulrajah, A.; Piratheepan, J.; Disfani, M.M.; Bo, M.W. Geotechnical and Geoenvironmental Properties of Recycled Construction and Demolition Materials in Pavement Subbase Applications. J. Mater. Civ. Eng. 2013, 25, 1077–1088. [Google Scholar] [CrossRef]
  2. Phetchuay, C.; Horpibulsuk, S.; Suksiripattanapong, C.; Chinkulkijniwat, A.; Arulrajah, A.; Disfani, M.M. Calcium carbide residue: Alkaline activator for clay–fly ash geopolymer. Constr. Build. Mater. 2014, 69, 285–294. [Google Scholar] [CrossRef]
  3. Keramatikerman, M.; Chegenizadeh, A.; Yilmaz, Y.; Nikraz, H. Effect of Lime Treatment on Static Liquefaction Behavior of Sand-Bentonite Mixtures. J. Mater. Civ. Eng. 2018, 30, 06018017. [Google Scholar] [CrossRef]
  4. Mohammadinia, A.; Arulrajah, A.; Horpibulsuk, S.; Shourijeh, P.T. Impact of potassium cations on the light chemical stabilization of construction and demolition wastes. Constr. Build. Mater. 2019, 203, 69–74. [Google Scholar] [CrossRef]
  5. Taylor, J.; Warnken, M. Wood Recovery and Recycling: A Source Book for Australia; CMSE Client Report 2008-277; Forest and Wood Products Australia: Melbourne, Australia, 2008. [Google Scholar]
  6. McEvilly, G.; Abeysuriya, S.; Dix, S. Facilitating the Adoption of Biomass Co-Firing for Power Generation; RIRDC: Wagga Wagga, Australia, 2011. [Google Scholar]
  7. Butt, W.A.; Gupta, K.; Jha, J.N. Strength behavior of clayey soil stabilized with sawdust ash. Int. J. Geo-Eng. 2016, 7, 18. [Google Scholar] [CrossRef] [Green Version]
  8. Ahmed, W.; Khushnood, R.A.; Memon, S.A.; Ahmad, S.; Baloch, W.L.; Usman, M. Effective use of sawdust for the production of eco-friendly and thermal-energy efficient normal weight and lightweight concretes with tailored fracture properties. J. Clean. Prod. 2018, 184, 1016–1027. [Google Scholar] [CrossRef]
  9. Bruscato, C.; Malvessi, E.; Brandalise, R.N.; Camassola, M. High performance of macrofungi in the production of mycelium-based biofoams using sawdust—Sustainable technology for waste reduction. J Clean. Prod. 2019, 234, 225–232. [Google Scholar] [CrossRef]
  10. Mageswari, M.; Vidivelli, B. The use of sawdust ash as fine aggregate replacement in concrete. J. Environ. Res. Dev. 2009, 3, 720–726. [Google Scholar]
  11. Uchechukwu Elinwa, A. Effect of addition of sawdust ash to clay bricks. Civ. Eng. Environ. Syst. 2006, 23, 263–270. [Google Scholar] [CrossRef]
  12. Djelal, C.; Page, J.; Kada, H.; Vanhove, Y. Feasibility study of using poplar wastes as sand in cement mortars. J. Mater. Cycles Waste Manag. 2019. [Google Scholar] [CrossRef]
  13. Keramatikerman, M.; Chegenizadeh, A.; Nikraz, H. An investigation into effect of sawdust treatment on permeability and compressibility of soil-bentonite slurry cut-off wall. J. Clean. Prod. 2017, 162, 1–6. [Google Scholar] [CrossRef]
  14. Jasim, O.H.; Çetin, D. Effect of Sawdust Usage on The Shear Strength Behavior of Clayey Silt Soil. Sigma 2016, 34, 31–41. [Google Scholar]
  15. Kalipcilar, I.; Mardani-Aghabaglou, A.; Sezer, A.; Altun, S.; Sezer, G.I. Sustainability of Cement-Stabilised Clay: Sulfate Resistance. Proc. Inst. Civ. Eng.-Eng. Sustain. 2018, 171, 254–274. [Google Scholar] [CrossRef]
  16. Yi, Y.; Li, C.; Liu, S.; Jin, F. Magnesium sulfate attack on clays stabilised by carbide slag-and magnesia-ground granulated blast furnace slag. Géotech. Lett. 2015, 5, 306–312. [Google Scholar] [CrossRef]
  17. Sriram Karthick Raja, P.; Thyagaraj, T. Effect of short-term sulphate contamination on lime-stabilized expansive soil. Int. J. Geotech. Eng. 2019. [Google Scholar] [CrossRef]
  18. Chegenizadeh, A.; Keramatikerman, M.; Panizza, S.; Nikraz, H. Effect of powdered recycled tire on sulfate resistance of cemented clay. J. Mater. Civ. Eng. 2017, 29, 04017160. [Google Scholar] [CrossRef]
  19. Miceli, S. Effect of Sawdust on Controlling Sulphate Attack in Cemented Bentonite. Bachelor’s Thesis, Curtin University, Perth, Australia, 2018. [Google Scholar]
  20. Keramatikerman, M.; Chegenizadeh, A.; Nikraz, H. Effect of Slag on Restoration Mechanical Characteristics of Ethanol Gasoline–Contaminated Clay. J. Environ. Eng. 2018, 144, 06018001. [Google Scholar] [CrossRef]
  21. Cement Australia. Material Safety Data Sheet for Portland Cement; Cement Australia: Darra, QLD, Australia, 2013. [Google Scholar]
  22. Sibelco Australia. Material Safety Data Sheet for Clay Prestige NY; Sibelco Australia: Nyora, Australia, 2011. [Google Scholar]
  23. ASTM. ASTM D698–07 Standard Test Methods for Laboratory Compaction Characteristics of Soil Using Standard Effort; ASTM: West Conshohocken, PA, USA, 2003. [Google Scholar]
  24. ASTM. ASTM D2166/D2166M—16 Standard Test Method for Unconfined Compressive Strength of Cohesive Soil; ASTM: West Conshohocken, PA, USA, 2006. [Google Scholar]
  25. Cabalar, A.F. Direct Shear Tests on Waste Tires–Sand Mixtures. Geotech. Geol. Eng. 2011, 29, 411–418. [Google Scholar] [CrossRef]
  26. Chegenizadeh, A.; Keramatikerman, M. Mitigating Sulphate Attacks in Geotechnical Engineering; Nova Science Publishers: Hauppauge, NY, USA, 2017. [Google Scholar]
  27. Keramatikerman, M.; Chegenizadeh, A.; Nikraz, H. Effect of GGBFS and lime binders on the engineering properties of clay. Appl. Clay Sci. 2016, 132, 722–730. [Google Scholar] [CrossRef]
  28. Keramatikerman, M.; Chegenizadeh, A.; Nikraz, H. Shear strength characteristics of over-consolidated clay treated with ggbfs. Aust. Geomech. J. 2018, 53, 141–149. [Google Scholar]
  29. Keramatikerman, M.; Chegenizadeh, A.; Pu, H. Effect of atrazine contamination on compressibility and permeability characteristics of clay. Geotech. Test. J. 2017, 40, 936–950. [Google Scholar] [CrossRef]
  30. Keramatikerman, M. Investigations into Effect of By-Product Binders in Improvement of Cyclic Behaviour of Soil. Ph.D. Thesis, Curtin University, Perth, Australia, 2019. [Google Scholar]
Figure 1. Particle size distribution (PSD) of the used bentonite clay and the used sawdust (SD).
Applsci 10 01441 g001
Figure 2. Scanning electron microscopic of the (a) Bentonite and (b) Portland cement (PC).
Applsci 10 01441 g002
Figure 3. Cured mixture (7 days) of the bentonite-slag-cement (a) 0%, (b) 3%, (c) 5%, (d) 10% and (e) 15% after sulphate attack.
Applsci 10 01441 g003aApplsci 10 01441 g003b
Figure 4. Compaction curves for the used mixtures (i.e., 0%, 3%, 5%, 10% and 15% sawdust).
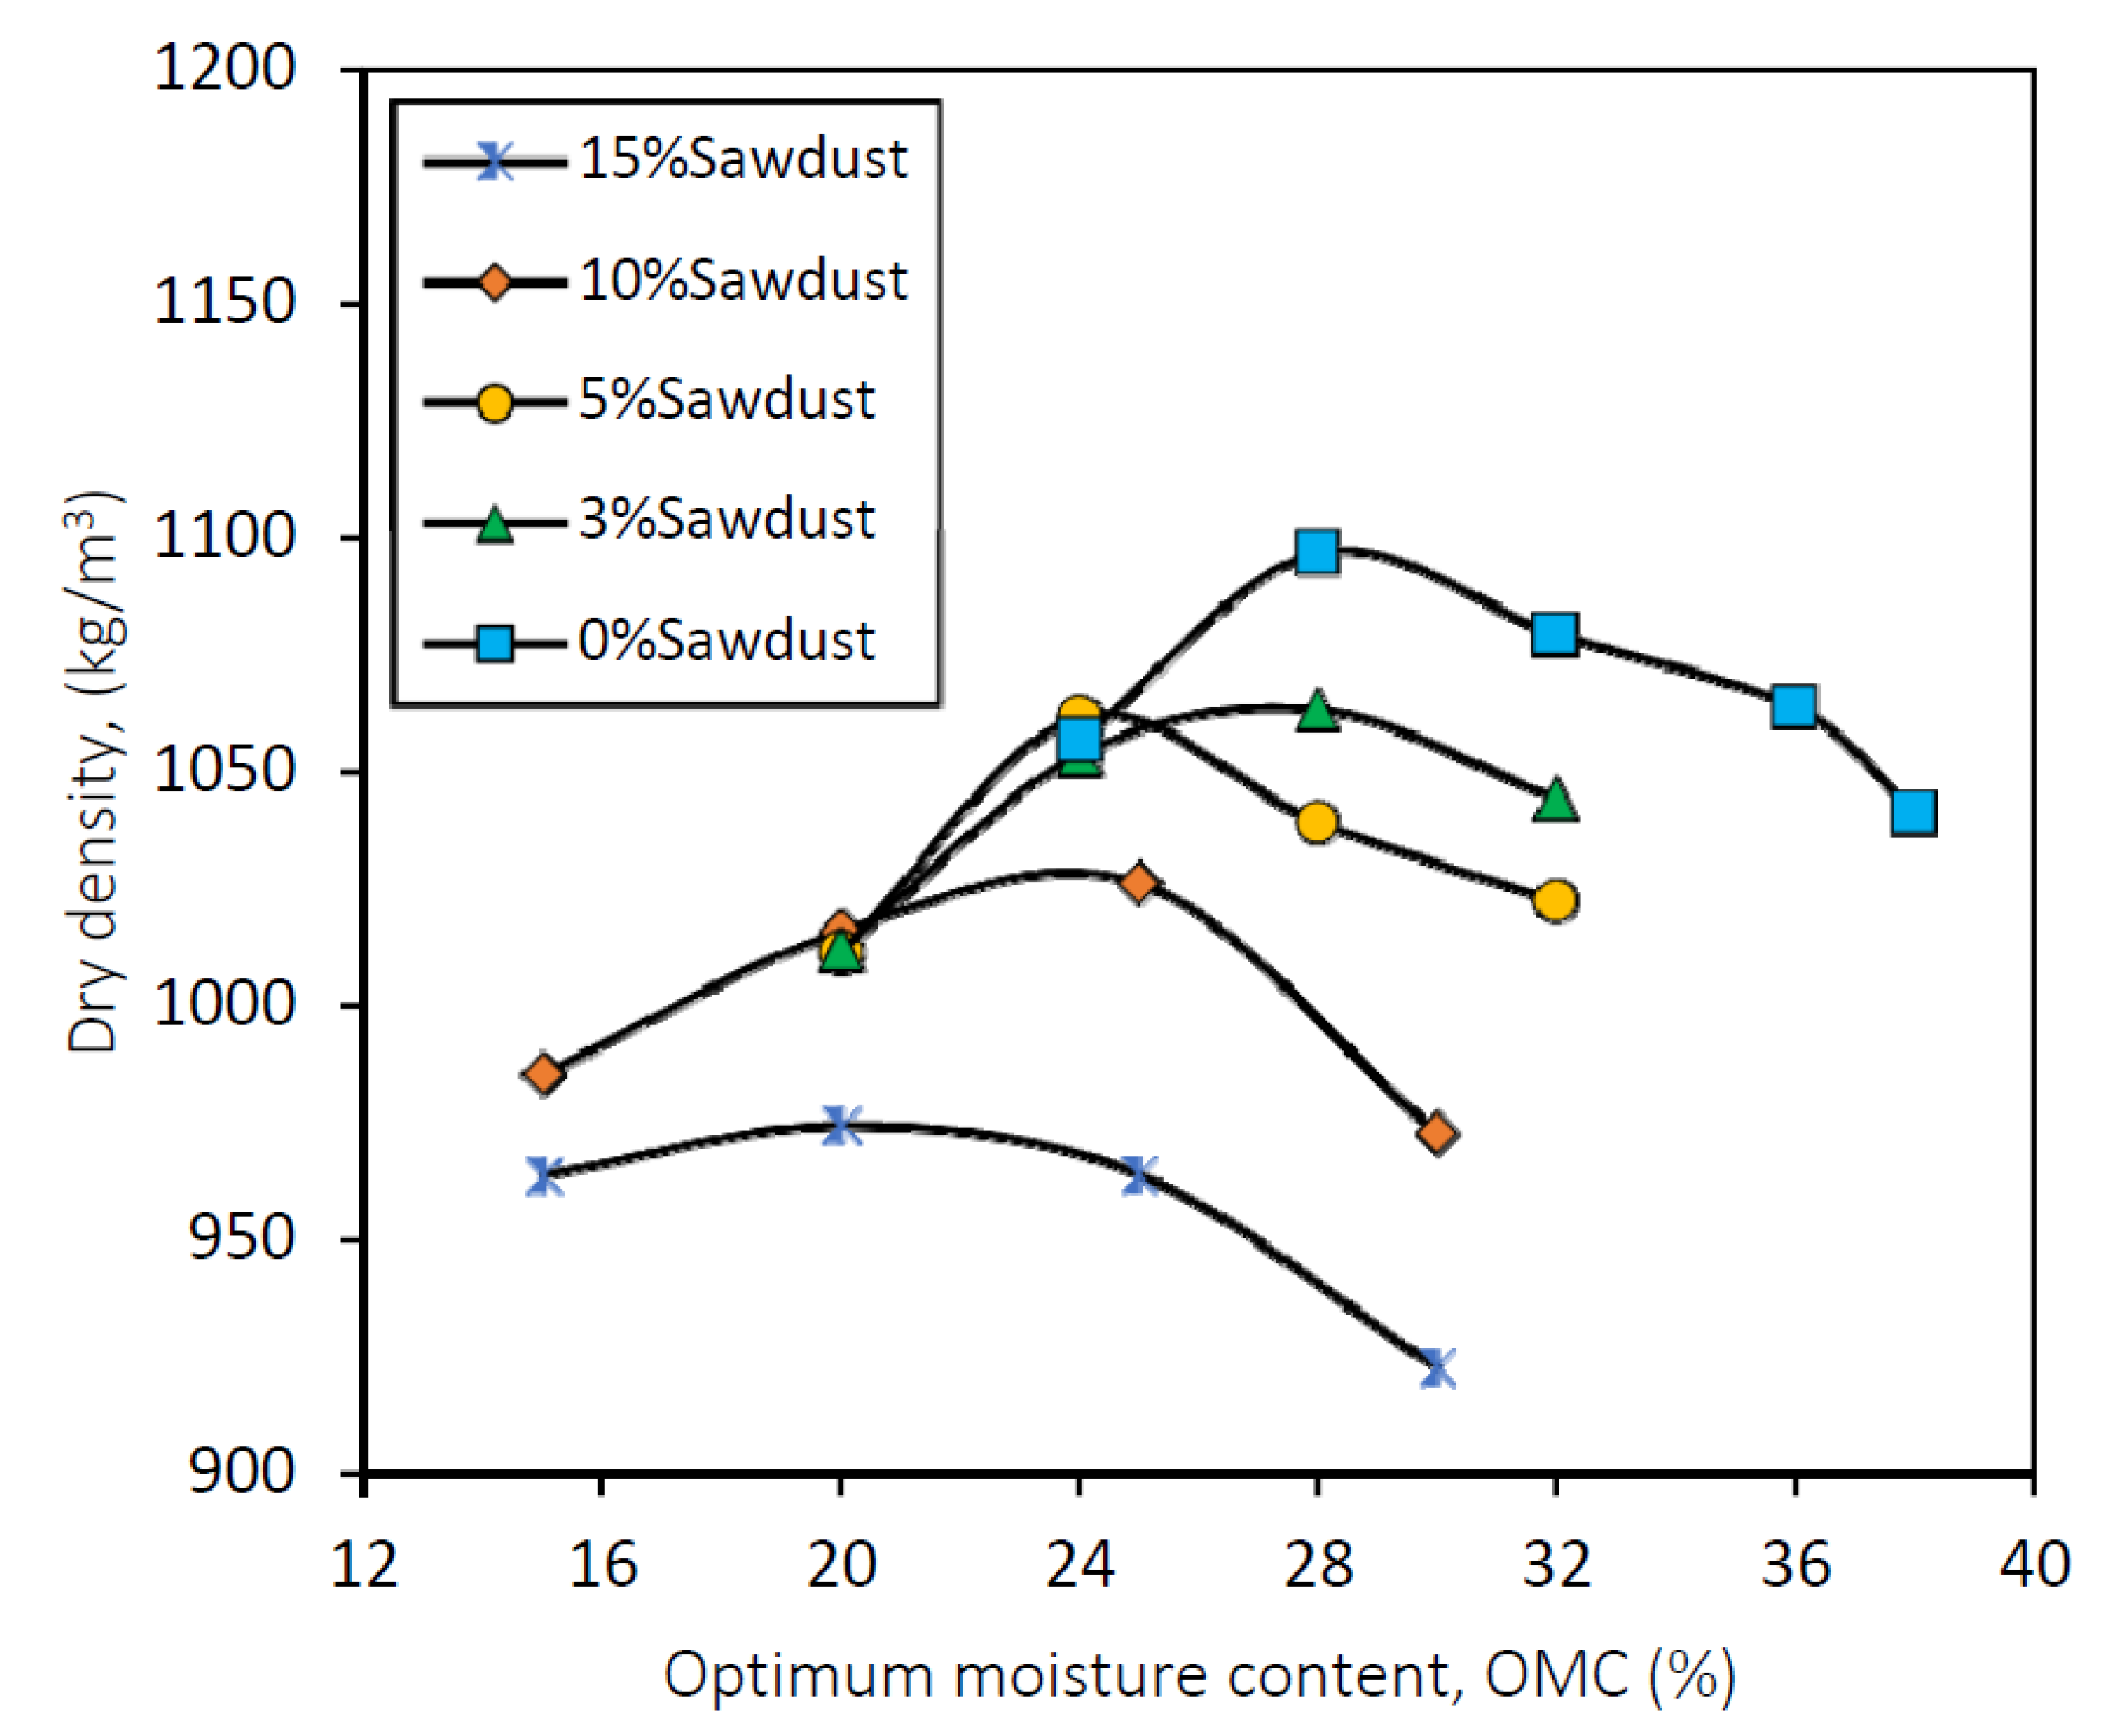
Applsci 10 01441 g004
Figure 5. Trend of variation of compaction results for 0%, 3%, 5%, 10% and 15% sawdust.
Applsci 10 01441 g005
Figure 6. Effect of sawdust addition on Unconfined Compressive Strength (UCS) peak values (3 days curing) (a) 3% PC; (b) 5% PC; (c) 7% PC.
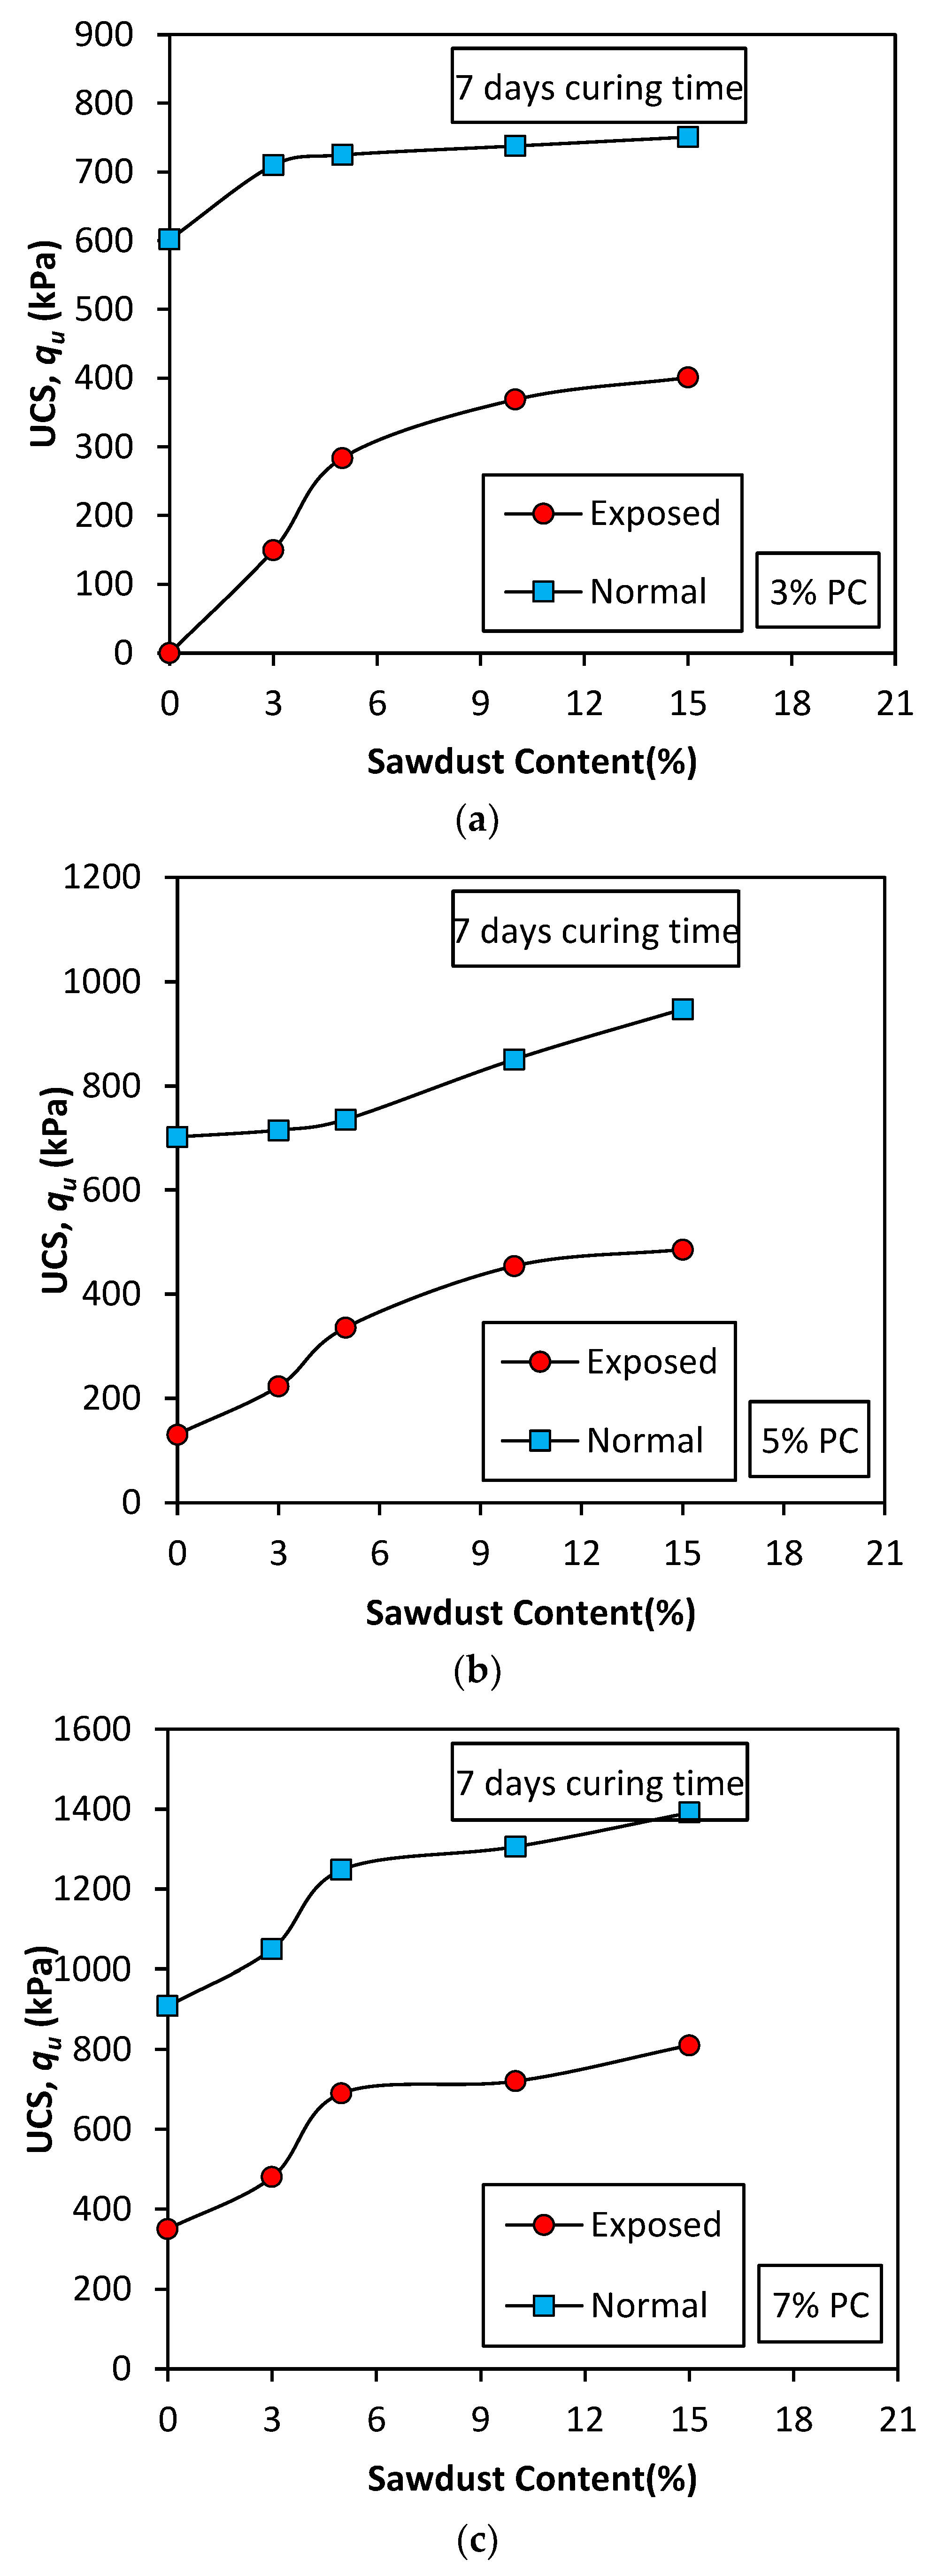
Applsci 10 01441 g006
Figure 7. Effect of sawdust addition on USC peak values (7 days curing) (a) 3% PC; (b) 5% PC; (c) 7% PC.
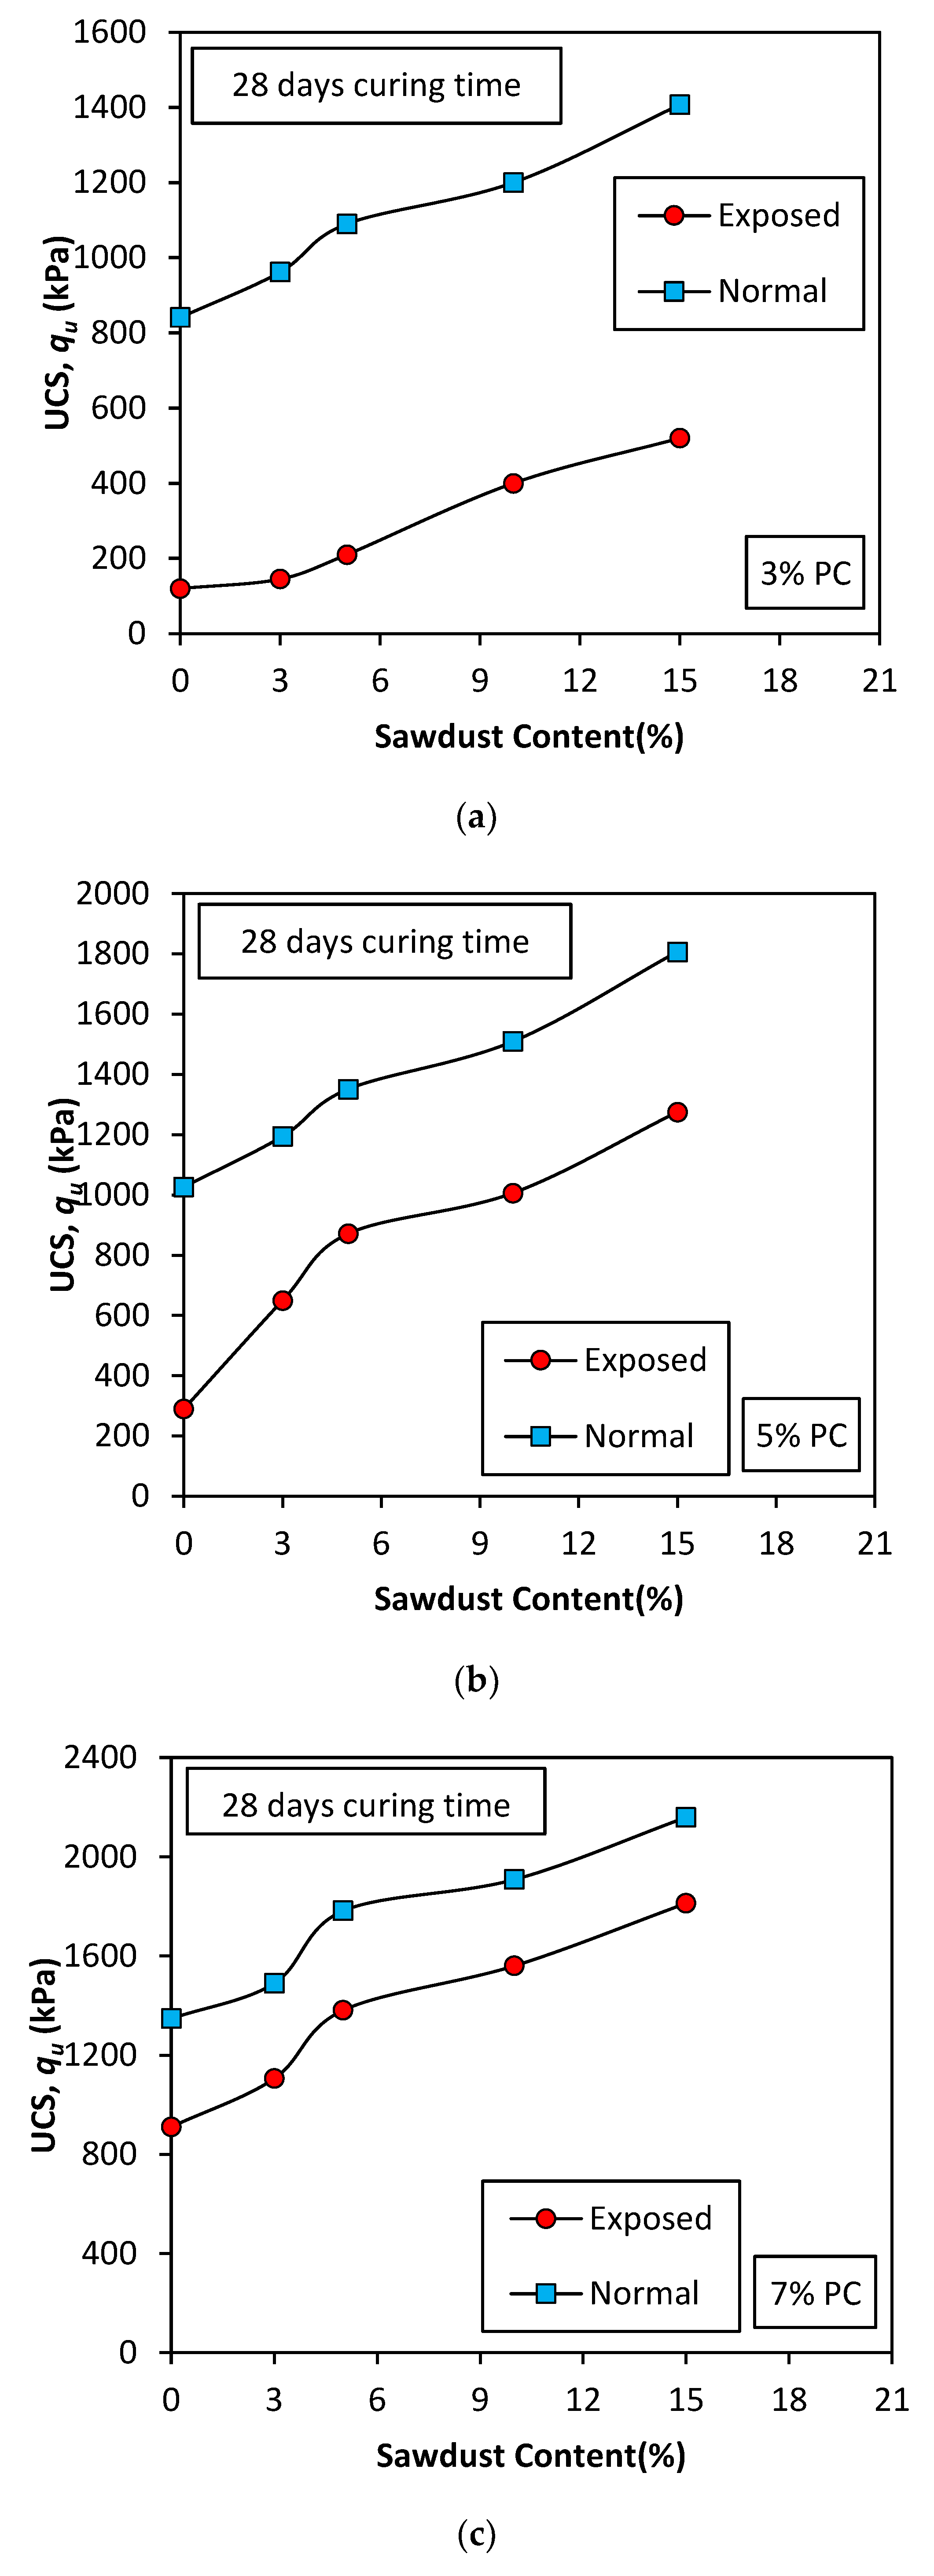
Applsci 10 01441 g007
Figure 8. Effect of sawdust addition on USC peak values (28 days curing): (a) 3% PC; (b) 5% PC; (c) 7% PC.
Applsci 10 01441 g008
Figure 9. Effect of sawdust addition on USC peak values (90 days curing): (a) 3% PC; (b) 5% PC; (c) 7% PC.
Applsci 10 01441 g009
Figure 10. Effect of sawdust addition on USC peak values before exposure to sulphate: (a) 3 days curing; (b) 7 days curing; (c) 28 days curing; (d) 90 days curing.
Applsci 10 01441 g010
Figure 11. Effect of sawdust addition on IMP values after exposure to sulphate: (a) 90 days curing; (b) 28 days curing; (c) 7 days curing.
Applsci 10 01441 g011
Figure 12. Effect of cement addition on IMP values after exposure to sulphate: (a) 7% cement; (b) 5% cement; (c) 3% cement.
Applsci 10 01441 g012aApplsci 10 01441 g012b
Figure 13. Scanning electron microscopic (SEM) analysis of the specimen 7PC-10SD: (a) before and (b) after sulphate attack.
Applsci 10 01441 g013
Table 1. Characteristics of the used Type II PC [21].
CharacteristicsQuantities
specific gravity2.5–3.2
pH12
Gypsum3% to 8%
Limestone0% to 5%
granulated blast furnace slag0% to 5%
Table 2. Chemical properties of bentonite [22].
Ingredients(%)
(SiO2)63.6
(Al2O3)14.6
(Fe2O3)2.8
(Na2O)1.3
(MgO)2
Table 3. Testing plan and mixtures.
No.Sample IDPortland Cement, PC (%)Sawdust, SD (%)Curing Time
1B---
1B-3PC3-7, 14, 28, 90
2B-5PC5-7, 14, 28, 90
3B-7PC7-7, 14, 28, 90
4B-3SD3, 5, 737, 14, 28, 90
5B-5SD3, 5, 757, 14, 28, 90
6B-10SD3, 5, 7107, 14, 28, 90
7B-15SD3, 5, 7157, 14, 28, 90
Table 4. UCS results before sulphate exposure in presence of SD (3 days curing).
SD ContentUnconfined Compressive Strength, UCS (kPa)
3% PC = 1805% PC = 2967% PC = 352
UCS (kPa)UCS (kPa)UCS (kPa)
3%241 ± 2322.3 ± 2391 ± 4
5%302 ± 2360.8 ± 4458 ± 2
10%349 ± 4399.9 ± 2502 ± 3
15%401 ± 2472.6 ± 3574 ± 2
Table 5. UCS results after sulphate exposure in presence of SD (3 days curing).
SD ContentUnconfined Compressive Strength, UCS (kPa)
3% PC = Vanished5% PC = Vanished7% PC = Vanished
UCS (kPa)Improvement (%)UCS (kPa)Improvement (%)UCS (kPa)Improvement (%)
3%20 ± 1-72.8 ± 1-102 ± 2-
5%61 ± 2-96.7 ± 2-164 ± 1-
10%106 ± 2-165.4 ± 3-250 ± 2-
15%157 ± 3-223.5 ± 2-340 ± 3-
Table 6. UCS results before sulphate exposure in presence of SD (7 days curing).
SD ContentUnconfined Compressive Strength, UCS (kPa)
3% PC = 6025% PC = 7027% PC = 908
UCS (kPa)UCS (kPa)UCS (kPa)
3%7107151050
5%725735.561248
10%738850.711306
15%751947.161391
Table 7. UCS results after sulphate exposure in presence of SD (7 days curing).
SD ContentUnconfined Compressive Strength, UCS (kPa)
3% PC = Vanished5% PC = 131.377% PC = 204
UCS (kPa)Improvement (%)UCS (kPa)Improvement (%)UCS (kPa)Improvement (%)
3%150-223.3770480135
5%284-336.29156685235
10%396-454.25245.8720252
15%401-485.96270810297
Table 8. UCS results before sulphate exposure in presence of SD (28 days curing).
SD ContentUnconfined Compressive Strength, UCS (kPa)
3% PC = 8415% PC = 10267% PC = 1347
UCS (kPa)UCS (kPa)UCS (kPa)
3%96211941489
5%109013511781
10%120015091908
15%140718072159
Table 9. UCS results after sulphate exposure in presence of SD (28 days curing).
SD ContentUnconfined Compressive Strength, UCS (kPa)
3% PC = 1205% PC = 2897% PC = 409
UCS (kPa)Improvement (%)UCS (kPa)Improvement (%)UCS (kPa)Improvement (%)
3%14520.8649124.561105170
5%21075871201.381380237
10%4002331006248.11560281
15%52033312753411812343
Table 10. UCS results before sulphate exposure in presence of SD (90 days curing).
SD ContentUnconfined Compressive Strength, UCS (kPa)
3% PC = 10285% PC = 14057% PC = 1648
UCS (kPa)UCS (kPa)UCS (kPa)
3%129716801906
5%146819462192
10%170220192358
15%192522402450
Table 11. UCS results after sulphate exposure in presence of SD (90 days curing).
SD ContentUnconfined Compressive Strength, UCS (kPa)
3% PC = 2015% PC = 4507% PC = 537
UCS (kPa)Improvement (%)UCS (kPa)Improvement (%)UCS (kPa)Improvement (%)
3%25024.31240175.51700216.5
5%407102.416402641985269.6
10%690243.21840308.82201309.8
15%88534019903422400346.9

