Article

Adsorption between Quercetin Derivatives and β-Glucan Studied with a Novel Approach to Modeling Adsorption Isotherms

1
Faculty of Food Technology Osijek, Department of Applied Chemistry and Ecology, J. J. Strossmayer University of Osijek, Franje Kuhača 20, HR 31000 Osijek, Croatia
2
Faculty of Chemical Engineering and Technology, Department of Analytical Chemistry, University of Zagreb, Marulićev trg 19, HR 10000 Zagreb, Croatia
3
Department of Mathematics, J. J. Strossmayer University of Osijek, Trg Ljudevita Gaja 6, HR 31000 Osijek, Croatia
4
Department of Statistics and Data Science, Yale University, 24 Hillhouse Ave., New Haven, CT 06511, USA
*
Authors to whom correspondence should be addressed.
Appl. Sci. 2020, 10(5), 1637; https://doi.org/10.3390/app10051637
Submission received: 24 January 2020 / Revised: 16 February 2020 / Accepted: 27 February 2020 / Published: 29 February 2020
(This article belongs to the Section Food Science and Technology)

Abstract

:
Interactions between polyphenols and fibers are important for polyphenol bioactivities, and have been studied in vitro with adsorption process and isotherms. However, the theoretical interpretations of adsorption potentially can be affected by the method of isotherm modeling. The aim was to study the interactions between β-glucan and quercetin derivatives (quercetin-3-glucoside, quercetin-3-galactoside, quercetin-3-rhamnoside) by studying adsorption, and to potentially improve the modeling of adsorption isotherms. Quercetin derivatives were determined by using spectrophotometric method. Experimental results were modeled with Langmuir, Dubinin-Radushkevich, and Hill isotherms using non-linear regression, linear regression, and improved non-linear regression. For improved non-linear regression, code in the R programming language was developed. All quercetin derivatives adsorbed onto the surface of β-glucan. Improved non-linear regression gave somewhat lower errors and may be the most appropriate for adsorption interpretation. According to isotherms obtained with improved regression, it may be suggested that adsorption is higher for rhamnoside and glucoside of quercetin than for quercetin-3-galactoside which agrees with experimental results. Adsorption could be a physical process. The spatial arrangement of hydroxyl (OH) groups on the glycoside part of quercetin could affect the adsorption. In conclusion, a novel approach using improved non-linear regression has been shown to be a useful, novel tool for adsorption interpretation.

1. Introduction

Polyphenols are secondary plant metabolites which in recent years showed many potentially positive bioacitivities [1,2,3]. One of the polyphenol bioactivities not completely investigated yet is their interaction with various food constituents in the digestive tract [4,5]. Interactions between polyphenols and food constituents can affect polyphenol’s accessibility for absorption in the digestive tract (bioaccessibility) or the amount that is being absorbed. This might directly affect bioactivities of polyphenols. That is why the studies of interactions of polyphenols with different food constituents are the focus of present studies [4,6,7].
Interactions of polyphenols with food constituents like dietary fibers (cellulose, glucans, etc.) are especially interesting because fibers are resistant to digestion and absorption in the human small intestine. They ferment, completely or partially, in the large intestine [8]. This means that dietary fibers can interact with polyphenols in the digestive tract and potentially “carry” them to the lower parts of the digestive tract in non-metabolized form where they can potentially show some positive bioactivities. It has been already shown that polyphenols can interact with cellulose [9,10,11], cellulose based composites [7] or xylan [9]. Furthermore, β-glucan is one of common dietary fibers that can be found in certain cereals [12]. Many positive activities of β-glucan on human organism have been found [13,14,15], so there are many dietary supplements developed containing β-glucans. Moreover β-glucans can also interact with polyphenols [16,17].
Better understanding of polyphenol–dietary fiber interactions can be obtained by studying the adsorption process. This is a process in which molecules of polyphenols adsorb onto the surface of dietary fibers. It is known that many factors affect adsorption, like the chemical structure of polyphenols or dietary fibers, the conditions in the environment (pH, temperature and ionic strength) or the food matrix [17,18,19,20]. However, there is still much unknown about polyphenol–dietary fiber interactions (adsorptions). Specifically, there are only a few published papers dealing with β-glucan and polyphenols adsorptions [16,17,20,21,22,23]. Since polyphenols are a large group of compounds, many of them have never been studied in the adsorption process with β-glucan. Quercetin derivatives, which belong to a subclass of flavonols, can be found in plant foods like apples or onions [24,25]. But, none of the papers have presented results for adsorption of quercetin derivatives onto β-glucan, to the best of our knowledge.
Furthermore, when interactions between polyphenols and dietary fibers are studied using the adsorption process, differences in modeling methodology can lead to different results which could affect the explanation of the adsorption process, and consequently the polyphenol-dietary fiber interactions. Experimental results of the adsorption process are modeled with different adsorption isotherm equations [18,19,26,27,28,29] to obtain parameters of isotherms and to assist in gaining a theoretical insight into the adsorption process. Depending on whether linear or non-linear modeling is applied, isotherm parameters can be different, which could lead to difficulties in explaining the adsorption process. Linear regression has already shown some usefulness in restricted situations [28]. Traditional non-linear least squares fitting is typically better than linear, depending on the error structure. Nevertheless, as we discuss, in the setting of adsorption measurements, traditional non-linear least squares can also lead to statistical inconsistency and potentially poor interpretation of adsorption and, consequently, potentially poor interpretation of interactions.
Thus, the motivations for the present study are the unknown interactions (adsorption) between quercetin derivatives and dietary fibers (β-glucan), and the challenges to interpretation of adsorption that arise from differences in modeling methodology. Accordingly, this study had two aims. The first was to study the interactions between quercetin derivatives (quercetin-3-glucoside, quercetin-3-galactoside, and quercetin-3-rhamnoside) and β-glucan by studying the adsorption process. Experimental data of adsorption were modeled with three adsorption isotherm equations (Langmuir, Dubinin-Radushkevich and Hill) and modeling was done with traditional non-linear and linear regression. These results will give us a better insight into the interactions of quercetin derivatives, which are present in many fruits, with one of dietary fibers, β-glucans. It will also give an insight into the influence of chemical structure of quercetin (glycosylation) on the interactions with β-glucans since all quercetin derivatives have different sugar molecules attached to aglycon quercetin. The other aim was to improve the modeling process of adsorption isotherms. The improved modeling led to code for improved non-linear fitting of adsorption isotherms developed as an R algorithm. The code represents a novel approach to the modeling of the experimental results which has the potential to give lower error and to lead to better interpretation of adsorption and finally, to better interpretation of interactions. Previously, it has been presented only as poster presentations in conferences [30,31]. The current paper is meant to reveal its use in a scientific journal setting. In parallel we are developing statistical and computational papers. One of the benefits of the code for improved non-linear fitting developed for this study is that it has the potential to be used in other areas where adsorption is applied.

2. Materials and Methods

2.1. Chemicals

The quercetin-3-O-galactoside (CAS 482-36-0, ≥98 %) and quercetin-3-O-rhamnoside (CAS 522-12-3, ≥98.5 %) were purchased from Extrasynthese (Genay, France), while quercetin-3-β-D-glucoside (CAS 482-35-9, ≥90%) and β-d-glucan from barley (CAS 9041-22-9, ≥95%) were from Sigma-Aldrich (St. Louis, MO, USA). The methanol (HPLC grade) was purchased from Avantor (Arnhem, Netherlands). A Folin–Ciocalteu reagent (p.a.), di-sodium hydrogen phosphate dodecahydrate (p.a.), and sodium dihydrogen phosphate dihydrate (p.a.) were obtained from Kemika (Zagreb, Croatia), while sodium carbonate anhydrous (p.a.) was from Gram-mol (Zagreb, Croatia).

2.2. Spectrophotometric Method for Total Polyphenols (Folin-Ciocalteu Method)

The Folin-Ciocaletu spectrophotometric method [32] was calibrated for all three quercetin derivatives according to the procedure of Matić et al. (2017) [33]. Stock solutions of quercetin derivatives were prepared (900 mg/L quercetin-3-glucoside, 490 mg/L quercetin-3-galactoside, and 985 mg/L quercetin-3-rhamnoside). 20 μL of various concentrations of a quercetin derivative, 1580 μL of distilled water, 100 μL of Folin-Ciocalteu reagent, and 300 μL of Na2CO3 solution (200 g/L) were added in a glass tube. This solution was homogenized in vortex mixer and incubated at 40 °C for 30 min (IN 30, Memmert, Schwabach, Germany). Afterwards, the absorbance was measured at 765 nm (UV-Vis spectrophotometer, Shimadzu UV-1280, Kyoto, Japan) against a blank solution containing distilled water instead of quercetin derivative. The calibration equation, limit of detection (LOD) and limit of quantification (LOQ) were determined. Samples for quercetin derivative calibration curves were prepared in doublets and each was measured twice. This method was used for the determination of quercetin derivatives in the adsorption experiment.

2.3. Adsorption of Quercetin Derivatives onto β-Glucan

Stock solution of β-glucan (190 mg/L) was prepared in distilled water and heated at 80 °C for 15 min [28]. After preparation, β-glucan was stored in a refrigerator at 4 °C. All experiments of adsorption of quercetin derivatives onto β-glucan were carried out at 25 °C and pH 5.5. The total volume of each model solution was 500 µL. The model solutions consisted of an appropriate volume of β-glucan stock solution (producing a final concentration of 5 mg/L), an appropriate volume of quercetin derivatives, and the remaining constituent was a phosphate buffer (pH 5.5). The model solutions were homogenized and put in an incubator for 16 h which was a sufficient time required to reach the adsorption equilibrium according to Wang et al. (2013) [20]. The blank experiment was conducted in the same way, only without β-glucan. After 16 h in the incubator, the model solutions and the blank experiment were each filtered through a polyethersulfon membrane (Sartorius, Vivaspin 500 centrifugal concentrators, 100–500 µL) using a centrifugal driving force (Eppendorf minispin centrifuge, Hamburg, Germany). The concentration of un-adsorbed polyphenols in a model solution (c) and in a blank experiment (cblank) was determined in the filtered solutions by applying the Folin-Ciocalteu method. The adsorption capacity qe (mg/mg of β-glucan) was calculated according to Equation (1).
q e = ( c b l a n k c ) V m γ a V m
Here cblank represents the concentration of quercetin derivatives in the blank experiment (mg/L), c is the concentration of quercetin derivatives after adsorption (mg/L), Vm is the volume of the model solution (L). γa is the mass concentration of β-glucan in the model solution (mg/L). The ce, or the concentration of un-adsorbed polyphenols (concentration in equilibrium), was calculated according to Equation (2) and expressed in mg:
c e = [ c 0 ( c b l a n k c ) ] V m
where co is the initial polyphenol concentration in the reaction solution. In the first experiment, the initial concentration of quercetin derivatives was 25 mg/L. In the second experiment, the adsorption of quercetin derivatives was measured for additional concentrations 50, 75, 100, and 150 mg/L in the same experimental conditions, for 16 h, to get the data to be analyzed with isotherm equations.

2.4. The Conservation of Mass

The experimental data qe and ce will be presented in qe vs ce diagrams and then modeled with adsorption isotherms. For these diagrams, it is important to explain the implications of the conservation of mass. The expressions (1) and (2) arise as expressions of the conservation of mass: namely, the initial concentration c 0 is the sum of the amount adsorbed ( c b l a n k c ) (providing q e ) and the amount not adsorbed [ c 0 ( c b l a n k c ) ] (providing c e ). In other words, for initial co, the higher the amount of adsorbed compound is (qe), the lower is the amount of un-adsorbed compound (ce). And vice versa. And their sum must always be the co. The consequence of this mass constraint is that, for each initial concentration c 0 , the data points ( c e , q e ) lay exactly on a line of slope -1/γaVm in qe vs. ce diagram. This is a slope of –1, (that is, a line of slope –45 degrees) if we were to use the units of mass (in mg) for both. In other words, for each initial concentration, the data lay on a diagonal line, and not the vertical line. This fact is important in further explanation of the novel methodology for modeling the adsorption data.

2.5. Adsorption Isotherms and Data Modeling

The experimental data (ce (mg) vs. qe (mg/mg β-glucan)) were modeled with Langmuir, Dubinin-Radushkevich and Hill adsorption isotherms [18,19,26,27,28,29] using non-linear regression, improved non-linear regression, and linear regression.

2.5.1. Non-Linear Regression

Langmuir adsorption isotherm:
q e = q m K L c e 1 + K L c e
Dubinin-Radushkevich adsorption isotherm:
q e = q s e x p ( β ε 2 )
ε = R T ln ( c s c e )
E = 1 2 β
Dubinin-Radushkevich becomes:
q e = q s e x p ( β R 2 T 2 ( l n c s c e ) 2 )
Hill adsorption isotherm:
q e = q m c e n H K D + c e n H
where KL is the Langmuir equilibrium constant of adsorption (1/mg) or apparent affinity constant, qm is the theoretical maximum adsorption capacity of β-glucan (mg/mg), qs is the theoretical isotherm saturation capacity (mg/mg), β is a constant related to the adsorption capacity (mol2/J2), ε is Polanyi potential (J/mol), R is the gas constant (8.314 J/mol K), T is the temperature (K), E is the adsorption mean free energy (J/mol), cs is the theoretical saturation concentration or solubility (mg), nH is the Hill cooperativity coefficient of the binding interaction, and KD is the Hill constant (mg)nH.
The parameters from the two-parameter Langmuir isotherm determined by the regression are qm and KL. Dubinin Radushkevich is a three-parameter isotherm and the parameters that could be determined are qs, β, and cs. The cs represents the theoretical saturation capacity, so it should be large than the largest observed ce. A convenient constraint value for these data is that it not be smaller than 0.1 mg. With this constraint the non-linear least squares solutions occurred at this value. An equivalent result is obtained by fixing the cs value at the level of 0.1 mg. A least squares value of cs near 0.1 mg occurred automatically for the quercetine-3-rhamoside data, so no constraint was found to be needed in that case. Along with the cs value, we determined qs and β. From β, the energy E was calculated. Altogether, the reported parameters of the Dubinin-Radushkevich isotherm are cs, qs and E. The parameters for the three-parameter Hills model are qm, nH and KD. An approximate least squares values of the Hills constant KD was found at the level 0.0001 for quercetin-3-galactoside and quercetin-3-glucoside (smaller KD values that show potential insignificant improvement were numerically unstable, so we chose the indicated level). The stable least squares value of KD was 0.033 for quercetin-3-rhamnoside. Along with KD, we determined and reported the two additional Hill parameters qm and nH.

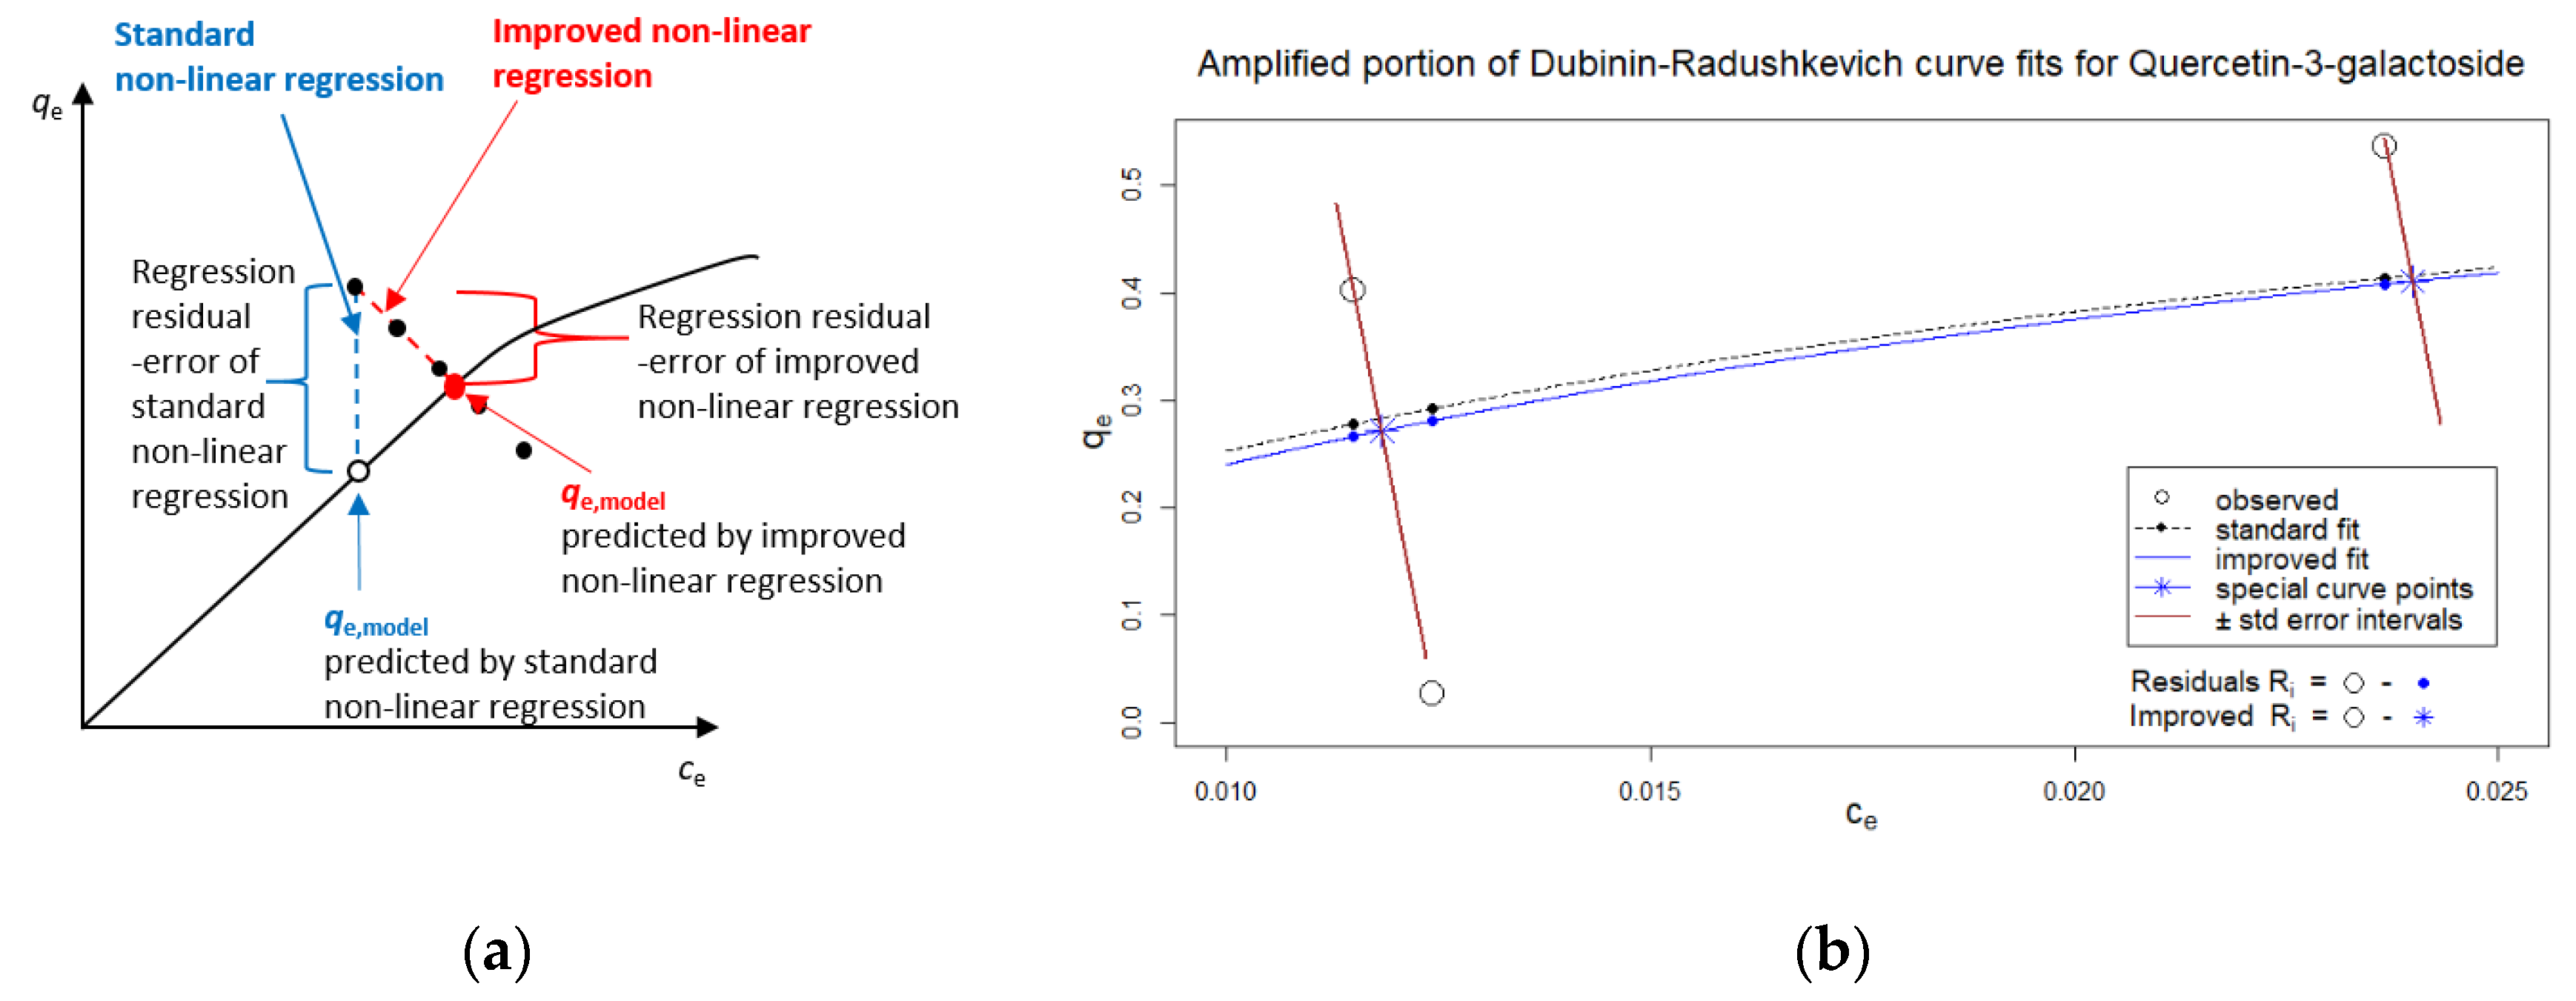
2.5.2. Improved Non-Linear Regression

The experimental data (ce vs. qe) were analyzed also with improved non-linear regression. To explain the potential need for this improvement let’s contrast the situation with that of traditional least squares curve fitting. Traditional non-linear least square is appropriate for response models in which the y values are measured values of a parameterized function of the corresponding input value x. For each set value of x, the response y is measured multiple times, with some potential variability around the unknown function value. The values for multiple measurements of y at the input value x follow a vertical line in the y vs x diagram. For the curve determination with non-linear regression, the square of the vertical residual between the measured y and the functional value y is summed, and minimized as a function of the parameters. In these models, the error is independent of the input value x.
Adsorption isotherm curve fitting is distinct from this situation. In isotherm diagrams, the response value y vs input value x may be thought of via the qe vs. ce diagrams. However, in fact, both qe and ce are measured/calculated as responses to the initial concentration co. If we have multiple measurement for one initial co, the line of multiple qe in the diagram will be the diagonal line due to the conservation of mass, as explained earlier. It is this constraint from the conservation of mass relationship, along with the structure of variability it induces (perfectly negative correlation between ce and qe), that can necessitate the need for improvements on the traditional least squares procedure. If we fit the curve through those data that are shown in the diagonal line, these is a unique crossing point of the diagonal with the curve. For precise curve determination that respects the mass constraint, the appropriate square of residuals between measured qe and curve qe at that crossing point should be determined. Minimizing the sum of squares of this error is what is sought to be achieved by the improved non-linear adsorption fitting program. Properties of this improved regression are discussed further in the results section.

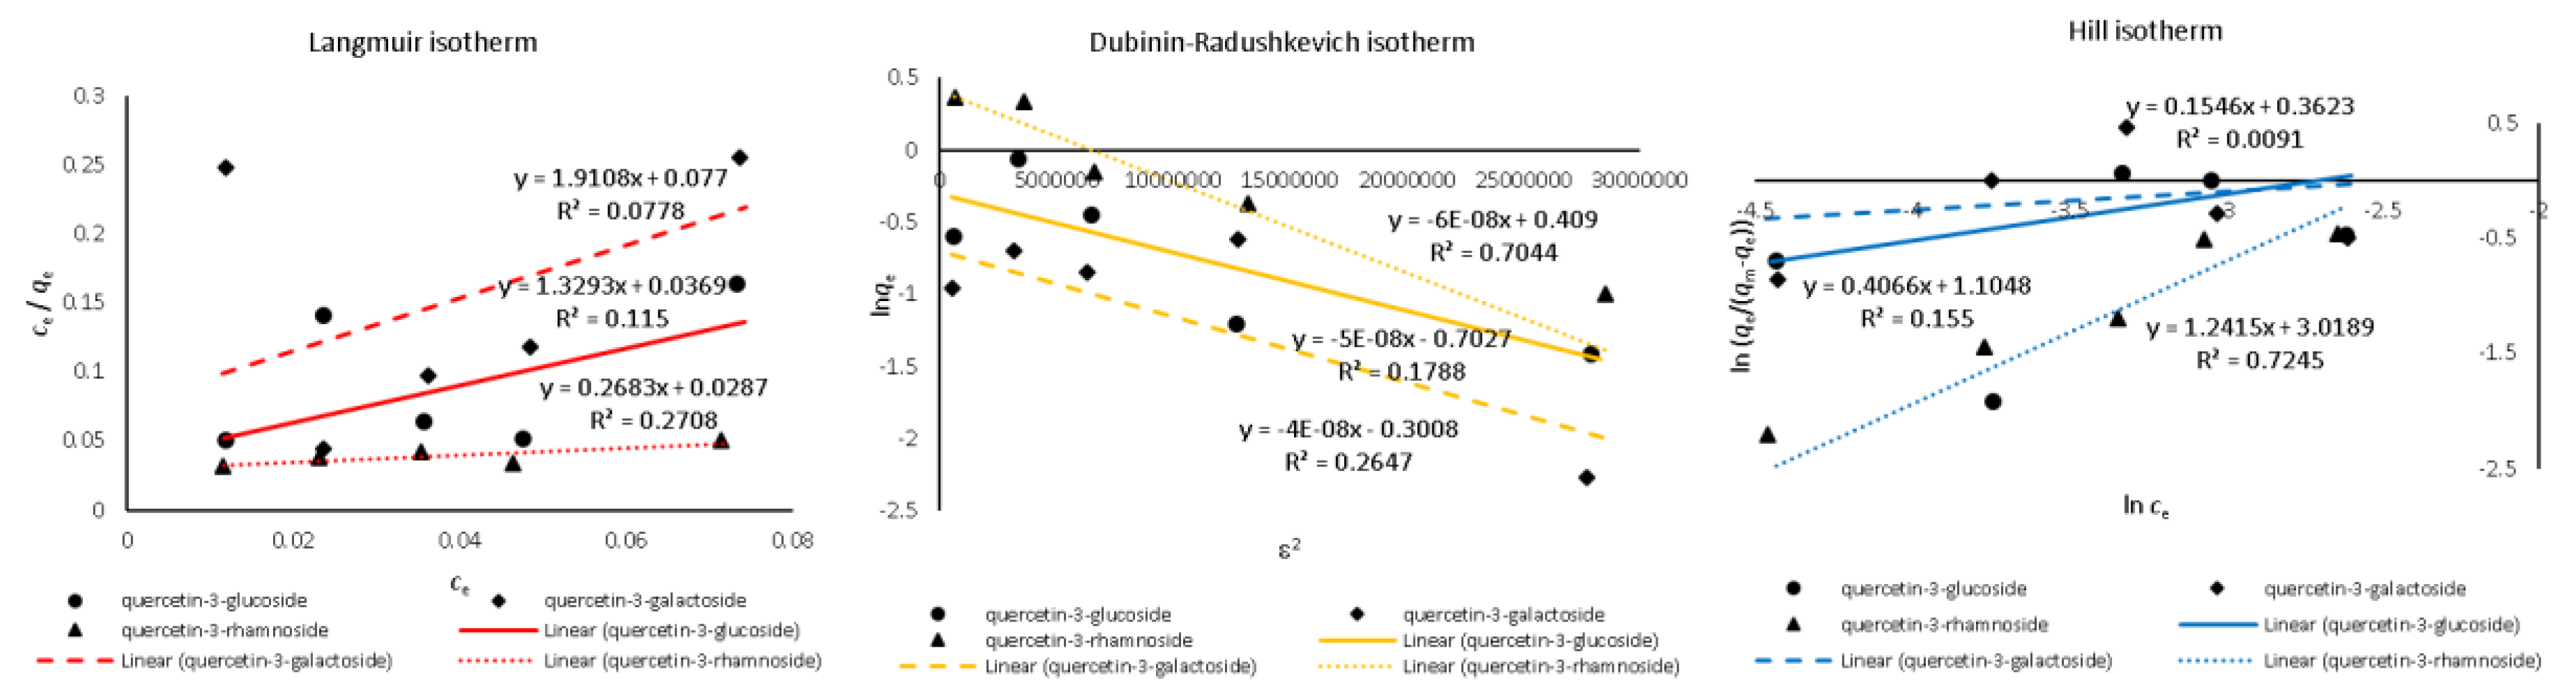
2.5.3. Linear Regression

Data were also modeled with Langmuir, Dubinin-Radushkevich, and Hill adsorption isotherms with linear regression. These linear regressions are based on transformations of the observed c e and qe values as here indicated.
Linearized form of Langmuir adsorption isotherm:
c e q e = 1 K L q m + 1 q m c e
Linearized form of Dubinin-Radushkevich adsorption isotherm:
l n q e = l n q s β ε 2
Linearized form of Hill’s adsorption isotherm:
l n q e q m q e = n H l n c e l n K D
Using linear forms of the Langmuir isotherm, a diagram ce vs. ce/qe was created, and qm and KL were determined from the slope (1/qm) and intercept (1/KLqm) and reported. In the Dubinin-Radushkevich isotherm, ε was calculated according to equation 5 with value cs of 0.1 mg. Diagram ε2 vs. lnqe was created, and β and qs were calculated from slope (β) and intercept (lnqs). For Hill’s isotherm, Equation (11) is an approximate linearized form valid for small KD. A diagram of lnce vs. lnqe/(qm-qe) was created. The qm value was the qm constant from the Langmuir model. From the slope (nH) and intercept (lnKD), parameters nH and KD were determined and reported.

2.6. Statistical Analysis
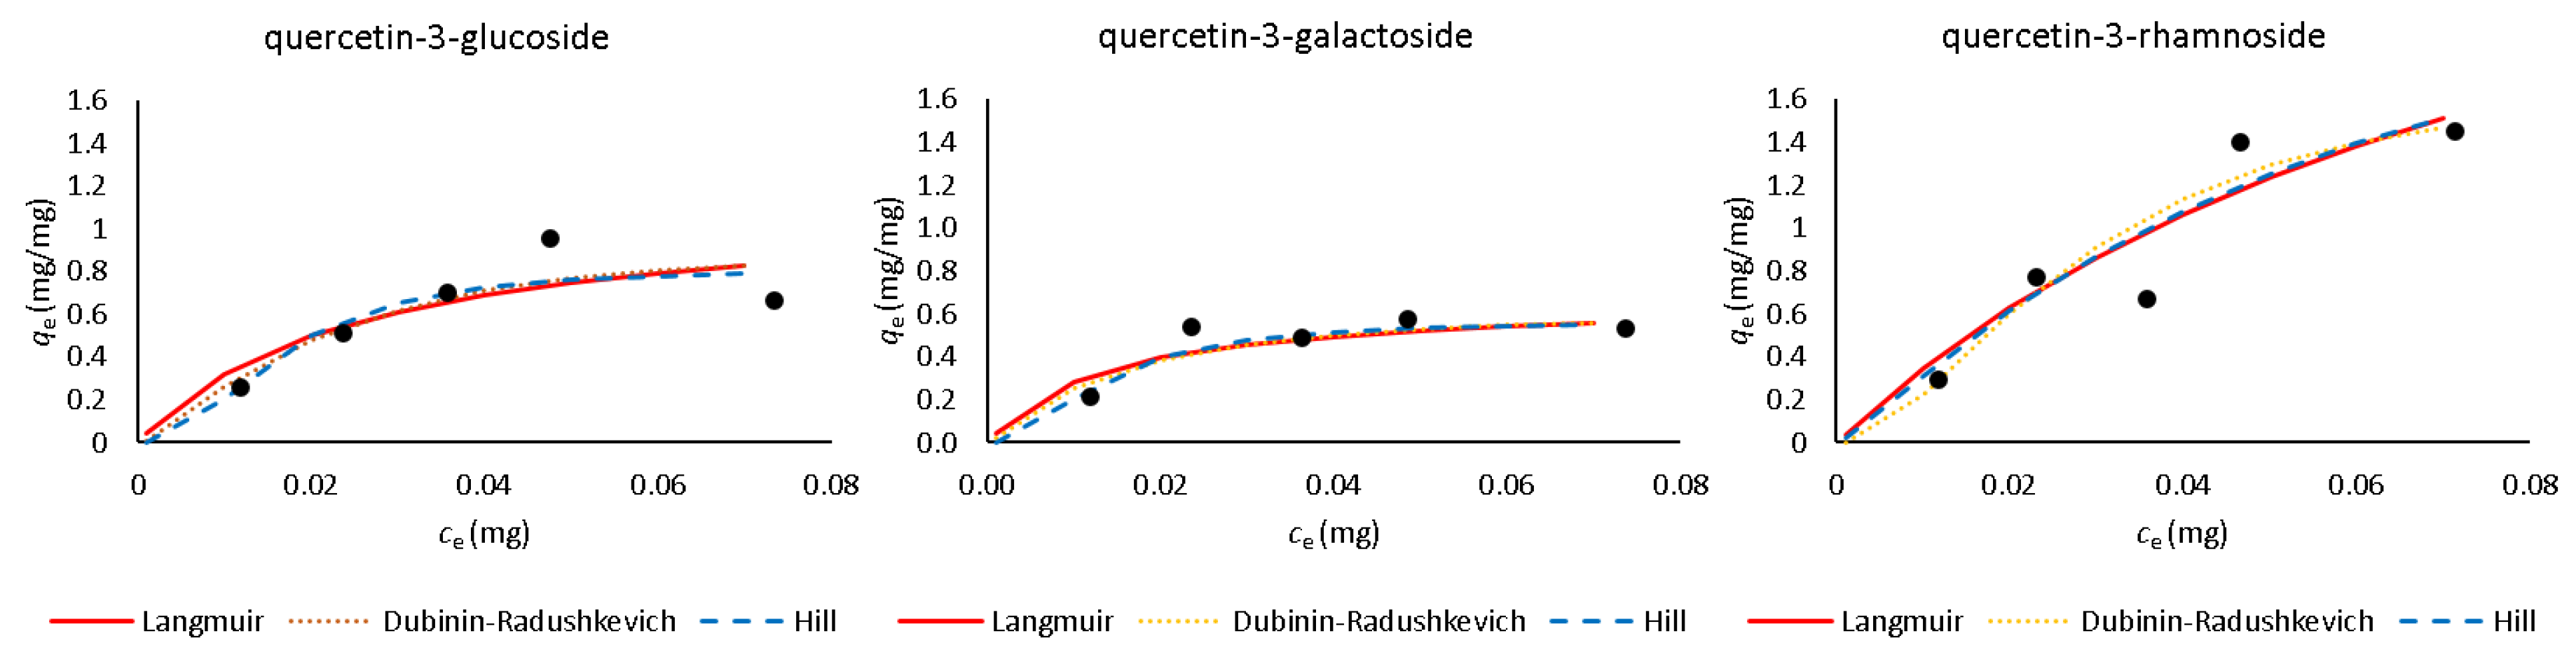
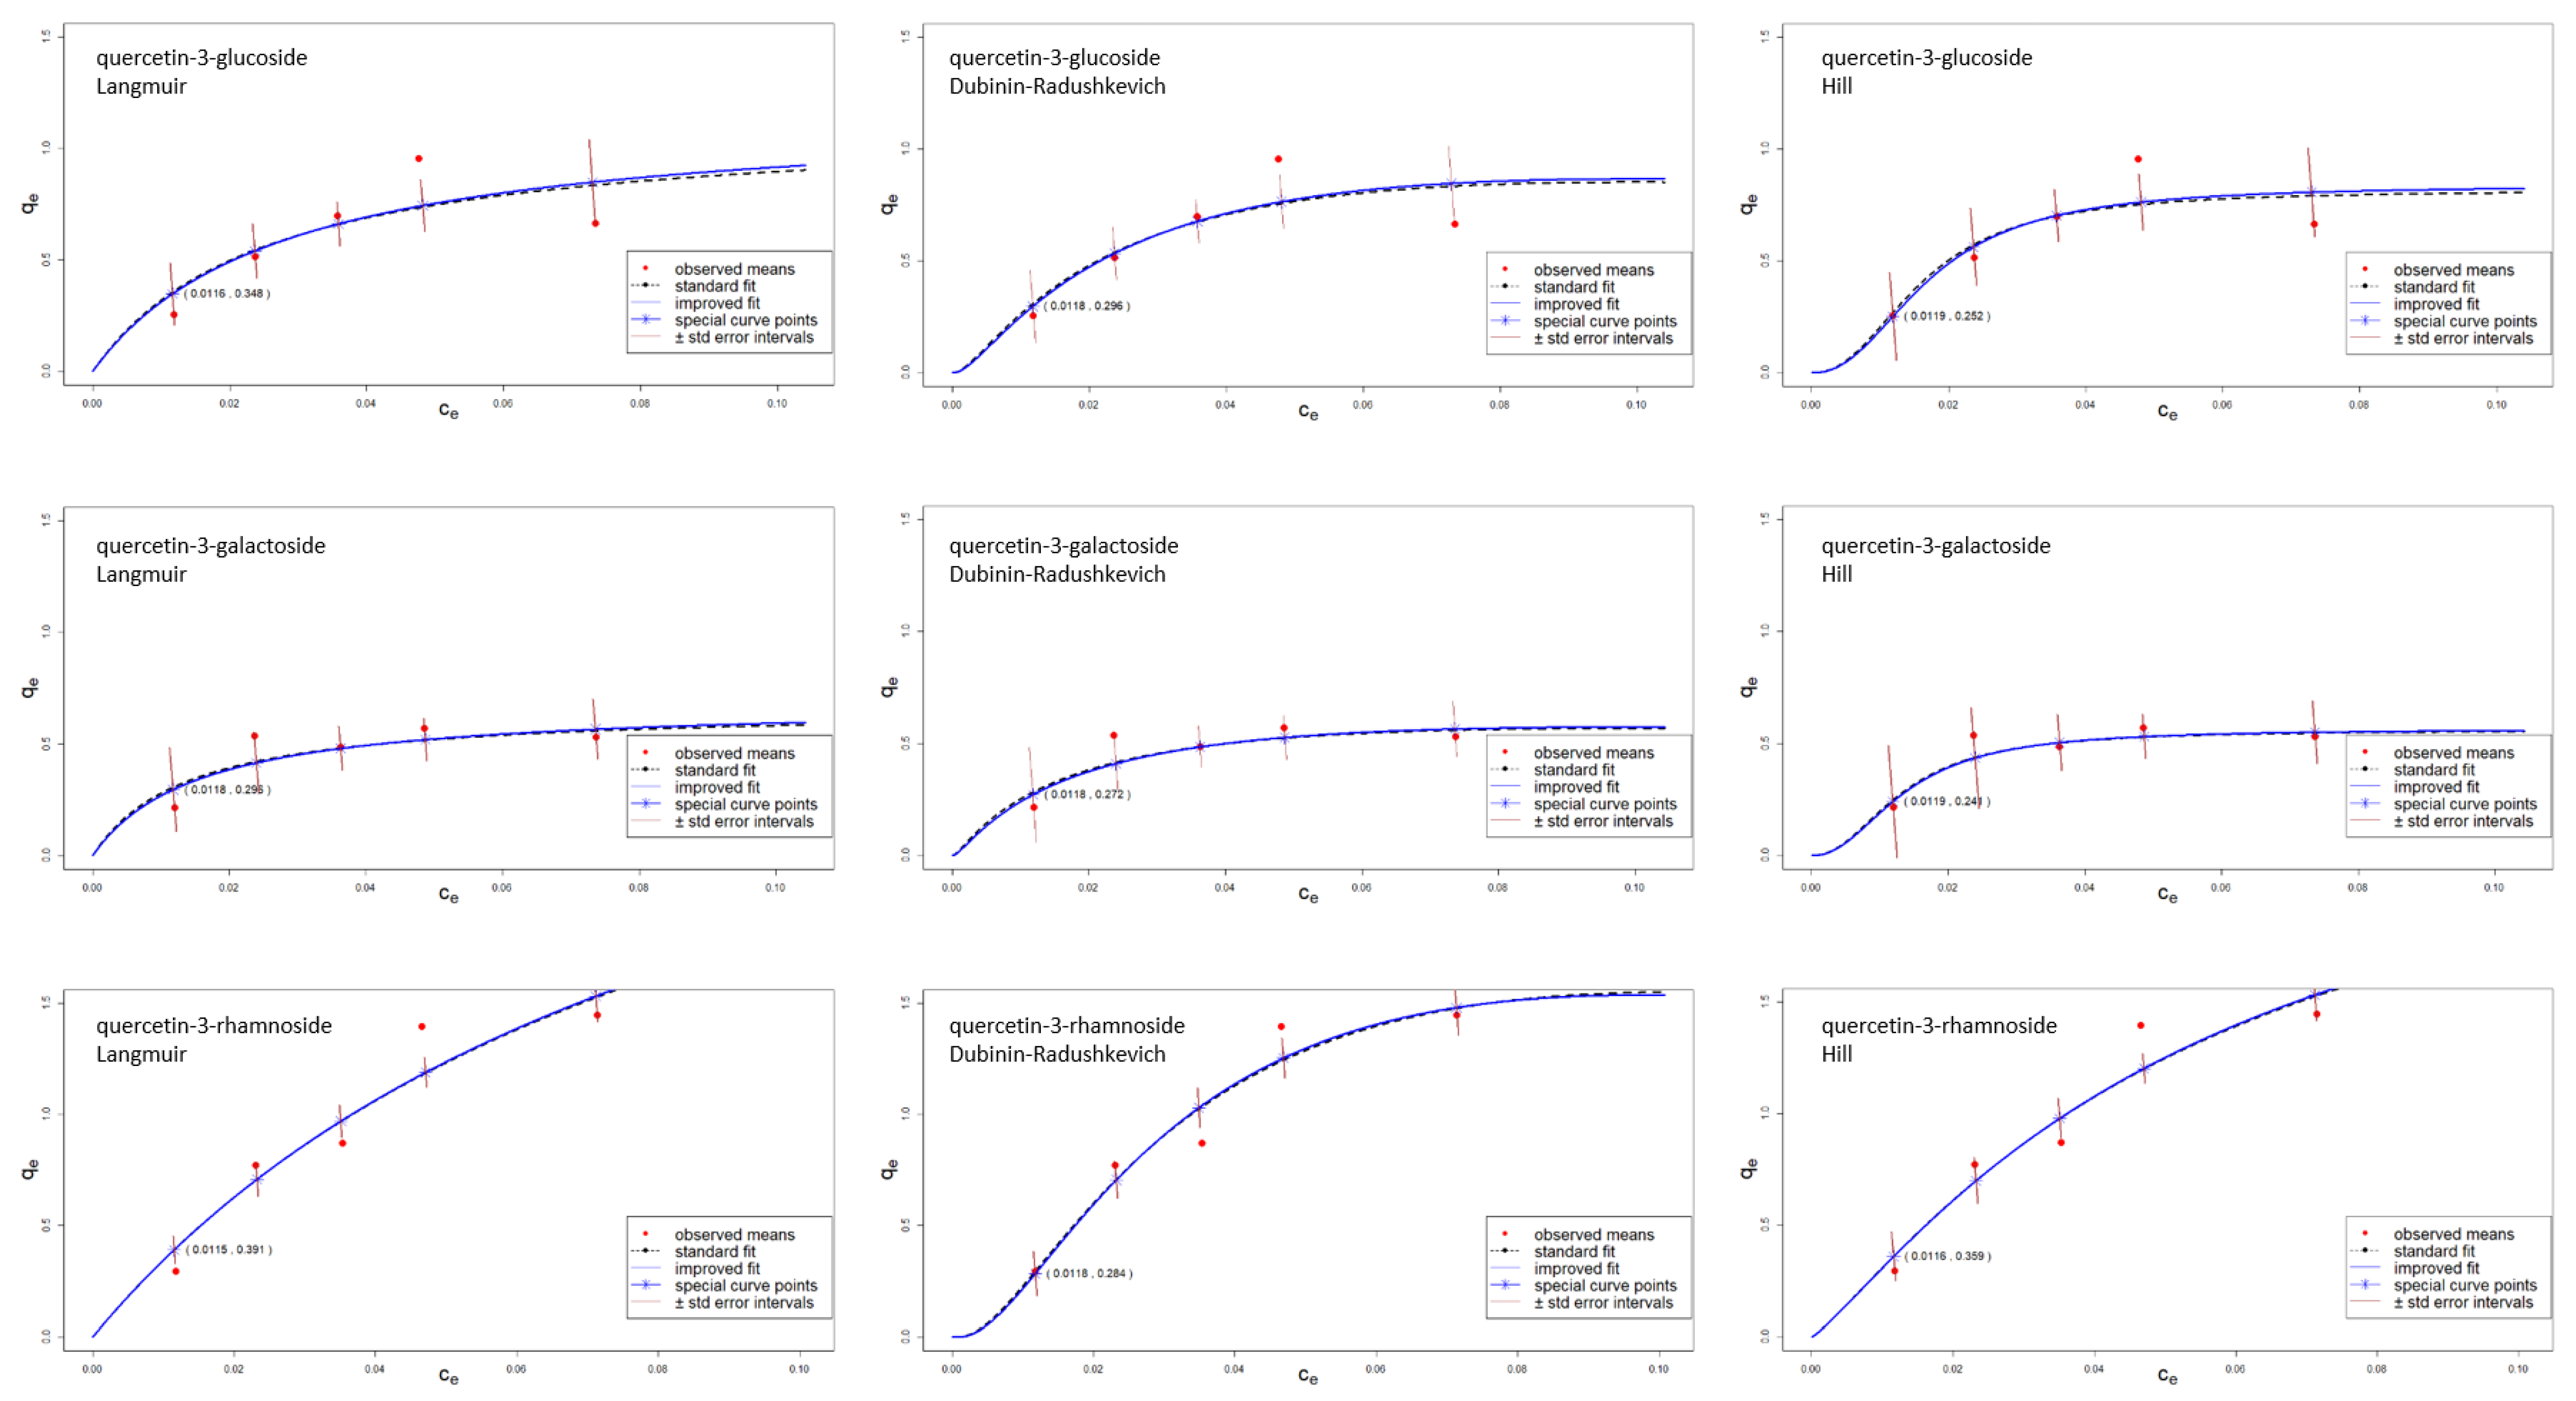
In the adsorption study, each quercetin derivative concentration was made in two replicates and measured three times (six observations per concentration level) using the Folin-Ciocalteu method. The results (ce vs. qe) were modeled with adsorption isotherms using non-linear and linear regressions. Non-linear regression was performed using the MS Excel software add-inn called Solver (MS Excel, Redmond, Washington, USA). Linear regression was also done in MS Excel. To improve the modeling and to lower the error of models, a new form of improved non-linear regression was developed in the R programming language, and it was also applied to these data. This program confirmed the traditional non-linear least squares fits and provided the potential improved fits. The standard error of regression (se) of non-linear, linear, and improved non-linear least square regression was calculated according to the equation 12 where qe,meas and qe,model are (original or transformed) measured adsorption capacities and adsorption capacities calculated by the model, respectively, n is the total number of data points and a is the number of parameters of the model.
s e = ( i = 1 n ( q e ,   m e a s q e ,   m o d e l ) 2 ) ( n a )
What is distinct about the types of modeling is whether, as indicated, the q e ,   m o d e l is an evaluation of the model at ce (in standard non-linear regression) or at the special curve point where it crosses the diagonal (in improved non-linear regression).

3. Results

The linearity, limit of detection (LOD) and limit of quantification (LOQ) of the spectrophotometric Folin-Ciocalteu method, are presented in Table 1. According to the values of R2 (0.9932–0.9985), all quercetin derivative standards showed linear calibration curves in the studied range, with reasonably low LOD and LOQ.
Table 2 shows the amounts of adsorbed quercetin derivatives (qe, mg/mg of β-glucan) for the initial concentration of quercetin derivatives 25 mg/L. All three quercetin derivatives adsorbed in similar amounts (0.30, 0.25 and 0.21 mg/mg, for quercetin-3-rhamnoside, quercetin-3-glucoside and quercetin-3-galactoside, respectively). The amounts of adsorbed quercetin derivatives are similar to the amounts of various polyphenols adsorbed onto β-glucan, which are reported in earlier studies [16,17]. Namely, Gao et al. (2012a) [16] reported the adsorption of tea polyphenols onto β-glucan in the amount of 0.156 to 0.405 mg/mg β-glucan, which is similar to our results. They also studied the adsorption of epigallocatechin gallate under various initial concentrations and the maximum adsorption capacity with higher epigallocatechin gallate concentration was around 0.25 mg/mg β-glucan [16]. Wu et al. (2011) [17] studied the adsorption of tea polyphenols onto β-glucan, and the influence of different pH values, buffer concentration and temperature onto adsorption. The highest adsorption capacity of tea polyphenols under various influences of pH, temperature and buffer concentrations was 0.116 mg/mg β-glucan which is also similar to our results. Furthermore, adsorption of various polyphenols onto different adsorbents like cellulose [7,10,11], cell wall material [34,35,36], pectin, xyloglucan, starch and cellulose [37], and resin [38] was also investigated. Since the amount of adsorbed polyphenols depends on the initial polyphenol concentration, pH value, buffer, and temperature, it is difficult to compare the adsorption capacities in these studies, but it can be seen that the adsorbed amount from those earlier studies [7,10,11,34,35,36,38] was in the range of the results of this study. The adsorption of apple polyphenols to apple cell walls was in the range of 0.14 and 0.58 mg/mg of cell walls, which is also similar to our study [39].
Quercetin adsorption was further studied with more initial quercetin derivative concentrations in order to collect the data to analyze with the adsorption isotherm equations. The results of the adsorption of quercetin derivatives with different initial concentrations are shown in Figure 1. The amount of adsorbed quercetin derivatives increases with increased initial concentration, as shown in previous studies [7,10,16]. Furthermore, it can still be seen that quercetin derivatives have very similar adsorption onto β-glucan. At higher concentrations, quercetin-3-rhamnoside adsorbed in somewhat higher concentrations than quercetin-3-glucoside and quercetin-3-galactoside.
Those results were further analyzed with Langmuir, Dubinin-Radushkevich and Hill adsorption isotherm equations using non-linear, improved non-linear and linear regression. To aid in understanding the improvement compared to standard non-linear regression consider Figure 2a. The data in the adsorption diagram (qe vs. ce) for one polyphenol concentration, measured several times are visible in the diagonal line corresponding to the conservation of mass constraint as previously mentioned. The value of qe predicted by the model (qe,model) should follow that constraint and be predicted on the diagonal line. However, the standard non-linear regression does not predict qe,model on that diagonal. Instead it drops vertically to a point that does not satisfy the mass constraint. In doing so, the standard non-linear regression residual is always larger than the improved non-linear regression residuals, for adsorption curves that are increasing functions of ce. Moreover, as long as the adsorption curve is strictly increasing, use of the standard least squares will produce incorrect fitted maximum adsorption capacities (qm and qs) that remain incorrect by a constant factor, even in the limit of a large number of experimental observations (this is its statistical inconsistency for the correlated error setting of adsorption curve fitting). The same remains true even for linear curve fitting, if the observations occur along the diagonals specified by the initial polyphenol concentrations.
Consequently, we developed the improved non-linear regression code in the R programming language that predicts the qe,model value at the intersection points of the curves and the diagonal lines of the data. Motivation for developing this improved way of non-linear modeling of adsorption data is not only that it gives smaller residuals, but also that it gives, for normal error distributions, a provably statistically efficient standard error asymptotically, superior to those of other consistent procedures. As an example of the novel non-linear regression consider Figure 2b. It shows the method in this study indeed produces the qe,model values at the intersections of the curve with the experimental data lines (the special curve points). These diagonal lines also can be seen in the confidence intervals of the model fits in Figure 2b.
From Figure 2b it can be seen that the difference between curves obtained with improved and standard fitting is not great. This occurs when the slope of the fitted curve is not great. For adsorption isotherm, the low slope condition occurs in the settings of large concentrations. The low slope condition also occurs when the maximum adsorption capacity is small relative to the slope of the diagonal, as is often the case for the data investigated here and in much of the cited literature [7,10,11,16,17,34,36,38]. Thus, the use of traditional non-linear regression is justified in those settings.
Finally, after fitting of the traditional non-linear and linear regressions, and the improved non-linear regression for the Langmuir, Dubinin-Radushkevich, and Hill isotherms, the models, their parameters, and errors were tabulated and shown in Table 3 and in Figure 3, Figure 4 and Figure 5.
All three models of adsorption isotherms could be applied to experimental data with these three types of modeling (Figure 3, Figure 4 and Figure 5). According to the model standard errors, usually the Langmuir models fit a little bit better to the experimental data (errors in non-linear modeling 0.248–0.330, in improved non-linear modeling 0.235–0.324, in linear modeling 0.156–0.410) (Table 3). This is similar to earlier studies [39]. However, errors in the Dubinin-Radushkevich (non-linear 0.246–0.339, improved non-linear 0.232–0.321, linear 0.256–0.360) and Hill models (non-linear 0.253–0.335, improved non-linear 0.240–0.331, linear 0.271–0.499) are similar (Table 3). This allow us to suggest that the parameters of all three models could be used in theoretical description of the adsorption process. Earlier studies of adsorption of polyphenols onto resins [40] or apple polyphenols onto apple cell walls [39] were also described by several adsorption isotherms, like in this study. Furthermore, comparing three different ways to model (non-linear, improved non-linear and linear regression), it can be noticed that improved non-linear regression gave models with the lower error (Lanmguir 0.235–0.324, Dubinin-Radushkevich 0.232–0.321, Hill 0.240–0.331) in comparison to standard non-linear (Lanmguir 0.248–0.330, Dubinin-Radushkevich 0.246–0.339, Hill 0.253–0.335) or linear (Lanmguir 0.156–0.410, Dubinin-Radushkevich 0.256–0.360, Hill 0.271–0.499) (Table 3). Therefore, this way of modelling potentially can give more accurate and precise models with more accurately determined model parameters. To check the models, the values of qe were calculated by using models obtained with improved non-linear modeling and the results qe,calc are shown in Table 2. The qe,calc gave relatively good approximation of the measured qe.
Parameters obtained from these adsorption isotherms may theoretically be used to give some insight into the mechanism of the adsorption process, and, in our case, into the mechanism of interactions between quercetin derivatives and the dietary fiber, β-glucan. In particular, it is natural for the adsorption process to be described according to parameters obtained with the improved non-linear regression (Table 3) since improved fitting showed the lowest error. It should also be said that the parameter values are apparent and theoretical, but they allowed us to at least suggest the adsorption mechanism. According to the apparent, theoretical adsorption capacity (qm) from Langmuir and Hill isotherm or (qs) from Dubinin-Radushkevich isotherm, we can suggest which derivatives adsorbed more onto β-glucan or which have more tendency to adsorb. Glucoside and rhamnoside of quercetin could theoretically adsorb in higher amount than quercetin-3-galactoside (Table 3), which is similar to experimental results (Table 2). Furthermore, according to the mean free energy of adsorption (E), the adsorption could be a physical process (since E < 8000 J/mol) with creation of physical bonds between quercetin derivatives and β-glucan, such as Van der Waals bonds or H bonds. This agrees with earlier studies where it was suggested that hydrophobic interactions, hydrogen bonds and van der Waals interactions are the driving forces of adsorption process of polyphenols with β-glucan [16,17,22,23]. Hydrogen bonds between quercetin derivatives and β-glucan could occur through their -OH groups [17] and after the formation of hydrogen bonds, van der Waals interactions could be formed because the distance between the polyphenol molecule and β-glucan rings becomes short [17]. The same type of bonding could have happened between quercetin derivatives and β-glucan. Furthermore, the mean free adsorption energy (E) was the highest for quercetin-3-galactoside (4327 J/mol), followed by glucoside (3623 J/mol) and rhamnoside (2854 J/mol). This suggests that the mean free energy of adsorption was higher for polyphenols which showed lower adsorption onto β-glucan (lower qe). Adsorption could be a cooperative process (nH > 1). When a molecule of quercetin derivative adsorbs to the surface of β-glucan, the affinity for other molecules changes.
Overall, the quercetin derivatives showed some differences in the adsorption onto β-glucan: the adsorption intensity and capacity were somewhat stronger for quercetin-3-rhamnoside and -glucoside which can be related to lower heat of adsorption. Indeed, due to the lower heat of adsorption, molecules of quercetin-3-rhamnoside and -glucoside may adsorb more easily on the surface of β-glucan. The different behavior of quercetin derivatives can be connected to their chemical structure which can influence adsorption capacity as shown in earlier studies [20,35]. Namely, all three glycoside molecules attached to main aglycon contain -OH groups, but their spatial arrangement is different (Figure 6). For this reason, the spatial arrangement of -OH groups in the sugar molecule might have an effect on the adsorption capacity and behavior in the adsorption process. The arrangement in glucose and rhamnose molecule might favor the adsorption onto β-glucan. The results of earlier studies have also shown that adsorption capacity depends on the chemical structure of polyphenols [20,35]. In particular, the effect of different glycosylation can have various effects on the properties of polyphenols, and also on the adsorption capacities. However, earlier study could not find definite correlation between glycosylation and adsorption [20].

4. Discussion

Adsorption process can be helpful in studying the interactions between bioactive compounds like polyphenols and food constituents such as dietary fiber. This can be seen in earlier studies [16,17,34,36,37]. Adsorption can be modeled with various adsorption isotherms. Particular adsorption isotherms, Langmuir and Dubinin-Radushkevich, are chosen for this study due to their use in earlier studies. Namely, the applicability of Langmuir models for adsorption of polyphenols onto β-glucan [16,17], polyphenols from apples onto resin [38], apple procyanidins onto apple cell wall material [34,36,37], various polyphenols onto cellulose and xylan [9], various polyphenols onto cellulose [10] has been reported. Then Dubinin-Radushkevich isotherm was used to model the adsorption of polyphenols onto tannery shavings [18]. In addition, we also chose to use Hill adsorption isotherm.
Adsorption isotherms could give some theoretical information about adsorption process and finally, about interactions. Namely, the Langmuir model describes a monolayer adsorption at the surface of the adsorbent and when the molecules occupy the specific site on the surface, no further adsorption on that place is possible [17,18,41]. Furthermore, it assumes that the adsorbent has a limited adsorption capacity and that all binding sites at adsorbent have the same affinity toward molecules from solution [41]. The Dubinin-Radushkevich model describes an adsorption process on a heterogeneous surface and it can be used to calculate mean free energy to distinguish between physical and chemical adsorption [28]. Hill isotherm can describe the adsorption of different molecules onto some adsorbents and help to describe the differences between molecules in terms of cooperative or non-cooperative bonding [28].
To obtain information from isotherms and their parameters, isotherms must be properly fitted to experimental results. The fitting of experimental results (qe vs. ce) to isotherms often depends on the modeling methodology. Proper modeling can give lower error between experimental results (qe) and the fitted adsorption isotherms (qe,model). If results are fitted with lower errors, the qe,model values will be closer to experimental values and adsorption can be better interpreted. Quality fitting and interpretation of adsorption can be achieved by non-linear and linear regression. In some papers, the adsorption data were analyzed with non-linear regression [7,9,10,17,34,36,37] and in some with the use of linear regression [18]. Between those two types of modeling, non-linear has shown advantages, since linear fitting have already shown many constrictions [28]. That is why the use of non-linear fitting is more common [28]. A potential difficulty with the linearized forms is that the transformed forms of c e and q e do not retain the structure of variability of the original forms, and consequently there can be a loss of statistical efficiency with the use of the least squares procedure with the linearized forms. This can be observed in larger errors in the fitted parameters and the fitted isotherm curves. We investigated and compared both types of modeling, non-linear and linear. To improve the fitting and to get lower error and more reliable isotherms and their parameters, we also developed and used an improved non-linear modeling for the first time.
Novel, improved non-linear fitting gave lower errors (Table 3), as theoretically predicted (Figure 2). Namely, the theory predicted that the error of the model should be lower if the fitted qe,model value is on the −45 degrees line corresponding to the conservation of mass. Indeed, the improved non-linear fitting predicts the qe,model value on this diagonal line and does give lower error (Table 3). Although the differences between errors obtained with improved non-linear fitting, traditional non-linear and linear were not so big, they can still point to more proper fitting of the novel methodology. So, the parameters of adsorption isotherms obtained by improved non-linear fitting could be used to describe the adsorption. In addition, the errors for Langmuir, Dubinin-Radushkevich, and Hill isotherms were similar (a little bit lower for Langmuir, followed by Dubinin-Radushkevich and Hill), but we chose to use the parameters of all three isotherms for adsorption interpretation. Although the interpretation of isotherms and their parameters is theoretical, it can still give some insight into the adsorption process.
Finally, according to adsorption results and properly fitted isotherms, and obtained adsorption parameter, the adsorption of quercetin derivatives onto β-glucan is described as a physical process, with Van der Waals forces and H bonds created between quercetin derivatives and β-glucan. The adsorption of quercetin-3-rhamnoside and quercetin-3-glucoside is favorable, while quercetin-3-galactoside adsorbed in a somewhat lower amount. The spatial arrangements of OH groups on the quercetin derivative molecules affects adsorption.
The code developed for improved non-linear fitting can be applied in many areas where the adsorption is studied. Adsorption is often used in studying environmental processes such as the adsorption of environmentally harmful gases [42,43], the adsorption of substances from water and wastewaters [44,45], the extraction of precious metals from electronic wastes [46], and adsorption-cooling systems [47]. The adsorption process is also important for new types of packaging like active packaging, where moisture is adsorbed by the active component situated within packaging material or in sachets inside packaging [48]. Studies of drug delivery complexes are often based on adsorption processes [49]. The widespread use of adsorption processes, in important areas such as ecology, packaging, environmental issues, and drug delivery, lends importance to newly developed code.

5. Conclusions

In this study, the adsorption of three quercetin derivatives (quercetin-3-glucoside, quercetin-3-galactoside, and quercetin-3-rhamnoside) onto β-glucan was studied. Quercetin derivatives adsorbed onto the β-glucan surface. In order to describe the adsorption process, the results of the adsorption were modeled with Langmuir, Dubinin-Radushkevich, and Hill adsorption isotherms using non-linear and linear regression. In addition, a code for an improved non-linear regression of isotherms was developed in the R programming language and was applied to all three adsorption isotherms. Isotherms obtained by the improved non-linear regression showed somewhat lower errors which allowed us to suggest that this new non-linear regression could be a very helpful too in the interpretation of adsorption isotherms. Using adsorption isotherms obtained with improved regression, and using experimental data, it can be suggested that among the investigated quercetin derivatives, β-glucan showed a little bit higher adsorption capacity for quercetin-3-rhamnoside and quercetin-3-glucoside, and lower for quercetin-3-galactoside. The observed adsorption is probably indeed a physical adsorption process. Moreover, it seems that spatial arrangement of the -OH group in the sugar molecule of quercetin derivatives may have an effect on the adsorption capacity.

Author Contributions

Conceptualization, L.J. and A.R.B.; experimental methodology, P.M., Š.K.; statistical methodology, A.R.B. and M.B.; software, A.R.B.; validation, P.M. and Š.K.; writing—original draft preparation, L.J., A.R.B., Š.U. and P.M.; writing—review and editing, L.J., A.R.B., M.B.; visualization, L.J. and A.R.B.; supervision, L.J. All authors have read and agreed to the published version of the manuscript.

Funding

This research was funded by Croatian Science Foundation, grant number IP-2016-06-6777 and grant number IP-2016-06-6545.

Conflicts of Interest

The authors declare no conflict of interest. The funders had no role in the design of the study; in the collection, analyses, or interpretation of data; in the writing of the manuscript, or in the decision to publish the results.

References

  1. Camouse, M.M.; Hanneman, K.K.; Conrad, E.P.; Baron, E.D. Protective effects of tea polyphenols and caffeine. Expert Rev. Anticanc. 2005, 5, 1061–1068. [Google Scholar] [CrossRef]
  2. Kampa, M.; Nifli, A.P.; Notas, G.; Castanas, E. Polyphenols and cancer growth. Rev. Physiol. Biochem. Pharm. 2007, 159, 79–113. [Google Scholar]
  3. Pandey, K.B.; Rizvi, S.I. Plant polyphenols as dietary antioxidants in human health and diseases. Oxid. Med. Cell Longev. 2009, 2, 270–278. [Google Scholar] [CrossRef] [PubMed] [Green Version]
  4. Jakobek, L. Interactions of polyphenols with carbohydrates, lipids and proteins. Food Chem. 2015, 175, 556–567. [Google Scholar] [CrossRef] [PubMed]
  5. Le Bourvellec, C.; Renard, C.M.G.C. Interactions between polyphenols and macromolecules: Quantifications methods and mechanism. Crit. Rev. Food Sci. 2012, 52, 213–248. [Google Scholar] [CrossRef] [PubMed]
  6. Gómez-Mascaraque, L.G.; Dhital, S.; López-Rubio, A.; Gidley, M.J. Dietary polyphenols bind to potato cells and cellular components. J. Funct. Food 2017, 37, 283–292. [Google Scholar] [CrossRef] [Green Version]
  7. Phan, A.D.T.; Flanagan, B.M.; D’Arcy, B.R.; Gidley, M.J. Binding selectivity of dietary polyphenols to different plant cell wall components: Quantification and mechanism. Food Chem. 2017, 233, 216–227. [Google Scholar] [CrossRef]
  8. Quirós-Sauceda, A.E.; Palafox-Carlos, H.; Sáyago-Ayerdi, S.G.; Ayala-Zavala, J.F.; Bello-Perez, L.A.; Alvarez-Parrilla, E.; de la Rosa, L.A.; González-Córdova, A.F.; González-Aguilar, G.A. Dietary fiber and phenolic compounds as functional ingredients: Interaction and possible effect after ingestion. Food Funct. 2014, 5, 1063–1072. [Google Scholar] [CrossRef]
  9. dos Santos Costa, T.; Rogez, H.; da Silva Pena, R. Adsorption capacity of phenolic compounds onto cellulose and xylan. Food Sci. Technol. 2015, 35, 314–320. [Google Scholar] [CrossRef] [Green Version]
  10. Phan, A.D.T.; Netzel, G.; Wang, D.; Flanagan, B.M.; D’Arcy, B.R.; Gidley, M.J. Binding of dietary polyphenols to cellulose: Structural and nutritional aspects. Food Chem. 2015, 171, 388–396. [Google Scholar] [CrossRef]
  11. Phan, A.D.T.; D’Arcy, B.R.; Gidley, M.J. Polyphenol-cellulose interactions: Effects of pH, temperature and salt. Int. J. Food Sci. Technol. 2016, 51, 203–211. [Google Scholar] [CrossRef]
  12. Laroche, C.; Michaud, P. New developments and prospective applications for β (1,3) glucans. Recent Pat. Biotechnol. 2007, 1, 59–73. [Google Scholar] [CrossRef] [PubMed]
  13. Chen, J.; Raymond, K. Beta-glucans in the treatment of diabetes and associated cardiovascular risks. Vasc. Health Risk Manag. 2008, 4, 1265–1272. [Google Scholar] [CrossRef] [PubMed] [Green Version]
  14. Kofuji, K.; Aoki, A.; Tsubaki, K.; Konishi, M.; Isobe, T.; Murata, Y. Antioxidant activity of β-glucan. ISRN Pharm. 2012, 2012, 125864. [Google Scholar] [PubMed] [Green Version]
  15. Queenan, K.M.; Stewart, M.L.; Smith, K.N.; Thomas, W.; Fulchner, R.G.; Slavin, J.L. Concentrated oat β-glucan, a fermentable fiber, lowers serum cholesterol in hypercholesterolemic adults in a randomized controlled trial. Nutr. J. 2007, 6, 1–8. [Google Scholar] [CrossRef] [Green Version]
  16. Gao, R.; Liu, H.; Peng, Z.; Wu, Z.; Wang, Y.; Zhao, G. Adsorption of (-)-epigallocatechin-3-gallate (EGCG) onto oat β-glucan. Food Chem. 2012, 132, 1936–1943. [Google Scholar] [CrossRef]
  17. Wu, Z.; Li, H.; Ming, J.; Zhao, G. Optimization of adsorption of tea polyphenols onto oat β-glucan using response surface methodology. J. Agric. Food Chem. 2011, 59, 378–385. [Google Scholar] [CrossRef]
  18. Marsal, A.; Maldonado, F.; Cuadros, S.; Bautista, M.E.; Manich, A.M. Adsorption isotherm, thermodynamics and kinetics studies of polyphenols onto tannery shavings. Chem. Eng. J. 2012, 183, 21–29. [Google Scholar] [CrossRef]
  19. Soto, M.L.; Moure, A.; Domínguez, H.; Parajó, J. Recovery, concentration and purification of phenolic compounds by adsorption: A review. J. Food Eng. 2011, 105, 1–27. [Google Scholar] [CrossRef]
  20. Wang, Y.; Liu, J.; Chen, F.; Zhao, G. Effects of molecular structure of polyphenols on their noncovalent interactions with oat β-glucan. J. Agric. Food Chem. 2013, 61, 4533–4538. [Google Scholar] [CrossRef]
  21. Gao, R.; Wang, Y.; Wu, Z.; Ming, J.; Zhao, G. Interaction of barley β-glucan and tea polyphenols on glucose metabolism in streptozotocin-induced diabetic rats. J. Food Sci. 2012, 77, H128–H134. [Google Scholar] [CrossRef]
  22. Simonsen, H.T.; Nielsen, M.S.; Christensen, N.J.; Christensen, U.; La Cour, T.V.; Motawia, M.S.; Jespersen, B.P.M.; Engelsen, S.B.; Møller, B.L. Molecular interactions between barley and oat β-glucans and phenolic derivatives. J. Agric. Food Chem. 2009, 57, 2056–2064. [Google Scholar] [CrossRef]
  23. Veverka, M.; Dubaj, T.; Gallovič, J.; Jorík, V.; Veverková, E.; Mičušik, M.; Šimon, P. Beta-glucan complexes with selected nutraceuticals: Synthesis, characterization, and stability. J. Funct. Food 2014, 8, 309–318. [Google Scholar] [CrossRef]
  24. Jakobek, L.; Ištuk, J.; Buljeta, I.; Voća, S.; Šic Žlabur, J.; Skendrović, B.M. Traditional, Indigenous apple varieties, a fruit with potential for beneficial effects: Their quality traits and bioactive polyphenol contents. Foods 2020, 9, 52. [Google Scholar] [CrossRef] [PubMed] [Green Version]
  25. Fuentes, J.; Arias-Santé, M.F.; Atala, E.; Pastene, E.; Kogan, M.J.; Speisky, H. Low nanomolecular concentrations of a quercetin oxidation product, which naturally occurs in onion peel, protects cells against oxidative damage. Food Chem. 2020, 126166. [Google Scholar] [CrossRef] [PubMed]
  26. Babaeivelni, K.; Khodadoust, A.P. Adsorption of fluoride onto crystalline titanium dioxide: Effect of pH, ionic strength, and co-existing ions. J. Colloid Interf. Sci. 2013, 394, 419–427. [Google Scholar] [CrossRef]
  27. Dalal, R.C. Application of Dubinin-Radushkevich adsorption isotherm for phosphorus sorption by soils. Soil Sci. 1979, 128, 65–69. [Google Scholar] [CrossRef]
  28. Foo, K.Y.; Hameed, B.H. Insight into the modeling of adsorption isotherm systems. Chem. Eng. J. 2010, 156, 2–10. [Google Scholar] [CrossRef]
  29. Samatya, S.; Kabay, N.; Yüksel, Ü.; Arda, M.; Yüksel, M. Removal of nitrate from aqueous solution by nitrate selective ion exchange resins. React. Functpolym. 2006, 66, 1206–1214. [Google Scholar] [CrossRef]
  30. Barron, A.; Benšić, M.; Buljeta, I.; Jakobek, L. A statistically accurate algorithm for fitting adsorption isotherms with application to the interaction between polyphenols and β-glucan. In Book of abstract of 13th World Congress on Polyphenols Applications, Valletta, Malta, 30 September to 1 October 2019; Shieber, A., Ed.; International Society f Antioxidants in Nutrition and Health: Paris, France, 2019; p. 69. [Google Scholar]
  31. Jakobek, L.; Matić, P.; Barron, R.A. The application of adsorption isotherms with proper fitting to interpret polyphenol bioaccessibility in vitro. In Book of abstract of Euro-Global Conference on Food Science, Agronomy and Technology, Rome, Italy, 20–22 September 2018; Magnus Group: London, UK, 2018; p. 61. [Google Scholar]
  32. Singleton, V.L.; Orthofer, R.; Lamuela-Raventós, R.M. Analysis of total phenols and other oxidation substrates and antioxidants by means of Folin-Ciocalteu reagens. Method Enzym. 1999, 299, 152–178. [Google Scholar]
  33. Matić, P.; Sabljić, M.; Jakobek, L. Validation of spectrophotometric methods for the determination of total polyphenol and total flavonoid content. J. Aoac. Int. 2017, 100, 1795–1803. [Google Scholar] [CrossRef] [PubMed]
  34. Renard, C.M.G.C.; Baron, A.; Guyot, S.; Drilleau, J.F. Interactions between apple cell walls and native apple polyphenols: Quantification and some consequences. Int. J. Biol. Macromol. 2001, 29, 115–125. [Google Scholar] [CrossRef]
  35. Le Bourvellec, C.; Guyot, S.; Renard, C.M.G.C. Non-covalent interaction between procyanidins and apple cell wall material part I. Effect of some environmental parameters. Biochim. Biophys. Acta 2004, 1672, 192–202. [Google Scholar] [CrossRef] [PubMed]
  36. Le Bourvellec, C.; Renard, C.M.G.C. Non-covalent interaction between procyanidins and apple cell wall material. Part II: Quantification and impact of cell wall drying. Biochim. Biophys. Acta 2005, 1725, 1–9. [Google Scholar] [CrossRef] [PubMed]
  37. Le Bourvellec, C.; Bouchet, B.; Renard, C.M.G.C. Non-covalent interaction between procyanidins and apple cell wall material. Part III; Study on model polysaccharides. Biochim. Biophys. Acta 2005, 1725, 10–18. [Google Scholar] [CrossRef]
  38. Kammerer, D.R.; Saleh, Z.S.; Carle, R.; Stanley, R.A. Adsorptive recovery of phenolic compounds from apple juice. Eur. Food Res. Technol. 2007, 224, 605–613. [Google Scholar] [CrossRef]
  39. Liu, D.; Lopez-Sanchez, P.; Martinez-Sanz, M.; Gilbert, E.P.; Gidley, M.J. Adsorption isotherm studies on the interaction between polyphenols and apple cell walls: Effects of variety, heating and drying. Food Chem. 2019, 282, 58–66. [Google Scholar] [CrossRef]
  40. Zhang, Y.; Wang, B.; Jia, Z.; Scarlett, C.J.; Sheng, Z. Adsorption/desorption characteristics and enrichment of quercetin, luteolin and apigenin from Flos populi using macroporous resin. Rev. Bras. Farm. 2019, 29, 69–76. [Google Scholar] [CrossRef]
  41. Limousin, G.; Gaudet, J.P.; Charlet, L.; Szenknect, S.; Barthès, V.; Krimissa, M. Sorption isotherms: A review on physical bases, modeling and measurement. Appl. Geochem. 2007, 22, 249–275. [Google Scholar] [CrossRef]
  42. Ursueguía, D.; Díaz, E.; Ordóñez, S. Adsorption of methane and nitrogen on basolite mofs: Equilibrium and kinetic studies. Micropor. Mesopor. Mat. 2020, 298, 110048. [Google Scholar] [CrossRef]
  43. Wang, R.; Wang, Q.; Niu, Q.; Pan, J.; Wang, H.; Wang, Z. CO2 adsorption and swelling of coal under constrained conditions and their stagechange relationship. J. Nat. Gas. Sci. Eng. 2020, 76, 103205. [Google Scholar] [CrossRef]
  44. Li, P.; Gao, B.; Li, A.; Yang, H. Evaluation of the selective adsorption of silica-sand/anionizedstarch composite for removal of dyes and Cupper(II) from their aqueous mixtures. Int. J. Biol. Macromol. 2020, 149, 1285–1293. [Google Scholar] [CrossRef] [PubMed]
  45. Han, F.; Zong, Y.; Jassby, D.; Wang, J.; Tian, J. The interactions and adsorption mechanisms of ternary heavy metals on boron nitride. Environ. Res. 2020, 109240. [Google Scholar] [CrossRef] [PubMed]
  46. Gao, X.; Liu, J.; Li, M.; Guo, C.; Long, H.; Zhang, Y.; Xin, L. Mechanistic study of selective adsorption and reduction of Au (III) to gold nanoparticles by ion-imprinted porous alginate microspheres. Chem. Eng. J. 2020, 385, 123897. [Google Scholar] [CrossRef]
  47. Shabir, F.; Sultan, M.; Miyazaki, T.; Saha, B.B.; Askalany, A.; Ali, I.; Zhou, Y.; Ahmad, R.; Shamshiri, R.R. Recent updates on the adsorption capacities of adsorbent-adsorbate pairs for heat transformation applications. Renew. Sust. Energ. Rev. 2020, 119, 109630. [Google Scholar] [CrossRef]
  48. Gaona-Forero, A.; Agudelo-Rodríguez, G.; Herrera, A.O.; Castellanos, D.A. Modeling and simulation of an active packaging system with moisture adsorption for fresh produce. Application in ‘Hass’ avocado. Food Packag. Shelf. 2018, 17, 187–195. [Google Scholar] [CrossRef]
  49. Yang, A.; Liu, H.; Li, Z.; Li, L.; Li, W.; Liu, K. Green synthesis of β-cyclodextrin metal-organic frameworks and the adsorption of quercetin and emodin. Polyhedron 2019, 159, 116–126. [Google Scholar] [CrossRef]
Figure 1. Adsorption of quercetin derivatives onto β-glucan.
Applsci 10 01637 g001
Figure 2. (a) Theory of non-linear regression of adsorption data with standard non-linear regression and novel improved non-linear regression. (b) amplified figure of example of novel improved non-linear regression of Dubinin-Radushkevich isotherms (quercetin-3-galactoside adsorption onto β-glucan).
Applsci 10 01637 g002
Figure 3. Langmuir, Dubinin-Radushkevich and Hill isotherms of quercetin derivatives adsorption onto β-glucan obtained with standard non-linear regression.
Applsci 10 01637 g003
Figure 4. Langmuir, Dubinin-Radushkevich, and Hill isotherms of quercetin derivatives adsorption onto β-glucan obtained with novel improved non-linear regression (with reported qe,model at the lowest ce value) (the confidence intervals are ±1 standard errors of the model fits).
Applsci 10 01637 g004
Figure 5. Langmuir, Dubinin-Radushkevich and Hill isotherms of quercetin derivatives adsorption onto β-glucan obtained with linear regression.
Applsci 10 01637 g005
Figure 6. Chemical structures of quercetin derivatives.
Applsci 10 01637 g006
Table 1. Linearity, limit of detection (LOD), limit of quantification (LOQ) of Folin-Ciocalteu spectrophotometric method for the determination of quercetin derivatives.
Quercetin DerivativeRange
mg L−1
Equationr2LOD
mg L−1
LOQ
mg L−1
quercetin-3-glucoside1–200Y = 0.001x + 0.00550.99721.173.54
quercetin-3-galactoside1–100Y = 0.001x + 0.00310.99320.220.67
quercetin-3-rhamnoside1–200Y = 0.0013x + 0.000030.99850.170.52
Results are based on two replicate samples of each standard concentration, each measured twice (n = 4).
Table 2. Quercetin derivative adsorption capacities (qe) and adsorption capacities calculated from the adsorption isotherm model (qe,calc) (modeled with improved non-linear modeling).
Quercetin Derivative LangmuirDubinin-RadushkevichHill
qeqe(calc)qe(calc)qe(calc)
(mg/mg)(mg/mg)(mg/mg)(mg/mg)
quercetin-3-glucoside0.25 ± 0.050.350.300.25
quercetin-3-galactoside0.21 ± 0.190.300.280.24
quercetin-3-rhamnoside0.30 ± 0.070.400.270.35
Table 3. Parameters of adsorption isotherms of quercetin derivatives adsorption onto β-glucan obtained from non-linear * (standard and improved) and linear * equation of Langmuir’s, Dubinin-Radushkevich’s and Hill’s equations.
Quercetin-derivativesLangmuirDubinin-RadushkevichHill
qm
(mg/mg)
KL
(1/mg)
seqs
(mg/mg)
cs
(mg)
E
(J/mol)
seqm
(mg/mg)
nHKD
(mg)nH
se
Nonlinear modeling
quercetin-3-glucoside1.1239.90.3300.850.137210.3390.822.230.0001030.335
quercetin-3-galactoside0.6673.00.3240.570.144830.3350.562.150.0000910.334
quercetin-3-rhamnoside3.4711.00.2481.550.129090.2462.671.180.03310.253
Improved nonlinear modeling
quercetin-3-glucoside1.1736.40.3240.870.136230.3180.842.260.0001030.328
quercetin-3-galactoside0.6964.30.3220.580.143270.3210.572.170.0000910.331
quercetin-3-rhamnoside3.5110.90.2351.540.09828540.2322.691.190.03310.240
Linear modeling
quercetin-3-glucoside0.7536.00.4100.740.135360.357 0.410.3310.499
quercetin-3-galactoside0.5224.80.4040.500.131620.360 0.150.6960.439
quercetin-3-rhamnoside3.729.30.1561.510.128870.256 1.240.0490.271
qm is the apparent maximum adsorption capacity of β-glucan (mg of polyphenols per mg of β-glucan), KL is the Langmuir equilibrium constant of adsorption (1/mg), apparent affinity constant, qs is theoretical saturation capacity of β-glucan (mg/mg), cS is the theoretical saturation concentration or solubility (mg), E is sorption mean free energy of adsorption (J/mol), nH is Hill cooperativity coefficient of the binding interaction, KD is Hills constant (mg)nH and se is the standard error. * standard non-linear and linear modeling performed in excel, improved non-linear performed in R program.

