Abstract
Cerium-oxide-nanoparticle-decorated zinc oxide was successfully prepared using a simple one-pot hydrothermal technique with different weight% Ce doping. It was found that an increase in Ce doping has an effect on the optical energy band-gap tunability. Ce dopant provides electron trapping on Ce/ZnO nanocomposites and also acts as a surface defect generator during hydrothermal processing. Additionally, a bi-metal oxide heterojunction forms, which acts as a charge separator to obstruct charge recombination and to increase the photodegradation performance. It was found that the methyl orange (MO) degradation performance improved with an increase in Ce doping. The decomposition of MO went from 69.42% (pristine ZnO) to 94.06% (7% Ce/ZnO) after 60 min under fluorescent lamp illumination.
1. Introduction
Over the past few decades, water pollutants in the environment, such as polluted water from dye-stuffs and the textile industry, have become a serious environmental problem. The release of excess dyes into water sources affects both human life and the biosphere. Photocatalytic degradation is one of the most common techniques to effectively solve this problem due to its advantages (e.g., it is a simple, green technology using only sunlight and is effective for dye decontamination without adding a secondary pollutant). Wide-band-gap ZnO (3.37 eV [1]) metal oxide semiconductors have been widely applied for various applications, such as gas detectors [2,3,4], UV sensors [5,6,7], dye-sensitized solar cells [8,9], and photocatalysts [10,11], due to their low cost, environmental friendliness, excellent optical properties, good chemical stability, and catalytic activity [12,13,14,15]. However, pristine ZnO photocatalysts can absorb ultraviolet light, which accounts for only three percent of sunlight, andtheyit show fast charge recombination. These are major obstacles to increasing the photocatalytic activity of ZnO [16]. Noticeably, photocatalytic reaction is dependent on the optical band-gap energy, charge carrier concentration, and charge separation [16]. Many researchers have studied metal doping/co-doping with ZnO through different preparation techniques [17,18,19] to improve the photocatalytic degradation performance. Min et al. synthesized ZnO nanoparticles with copper doping by using a sol-gel technique for photocatalytic applications, and these showed higher methyl blue degradation (88%, 6 h) compared with undoped ZnO [20].
In recent years, rare-earth (RE) metals have been used as dopants in RE/ZnO; these include Er [21,22], Eu [23,24,25], Nd [26,27], Tm [28], and La [29,30,31]. Suwanboon et al. synthesized La-doped zinc oxide nanoparticles (La/ZnO NPs) using a precipitation and mechanical milling technique, and they investigated the blue-light-fluorescent-lamp-driven photodegradation activity of methyl blue. Photocatalysts based on La/ZnO NPs showed that the photocatalytic degradation performance improved with an increase in La doping, and the methyl orange (MO) degradation reached 93% after 120 min under light illumination [32]. Kumar et al. reported the enhanced photocatalytic decomposition of Rhodamine B dye by chemically synthesized Nd-doped ZnO powder. Introducing Nd into ZnO can induce defect formation (like antisite oxygen and interstitial oxygen) in Nd-doped ZnO powder, which would play an important role in trapping electron carriers and charge separation [33]. Presently, there are few research reports on Ce-doped ZnO nanocomposites for photocatalytic applications [34,35]. Shen et al. prepared the 3D flower-like mesoporous cerium–zinc oxide for sunlight-driven photodegradation of Rhodamine B (RhB), which showed 85.1% degradation in 125 min [36]. Overall, researchers reported that RE doping can generate different defects in RE/ZnO, which can tune the band gap to lower energy in order to use visible light as a light source instead of UV light. Additionally, RE ion dopants can prevent electron recombination by trapping electrons, thus improving photocatalytic activity.
In this manuscript, we report cerium-oxide-nanoparticle-decorated zinc oxide by using a simple one-pot hydrothermal process. The effects of Ce ion doping on surface morphology and composition and on optical properties were systematically studied. As-prepared cerium-oxide-nanoparticle-decorated zinc oxide was manipulated to evaluate the photodegradation activity of methyl orange (MO) under fluorescent lamp illumination.
2. Results and Discussion
The XRD patterns of pristine ZnO, CeO [37], and Ce/ZnO samples (3%, 5%, and 7% of Ce ions) are shown in Figure 1. It can be seen that the XRD pattern of pristine ZnO corresponds to the reflection planes of the wurtzite hexagonal ZnO phase (JCPDS No. 89-13971) [12], while as-synthesized Ce/ZnO samples show additional peaks corresponding to the reflection planes of the cubic-structured CeO (JCPDS No. 34-394) [38]. The lattice constants of ZnO and CeO crystals can be calculated from the X-ray diffraction (XRD) results using a space lattice equation [7,39]:
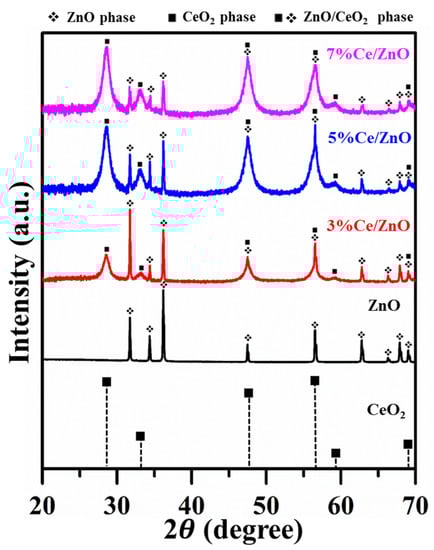
Figure 1.
X-ray diffraction patterns of pristine ZnO, CeO [37], and as-synthesized Ce/ZnO samples.
Cubic-structured CeO:
Wurtzite hexagonal ZnO:
where d is the spacing between planes of atoms and h, k, and l are miller indices. Here, a and c are the lattice constants of the crystal. The sizes of ZnO and CeO crystals can be calculated by Scherer’s equation [40]:
where t is average crystal size, is the X-ray wavelength, K is a dimensionless shape factor, is the broadening at half of the maximum intensity, and is Bragg’s angle. In the XRD results, it is clearly seen that the pristine ZnO sample is more crystalline compared to the as-prepared Ce/ZnO samples. In addition, it can be recognized that the impurity of CeO crystals is exhibited by the broadening peak of CeO crystals. Thus, from the XRD data, we can only determine the crystal size from the ZnO peak (calculated crystal sizes from several reflection planes of pristine ZnO and Ce/ZnO samples are shown in Table S1). The average crystal sizes and lattice constants are summarized in Table 1. As Ce ion doping increased, the intensity of the ZnO reflection plane decreased and became broader, while the intensity of the CeO reflection plane increased. Interestingly, even though the amount of zinc is higher than cerium, the intensity of the ZnO was lower than the intensity of the CeO. This is due to the scattering factors of zinc and cerium atoms [41]. That is, the Zn has a lower scattering factor compared with Ce in Ce/ZnO samples. The scattering factor (f) of an atom is governed by sin(/) ( is the scattering angle and is the wavelength of the X-ray) and the atomic number. Therefore, it could be said that heavier atoms can be detected more easily than lighter atoms in the crystal structure. Additionally, it can be seen that the crystal size of Ce/ZnO was reduced compared with that of pristine ZnO. This result agrees with a result obtained by L.L. Lu et al. [42]. Although Ce has a higher ionic radius compared with Zn, Ce ions possibly move into the ZnO matrix due to the low decomposition temperature of nitrate. Thus, Ce can enter/intermingle in the ZnO matrix and substitute for the Zn position to form CeO.

Table 1.
Lattice parameters, crystalline sizes, average particle sizes, and optical energy band gaps.
Figure 2 presents the surface morphology and composition of pristine ZnO and Ce/ZnO samples that were observed by field-emission scanning electron microscopy (FE-SEM). The pristine ZnO has a hexagonal rod-like structure with an average particle size of 432 nm (the Sixe distribution of pristine ZnO is shown in Figure S1). Ce ion doping had no effect on the shape of the Ce/ZnO. However, the average particle size of the Ce/ZnO showed an increase due to the introduction of Ce into the ZnO structure. HR-TEM was performed to gain deep insight into the crystal structure, growth direction, and elemental composition. HR-TEM images and SAED patterns of pristine ZnO and 7% Ce/ZnO are demonstrated in Figure 3. Based on the HR-TEM of pristine ZnO in Figure 3a, the interplanar spacing was measured to be 0.24 nm, corresponding to the (101) reflection plane of a wurtzite hexagonal ZnO structure. Additionally, the SAED pattern further confirmed the structure of pristine ZnO, as shown in Figure 3b. HR-TEM images and SAED patterns of ZnO with 7% Ce doping samples (Figure 3c,d) revealed the presence of ZnO and CeO in Ce/ZnO samples. Energy dispersive spectroscopy (EDS) mapping was also provided, as shown in Figure 3e. This strongly indicates the successful doping of Ce into the ZnO matrix.
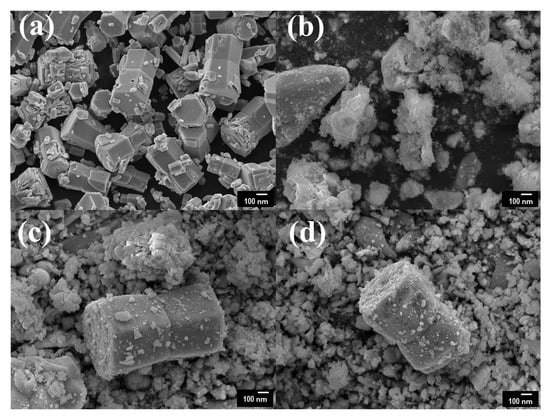
Figure 2.
Field-emission scanning electron microscopy (FE-SEM) images of (a) pristine ZnO, (b) 3% Ce/ZnO, (c) 5% Ce/ZnO, and (d) 7% Ce/ZnO samples.
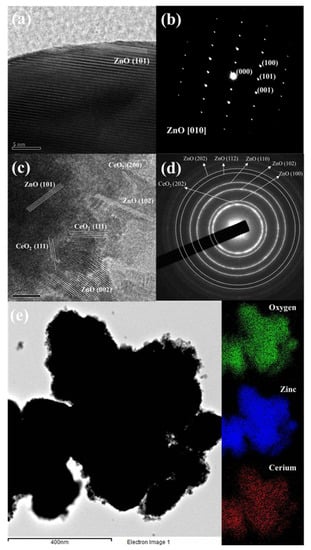
Figure 3.
HR-TEM images and SAED patterns of (a,b) pristine ZnO and (c,d) 7% Ce/ZnO nanocomposites; (e) energy dispersive spectroscopy (EDS) mapping of 7% Ce/ZnO samples.
The surface compositions and chemical states of pristine ZnO and 7% Ce/ZnO samples were clarified using X-ray photoelectron spectroscopy (XPS) as presented in Figure 4. The XPS survey (Figure 4a) reveals the respective elements with the corresponding characteristic peaks and compositions (Zn, Ce, O, and C). The summary of the XPS peak positions and the % area of ZnO and 7% Ce/ZnO samples are supplied in Table S2. The deconvoluted Zn 2p peak of pristine ZnO and Ce/ZnO was fitted with two Gaussian peaks corresponding to Zn 2p (1022.30 eV) and Zn 2p (1045.69 eV), as shown in Figure 4b. The deconvoluted O 1s peaks (Figure 4c) show two types of surface oxygen on pristine ZnO at 533.33 and 536.44 eV, which are associated with Zn and chemisorbed oxygens (surface hydroxyl groups) [43]. The 7% Ce/ZnO sample shows two peaks, i.e., the same as the pristine ZnO with an additional peak at 529.32 nm, which contributed to Ce/Ce ion bonding with oxygen due to the introduction of Ce into the ZnO lattice [44]. Figure 4d shows the deconvoluted Ce 3d peaks, which consist of binding energies, representing the integrated peaks of Ce (884.09, 889.53, 898.21, 900.62, 908.37, and 917.26 eV). No peaks related to Ce were noted, indicating the existence of Ce in the ZnO matrix [45]. Along with the XRD results, after Ce doping, the peak intensity of the ZnO crystal decreased and became broadened. It could be pointed out that the introduction of Ce into the ZnO matrix can cause impurity/defect formation.
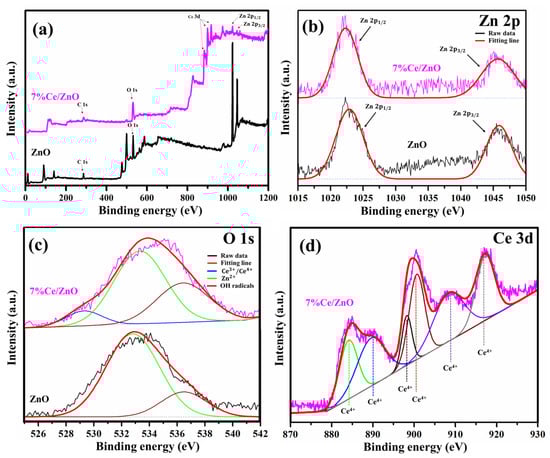
Figure 4.
X-ray photoelectron spectroscopy (XPS) spectra of pristine ZnO and 7% Ce/ZnO samples: (a) Survey spectrum and deconvoluted XPS spectrum of (b) Zn 2p, (c) O 1s, and (d) Ce 3d.
The optical properties of the pristine ZnO and Ce/ZnO samples were investigated by UV–visible spectroscopy. Figure 5a exhibits the absorption spectra of as-prepared Ce/ZnO with different % Ce doping. As shown in Figure 5, the absorption wavelength of pristine ZnO was observed at 365 nm. The absorption wavelength of Ce/ZnO shifted to lower wavelengths with an increase in Ce ion doping. The optical absorption coefficient () can be calculated as follows [12,46,47]:
where D is a constant which is called the band-tailing parameter, h is the photon energy, and E is the energy band gap. According to Equation (4), the energy band gap of as-prepared materials was calculated by conventional extrapolation of the plot of h and h at = 0, as shown in Figure 5b. The calculated energy band gaps of the pristine ZnO and Ce/ZnO samples are summarized in Table 1. It can be seen that the optical energy band gap of Ce/ZnO samples decreased with an increase in Ce ion doping from 3.06 (ZnO) to 2.22 eV (7% Ce/ZnO). This indicates that the Ce ion doping helps to tune a narrower optical energy band gap of Ce/ZnO compared to that of pristine ZnO, which tends to be beneficial for photocatalytic activity improvement.
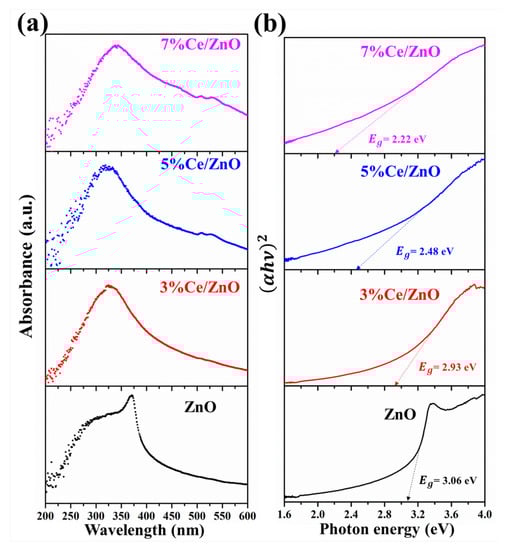
Figure 5.
UV–visible spectroscopy of the pristine ZnO and Ce/ZnO samples: (a) Absorption spectra and (b) optical band-gap energy.
Photoluminescence (PL) spectra were studied with the excitation wavelength of 325 nm at room temperature. As shown in Figure 6, the PL spectra of the pristine ZnO and Ce/ZnO samples show an emission peak in the UV region of 387 nm, accompanied by two weaker peaks at 443 and 489 nm. The UV emission can be attributed to the band-to-band radiation of pristine ZnO, which is responsible for photogenerated electron–hole recombination. Two weaker broad emission peaks, which are located in the visible region from 425 to 500 nm, correspond to impurities in the ZnO structure, such as oxygen vacancies and interstitial oxygen [12]. However, luminescent quenching of the Ce/ZnO samples was observed in the order of 7% Ce/ZnO > 5% Ce/ZnO > 3% Ce/ZnO > pristine ZnO. This suggests that an increase in Ce ion doping can reduce charge carrier recombination. Regarding the results, the decreasing charge recombination could be caused by the existence of more defects/oxygen vacancies and the heterojunction between CeO and ZnO.
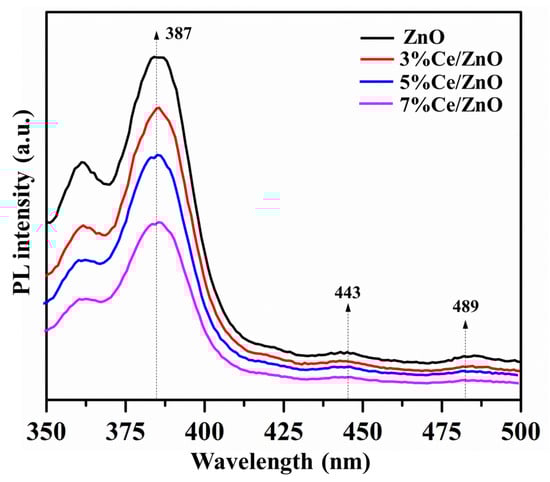
Figure 6.
The photoluminescence spectra of the pristine ZnO and Ce/ZnO samples.
The photocatalytic activities of the pristine ZnO and Ce/ZnO catalysts were evaluated in terms of the degradation of MO under a fluorescent lamp. The fluorescent lamp as a light source contributes to the UV and visible light emissions, as shown in Figure S2. The overlapping area between fluorescent lamp emission and MO absorption was expected to provide photons for photocatalytic reactions. MO degradation was measured by observing the change in the adsorption spectra of MO at 464 nm, as shown in Figure 7. The percentage of MO photodegradation was calculated using the formula [29];
where A and A are the initial and final absorbances of MO, respectively. The percentage of MO photodegradation with different Ce ion doping was calculated and tabulated in Table 2. Photocatalysts based on Ce/ZnO showed higher photocatalytic activity, which can degrade 94.06% of MO after 60 min. In contrast, the photocatalysts based on pristine ZnO can degrade 69.42% of MO. The results suggest an improvement of MO photocatalytic degradation due to an increase in Ce ion doping.
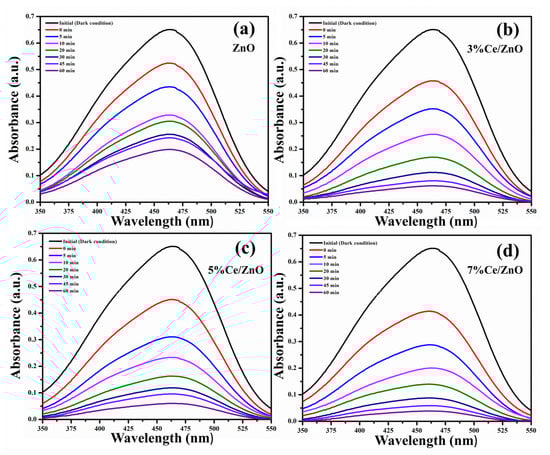
Figure 7.
Change in absorption spectra of the (a) pristine ZnO, (b) 3% Ce/ZnO, (c) 5% Ce/ZnO, and (d) 7% Ce/ZnO catalysts during photodegradation of methyl orange.
Table 2.
Summary of the first- and second-order kinetic adsorption rate constants and correlation coefficients of photocatalytic degradation of methyl orange based on the pristine ZnO and Ce/ZnO catalysts.
The mechanism and effectiveness of photodegradation of MO was studied though the kinetic adsorption. Figure 8 exhibits the variation in absorption of the MO solution with the presence of the pristine ZnO and Ce/ZnO samples as a function of illumination time, which was fitted to the first- and second-order kinetic adsorption models, as given by:
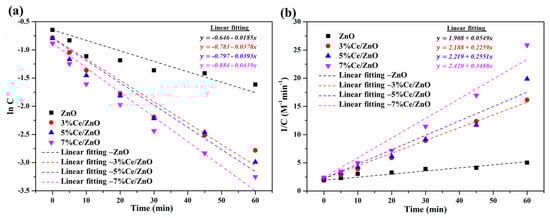
Figure 8.
(a) First- and (b) second-order kinetic adsorption curves of the pristine ZnO and Ce/ZnO catalysts during photodegradation of methyl orange.
First-order kinetic adsorption model:
Second-order kinetic adsorption model:
where C and C are the final and initial confirm absorptions of MO under fluorescent lamp illumination, respectively; k and k are the first- and second-order kinetic reaction rate constants; t is the fluorescent lamp illumination time. The summary of the calculated k, k, R, and R was tabulated, as shown in Table 2. It can be seen that the correlation coefficient of the first-order kinetic adsorption model showed a lower value compared with that of the second-order kinetic adsorption model. This indicates that the second-order kinetic model is more suitable and applicable for predicting a kinetic adsorption of photocatalysts in the presence of MO (Table 2). Variations in the reaction rate values indicate that an increase in Ce ion doping in Ce/ZnO catalysts improves the photodegradation reaction. The comparison of photocatalytic MO degradation activity based on Ce/ZnO catalysts is summarized in Table S3. Compared with other reports, our Ce/ZnO catalyst showed a higher photocatalytic activity performance and faster degradation time with 7% cerium.
A possible photocatalytic degradation mechanism of the Ce/ZnO catalysts is displayed in Figure 9. The band-edge positions of the conduction (E) and valence band (E) of metal-oxide semiconductors can be calculated using the equations [45]:
where X is the electronegativity of ZnO and CeO (5.79 for ZnO and 5.56 eV for CeO), E is the free electron energy on the hydrogen electrode scale (4.5 eV), and E is the band-gap energy (3.18 for ZnO and 3.00 eV for CeO). According to the conduction and valence band equations, the calculated E and E of ZnO were located at −0.30 and 2.88 eV. In contrast, the calculated E and E of CeO were located at −0.44 and 2.56 eV. A CeO/ZnO heterojunction forms due to the band-edge potentials between ZnO and CeO, which is beneficial for photocatalytic activity in terms of preventing charge recombination. Additionally, some Ce ions may have drifted to the surface of the ZnO, which can promote more trapped electrons by the reaction Ce + e → Ce. The product of this reaction can react with oxygen molecules to form superoxide radicals by the reaction Ce + O → Ce + O. The generated radicals (superoxide radicals and hydroxyl radicals) then degrade MO and produce oxidized organic products. As a result, it can be seen that an increase in Ce ion doping can improve the photodegradation reaction rate compared with pristine ZnO. We can draw a conclusion that Ce ion doping in Ce/ZnO plays an important role in providing narrower optical energy band-gap tunability and defect generation, such as oxygen vacancies and oxygen interstitials, which controls photocatalytic activity. Additionally, the CeO/ZnO heterojunction would provide a carrier pathway to separate photogenerated electron–hole pairs, obstructing charge recombination in Ce/ZnO.
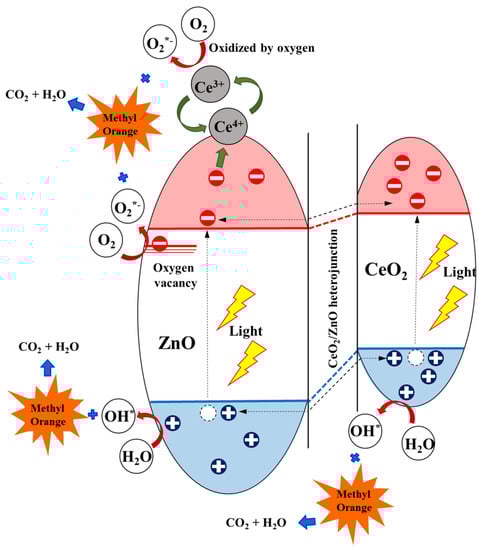
Figure 9.
Electron trapping and charge transfer for methyl orange (MO) degradation using the Ce/ZnO catalysts.
3. Experimental Details
Zinc nitrate hexahydrate (Zn(NO)6HO) was supplied from Sigma-Aldrich, Korea. Cerium nitrate hexahydrate (Ce(NO)6HO) and sodium hydroxide (NaOH) were obtained from Daejung Chemicals and Metals, Korea. Methyl orange (CHNNaOS) was supplied by Samchun Pure Chemical, Korea. Deionized water (DI) was utilized for all sample preparations and cleaning processes. All chemicals were used as received without further purification. The chemical materials and characterization instrument information are provided in the supplementary detail section.
3.1. Preparation of Ce/ZnO Nanocomposites
Cerium-oxide-nanoparticle-decorated zinc oxide was synthesized using a simple one-pot hydrothermal technique. Specifically, 3.25 g of zinc nitrate hexahydrate and pre-calculated amounts of 3,% 5%, and 7% Ce ion precursor (named 3%, 5%, 7% Ce/ZnO, respectively) were added in 120 mL of DI water. The mixed solution was stirred at 500 rpm for 20 min. Then, 1 g of NaOH solution (25 mg/mL in DI) was introduced drop-wise into the prepared solution until the pH reached 10 and the color turned into a milky color. Then, the mixed solution was transferred to a 200 mL Teflon-lined stainless steel autoclave and kept for 16 h under 160 °C. Then, samples were collected and washed several times by DI in order to remove unwanted ions. After that, samples were kept at 70 °C for 12 h in order dry.
3.2. Material Characterization
X-ray diffraction was performed to investigate the phase structures of the samples. Field emission scanning electron microscopy and high-resolution transmission electron microscopy were utilized to clarify the morphologies and crystalline structures. An X-ray photoelectron spectrometer was utilized to analyze the surface compositions and chemical states of samples. Optical properties were investigated using a UV–vis spectrometer. A PL spectrometer was used to characterize the charge recombination.
3.3. Evaluation of Photocatalytic Activity
The photocatalytic activity was measured by the degradation of methyl orange during light illumination. To assess the adsorption of methyl orange, 10 mg of sample powder was added to 50 mL of 10 ppm methyl orange under magnetic stirring at 500 rpm. After that, the mixed solution was placed in the dark for 20 min in order to provide an adsorption–desorption equilibrium. Then, a fluorescent lamp, used as a light source, was activated to examine the photocatalytic degradation for 1 h. After light illumination, 2 mL of a mixed solution was collected at specified time intervals and was filtered through a polytetrafluoroethylene filter (PTFE, pore size: 0.2 m). Then, the absorption spectra of the collected solution were investigated by UV–visible spectrometry.
4. Conclusions
Briefly, a simple one-pot hydrothermal technique was utilized to prepare cerium-oxide-nanoparticle-decorated zinc oxide for photocatalytic application. It was found that an increase in Ce doping does not affect the morphology of Ce/ZnO, which remains unchanged in comparison with the hexagonal wurtzite structures of pristine ZnO. XRD and XPS analyses revealed the existence of a cubic CeO phase and Ce ions in Ce-doped ZnO composite samples. Additionally, an increase in Ce doping in ZnO results in narrower optical energy band tunability and reduced charge recombination. When compared with pristine ZnO, the Ce/ZnO catalysts showed superior photocatalytic degradation of methyl orange, which increased from 69.42% (ZnO) to 94.06% (7% Ce/ZnO) under a fluorescent lamp illumination time of 60 min. This may be due to the Ce ions, which can trap more electrons, resulting in an increase in generated radicals. Moreover, CeO/ZnO heterojunctions were formed, which provide a carrier pathway to obstruct charge recombination and improve the photocatalytic degradation performance. Thus, cerium-oxide-nanoparticle-decorated zinc oxide has great potential as a material for water decontamination applications due to its simple synthesis, low-cost materials, and superior photocatalytic degradation performance.
Supplementary Materials
The following are available online at https://www.mdpi.com/2076-3417/10/5/1697/s1, Figure S1: FE-SEM image and size distribution of pristine ZnO, Figure S2: the emission spectrum of fluorescent lamp (compact fluorescent lamp) and absorption spectrum of MO, Table S1: Calculated crystal size from several reflection planes of pristine ZnO and Ce/ZnO samples, Table S1: XPS peak position and %area of ZnO and 7%Ce/ZnO nanocomposites, Table S3: The comparison of our work and other research in term of % degradation, illumination time, and reaction rate constant.
Author Contributions
This research study was carried out as a collaboration of the aforementioned authors and was supervised by J.S.C.; C.R. initiated the idea and planned the experiments; D.W. assisted in draft preparation; D.W., T.V.T., W.M.C., and S.H.H. helped in data analysis; C.R. wrote the manuscript, which was edited by J.S.C. and D.W. All authors have read and agreed to the published version of the manuscript.
Funding
This research was supported by the Basic Science Research Program through the National Research Foundation of Korea (NRF) by The Ministry of Science, ICT, and Future Planning (2019R1A2B5B02069683).
Conflicts of Interest
The authors declare no conflict of interest.
References
- Davis, K.; Yarbrough, R.; Froeschle, M.; White, J.; Rathnayake, H. Band gap engineered zinc oxide nanostructures via a sol–gel synthesis of solvent driven shape-controlled crystal growth. RSC Adv. 2019, 9, 14638–14648. [Google Scholar] [CrossRef]
- Santhaveesuk, T.; Shimanoe, K.; Suematsu, K.; Choopun, S. Size-Independent and Ultrahigh CO Gas Sensor Based on TiO2 Modified ZnO Tetrapods. Phys. Status Solidi (a) 2018, 215, 1700784. [Google Scholar] [CrossRef]
- Drobek, M.; Kim, J.H.; Bechelany, M.; Vallicari, C.; Julbe, A.; Kim, S.S. MOF-based membrane encapsulated ZnO nanowires for enhanced gas sensor selectivity. ACS Appl. Mater. Interfaces 2016, 8, 8323–8328. [Google Scholar] [CrossRef] [PubMed]
- Zhu, L.; Zeng, W. Room-temperature gas sensing of ZnO-based gas sensor: A review. Sens. Actuators A Phys. 2017, 267, 242–261. [Google Scholar] [CrossRef]
- Postica, V.; Paulowicz, I.; Lupan, O.; Schütt, F.; Wolff, N.; Cojocaru, A.; Mishra, Y.K.; Kienle, L.; Adelung, R. The effect of morphology and functionalization on UV detection properties of ZnO networked tetrapods and single nanowires. Vacuum 2019, 166, 393–398. [Google Scholar] [CrossRef]
- Acharya, S.; Biswal, S.; Sarangi, S. Effect of structure and morphology on the UV photo detection of ZnO nanostructures and microstructures. Chem. Phys. 2019, 523, 99–105. [Google Scholar] [CrossRef]
- Rodwihok, C.; Choopun, S.; Ruankham, P.; Gardchareon, A.; Phadungdhitidhada, S.; Wongratanaphisan, D. UV sensing properties of ZnO nanowires/nanorods. Appl. Surf. Sci. 2017, 477, 159–165. [Google Scholar] [CrossRef]
- Hezam, A.; Namratha, K.; Drmosh, Q.; Chandrashekar, B.N.; Jayaprakash, G.K.; Cheng, C.; Swamy, S.S.; Byrappa, K. Electronically semitransparent ZnO nanorods with superior electron transport ability for DSSCs and solar photocatalysis. Ceram. Int. 2018, 44, 7202–7208. [Google Scholar] [CrossRef]
- Marimuthu, T.; Anandhan, N.; Thangamuthu, R.; Surya, S. Facile growth of ZnO nanowire arrays and nanoneedle arrays with flower structure on ZnO-TiO2 seed layer for DSSC applications. J. Alloys Compd. 2017, 693, 1011–1019. [Google Scholar] [CrossRef]
- Seo, Y.S.; Oh, S.G. Controlling the recombination of electron-hole pairs by changing the shape of ZnO nanorods via sol-gel method using water and their enhanced photocatalytic properties. Korean J. Chem. Eng. 2019, 36, 2118–2124. [Google Scholar] [CrossRef]
- Farzadkia, M.; Rahmani, K.; Gholami, M.; Esrafili, A.; Rahmani, A.; Rahmani, H. Investigation of photocatalytic degradation of clindamycin antibiotic by using nano-ZnO catalysts. Korean J. Chem. Eng. 2014, 31, 2014–2019. [Google Scholar] [CrossRef]
- Rodwihok, C.; Wongratanaphisan, D.; Thi Ngo, Y.L.; Khandelwal, M.; Hur, S.H.; Chung, J.S. Effect of GO Additive in ZnO/rGO Nanocomposites with Enhanced Photosensitivity and Photocatalytic Activity. Nanomaterials 2019, 9, 1441. [Google Scholar] [CrossRef]
- Rodwihok, C.; Gardchareon, A.; Phadungdhitidhada, S.; Wongratanaphisan, D.; Choopun, S. Synthesis and Characterization of Vertically Aligned ZnO Nanowires by Chemical Vapor Deposition. Thai J. Phys. 2014, 25001, 1–3. [Google Scholar]
- Sucharitakul, S.; Panyathip, R.; Choopun, S. Effect of Annealing Temperature on ECD Grown Hexagonal-Plane Zinc Oxide. Materials 2018, 11, 1360. [Google Scholar] [CrossRef]
- Khaywimut, C.; Bhoomanee, C.; Choopun, S.; Ruankham, P. Effects of Ga Doping Concentration on Morphological and Optical Properties of Hydrothermally Grown ZnO Nanorods. Mater. Today Proc. 2019, 17, 1231–1239. [Google Scholar] [CrossRef]
- Li, W.; Wang, G.; Chen, C.; Liao, J.; Li, Z. Enhanced visible light photocatalytic activity of ZnO nanowires doped with Mn2+ and Co2+ ions. Nanomaterials 2017, 7, 20. [Google Scholar] [CrossRef]
- Kuriakose, S.; Satpati, B.; Mohapatra, S. Enhanced photocatalytic activity of Co doped ZnO nanodisks and nanorods prepared by a facile wet chemical method. Phys. Chem. Chem. Phys. 2014, 16, 12741–12749. [Google Scholar] [CrossRef]
- Khalid, N.; Hammad, A.; Tahir, M.; Rafique, M.; Iqbal, T.; Nabi, G.; Hussain, M. Enhanced photocatalytic activity of Al and Fe co-doped ZnO nanorods for methylene blue degradation. Ceram. Int. 2019, 45, 21430–21435. [Google Scholar] [CrossRef]
- Riaz, A.; Ashraf, A.; Taimoor, H.; Javed, S.; Akram, M.A.; Islam, M.; Mujahid, M.; Ahmad, I.; Saeed, K. Photocatalytic and Photostability Behavior of Ag-and/or Al-Doped ZnO Films in Methylene Blue and Rhodamine B under UV-C Irradiation. Coatings 2019, 9, 202. [Google Scholar] [CrossRef]
- Fu, M.; Li, Y.; Lu, P.; Liu, J.; Dong, F. Sol–gel preparation and enhanced photocatalytic performance of Cu-doped ZnO nanoparticles. Appl. Surf. Sci. 2011, 258, 1587–1591. [Google Scholar] [CrossRef]
- Ahmad, I. Inexpensive and quick photocatalytic activity of Rare earth (Er, Yb) co-doped ZnO nanoparticles for degradation of methyl orange dye. Sep. Purif. Technol. 2019, 227, 115726. [Google Scholar] [CrossRef]
- Bouhouche, S.; Bensouici, F.; Toubane, M.; Azizi, A.; Otmani, A.; Chebout, K.; Kezzoula, F.; Tala-Ighil, R.; Bououdina, M. Effect of Er3+ doping on structural, morphological and photocatalytical properties of ZnO thin films. Mater. Res. Express 2018, 5, 056407. [Google Scholar] [CrossRef]
- Hernández-Carrillo, M.; Torres-Ricárdez, R.; García-Mendoza, M.; Ramírez-Morales, E.; Rojas-Blanco, L.; Díaz-Flores, L.; Sepúlveda-Palacios, G.; Paraguay-Delgado, F.; Pérez-Hernández, G. Eu-modified ZnO nanoparticles for applications in photocatalysis. Catal. Today 2018. [Google Scholar] [CrossRef]
- Poornaprakash, B.; Chalapathi, U.; Sekhar, M.C.; Rajendar, V.; Vattikuti, S.P.; Reddy, M.S.P.; Suh, Y.; Park, S.H. Effect of Eu3+ on the morphology, structural, optical, magnetic, and photocatalytic properties of ZnO nanoparticles. Superlattices Microstruct. 2018, 123, 154–163. [Google Scholar] [CrossRef]
- Mohamed, W.; Abu-Dief, A.M. Synthesis, characterization and photocatalysis enhancement of Eu2O3-ZnO mixed oxide nanoparticles. J. Phys. Chem. Solids 2018, 116, 375–385. [Google Scholar] [CrossRef]
- Alam, U.; Khan, A.; Ali, D.; Bahnemann, D.; Muneer, M. Comparative photocatalytic activity of sol–gel derived rare earth metal (La, Nd, Sm and Dy)-doped ZnO photocatalysts for degradation of dyes. RSC Adv. 2018, 8, 17582–17594. [Google Scholar] [CrossRef]
- Satpal, S.B.; Athawale, A.A. Synthesis of ZnO and Nd doped ZnO polyscales for removal of rhodamine 6G dye under UV light irradiation. Mater. Res. Express 2018, 5, 085501. [Google Scholar] [CrossRef]
- Mondal, A.; Giri, N.; Sarkar, S.; Majumdar, S.; Ray, R. Tuning the photocatalytic activity of ZnO by TM (TM = Fe, Co, Ni) doping. Mater. Sci. Semicond. Process. 2019, 91, 333–340. [Google Scholar] [CrossRef]
- Nguyen, L.T.; Nguyen, L.T.; Duong, A.T.; Nguyen, B.D.; Quang Hai, N.; Chu, V.H.; Nguyen, T.D.; Bach, L.G. Preparation, Characterization and Photocatalytic Activity of La-Doped Zinc Oxide Nanoparticles. Materials 2019, 12, 1195. [Google Scholar] [CrossRef]
- Hemalatha, P.; Karthick, S.; Hemalatha, K.; Yi, M.; Kim, H.J.; Alagar, M. La-doped ZnO nanoflower as photocatalyst for methylene blue dye degradation under UV irradiation. J. Mater. Sci. Mater. Electron. 2016, 27, 2367–2378. [Google Scholar] [CrossRef]
- Jia, T.; Wang, W.; Long, F.; Fu, Z.; Wang, H.; Zhang, Q. Fabrication, characterization and photocatalytic activity of La-doped ZnO nanowires. J. Alloys Compd. 2009, 484, 410–415. [Google Scholar] [CrossRef]
- Suwanboon, S.; Amornpitoksuk, P.; Sukolrat, A.; Muensit, N. Optical and photocatalytic properties of La-doped ZnO nanoparticles prepared via precipitation and mechanical milling method. Ceram. Int. 2013, 39, 2811–2819. [Google Scholar] [CrossRef]
- Kumar, S.; Sahare, P. Nd-doped ZnO as a multifunctional nanomaterial. J. Rare Earths 2012, 30, 761–768. [Google Scholar] [CrossRef]
- Cerrato, E.; Gionco, C.; Paganini, M.C.; Giamello, E.; Albanese, E.; Pacchioni, G. Origin of Visible Light Photoactivity of the CeO2/ZnO Heterojunction. ACS Appl. Energy Mater. 2018, 1, 4247–4260. [Google Scholar] [CrossRef]
- Zhu, L.; Li, H.; Xia, P.; Liu, Z.; Xiong, D. Hierarchical ZnO decorated with CeO2 nanoparticles as the direct Z-scheme heterojunction for enhanced photocatalytic activity. ACS Appl. Mater. Interfaces 2018, 10, 39679–39687. [Google Scholar] [CrossRef] [PubMed]
- Shen, Z.; Zhang, Q.; Yin, C.; Kang, S.; Jia, H.; Li, X.; Li, X.; Wang, Y.; Cui, L. Facile synthesis of 3D flower-like mesoporous Ce-ZnO at room temperature for the sunlight-driven photocatalytic degradations of RhB and phenol. J. Colloid Interface Sci. 2019, 556, 726–733. [Google Scholar] [CrossRef] [PubMed]
- Chelliah, M.; Rayappan, J.B.B.; Krishnan, U.M. Synthesis and characterization of cerium oxide nanoparticles by hydroxide mediated approach. J. Appl. Sci. 2012, 12, 1734–1737. [Google Scholar]
- Arakaki, A.R.; Cunha, S.M.; Yoshito, W.K.; Ussui, V.; Lazar, D.R.R. Influence of organic solvent on solvothermal synthesis of samaria and gadolinia doped ceria–nickel oxide composites. Mater. Sci. Forum 2012, 727, 1317–1322. [Google Scholar] [CrossRef]
- Kurian, M.; Kunjachan, C. Investigation of size dependency on lattice strain of nanoceria particles synthesised by wet chemical methods. Int. Nano Lett. 2014, 4, 73–80. [Google Scholar] [CrossRef]
- Xu, Y.; Zou, J.; Lin, X.; Wu, W.; Li, W.; Yang, B.; Shi, M. Quality-Improved GaN Epitaxial Layers Grown on Striped Patterned Sapphire Substrates Ablated by Femtosecond Laser. Appl. Sci. 2018, 8, 1842. [Google Scholar] [CrossRef]
- Mishra, B.G.; Rao, G.R. Promoting effect of ceria on the physicochemical and catalytic properties of CeO2–ZnO composite oxide catalysts. J. Mol. Catal. A Chem. 2006, 243, 204–213. [Google Scholar] [CrossRef]
- Lu, L.; Li, R.; Peng, T.; Fan, K.; Dai, K. Effects of rare earth ion modifications on the photoelectrochemical properties of ZnO-based dye-sensitized solar cells. Renew. Energy 2011, 36, 3386–3393. [Google Scholar] [CrossRef]
- Gupta, J.; Mohapatra, J.; Bahadur, D. Visible light driven mesoporous Ag-embedded ZnO nanocomposites: Reactive oxygen species enhanced photocatalysis, bacterial inhibition and photodynamic therapy. Dalton Trans. 2017, 46, 685–696. [Google Scholar] [CrossRef] [PubMed]
- Rajendran, S.; Khan, M.M.; Gracia, F.; Qin, J.; Gupta, V.K.; Arumainathan, S. Ce 3+-ion-induced visible-light photocatalytic degradation and electrochemical activity of ZnO/CeO2 nanocomposite. Sci. Rep. 2016, 6, 31641. [Google Scholar] [CrossRef] [PubMed]
- Khan, M.M.; Khan, W.; Ahamed, M.; Alhazaa, A.N. Microstructural properties and enhanced photocatalytic performance of Zn doped CeO2 nanocrystals. Sci. Rep. 2017, 7, 12560. [Google Scholar] [CrossRef]
- Suram, S.K.; Newhouse, P.F.; Gregoire, J.M. High throughput light absorber discovery, part 1: An algorithm for automated tauc analysis. ACS Comb. Sci. 2016, 18, 673–681. [Google Scholar] [CrossRef]
- AbuMousa, R.A.; Baig, U.; Gondal, M.A.; AlSalhi, M.S.; Alqahtani, F.Y.; Akhtar, S.; Aleanizy, F.S.; Dastageer, M.A. Photo-catalytic Killing of HeLa Cancer Cells Using Facile Synthesized Pure and Ag Loaded WO 3 Nanoparticles. Sci. Rep. 2018, 8, 1–11. [Google Scholar] [CrossRef]


© 2020 by the authors. Licensee MDPI, Basel, Switzerland. This article is an open access article distributed under the terms and conditions of the Creative Commons Attribution (CC BY) license (http://creativecommons.org/licenses/by/4.0/).