Article

A Stronger Aadaptive Local Dimming Method with Details Preservation

School of Electrical and Information Engineering, Tianjin University, Tianjin 300072, China
*
Author to whom correspondence should be addressed.
Appl. Sci. 2020, 10(5), 1820; https://doi.org/10.3390/app10051820
Submission received: 9 February 2020 / Revised: 27 February 2020 / Accepted: 2 March 2020 / Published: 6 March 2020
(This article belongs to the Special Issue Advances in Image Processing, Analysis and Recognition Technology)

Abstract

:
Local dimming technology focuses on improving the contrast ratio of the displayed images for a great visual perception. It consists of backlight extraction and pixel compensation. Considering a single existing backlight extraction algorithm can hardly adapt to images with diverse characteristics and rich details, we propose a stronger adaptive local dimming method with details preservation in this paper. This method, combining the advantages of some existing methods and introducing the combination of the subjective evaluation and the objective evaluation, obtains a stronger adaptation compared with others. Besides, to offset the luminance reduction caused in the backlight extraction process, we improve the bi-histogram equalization algorithm and propose a new pixel compensation method. To preserve image details, the Retinex theory is adopted to separate details. Experimental results demonstrate the effect of the proposed method on contrast ratio improvement and details preservation.

1. Introduction

High Dynamic Range (HDR) display is developed for HDR images and videos that convey vastly more color shades and nuances than previous standards. However, these devices are expensive for their complex technology, which limits their promotion. Liquid Crystal Display (LCD) is still the current technology for most devices such as computers and TVs.
LCD consists of a Liquid Crystal (LC) panel and a backlight panel with arrayed Back-Light Units (BLUs). The LC panel is light-modulated instead of self-luminous directly. Hence, an image is displayed by it with the backlight produced by BLUs. In early LCD technology, BLUs are always-on with the maximum luminance level, leading to high power consumption and low contrast ratio. In addition, the image quality is deteriorated due to the light leakage problem [1] in the dark state. Local dimming technology is developed to alleviate these weaknesses. As shown in Figure 1, the technology consists of the backlight extraction and the pixel compensation, which are, respectively, used in obtaining the luminance level for each BLU in backlight panel and the compensated image for the LC panel. In the process of backlight extraction, the luminance of each BLU is controlled dynamically according to the corresponding image content. The power consumption is reduced while the contrast ratio is improved effectively. Backlight smoothing is used to simulate the process of light diffusion, which is a solution to alleviate block artifacts [2,3]. Pixel compensation offsets the luminance reduction caused by the backlight dimming in the backlight extraction process.
The resolution of the displayed image in LC panel is larger than that of the backlight array in backlight panel. The diagram of backlight extraction is shown in Figure 2; the luminance of a BLU is determined by the corresponding block of the input image.
Many approaches for backlight extraction have been proposed. They determine the luminance level for BLUs from different characteristics of the image. The early method in [4] explores the maximum and the average luminance of the corresponding image block to determine the luminance level of each BLU. The following methods [5,6,7,8,9,10,11,12,13,14,15,16] extract luminance for BLUs from many other perspectives, such as image histogram, image details, and image quality. However, each method can hardly handle images with diverse and complicated contents. It makes sense to broaden the adaptive scope for a single backlight extraction method. To this end, we propose a method to extract backlight that adapts to images with diverse contents by combining the advantages of some existing methods [4,6,7,8,10,11,12], to which previous approaches have paid rare attention. Besides, we introduce subjective evaluation for a better visual perception. Specifically, our method takes three steps to obtain backlight luminance. First, a target backlight is selected from base backlights generated by existing methods. Second, we design a group of constraint conditions and adjust the target backlight under them to obtain several alternative backlights. Finally, the optimal backlight is determined by both the objective evaluation and the display quality of subjective evaluation.
Luminance overcompensation in pixel compensation process will cause image distortion, decreasing its contrast ratio and visual perception. Hence, we take both the backlight information and the luminance information of original image into account to address the overcompensation. Besides, we propose an Improved Bi-Histogram Equalization (IBHE) to further enhance the image. Specifically, Bi-Histogram Equalization (BHE) [17] applies a histogram equalization on two sub-images segmented from one image, obtaining a tradeoff between brightness enhancement and details preservation. Kim, Y.T. [17] adopted the mean luminance of the image as the breakpoint to make segmentation. However, the method lacks effectiveness in details preservation as it simply adopts the image mean luminance as the breakpoint for segmentation. To this end, we improve the method from the view of taking more image details in breakpoint selection. We make the IBHE a part of pixel compensation.
Combing the proposed backlight extraction with pixel compensation methods, a stronger adaptive local dimming method with details preservation is proposed. Our contributions can be summarized as:
  • A backlight extraction method is proposed to acquire a stronger adaption in processing images with diverse contents by combining advantages of several existing methods.
  • An IBHE method with Retinex theory is proposed to enhance image quality by preserving abundant details.
  • A pixel compensation method is proposed to alleviate overcompensation by leveraging information of both the extracted backlight and the original image based on IBHE.
Experimental results demonstrate the effect of the proposed approach in improving contrast ratio, preserving image details, and enhancing image quality in the real display.
The rest of the paper is structured as follows. Section 2 details the related work of local dimming. Section 3 documents the specific process of the proposed method elaborately. Section 4 describes the experiments and results, and analysis of the results is made in this section. Finally, we conclude the paper in Section 5.

2. Related Work

In this section, existing local dimming approaches are described in detail. For clarity, we organize this section into backlight extraction and pixel compensation, as they are the two parts of local dimming.

2.1. Backlight Extraction

As an early and fundamental approach, the max method [4] employs the maximum luminance of an image block to determine the luminance level of the corresponding BLU. It also explores replacing the maximum luminance with the average luminance. However, the former is sensitive to noise and suffers from light leakage [1] problem. The latter reduces image luminance and suffers from losing details in bright areas. To achieve a trade-off between the above two methods, the methods proposed in [1,5,6] consider both the maximum luminance and the average luminance to improve display quality. In  [1], a decision rule is proposed to determine optimal backlight by comparing the light leakage and the clipping of image blocks. This method is effective for images with bright objects in a dark area. In  [5,6], the difference between the maximum and the average luminance value of a block is used to adjust backlight based on the average value. In [7], the global information of the image is used to extract backlight. It proposes a threshold method using a Cumulative Distribution Function (CDF) to ensure the distortion of the compensated image within a certain range. Besides, the methods proposed in [8,9] are effective to reduce power consumption. Based on Otsu [18], Zhang, T.; Wang, Y.F. [10] introduced a local dimming algorithm to separate foreground and background pixels for backlight extraction. In [11], the Peak Signal to Noise Ratio (PSNR) = 30 is considered as the lowest standard to guarantee the image quality. In [12], a Gaussian distribution model is proposed to reduce power consumption and improve image quality. In Swarm Intelligence (SI), the authors of [13,14] transformed the local backlight dimming to an optimization problem to preserve the image quality with low power consumption. A guided firework algorithm proposed in [14] achieves higher performance than the one in [13]. Although there are other local dimming algorithms [15,16], most of them favor only specific characteristic of an image. Therefore, we propose a backlight extraction method to adapt to images with diverse characteristics, acquiring preferable display quality.

2.2. Pixel Compensation
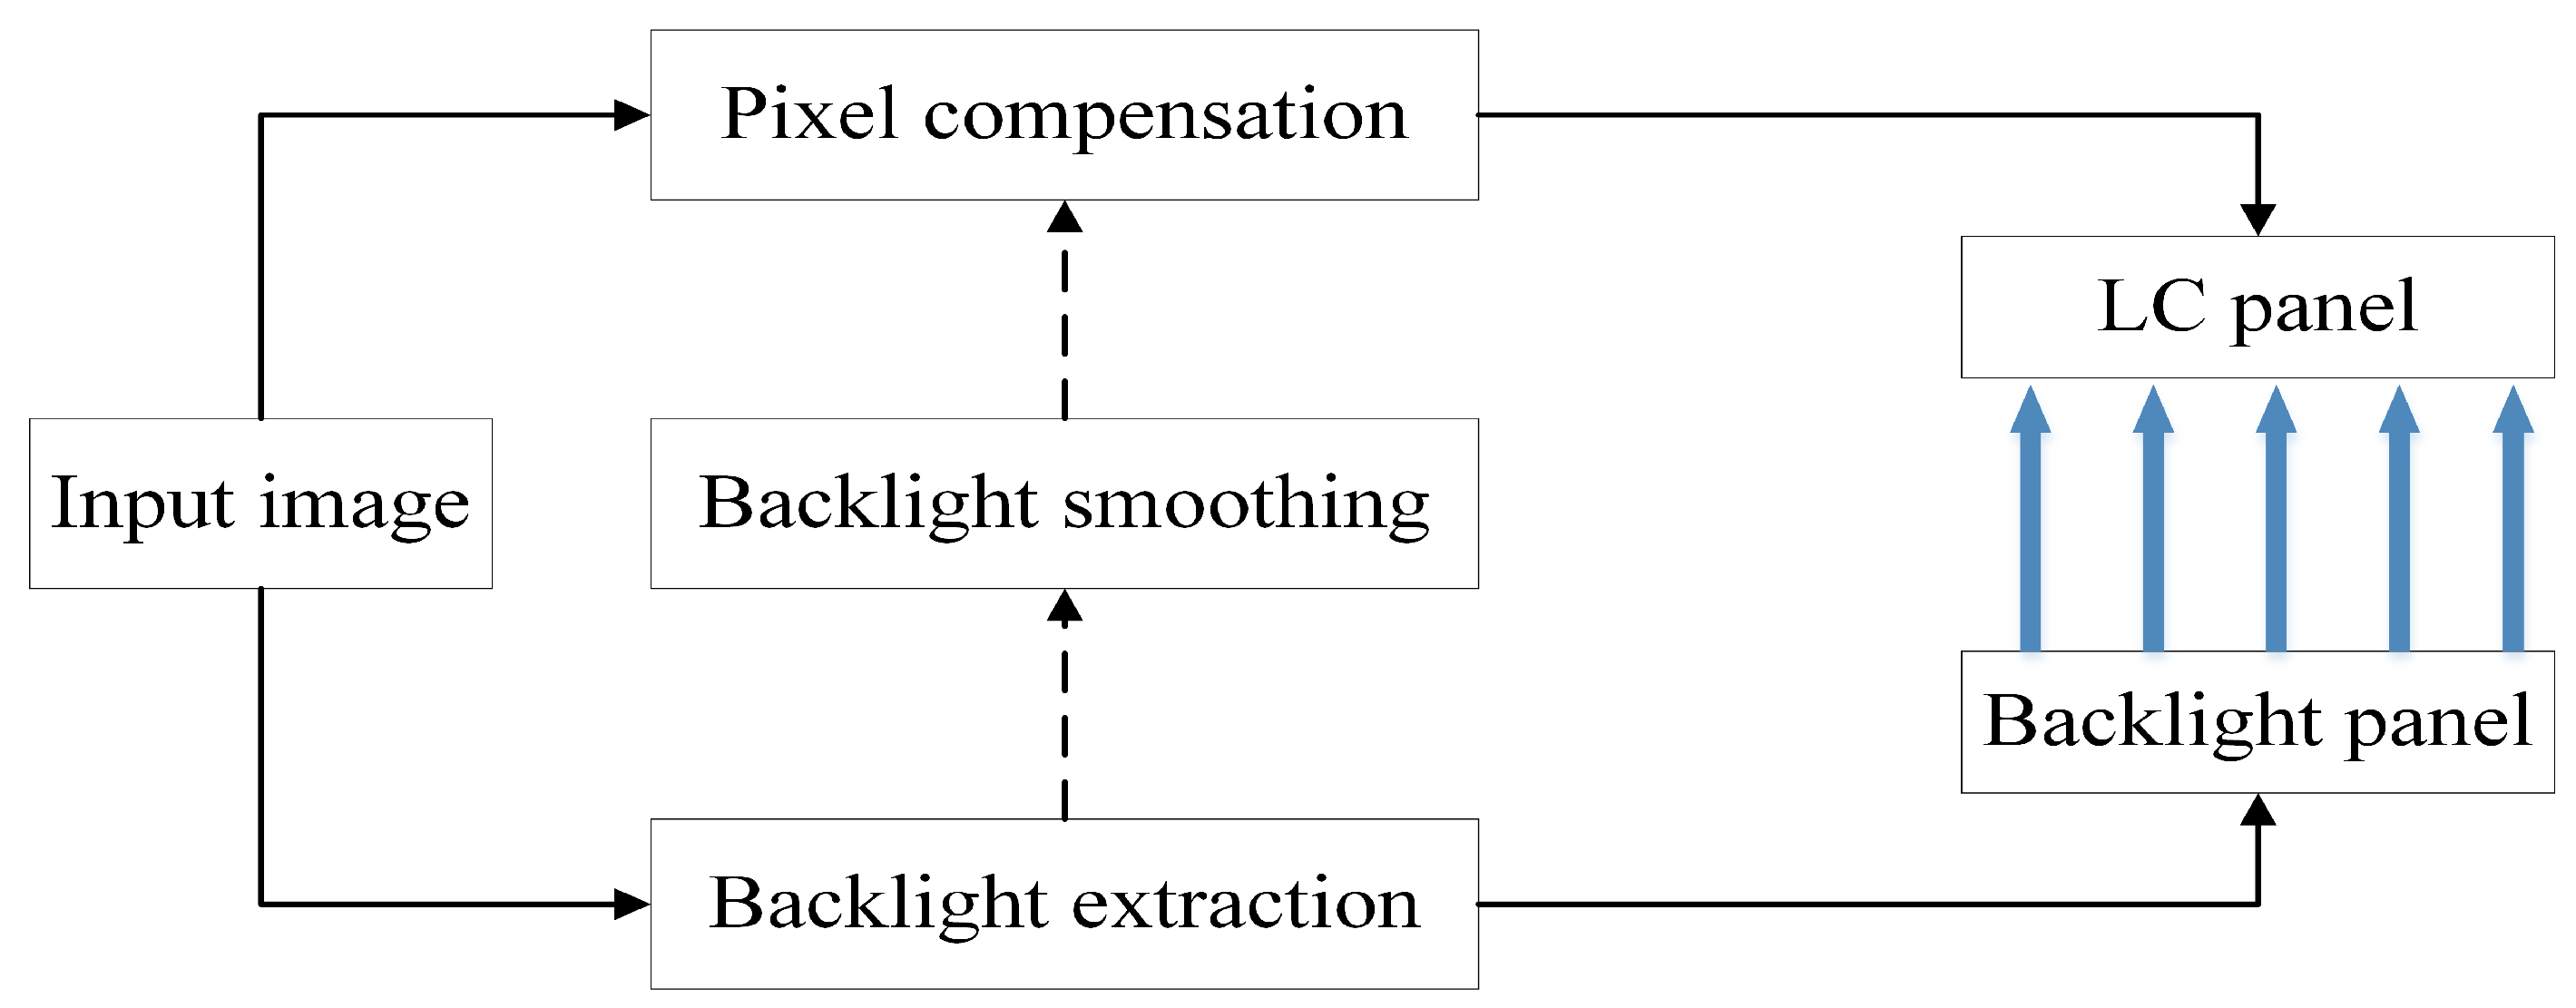
A backlight extraction method is commonly followed with a corresponding pixel compensation method to offset the luminance reduction. In this section, we document the representative method [5] and the closest related method [10] to ours for readability. In [5], the compensated luminance is obtained using the nonlinear relationship between the maximum backlight and the extracted backlight. However, image distortion caused by overcompensation in this method decreases the image quality. In [10], the logarithm function is used to compensate for luminance based on the input image and the smoothed backlight image. It is effective to prevent overcompensation but less effective for bright images.
Our pixel compensation method aims to alleviate the overcompensation problem by adjusting the luminance of the pixel in the input image according to the backlight value. Besides, by the proposed IBHE, this method is effective for improving the quality of display images.

3. Method

In this section, we document our local dimming method elaborately. We first introduce the holistic structure of the method. Then, the proposed backlight extraction method and the compensation method are described, respectively.
The diagram of the proposed method is shown in Figure 3. The whole architecture consists of two modules: an Adjustable Backlight Extraction (ABE) module and a pixel compensation module. Furthermore, the ABE module consists of base backlights extraction and optimal backlight selection.
To avoid color distortion, most of the existing local dimming algorithms are performed on the luminance rather than the chroma component. Following this, we separate the luminance information by converting the color space from R G B into Y C b C r [19] before all of the succeeding operations. The conversion formula is
Y Cb Cr T = M sRGB × R G B T + 16 128 128 T M sRGB = 0.257 0.564 0.098 0.148 0.291 0.439 0.439 0.368 0.071
According to the Retinex theory [20], which is widely used in image processing [21], an image is composed of reflectance and illuminance. The former presents the detail information and the latter determines the dynamic range. This is represented as:
S ( x , y ) = R c ( x , y ) × I ( x , y )
where ( x , y ) is the coordinate of the pixel in the image, S is the image perceived by human eyes, R c is the reflectance, and I is the illuminance. In our method, Y component in Y C b C r color space is considered as S . I is obtained by:
I ( x , y ) = F ( x , y ) Y ( x , y )
where F is the Weighted Least Squares (WLS) filter [22], which is known as an edge-preserving filter; ⊗ is the convolution operation; and  Y is the Y component in Y C b C r color space.
Image edge is the most concentrated part of image information such as the change of gray level and the mutation of texture structure, which contains rich details. Therefore, the edge information must be decomposed and kept to improve image quality in image processing. An alternative filter is bilateral filtering, which has been used in many previous works as a base-detail decomposition technique. However, WLS filter is chosen in this paper because of its better performance, especially for increased blur level compared with bilateral filtering. WLS filter is well suited for progressive coarsening of images and for multi-scale detail extraction. For an input image g, an image u is expected to be as close to g as possible and be smoother except for some places where the gradient of the edge of g changes greatly. Formally, the solution to minimize the objective function in Equation (4) is the result of filtering u.
p u p g p 2 + λ a x , p g u x 2 + a y , p g u y 2
where the subscript p represents the coordinate of the pixel. The first term u p g p 2 is used to measure the similarity between g and u. The second term is a regular term, and  λ is a weight coefficient of the regular term. The larger λ is, the smoother the image will be. The image g is smoothed by minimizing the partial derivative of u, and the weights of smoothing terms are a x , p g and a y , p g , respectively. The definitions of a x , p g and a y , p g are shown in Equation (5).
a x , p g = l x p α + ϵ 1 a y , p g = l y p α + ϵ 1
where l is the logarithmic transformation of g, the exponential parameter α is used to determine the gradient sensitivity, and  ϵ is the offset for avoiding invalid division when l x p or l y p is zero. From the above equations, a x , p g and a y , p g decrease when the gradient of l increases, by which the edge information is kept and unnecessary details is smoothed.
Backlight extraction and pixel compensation are processed on the illuminance I . Then, the logarithm of R c is defined in Equation (6).
r ( x , y ) = l o g R c x , y = l o g Y x , y l o g I x , y
where r is the logarithmic result of R c , and it is used in IBHE in Section 3.2.

3.1. Adjustable Backlight Extraction Module

To respect the image content and avoid drawbacks of a single algorithm, we propose a three-step backlight extraction method to determine an optimal backlight, making displayed images perceived vividly. We document the first step in Section 3.1.1 and the second and the third steps in Section 3.1.2.

3.1.1. Base Backlights Extraction

The first step is to extract base backlights. As mentioned above, each single existing backlight extraction method is not enough to adapt to images with diverse characteristics and contents. However, their respective strengths are complementary and compatible. Each of them can be a base backlight from which we absorb advantages. Assuming that N is the number of base backlights, the base backlights extraction in Figure 3 is defined as follows.
BL t = f t ( I ) t = 1 , 2 , , N
where f t is the t t h base backlight algorithm and  BL t is the t t h base backlight.

3.1.2. Optimal Backlight Selection

Optimal backlight constraint conditions are constructed by all of the base backlights extracted above. One of the base backlights is selected as the target backlight for its ability in reducing power consumption and improving the contrast ratio.
The second step of our method is to adjust the selected target backlight. Specifically, we adjust it based on the segmentation method in [23] and the obtained constraint conditions.
Based on our self-developed LCD-LED dual modulation display [10], the optimal backlight is selected from adjusted backlights by objective evaluation as well as subjective evaluation in the third step.
  • Backlight constraint conditions
We change specific values of the target backlight to obtain several adjusted backlights as alternations of the optimal backlight. The change needs to be within the effective range of backlight to prevent the deterioration of image quality. For an image block, we go through all base backlights for its corresponding maximum and minimum values. The maximum and minimum matrices are denoted as P max and P min . This process is defined as:
P max = m a x BL t ( m , n ) P min = m i n BL t ( m , n )
where ( m , n ) is the coordinate of each backlight value in the backlight image.
Considering that limited backlight extraction algorithms are used to construct backlight constraint conditions, P max is increased by 10% with an upper boundary 255 and  P min is decreased by 10% with a lower boundary 0. The adjusted P max and P min are represented as PA max and PA min , and they form the constraint conditions for obtaining the optimal backlight.
  • Backlight adjustment and optimal backlight selection
Just Noticeable Difference (JND) [24] reflects the sensitivity of human vision. As shown in Figure 4, under different background luminance, JND is different.
In image quality evaluation, if the luminance of details is too close to the neighboring pixels, that is, the difference is less than JND, then the details of this image are not well-displayed. In real display, the background luminance may be changed due to light diffusion between different backlights, leading to the change of JND. Therefore, the image quality in real display may be degraded. To this end, we adjust the target backlight to change the background luminance and select the backlight that presents the details effectively based on display quality as the optimal backlight.
Assume that target backlight is the k t h base backlight denoted as BL 0 .
BL 0 = f k ( I ) k 1 , 2 , , N
where f k is the k t h base backlight extraction method. Improving the dynamic range is important in local dimming. Hence, for  BL 0 , we strengthen the luminance in bright area and weaken it in dark area to improve its dynamic range. Specifically, the bright and the dark area are selected by mean and variance of the backlight image. The process is expressed as Equations (10) and (11).
M = m = 1 W n = 1 H BL 0 m , n ÷ W × H V = m = 1 W n = 1 H BL 0 m , n M 2 ÷ W × H
P 1 = M V P 2 = M + V
where W, H, M, and V are the width, height, mean, and variance of BL 0 , respectively. P 1 and P 2 are the breakpoints to partition areas of different luminance. The pixel with luminance less than P 1 is considered as dark area and the pixel with luminance larger than P 2 is considered as bright area,
Since the backlight value ranges in 0–255, we use the exponent of 2 as the adjustment step to adjust the target backlight BL 0 . The process is expressed as Equation (12).
BL i m , n = BL 0 m , n 2 i BL 0 m , n < P 1 BL 0 m , n + 2 i BL 0 m , n > P 2 BL i m , n = m i n PA max m , n , BL i m , n BL i m , n > PA max m , n m a x PA min m , n , BL i m , n BL i m , n < PA min m , n
where i = 1 , 2 , , 8 , BL i means the i t h adjusted backlight based on BL 0 . PA max and PA min are used to prevent the adjusted backlight from making poor display quality.
Contrast Ratio (CR) and Dynamic Range (DR) are two objective indicators of display quality. Both reflect the change of brightness ranging from dark to bright, and the higher are CR and DR, the wider is the brightness range. To select the optimal backlight, the display luminance is first measured under all adjusted backlights. Then, CR and DR of each measured luminance are calculated. The adjusted backlights with the top three performances based on the results of CR and DR are selected. Finally, the optimal backlight is selected from the three adjusted backlights by display quality subjectively. The process is shown in Figure 5.
The subjective evaluation is set as follows. The three selected adjusted backlights are demonstrated on the display prototype. Observers are asked to vote for the optimal backlight based on visual perception over details, contrast, and brightness. The backlight with the largest number of votes is determined to be the optimal backlight. Given that subjective feeling is susceptible to factors such as gender, age, occupation, and surroundings, the selection was done by 16 observers who are non-experts in image and video processing field. Their ages range from 22 to 30, with eight males and eight females. All of them have normal visual ability, that is, none of them have eye problems such as color blindness, color weakness, shortsighted, etc.

3.2. Pixel Compensation Module

In this work, we compensate luminance according to the optimal backlight described as BL op and the luminance of the input image. Before the compensation, we use Improved Blur Mask Approach (IBMA) [10] to smooth optimal backlight to removes the block artifacts. Specifically, Zhang, T.; Wang, Y.F. [10] divided the points of BL op into three categories. The first category includes the corner points, the second category includes the peripheral points except for the cornet points, and the third category includes the internal points of BL op . Different Low Pass Filter (LPF) templates are used to smooth points of BL op in different categories. IBMA uses the smoothing process to simulate the light diffusion, and  BL op is resized after each smoothing operation. By several smoothing operations, the smoothed backlight has the same size as the input image. The process is expressed in Equation (13).
BL sm = I B M A BL op
where BL sm represents the backlight after IBMA and  BL op is the optimal backlight. The comparison results of using or not using IBMA are shown in Figure 6.
Compared with Figure 6a, artifacts are removed obviously in Figure 6b by applying IBMA.
We use a compensation coefficient k to control the compensation degree, which is determined by the smoothed backlight and the luminance of the input image. The process is formulated as Equations (14) and (15).
k x , y = BL sm x , y ÷ I x , y γ
I p x , y = k x , y × I x , y + 1 k x , y × BL sm x , y
where γ = 0.125 is selected from multiple experimental results to prevent overcompensation problem and enhance the overall luminance of the image effectively. I P is the compensated luminance.
Next, IBHE is used to further enhance the compensated luminance. In BHE, an image is decomposed into two sub-images based on its mean, and then the sub-images are equalized independently to improve CR while maintaining the luminance of the image. Different from this, we rely on the Otsu method and the histogram of r in Equation (6) to obtain two sub-images. Algorithm 1 is devised to acquire the breakpoint for the image segmentation.
Algorithm 1 Proposed algorithm for breakpoint acquisition.
Input:r, I P ;
Output: the breakpoint T;
1:
z 1 , z 2 = size r ;
2:
n u m = 0;
3:
I m = I P ;
4:
for i = 1 to z 1 do
5:
    for j = 1 to z 2 do
6:
        if r i , j = = 0 then
7:
            n u m + = 1 ;
8:
        else
9:
            I m i , j = 0 ;
10:
        end if
11:
    end for
12:
end for
13:
T 1 = s u m s u m I m ÷ n u m ;
14:
T 2 = O t s u ( I m ) ;       the breakpoint obtained by Otsu method
15:
T = f l o o r T 1 + T 2 ÷ 2 ;       the average value of T 1 and T 2
16:
returnT;
By the breakpoint T, the CDF curves of the two sub-images are obtained to perform BHE [17]. The process is expressed as Equation (16).
I out k = T I p m i n × C D F 1 k + I p m i n 0 < k < T I p m a x T × C D F 2 k + T T + 1 < k < 255
where I p m i n and I p m a x are the minimum and the maximum of compensated luminance I p , respectively. C D F 1 and C D F 2 are respective CDF curves of the two sub-images.
Finally, I out and r in Equation (6) are combined to reconstruct final luminance image by Equation (17), and color transformation from Y C b C r to R G B [25] is employed to generate the final image.
Y out x , y = I out x , y × e r x , y

4. Experiment

In this section, we describe the settings and the results of our experiments. In backlight extraction, the base backlight extraction methods in our experiment consisted of the max method [4], the average method [4], LUT method [6], CDF method [7], IMF method [8], the method based on Otsu [10], PSNR method [11], and Gaussian method [12]. The method based on Otsu in [10] was considered as the target algorithm, extracted by which the backlight is taken as the target backlight. The sizes of the input image and the backlight are 1920 × 1080 and 66 × 36, respectively.

4.1. Hardware

A self-designed LED-LCD prototype display [10] was adopted to verify display quality with the optimal backlight and compensated image that is the output in Figure 3. The display principle of the prototype is shown in Figure 7a. The measure environment in our experiment was a dark room to prevent interference from light. The luminance meter used in our experiment is CX-2B color brightness meter, for which the luminance ranges in 0.001–200 kcd/m2.

4.2. Experiment of Improved Bi-Histogram Equalization

To illustrate the effectiveness of the proposed IBHE method in segmenting image, the breakpoint by Kim, Y.T. [17] was used to make comparison. The results are shown in Figure 8.
As shown in the red square of Figure 8b,c, the segmentation effect is basically the same, while, in the yellow as well as green squares, the segmentation is more accurate by the proposed IBHE method than by the method in [17] according to the test image.

4.3. Experiment of Adjustable Backlight Extraction

4.3.1. Subjective Experiment

The comparison of image display quality under the target backlight and the optimal backlight is shown in Figure 9.
The images were taken by an optical recorder. Obviously, the image recorders can hardly reproduce the visual perception of eyes. However, we can still distinguish that the visual perception of the optimal backlight is more vivid than that of the target backlight. For clarity, the detail with obvious difference is marked. In the above two images in Figure 9, we observe that the dark areas are enhanced under optimal backlight to improve CR of the displayed image. In the other two images, the marked areas illustrate a higher color saturation to improve display quality under optimal backlight. These demonstrate that the proposed backlight extraction method has stronger adaption in an image with different brightness and rich details in the real display.

4.3.2. Objective Experiment

Tong, H. [26] defined a group of conditions to separate low/high luminance and low/high CR images with CDF curve. We selected one image from each category to evaluate the proposed method according to the conditions. The images chosen for the experiment and their corresponding CDF curves are illustrated in Figure 10.
Assuming that h denotes the histogram of the measured luminance using luminance meter, h ( x ) denotes the number of pixels whose luminance is x. Inspired by the method of calculating CR in [10], we calculated the average values of luminance that are greater than P 90 and lower than P 10 , respectively, to calculate CR to reduce the influence of the measurement error. P 10 and P 90 are the luminance of which the cumulative numbers account for 10% and 90% of the total pixels, respectively. M m a x and M m i n are the maximum and minimum of the measured luminance. CR and DR are calculated as follows.
A v g 10 = x < P 10 h x × x ÷ x < P 10 h x A v g 90 = x > P 90 h x × x ÷ x > P 90 h x C R = A v g 90 ÷ A v g 10 D R = M m a x ÷ M m i n
The objective evaluations are shown in Table 1. We can observe that all CR values of optimal backlights are better than that of the target backlights. DR values in Images (b) and (d) under optimal backlights are slightly lower than those under target backlights. The reason lies in that the luminance of the bright area is almost 255, which cannot be increased. In contrast, the luminance of the dark area is still decreased, resulting in a reduction in overall luminance. For most cases, the comparisons confirm the effectiveness of the proposed method.

4.4. Experiment of Simulated Images

4.4.1. Subjective Experiment

The simulated comparisons of the proposed local dimming method with LUT method, CDF method, and the method based on Otsu [10] are shown in Figure 11.
For Figure 11a, the dark areas in red rectangles of CDF and LUT algorithms are brighter, leading to a lower CR than the other two methods. In contrast, the method in [10] missed details caused by reducing luminance. The proposed method is a balance between improving CR and preserving details.
For Figure 11b, the clouds in the red circles of CDF and LUT methods are brighter than Figure 10b, which should be darker. For the clouds in the red rectangle by the method in [10], the image distortion is caused by overcompensation. For the image by the proposed method, the image contents in both the red circle and the red rectangle are well-compensated to improve CR and preserve details.
For Figure 11c, CDF and LUT methods simply improve the overall image luminance but without improvement of CR and image quality. The method in [10] improved the luminance of bright areas and decreased that of dark areas, which shows a preferable image. The image of the proposed method shows a higher CR with a higher saturation. However, the mountain part is slightly unsatisfactory compared with the image obtained by the method in [10]. This may be because the low luminance is mapped to smaller by histogram equalization.
For Figure 11d, the images of CDF and LUT methods are bright to show rich details. In contrast, the image obtained by the method in [10] is distorted. Note that the red rectangle, seen as a high spatial-frequency part, retains more details by the proposed method compared with the image obtained by the method in [10].

4.4.2. Objective Experiment

In our experiments, in addition to for CR [10], Peak Signal-to-Noise Ratio (PSNR) [27], Structural Similarity Index (SSIM) [14], and Color Difference (CD) [28] were further applied to evaluate the simulated image comprehensively.
CR, used to evaluate the dynamic range of luminance, is an important metrics in image processing. Generally, an image with a high CR presents vivid and rich colors. Note that the CR used to evaluate the simulated images is calculated differently compared with the CR in Section 4.3.2. To distinguish them, the CR calculated by the simulated image is defined as C R S I and obtained by Equation (19).
C R S I = P 90 / P 10
where P 10 and P 90 are the luminance of which the cumulative numbers account for 10% and 90% of the total number of pixels in simulated image, respectively.
PSNR was employed to evaluate the distortion between signal and noise. A higher PSNR indicates a lower distortion. The definition of PSNR is described in Equation (20).
P S N R C 1 , C 2 = 10 × l o g 255 2 M S E C 1 , C 2 M S E C 1 , C 2 = 1 w × h i = 1 w j = 1 h C 1 i , j C 2 i , j 2
where C 1 and C 2 are the original image and the simulated image, respectively, while w and h mean the width and the height of the simulated image.
SSIM is widely used in realizing structural similarity theory. SSIM ranges from 0 to 1 and a better image quality leads to a higher SSIM. The definition of SSIM is described in Equation (21)
S S I M C 1 , C 2 = 2 μ C 1 μ C 2 + ϵ 1 2 σ C 1 C 2 + ϵ 2 μ C 1 2 + μ C 2 2 + ϵ 1 σ C 1 2 + σ C 2 2 + ϵ 2
where μ C 1 and μ C 2 are the mean values of C 1 and C 2 respectively; σ C 1 and σ C 2 are the variance of C 1 and C 2 , respectively; σ C 1 C 2 is the covariance of C 1 and C 2 ; and ϵ 1 and ϵ 2 are two constants to avoid invalid division.
Besides, from the perspective of color information, we adopted CD to evaluate the color distortion by applying weighted Euclidean distance in RGB color space. The process to obtain the CD is expressed in Equation (22).
Δ C = 2 + r ¯ 256 × Δ R 2 + 4 × Δ G 2 + 2 + 255 r ¯ 256 × Δ B 2 C D = Δ C w × h
where r ¯ = C 1 , R + C 2 , R / 2 , Δ R = C 1 , R C 2 , R , Δ G = C 1 , G C 2 , G , and Δ B = C 1 , B C 2 , B ; C 1 , R , C 1 , G , and C 1 , B represent the normalized components of original image, respectively; and C 2 , R , C 2 , G , and C 2 , B represent the normalized components of simulated image; respectively. The comparisons of the above four metrics are shown in Table 2.
In Table 2, C R S I obtained by the proposed method is higher than that of the three other top algorithms by 7.0%, 10.0%, 26.8%, and 23.1%, respectively. PSNR is improved by 33.9%, 11.4%, 4.1%, and −4.1%, respectively. PSNR of high contrast ratio image by the proposed method follows the highest one by the method in [10] closely. For SSIM, the performance of the proposed method is slightly inferior for low contrast ratio image. However, it is still competitive to other algorithms, especially for low luminance image. For CD, images processed by the proposed method reduce the distortion of chroma information effectively, especially for the low luminance image and the high contrast ratio image. In other words, the objective evaluation values are consistent with the subjective quality of the simulated images.

5. Conclusions

In this paper, a stronger adaptive local dimming method with details preservation is proposed to alleviate the disadvantage of a single algorithm. A three-step backlight extraction method is applied to determine the optimal backlight to improve display quality. In the pixel compensation, we compensate the luminance of the input image according to the smoothed backlight information. In addition, IBHE is proposed to enhance the luminance of an image and realize details preservation. Both the objective and subjective evaluation results demonstrate the effectiveness of the proposed local dimming method in keeping chroma information, and improving CR as well as PSNR, SSIM.

Author Contributions

Conceptualization, T.Z., W.D., and H.W.; methodology, T.Z., W.D., and H.W.; software, W.D.; validation, W.D., Q.Z., and L.F.; formal analysis, W.D.; investigation, H.W., W.D., Q.Z., and L.F.; resources, T.Z.; data curation, H.W.; writing—original draft preparation, T.Z. and W.D.; writing—review and editing, H.W., Q.Z., and L.F.; visualization, W.D.; supervision, T.Z.; project administration, T.Z.; and funding acquisition, T.Z. All authors have read and agreed to the published version of the manuscript.

Funding

This work was supported by the Research on HDR Backlight Liquid Crystal Processing Technology Based on Depth Neural Network under Contract HO2018085418.

Conflicts of Interest

The authors declare no conflict of interest.

References

  1. Kim, S.E.; An, J.Y.; Hong, J.J. How to reduce light leakage and clipping in local-dimming liquid-crystal displays. J. Soc. Inf. Disp. 2009, 17, 1051–1057. [Google Scholar] [CrossRef] [Green Version]
  2. Chen, H.; Ha, T.H.; Sung, J.H. Evaluation of LCD local dimming backlight system. J. Soc. Inf. Disp. 2012, 18, 57–65. [Google Scholar] [CrossRef]
  3. Nam, H.; Song, E.; Kim, S.K. Weighted roll-off scheme to remove block artifacts for low power local dimming liquid crystal displays. Opt. Laser Technol. 2014, 58, 8–15. [Google Scholar] [CrossRef]
  4. Funamoto, T.; Kobayashi, T.; Murao, T. High-picture-quality technique for LCD televisions: LCD-AI. In Proceedings of the International Display Workshops, Kobe, Japan, 29 December 2000; pp. 1157–1158. [Google Scholar]
  5. Zhang, X.B.; Wang, R.; Dong, D. Dynamic Backlight Adaptation Based on the Details of Image for Liquid Crystal Displays. J. Disp. Technol. 2012, 8, 108–111. [Google Scholar] [CrossRef]
  6. Cho, H.; Kwon, O.K. A backlight dimming algorithm for low power and high image quality LCD applications. IEEE Trans. Consum. Electron. 2009, 55, 839–844. [Google Scholar] [CrossRef]
  7. Liu, Y.Z.; Zheng, X.R.; Chen, J.B. Dynamic Backlight Signal Extraction Algorithm Based on Threshold of Image CDF for LCD-TV and its Hardware Implementation. Chin. J. Liq. Cryst. Disp. 2010, 25, 449–453. [Google Scholar]
  8. Lin, F.C.; Liao, C.Y.; Liao, L.Y. Inverse of Mapping Function (IMF) Method for Image Quality Enhancement of High Dynamic Range LCD TVs. SID Symp. Dig. Tech. Pap. 2007, 38, 1343–1346. [Google Scholar] [CrossRef]
  9. Nadernejad, E.; Burini, N.; Korhonen, J. Adaptive local backlight dimming algorithm based on local histogram and image characteristics. In Proceedings of the IS&T/SPIE Electronic Imaging, Burlingame, CA, USA, 3–7 February 2013. [Google Scholar]
  10. Zhang, T.; Wang, Y.F. High-Performance Local Dimming Algorithm Based on Image Characteristic and Logarithmic Function. J. Soc. Inf. Disp. 2019, 27, 85–100. [Google Scholar] [CrossRef]
  11. Zhang, X.B.; Liu, X.; Liu, B. A Control Algorithm of LCD Dynamic Backlight Based on PSNR. Appl. Mech. Mater. 2012, 241–244, 3014–3019. [Google Scholar] [CrossRef]
  12. Chen, S.L.; Tsai, H.J. A Novel Adaptive Local Dimming Backlight Control Chip Design Based on Gaussian Distribution for Liquid Crystal Displays. J. Disp. Technol. 2016, 99, 1494–1505. [Google Scholar] [CrossRef]
  13. Zhang, T.; Zhao, X.; Pan, X.H. Optimal Local Dimming Based on an Improved Shuffled Frog Leaping Algorithm. IEEE Access 2018, 6, 40472–40484. [Google Scholar] [CrossRef]
  14. Zhang, T.; Zhao, X. Using the Guided Fireworks Algorithm for Local Backlight Dimming. Appl. Sci. 2019, 9, 129. [Google Scholar] [CrossRef] [Green Version]
  15. Yeo, D.M.; Kwon, Y.H.; Kang, E.J. Smart Algorithms for Local Dimming LED Backlight. SID Symp. Dig. Tech. Pap. 2008, 39, 1343–1346. [Google Scholar] [CrossRef]
  16. Wang, X.; Su, H.S.; Li, C.L. HDR image display algorithm based on LCD-LED dual modulation HDR display. Chin. J. Liq. Cryst. Disp. 2019, 34, 18–27. [Google Scholar]
  17. Kim, Y.T. Contrast enhancement using brightness preserving bi-histogram equalization. IEEE Trans. Consum. Electron. 1997, 43, 1–8. [Google Scholar]
  18. Otsu, N. A Threshold Selection Method from Gray-Level Histograms. IEEE Trans. Syst. Man Cybern. 2007, 9, 62–66. [Google Scholar] [CrossRef] [Green Version]
  19. Genesis Microchip. gm6010/gm6015 Programming Guide; Genesis Microchip Company: Anaheim, CA, USA, 2002; pp. 85–90. [Google Scholar]
  20. LAND, E.H. Lightness and retinex theory. J. Opt. Soc. Am. 1971, 61, 2032–2040. [Google Scholar] [CrossRef]
  21. Tang, L.; Chen, S.; Liu, W. Improved Retinex Image Enhancement Algorithm. Procedia Environ. Sci. 2011, 11, 208–212. [Google Scholar] [CrossRef] [Green Version]
  22. Farbman, Z.; Fattal, R.; Lischinski, D. Edge-preserving decompositions for multi-scale tone and detail manipulation. ACM Trans. Graph. 2008, 27, 1–10. [Google Scholar] [CrossRef]
  23. Lu, X.M.; Zhu, X.Y.; Li, Z.W. A Brightness-scaling and Detail-preserving Tone Mapping Method for High Dynamic Range Images. Acta Autom. Sin. 2015, 41, 1080–1092. [Google Scholar]
  24. Li, J.X. Research on Image Enhancement Based on JND Curve Property. Master’s Thesis, Lanzhou Jiaotong University, LanZhou, GanSu, China, 2014. [Google Scholar]
  25. Genesis Microchip. gm6015 Preliminary Data Sheet; Genesis Microchip Company: Anaheim, CA, USA, 2001; pp. 33–34. [Google Scholar]
  26. Tong, H. Research of LCD Dynamic Control LED Backlight Algorithm. Mater’s Thesis, Hefei University of Technology, Hefei, AnHui, China, 2012. [Google Scholar]
  27. Hore, A.; Ziou, D. Image quality metrics: PSNR vs. SSIM. In Proceedings of the 20th International Conference on Pattern Recognition, IEEE Computer Society, Istanbul, Turkey, 23–26 August 2010. [Google Scholar]
  28. Song, S.J.; Kim, Y.I.; Bae, J. Deep-learning-based pixel compensation algorithm for local dimming liquid crystal displays of quantum-dot backlights. Opt. Express 2019, 27, 15907–15917. [Google Scholar] [CrossRef] [PubMed]
Figure 1. The flowchart of local dimming technique. The dotted line means optional.
Applsci 10 01820 g001
Figure 2. The diagram of backlight extraction: (a) backlight panel; (b) Liquid Crystal (LC) panel; (c) a Back-Light Unit (BLU); and (d) the corresponding image block of (c).
Applsci 10 01820 g002
Figure 3. The diagram of the proposed method. It is better to look at it in color: orange block, adjustable backlight extraction module; white block, backlight smoothing module; and pink block, pixel compensation module.
Applsci 10 01820 g003
Figure 4. JND curve.
Applsci 10 01820 g004
Figure 5. Process of selecting the optimal backlight: (a) objective evaluation using Contrast Ratio (CR) and Dynamic Range (DR); and (b) subjective evaluation via voting based on display quality. A i (i = 1, 2 ⋯ 8) means adjusted backlight; S j (j = 1, 2, 3) means backlights with top three objective indicators.
Applsci 10 01820 g005
Figure 6. (a) Backlight without Improved Blur Mask Approach; and (b) backlight with Improved Blur Mask Approach.
Applsci 10 01820 g006
Figure 7. Hardware support: (a) display principle of LED-LCD prototype; and (b) measurement environment (the lights were off when we measured the luminance).
Applsci 10 01820 g007
Figure 8. Segmentation results with different breakpoints: (a) test image; (b) breakpoint by the method in [17]; and (c) breakpoint by the proposed Improved Bi-Histogram Equalization (IBHE).
Applsci 10 01820 g008
Figure 9. Display effects with target backlight and optimal backlight: (a) target backlight; and (b) optimal backlight.
Applsci 10 01820 g009
Figure 10. Images used for objective experiment and corresponding Cumulative Distribution Function (CDF) curves: (a) low luminance image; (b) high luminance image; (c) low contrast ratio image; (d) high contrast ratio image; and (e) CDF curves of the images.
Applsci 10 01820 g010
Figure 11. Simulation results. From left to right: Images (ad).
Applsci 10 01820 g011
Table 1. Objective evaluation comparisons of CR and DR. BL 0 , the target backlight; BL i , the optimal backlight; (a)–(d), images in Figure 10. The better performance is marked in bold.
ImageBacklightCRDR
(a) B L 0 11,209.241,630,700
B L 3 11,284.181,631,900
(b) B L 0 8.972,059,400
B L 4 9.141,974,200
(c) B L 0 3228.411,056,333
B L 4 3272.411,156,091
(d) B L 0 1913.711,659,500
B L 3 5464.291,656,385
Table 2. Comparisons of algorithmic processing. The best performance is marked in bold.
ImageEvaluation MetricsCDF MethodLUT Method[10]the Proposed Method
(a) C R S I 4.884.937.007.50
P S N R 18.4019.4324.7833.19
S S I M 0.870.890.940.97
C D 0.320.280.150.06
(b) C R S I 4.324.287.688.42
P S N R 24.1025.4924.2427.00
S S I M 0.980.990.970.98
C D 0.130.120.160.12
(c) C R S I 5.885.766.087.71
P S N R 20.3221.4923.4424.39
S S I M 0.910.920.930.90
C D 0.260.230.190.19
(d) C R S I 5.696.006.508.00
P S N R 19.8120.4925.8524.80
S S I M 0.830.840.900.93
C D 0.230.210.130.14

