Article

Investigation of a Dielectric Barrier Discharge Plasma Actuator to Control Turbulent Boundary Layer Separation

Department of Mechanical Engineering, North Carolina Agricultural and Technical State University, Greensboro, NC 27401, USA
*
Author to whom correspondence should be addressed.
Appl. Sci. 2020, 10(6), 1911; https://doi.org/10.3390/app10061911
Submission received: 21 December 2019 / Revised: 4 March 2020 / Accepted: 9 March 2020 / Published: 11 March 2020

Abstract

:
A numerical investigation was carried out to explore the effects of a dielectric barrier discharge (DBD) plasma actuator on a three-dimensional incompressible, separated flow. The test article selected for the simulations was the National Aeronautical and Space Administration (NASA) wall-mounted hump model. The simulations were run at a Reynolds number of 936,000, based on hump chord length, and a freestream Mach number of 0.1. Hybrid partially averaged Navier–Stokes/large-eddy simulations (PANS/LES) were completed using CALC-LES, a well-validated computational fluid dynamics (CFD) code, developed by Chalmers University of Technology. The baseline code was modified to simulate the effects of the actuator, which were modeled as source terms in the momentum equation and were assumed to be steady and constant in the span-wise direction. The numerical simulations were carried out for a baseline (no control) case and five plasma control cases. To optimize the performance of the actuator, the variation of actuator location and voltage frequency was investigated. For the baseline case, a comparison of time-averaged skin friction, the coefficient of pressure, and velocity profiles was made of the available experimental results. The results of the baseline case showed good agreement for a hybrid turbulence model, thus strengthening the solver’s ability to predict a three-dimensional separated flow with reasonable accuracy. The results with the plasma actuator turned on showed improved flow characteristics compared to the baseline simulations by reducing the region of separated flow. The actuator placed just downstream of the separation point at an operational frequency of 5kHz completely eliminated the separated flow for our test conditions.

1. Introduction

A common definition of boundary layer flow control was given by Flatt [1]: “Boundary layer control includes any mechanism or process through which the boundary layer of a fluid flow is caused to behave differently than it normally would were the flow developing naturally along a smooth straight surface”. Due to the increase of computational resources and the development of sensor and actuator technology, the numerical and experimental implementation of advanced flow actuation has accelerated rapidly during the past 15 years [2]. The ability to control unwanted fluid flow occurrences is motivated by the desire to improve the aerodynamic performance of air vehicles. For decades, the aerospace industry has actively developed technologies that can eliminate, or at least mitigate, unwanted boundary layer separation [3,4,5]. In fluid dynamics, separated flow may cause an increase in aerodynamic drag, induce mechanical vibration, and decrease lift. These flow features contribute to poor aerodynamic characteristics and structural failures. Thus, by providing effective control and separation mitigation, we can design optimized high-performing air vehicles.
Some common boundary layer control devices are: vortex generators, moving surfaces, dimpled surface textures, and serrated trailing edge geometries. These devices are regarded as “passive” due to their continuous perturbation of the baseline fluid flow. The other method of flow control is typically described as “active”. This option enables variable actuator operation and is desirable for unpredictable flow conditions. Common examples of active flow control techniques are: plasma actuators, mechanical suction and blowing, and piezo electric driven cavities. Plasma-actuator based flow control has been shown to provide a drag reduction and lift augmentation through the redistribution of boundary layer momentum from high-to-low regions [6]. These active flow control devices have become increasingly popular due to their ability to adapt to atmospheric conditions, low maintenance costs, and minimal parasitic drag penalty.
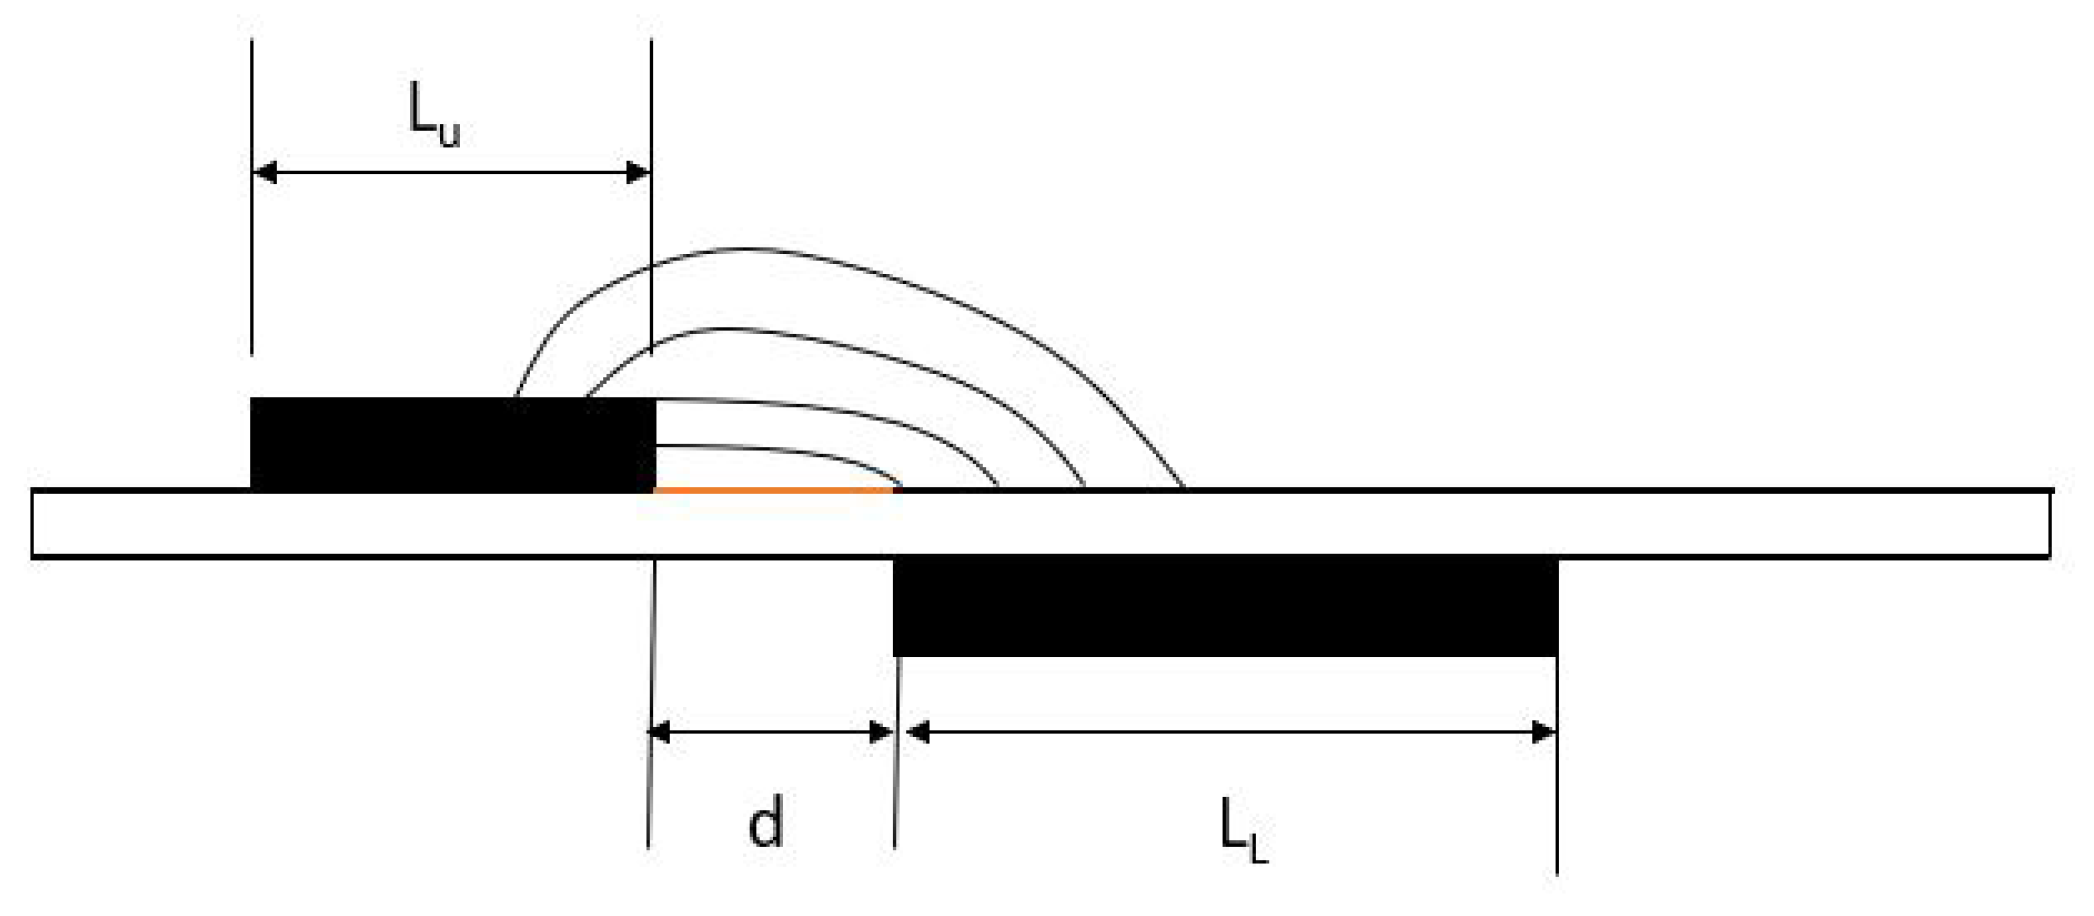
A plasma can be defined as follows: “A plasma is a quasi-neutral gas of charged and neutral particles which exhibits collective behavior” [7]. There are several common types of plasma actuators used for aerodynamic flow control: glow discharges, DBDs, and magnetically-accelerated surface discharges are some of the most popular. DBDs are one of the commonly used actuators for active flow control of low speed applications. Werner first introduced this plasma actuator in 1857 for ozone generation [8,9]. A schematic of a typical DBD plasma actuator is shown in Figure 1.
A DBD plasma actuator is comprised of two asymmetric electrodes and a dielectric material, i.e., glass, Kapton, or Teflon. A dielectric material is utilized to insulate one electrode, while the other is exposed to the ambient conditions. The electrode terminals are connected to a direct current (DC) or alternating current (AC) voltage power source. A DC power source is commonly used for spark discharge plasma actuators, whereas an AC power source is appropriate for DBD plasma actuators, which are frequently called quiet release actuators [8]. The AC voltage applied to DBD actuators varies from 5 kV to 20 kV with a frequency range of 3–15 kHz [10]. When a high voltage and frequency is applied, the region exposed to the open electrode ionizes because of the drift of electrons from one electrode to another (i.e., cathode to anode). The chemical reaction for this process is:
A + e = A + + 2 e
This ionized gas (plasma) moves towards the covered electrode. The ions produce a body force due to the momentum transfer of the flow close to the wall surface. This causes a suction effect above the uncovered electrode and works similarly to a wall jet. The plasma development is strongest in the area close to the electrodes. During the positive half cycle, the upper electrode functions as the cathode, and the dielectric material covers the lower electrode and works as a pseudo-anode. Because of the dielectric material and asymmetric electrode configuration, the plasma formation is relatively low during the negative half cycle. A detailed description of plasma formation and the induced body force mechanisms was described in [11,12]. There are fundamentally two methodologies to numerically model a DBD plasma actuator:
  • First principles based models
  • Phenomenological or simplified models
First principles based modeling approaches are classified as fluid models, kinetic models, or hybrid models. These models are accurate for capturing plasma physics and near wall physics. There were several publications that investigated the use of plasma actuators based on first principles based models [13,14,15,16,17]. On the other hand, phenomenological models focus on the bulk effect of the plasma on the flowfield. These models are popular due to their simplicity of modeling and implementation. There are several validated phenomenological models that are used to model plasmas. Among the most popular are the Shyy model [18], the Suzen and Huang model [19,20], the Roth model [21], and the lumped-element circuit model [22,23].
Following Werner’s work, research was conducted showing the effective use of DBD plasma actuators on airfoils, hump models, bluff bodies, compressors, rearward facing steps, and flat plates. Additional studies, such as Suzen et al. [19], studied on the effect of a DBD plasma actuator on PAK-Bblade flow separation and a low-pressure turbine flow with large flow separation in a quiescent environment [20]. Khoshkoo et al. [24] and Gaitonde et al. [25] studied DBD actuators to control flow separation over a NACA 0015 airfoil at a high angle-of-attack, showing the ability of phenomenological DBD actuator models to control low-speed flow. Yu et al. [26] studied a DBD plasma actuator model with a correction factor to examine the complex flow structure. Mushyam et al. [27] used the marker and cell (MAC) based predictor-corrector method to simulate plasma induced electro-hydro-dynamic (EHD) flow and validated their numerical findings with experimental results. Gang et al. [28] conducted experiments of DBD plasma actuators to control external and internal flow separation over a hump and compressor cascade, respectively. A creative stair-shaped DBD plasma actuator configuration was introduced by Rodrigues et al. [29] to increase induced flow velocity and mechanical efficiency with an acceptable actuator durability. Corke et al. [30] showed that DBD plasma actuators can effectively reduce the drag and increase the lift. Rizzetta et al. [31] studied the effects of DBD plasma based control on turbulent separation on a rear facing ramp. Hasan et al. [32], Lu et al. [33], He et al. [34], and others studied the effects of DBD plasma actuators on the NASA hump model. The Shyy model, proposed by Wei Shyy, was adapted for use in this work due to the reasonable accuracy, low computational cost, and simple implementation [24]. The details of this model are presented in the Computational Methodology Section.

2. Computational Methodology

The computational methodology of the governing equations, numerical solver, plasma actuator model, and computational domain are presented in this section. CALC-LES was used to compute the three-dimensional governing fluid flow equations, known as the Navier–Stokes equations (NSE). The DBD plasma actuator model was numerically implemented in the NSE as source terms based on the linearized Shyy model.

2.1. Governing Fluid Flow Equations: Navier–Stokes Equations

The Navier–Stokes equations typically consist of the conservation mass, momentum, and energy. The current work was solely dedicated to capturing the complex physics of the incompressible turbulent flow separation with and without a plasma actuator; however, we neglected the temperature rise due to the plasma as it was considered to be very low and thus ignored [24,25]. In our computations, only the continuity and the momentum equations were considered, where the DBD plasma actuator was modeled as the source term in the momentum equation. The modified set of non-dimensional governing equations for the unsteady, incompressible, plasma induced flow is given by:
u x + v y + w z = 0
u t + u u x + v u y + w u z + p x 1 R e ( 2 u x 2 + 2 u y 2 + 2 u z 2 ) = F x , p l a s m a
v t + u v x + v v y + w v z + p y 1 R e ( 2 v x 2 + 2 v y 2 + 2 v z 2 ) = F y , p l a s m a
w t + u w x + v w y + w w z + p z 1 R e ( 2 w x 2 + 2 w y 2 + 2 w z 2 ) = F z , p l a s m a
Equation (2) represents the continuity equation, and the momentum equations are shown in (3)–(5) in the x, y, and z directions, respectively. The density is ρ ; P is the pressure; R e is the Reynolds number; and u, v, w are the velocity components in the x, y, and z directions, respectively. The right-hand side of the momentum equation represents the plasma body force source term in three-dimensional space. Equations (2)–(5) represent the complete set of equations used in this modified form of CALC-LES.

2.2. DBD Plasma Actuator Model

The phenomenological Shyy model is considered a weakly ionized, non-thermal plasma. This concept simulates the “bulk” motion of fluid flow due to the induced plasma force and is based on the model developed by Roth et al. [21] and Corke et al. [30]. An illustration of the model is shown in Figure 2.
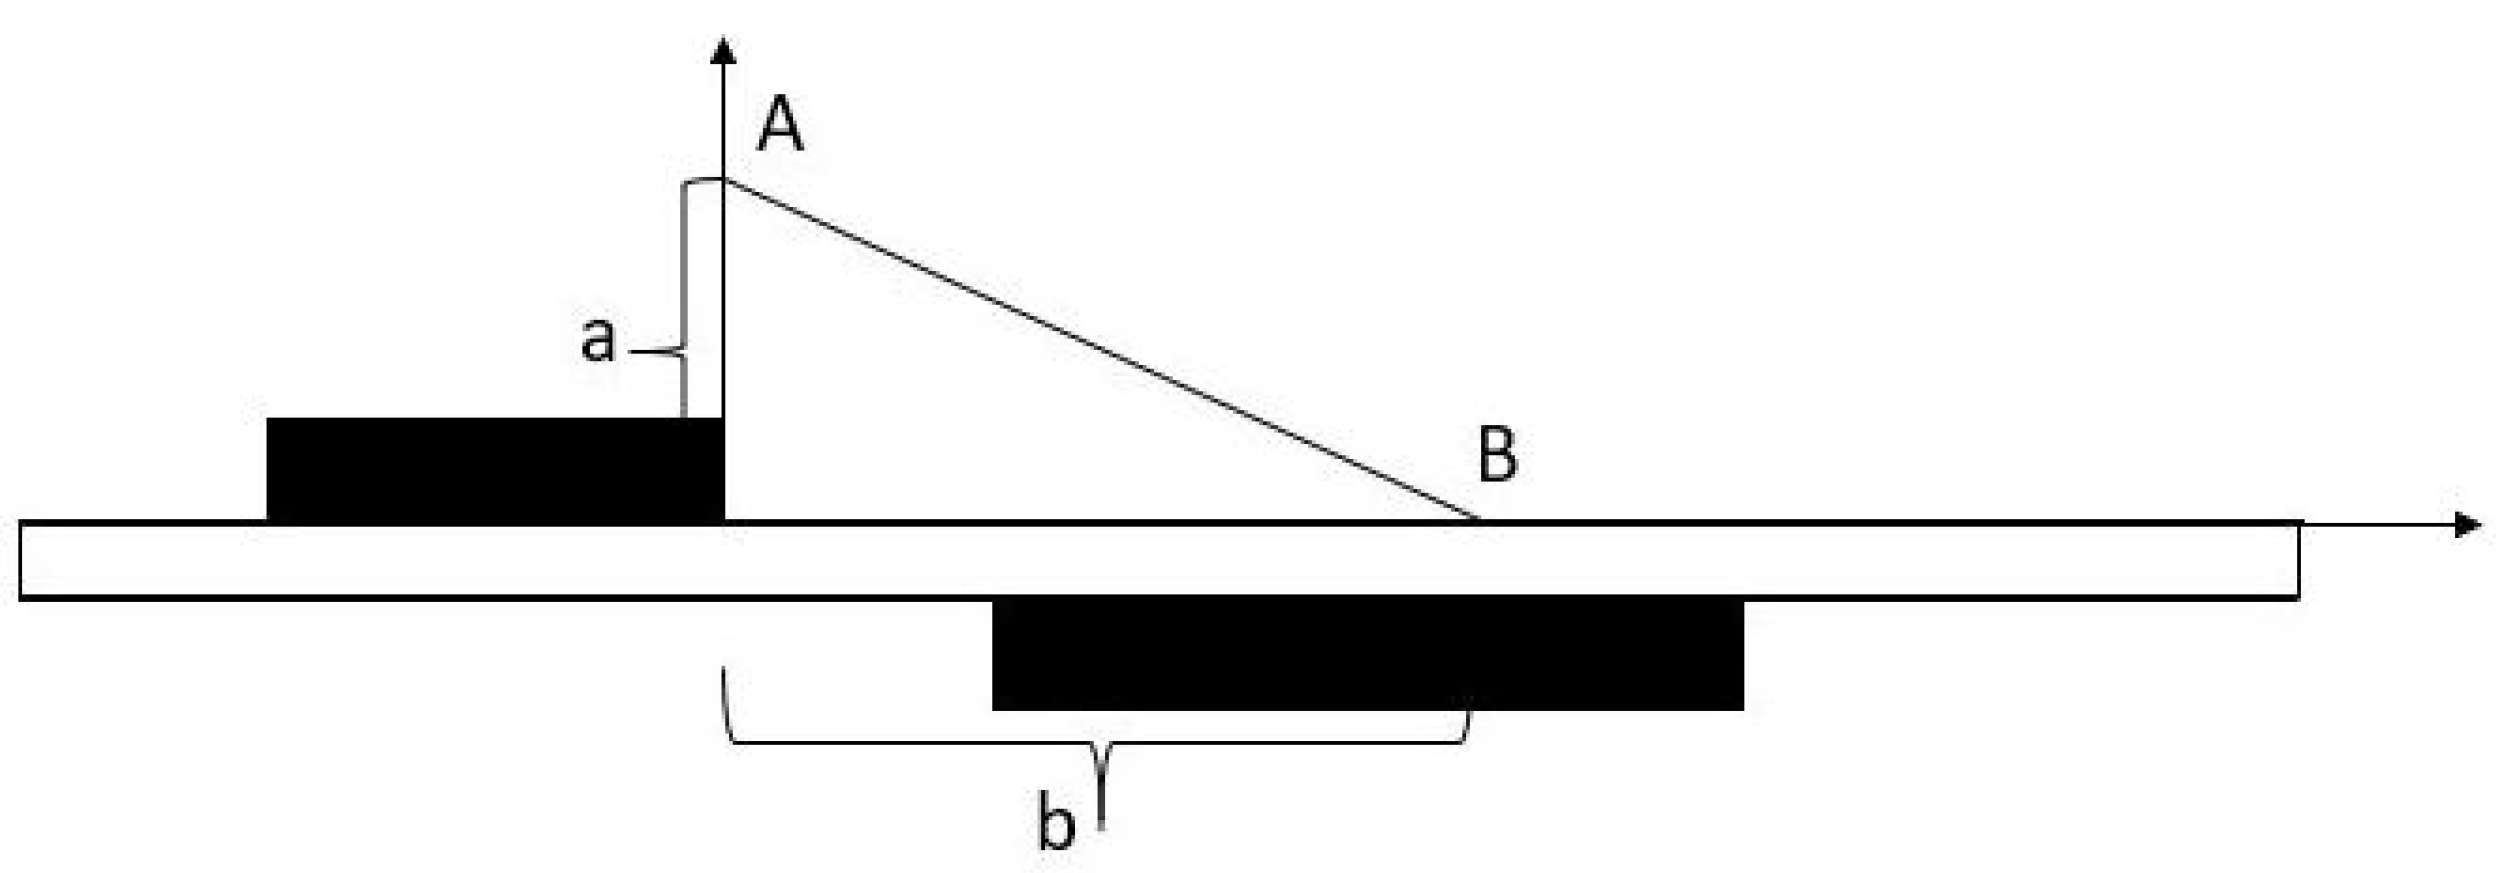
This phenomenological model assumes a linearized electric field [11,18,35,36]. Here, the body force generated from the Lorentzian collisions between ions is modeled as a source term in the momentum equation. At a high frequency, electrons travel with high velocity and produce a short duration plasma in which fluid species dissociate and recombine. Due to the greater mass of ions compared to electrons, the plasma body force is induced by momentum transfer of the ions. This is a key concept in the discharge process of the plasma actuator. The electric field lines, shown in Figure 2, roughly display the formation and strength of the electric field due to an asymmetric electric configuration and cause unidirectional force generation. Additionally, the electric field is strongest in the region near the electrodes and decreases in strength further away from the electrodes. Outside of this region, we assumed there was no plasma formation; hence, no force was generated. The force generated by the plasma can be formulated in a qualitative expression. Shyy assumed that the electric field shown was uniform, linear, and parallel. This linearized electric field distribution is shown in Figure 3.
The electric field was assumed to decrease in strength as it moved further away from the source. The electric field, Em varies linearly and is expressed as:
| E ¯ | = E 0 k 1 x k 2 y
where E 0 is the maximum electric field and k 1 and k 2 are constants representing the gradient of the electric field intensity along the x and y directions, respectively. Equation (6) shows that the electric field strength, E, varies with position and decreases with distance from the electrodes. The maximum electric field strength is expressed as:
E 0 = U d
d is the distance between the electrodes. The constants k 1 and k 2 are calculated based on the plasma boundary conditions by introducing the breakdown field strength, E b , at locations A and B from Figure 3. The equations for the electric field components are shown in (8) and (9), and the magnitude of the body force is formulated based on the definition of the electrostatic force components in the Lorentz force, shown in Equations (10) and (11).
E x = E k 2 k 1 2 + k 2 2
E y = E k 1 k 1 2 + k 2 2
f x = δ E x ρ c e c
f y = δ E y ρ c e c
ρ c is the charge density, and e c is the electron charge; both are constants. Thus, the force components are only a function of electric field strength. As a result, there is a linear increase of the induced body force magnitude with electric field strength. The function δ is used to describe the effectiveness of the plasma-induced body force. Outside the electric field, δ is zero and is unity inside the electric field.
δ = 1 f o r E < E c r
δ = 0 f o r E E c r
In our case, E c r is also represented by the breakdown electric field strength, E b . The discharge time, Δ t , of the plasma actuator is very small and is a fraction of the time of the duty cycle. The force is produced for a short amount of time, Δ t , of the first half cycle. The force during the second half cycle is negligible due to little or no plasma formation. Moreover, the force is considered as a constant because of the high-voltage frequency of the discharge. The time-averaged force over a complete cycle is expressed as:
F t a v e , x = α f x Δ t T a = α ϑ f x Δ t
F t a v e , y = α f y Δ t T a = α ϑ f y Δ t
In Equations (12) and (13), ϑ is the operating frequency and is the reciprocal of the time period, T, whereas, α is the collision efficiency. F t a v e , x and F t a v e , y are the time-averaged force components in the x and ydirections, respectively. For the two-dimensional case studies, the time-averaged forces shown in Equations (12) and (13) are added as a source term to the Navier–Stokes equations. Considering, δ = 1 , the source term is represented as:
S = 0 F x , p l a s m a F y , p l a s m a = 0 F t a v e , x F t a v e , y = 0 D c α ϑ ρ c e c Δ t E x D c α ϑ ρ c e c Δ t E y
The first term in the source vector, S, is the right-hand side of the continuity equation, whereas the second and third components represent the non-dimensional body force due to the plasma actuator. Equations (12) and 13 are used along with the introduction of D c . This term is the non-dimensional plasma force magnitude and is the ratio of the electrical to inertial forces [25,37]. E x and E y are the normalized electric field strengths.
D c = ρ c e c E r e f L r e f ρ r e f U r e f 2

2.3. CFD Solver

CALC-LES was used to simulate both the baseline and plasma actuator cases. CALC-LES is an incompressible in-house CFD solver developed by Dr. Lars Davidson of Chalmers University of Technology. It is a FORTRAN based, single block-structured finite volume CFD solver with large eddy simulation (LES), hybrid large eddy simulation (HLES), and Reynolds-averaged Navier–Stokes (RANS) turbulence modeling capabilities [38]. A detailed review of the CALC-LES structure and methodology was explained in [38,39,40,41]. CAL-LES uses the implicit fractional step technique with a multigrid pressure Poisson solver [42]. For spatial discretization of the convective term in the momentum equation, the central difference scheme was blended with an upwinding scheme. Time marching was achieved through the use of the Crank–Nicholson scheme. A hybrid RAN-LES based partially-averaged Navier–Stokes (PANS) model was used to model fine scale turbulence. PANS uses a partial averaging concept, which applies a filtering operation of the fluctuating scales.

2.4. Numerical Setup and Computational Domain

The NASA wall-mounted hump model was designed to assess the ability of turbulence models to predict separation and reattachment in an adverse pressure gradient induced separation. There are several excellent publications describing the numerical validation of this model using different numerical schemes [39,42,43,44,45,46]. The work presented in this paper was the first time that a DBD plasma actuator model was incorporated into CALC-LES to investigate and control separated flow. Moreover, the available experimental values were mostly based on a nominally two-dimensional flow field analysis. Nevertheless, the computational domain and the geometry used in this study were three-dimensional with a spanwise length of 0.2. The computational domain and grid are shown in Figure 4 and Figure 5 respectively.
Figure 4 shows the entire domain geometry; however, the modified version of the grid was used to reduce the computational domain, shown in Figure 5. The grid used for this work was the mandatory grid used for hump model computations and was provided by the Advanced Turbulence Simulation for Aerodynamic Application Challenges (ATAAC) project. The grid was fine in area close to the point of incipient separations. The mesh used for our cases had 312 × 120 × 64 cells with Z m a x = 0.2 . The details of the full geometry and initial flow conditions can be found on the NASA CFDVAL2004 and ATAAC project homepage [47]. The maximum heights of the hump and the channel were h / c = 0.128 and H / c = 0.91 , respectively.
Due to the three-dimensional wall boundary effects, the top wall was modeled as a slip wall. Inlet flow conditions were adapted from the results of a two-dimensional RANS SST k ω simulation of Prof. Strelets [42]. The Neumann boundary condition was used for the outflow (right) wall, and a symmetry boundary condition was used in the spanwise direction. A Reynolds number of 936,000, based on chord length, and the inlet velocity of 34.6 m/s were used. As both the velocity and length were normalized by the reference values, the dynamic viscosity was therefore 1 / R e .

3. Results

The result analyses were conducted for two cases: (1) the baseline case with no plasma actuator and (2) the case with the plasma actuator turned on. For the baseline case simulation, subsonic flow over the NASA wall-mounted hump model was simulated with a Mach number of 0.1 and a Reynolds number of 936,000. This baseline case analysis was mainly carried out to observe the turbulent flowfield, capture the separation on the hump surface, and compare the results to the available experimental data. The flow parameters used for the simulations are tabulated below in Table 1.

3.1. Baseline Case

In order to investigate the effects of a plasma actuator on a subsonic, incompressible flowfield numerically, it was necessary to understand the baseline flowfield prior to computing results with the plasma actuator turned on. The computational results were compared to the experimental results obtained by Greenblatt et al. [48,49]. As the three-dimensional domain was used for the computation, the upper wall of the domain was modified to compensate for the effects of the side plates. The baseline model of the hump was also studied by several researchers [39,42,43,44,45,46]. The time step of the computations was 0.002. Time-averaged variables were calculated after 7500 time steps, and sample data were collected after 7500 time steps. The time steps were chosen based on the Strouhal number of 0.2.
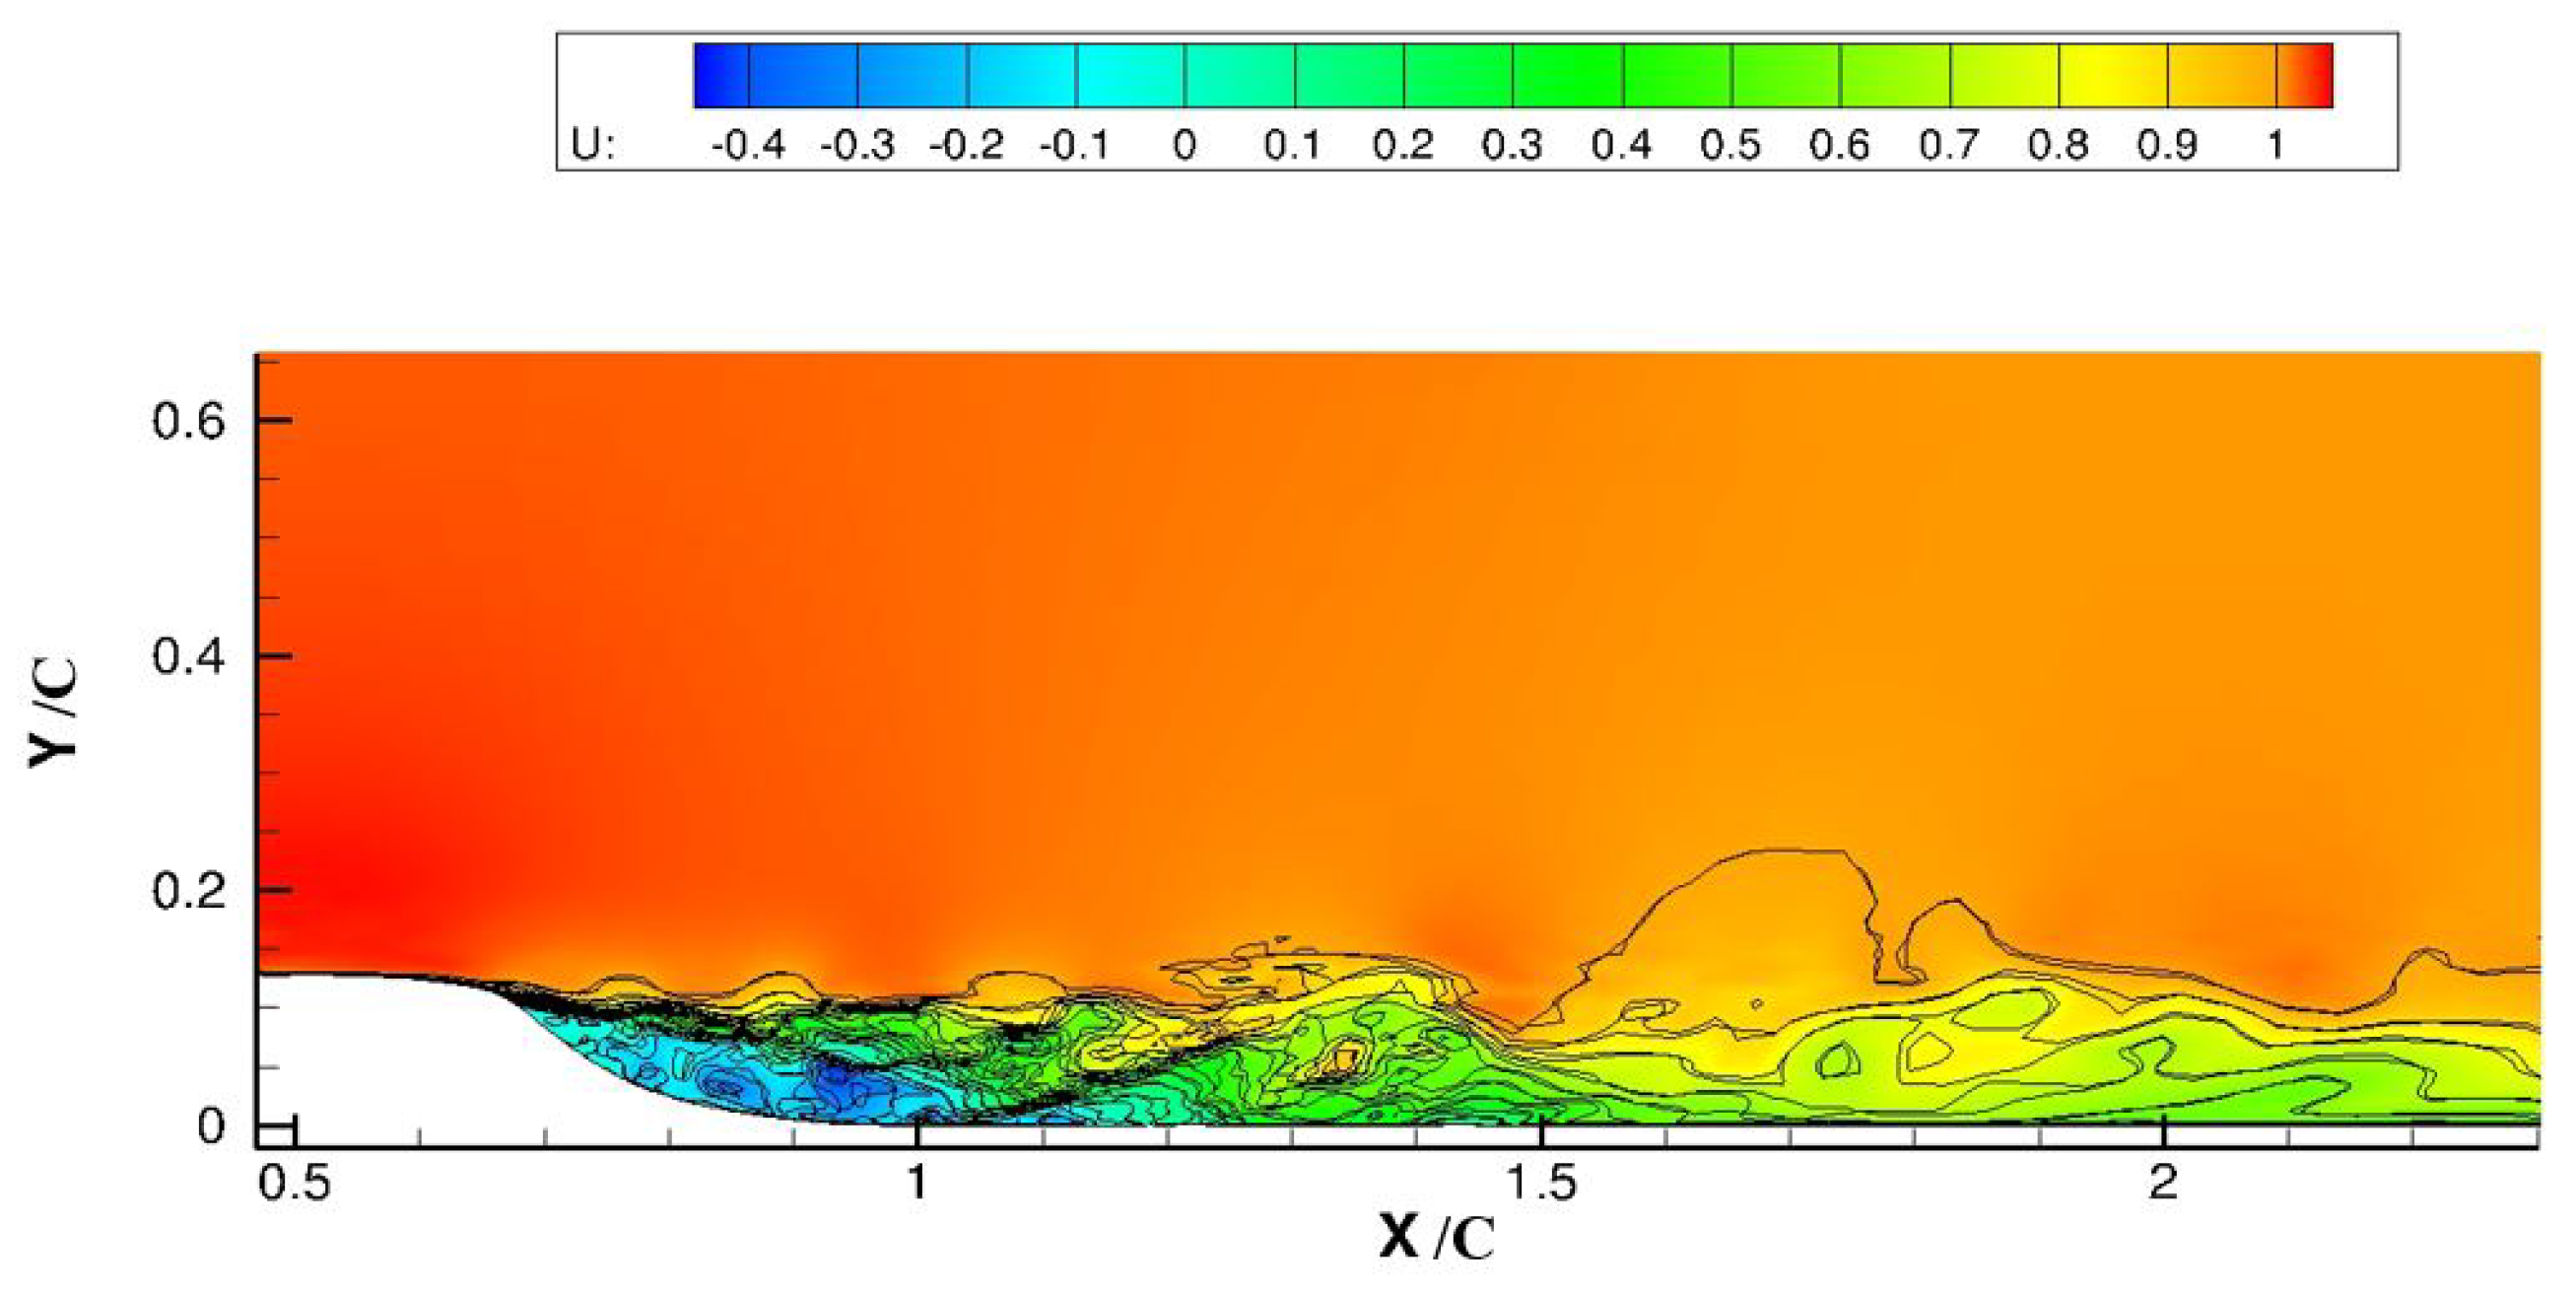
Figure 6 shown above highlights the turbulent boundary layer flow separation in terms of velocity streamlines and vectors. Figure 6a,b represents the velocity streamlines and vectors, respectively. The streamline figure helps to observe visually the location of the unsteady flow separation on the leeside of the hump due to the adverse pressure gradient. It was observed from the result that the flow separation region was roughly between the non-dimensional length of 0.65 and 1.2. The velocity vectors in Figure 6b magnified the presence of the flow reversal. The instantaneous u-velocity contour shown in Figure 7 also captured the flow separation.
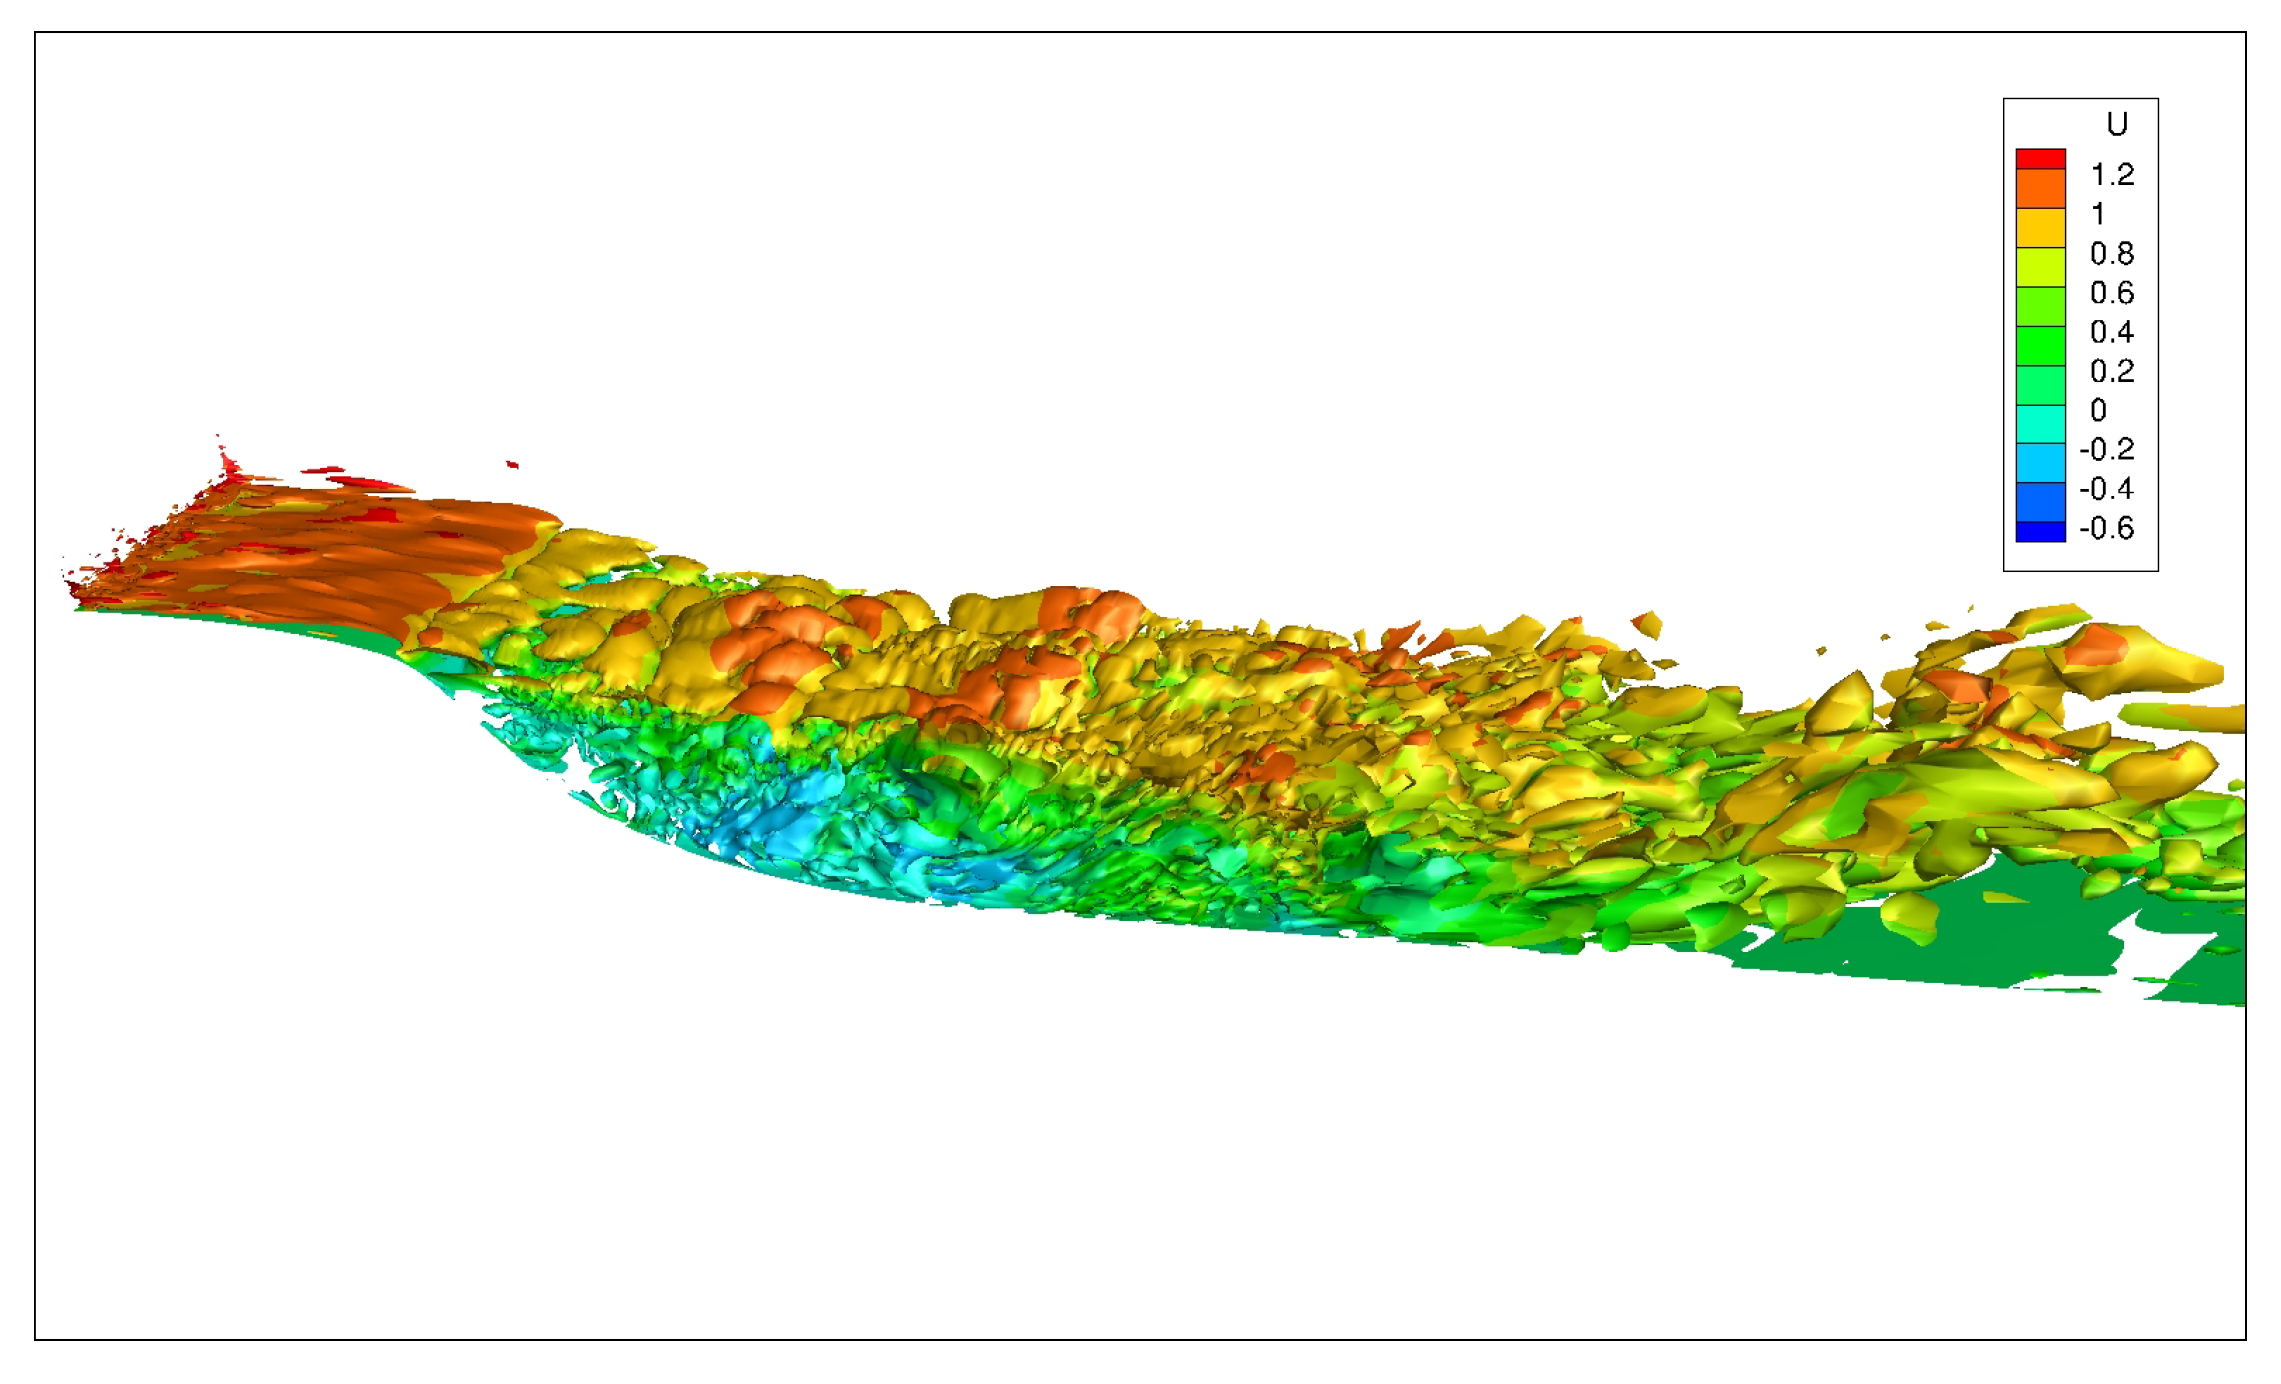
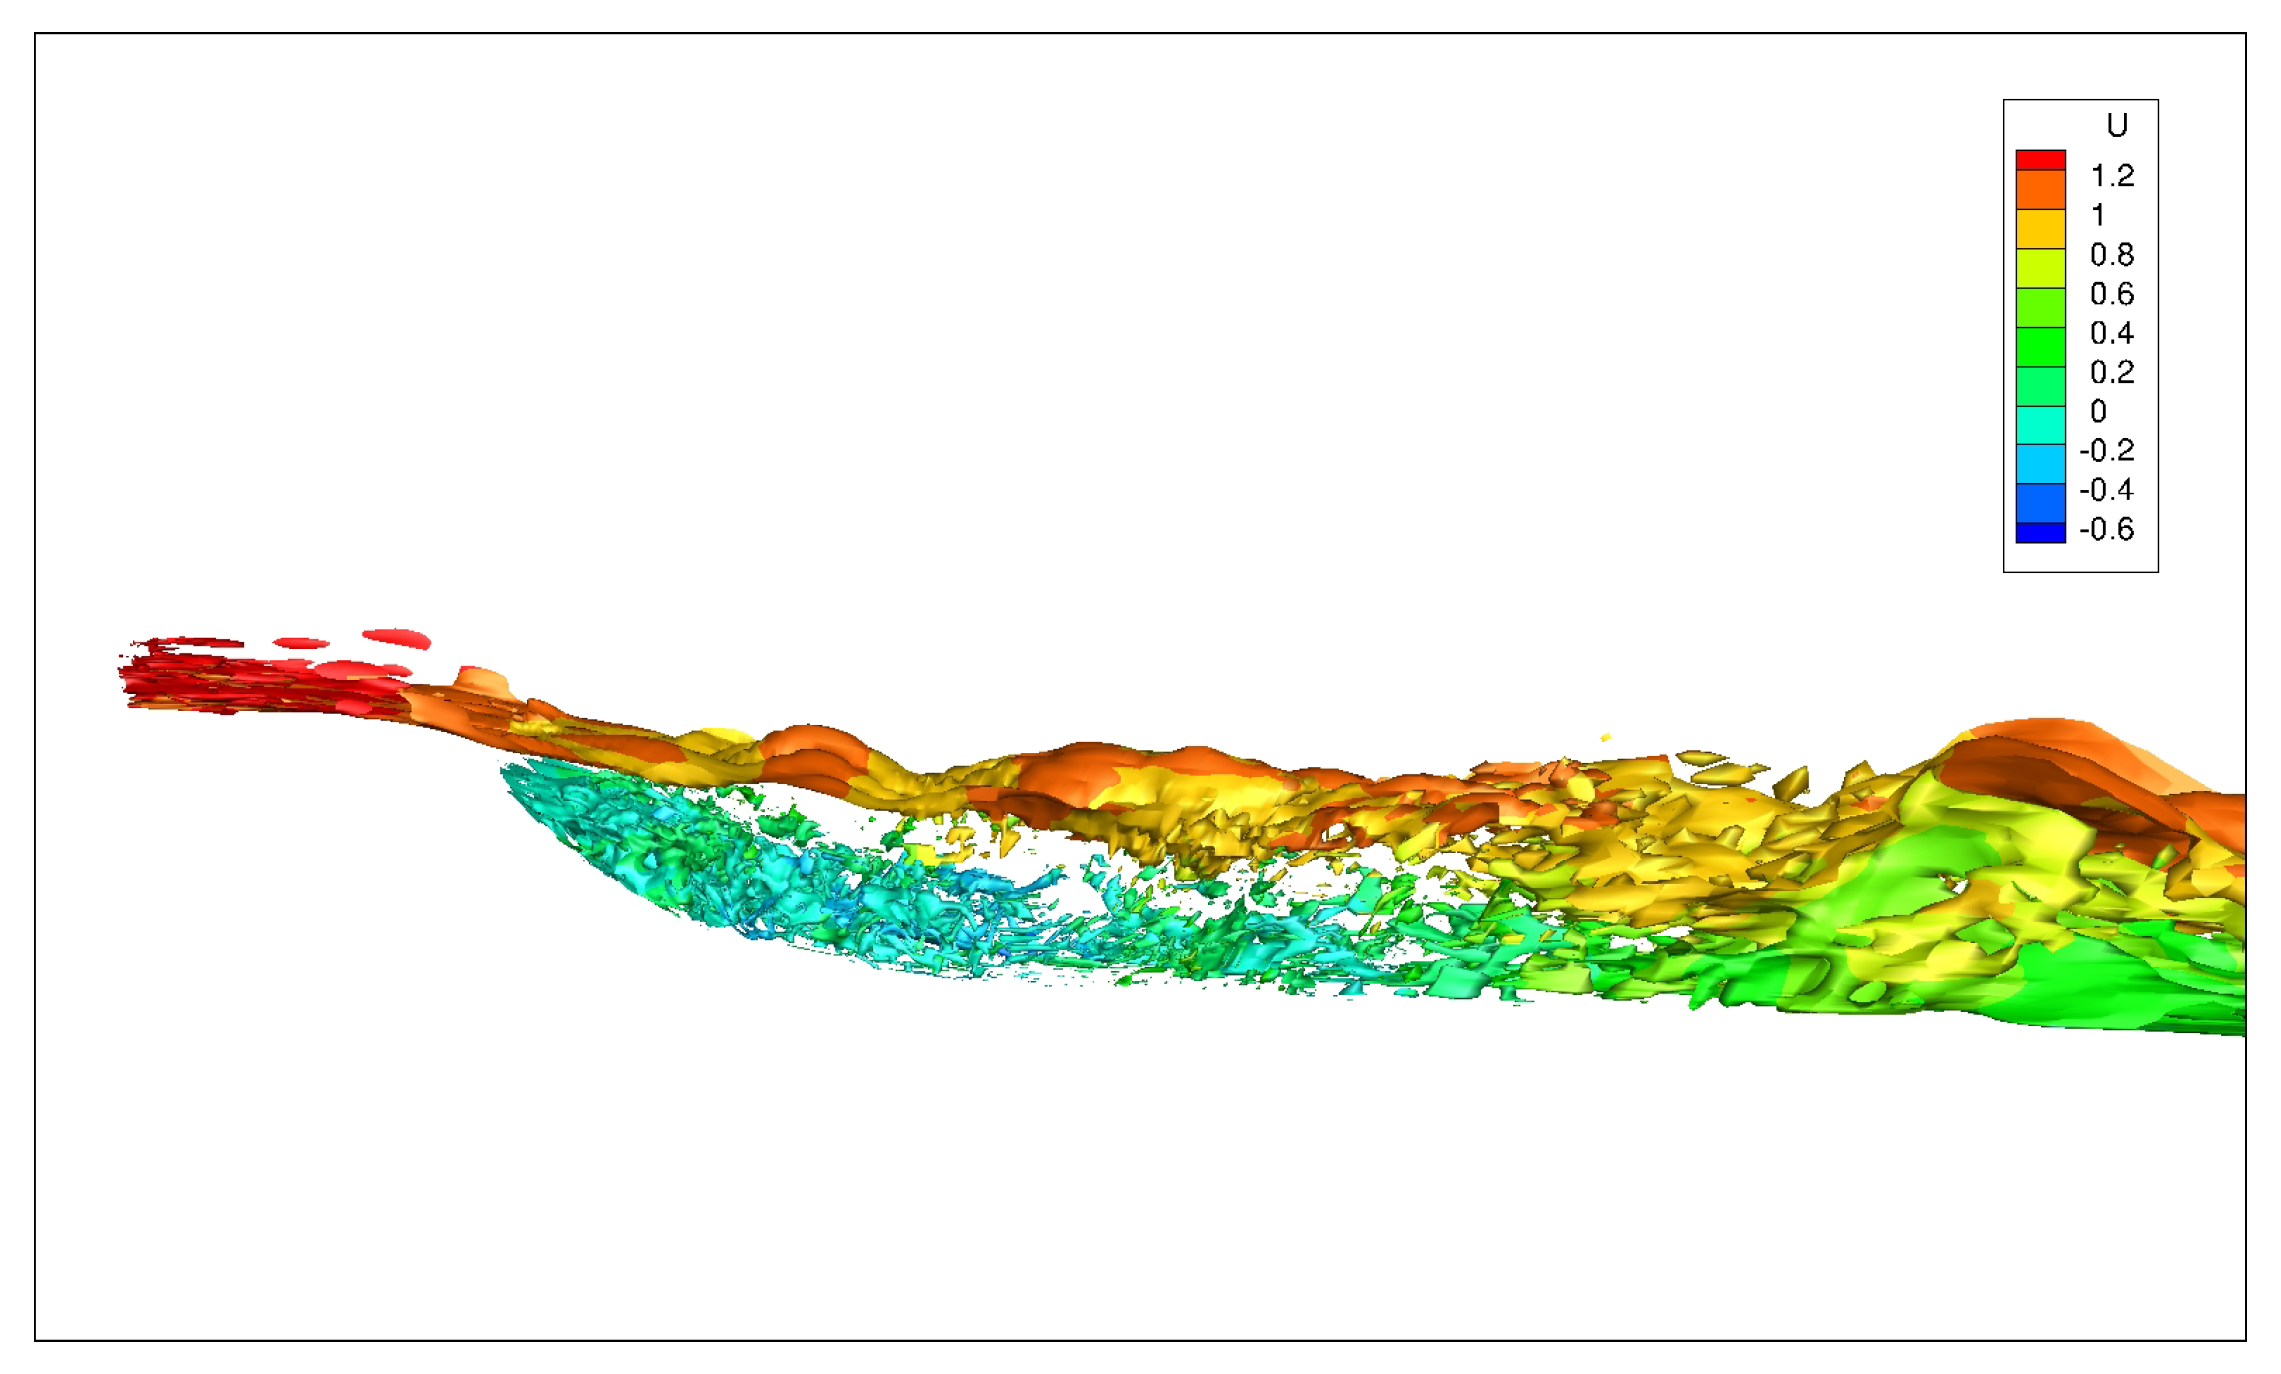
Figure 7 shows the unsteady velocity flow field due to the turbulence. The blue region in the contour plot indicates the negative u-velocity, hence indicating the reversing flow region. The Q-criterion was the second variant of the velocity gradient tensor demonstrating the relative dominance of the rotational component of the velocity gradient over the stretching component in the deformation of a fluid element. The iso-surface of Q-criterion on the hump surface depicted the flow separation in the three-dimensional configuration shown in Figure 8. An instantaneous iso-surface of Q = 150 colored by the streamwise velocity magnitude exhibited the complex nature of flow separation at the aft portion of the hump. The vorticity magnitude of the flow over the hump is presented in Figure 9. It is noticeable from both figures that the turbulent length scales were larger downstream of the separation region.
For external flow over an object, the resistive drag force consisted of the pressure drag and the drag due to surface roughness, known as the skin friction. The skin friction coefficient and the pressure coefficient are both non-dimensional parameters that represent the pressure and skin friction drag normalized by dynamic pressure and are defined as,
C f = τ w a l l 1 2 ρ r e f U r e f 2 ; C p = p p r e f 1 2 ρ r e f U r e f 2
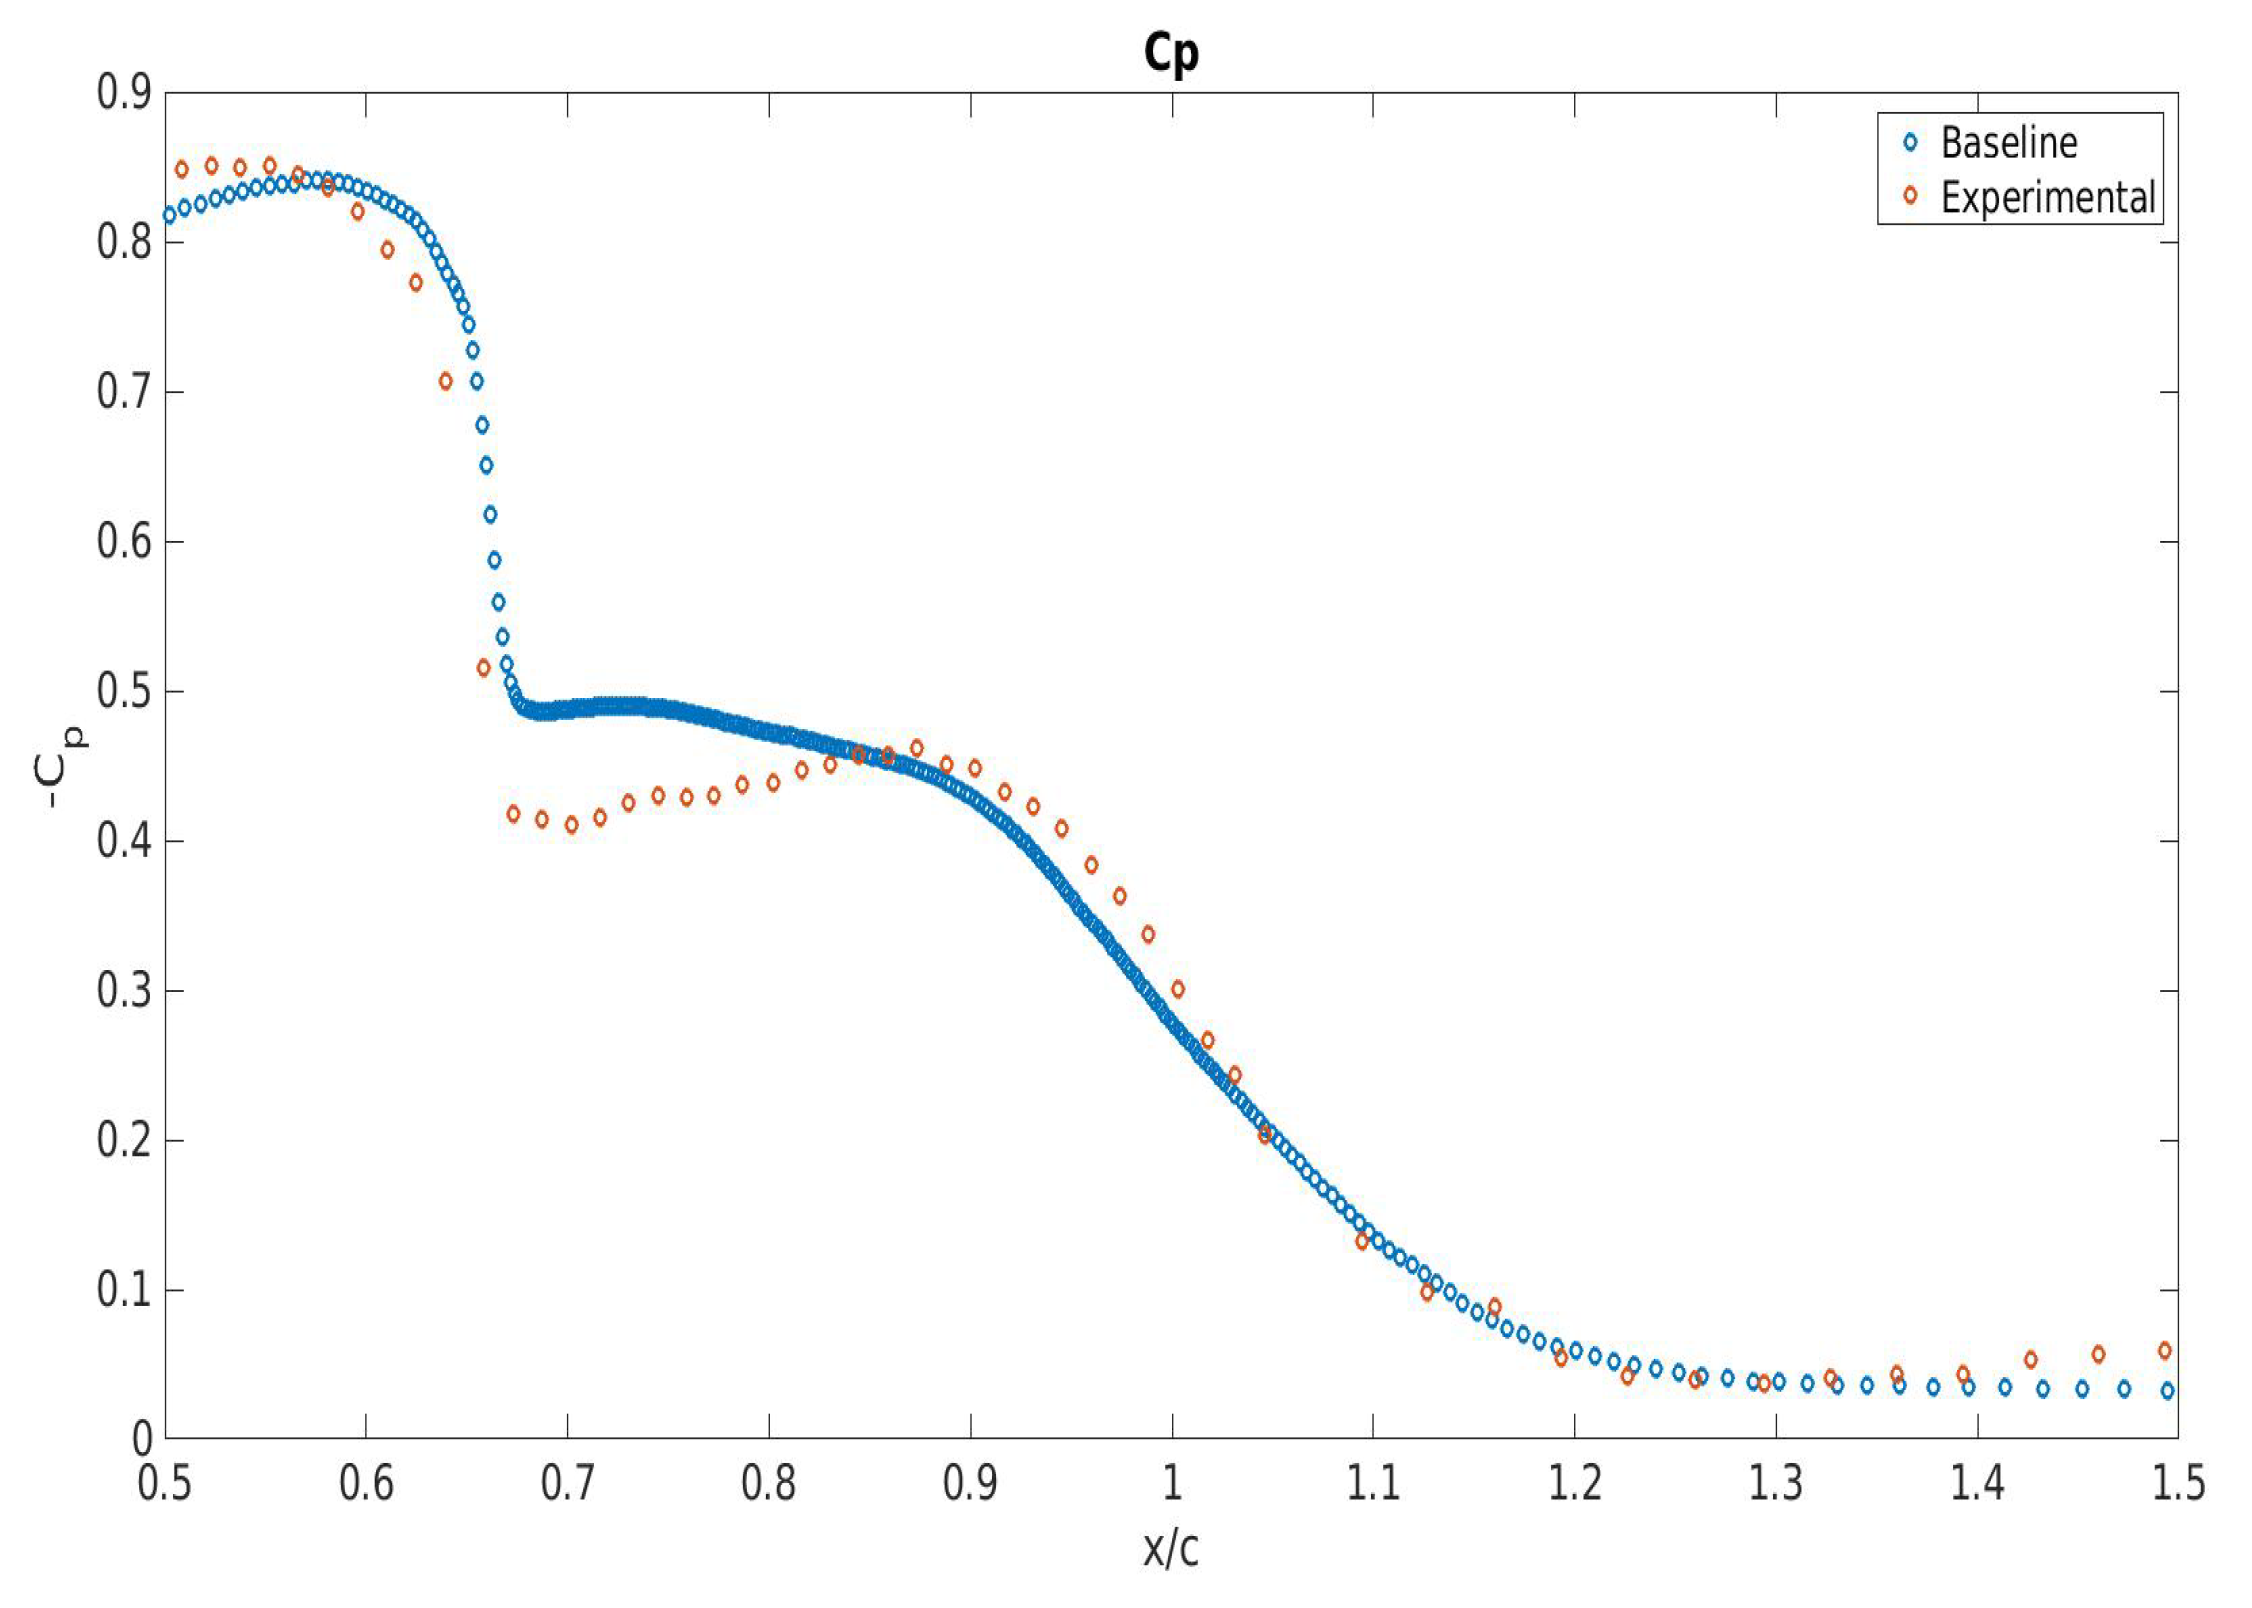
Figure 10 and Figure 11 represent the skin friction coefficient and the pressure coefficient, respectively. In both cases, the numerical result was compared with the available experimental result, recorded by Greenblatt [49]. It was observed that the baseline numerical results using CALC-LES predicted the experimental results with reasonable accuracy, thus proving the solver’s ability to compute the flowfield using a hybrid turbulence model. The separation and reattachment of the flow near the wall could be estimated from the skin friction where the C f value was zero. From Figure 10, the separation location was identified at x / c = 0.66 for both the numerical and experimental results; whereas the reattachment location for the numerical result was slightly higher than the experimental. The reattachment location was at x / c = 1.1 from the experimental result and x / c = 1.13 from the numerical result. Figure 11 shows the pressure coefficient along the hump wall.
The pressure coefficient, C p , showed the adverse pressure gradient produced on the hump wall, which resulted in flow separation. The pressure increased until the flow reached its location at x / c = 0.66 , followed by a sharp decrease of C p at that position, which indicated the flow separation at location x / c = 0.66 . Reattachment at the hump’s trailing edge is also found in the figure. The reason for the discrepancy between the numerical and experimental results in the separated region could be due to the end plate effects in the experimental measurements. This was also supported by the results shown by Duda et al. [50], where the numerical results considering the end-plates gave better agreement with the experimental values. Noteworthy is that the numerical simulations for this work were carried out without the consideration of end plates.
Figure 12 shows the mean u-velocity component comparisons at different streamwise stations. The stations were selected locations that were comprised of pre-separation, separation, and post-separation regions, located at x / c = 0.65 , x / c = 0.80 , x / c = 0.90 , x / c = 1.1 , x / c = 1.2 , and x / c = 1.3 . The difference between the experimental (orange dotted line) and numerical results (blue solid line) was minimal and therefore showed good agreement. The results were consistent with similar numerical simulations carried out in [19,34,42,44,51]. However, the usage of high-fidelity models could improve the numerical predictions. Locations x / c = 0.80 and x / c = 0.90 were the locations inside the separation region and could be identified from the velocity boundary layer profile seen in Figure 12. The other locations were unaffected by flow separation, in which the first one, i.e, x / c = 0.65 , was the location upstream of the separation and x / c = 1.3 was the downstream location of the separation.
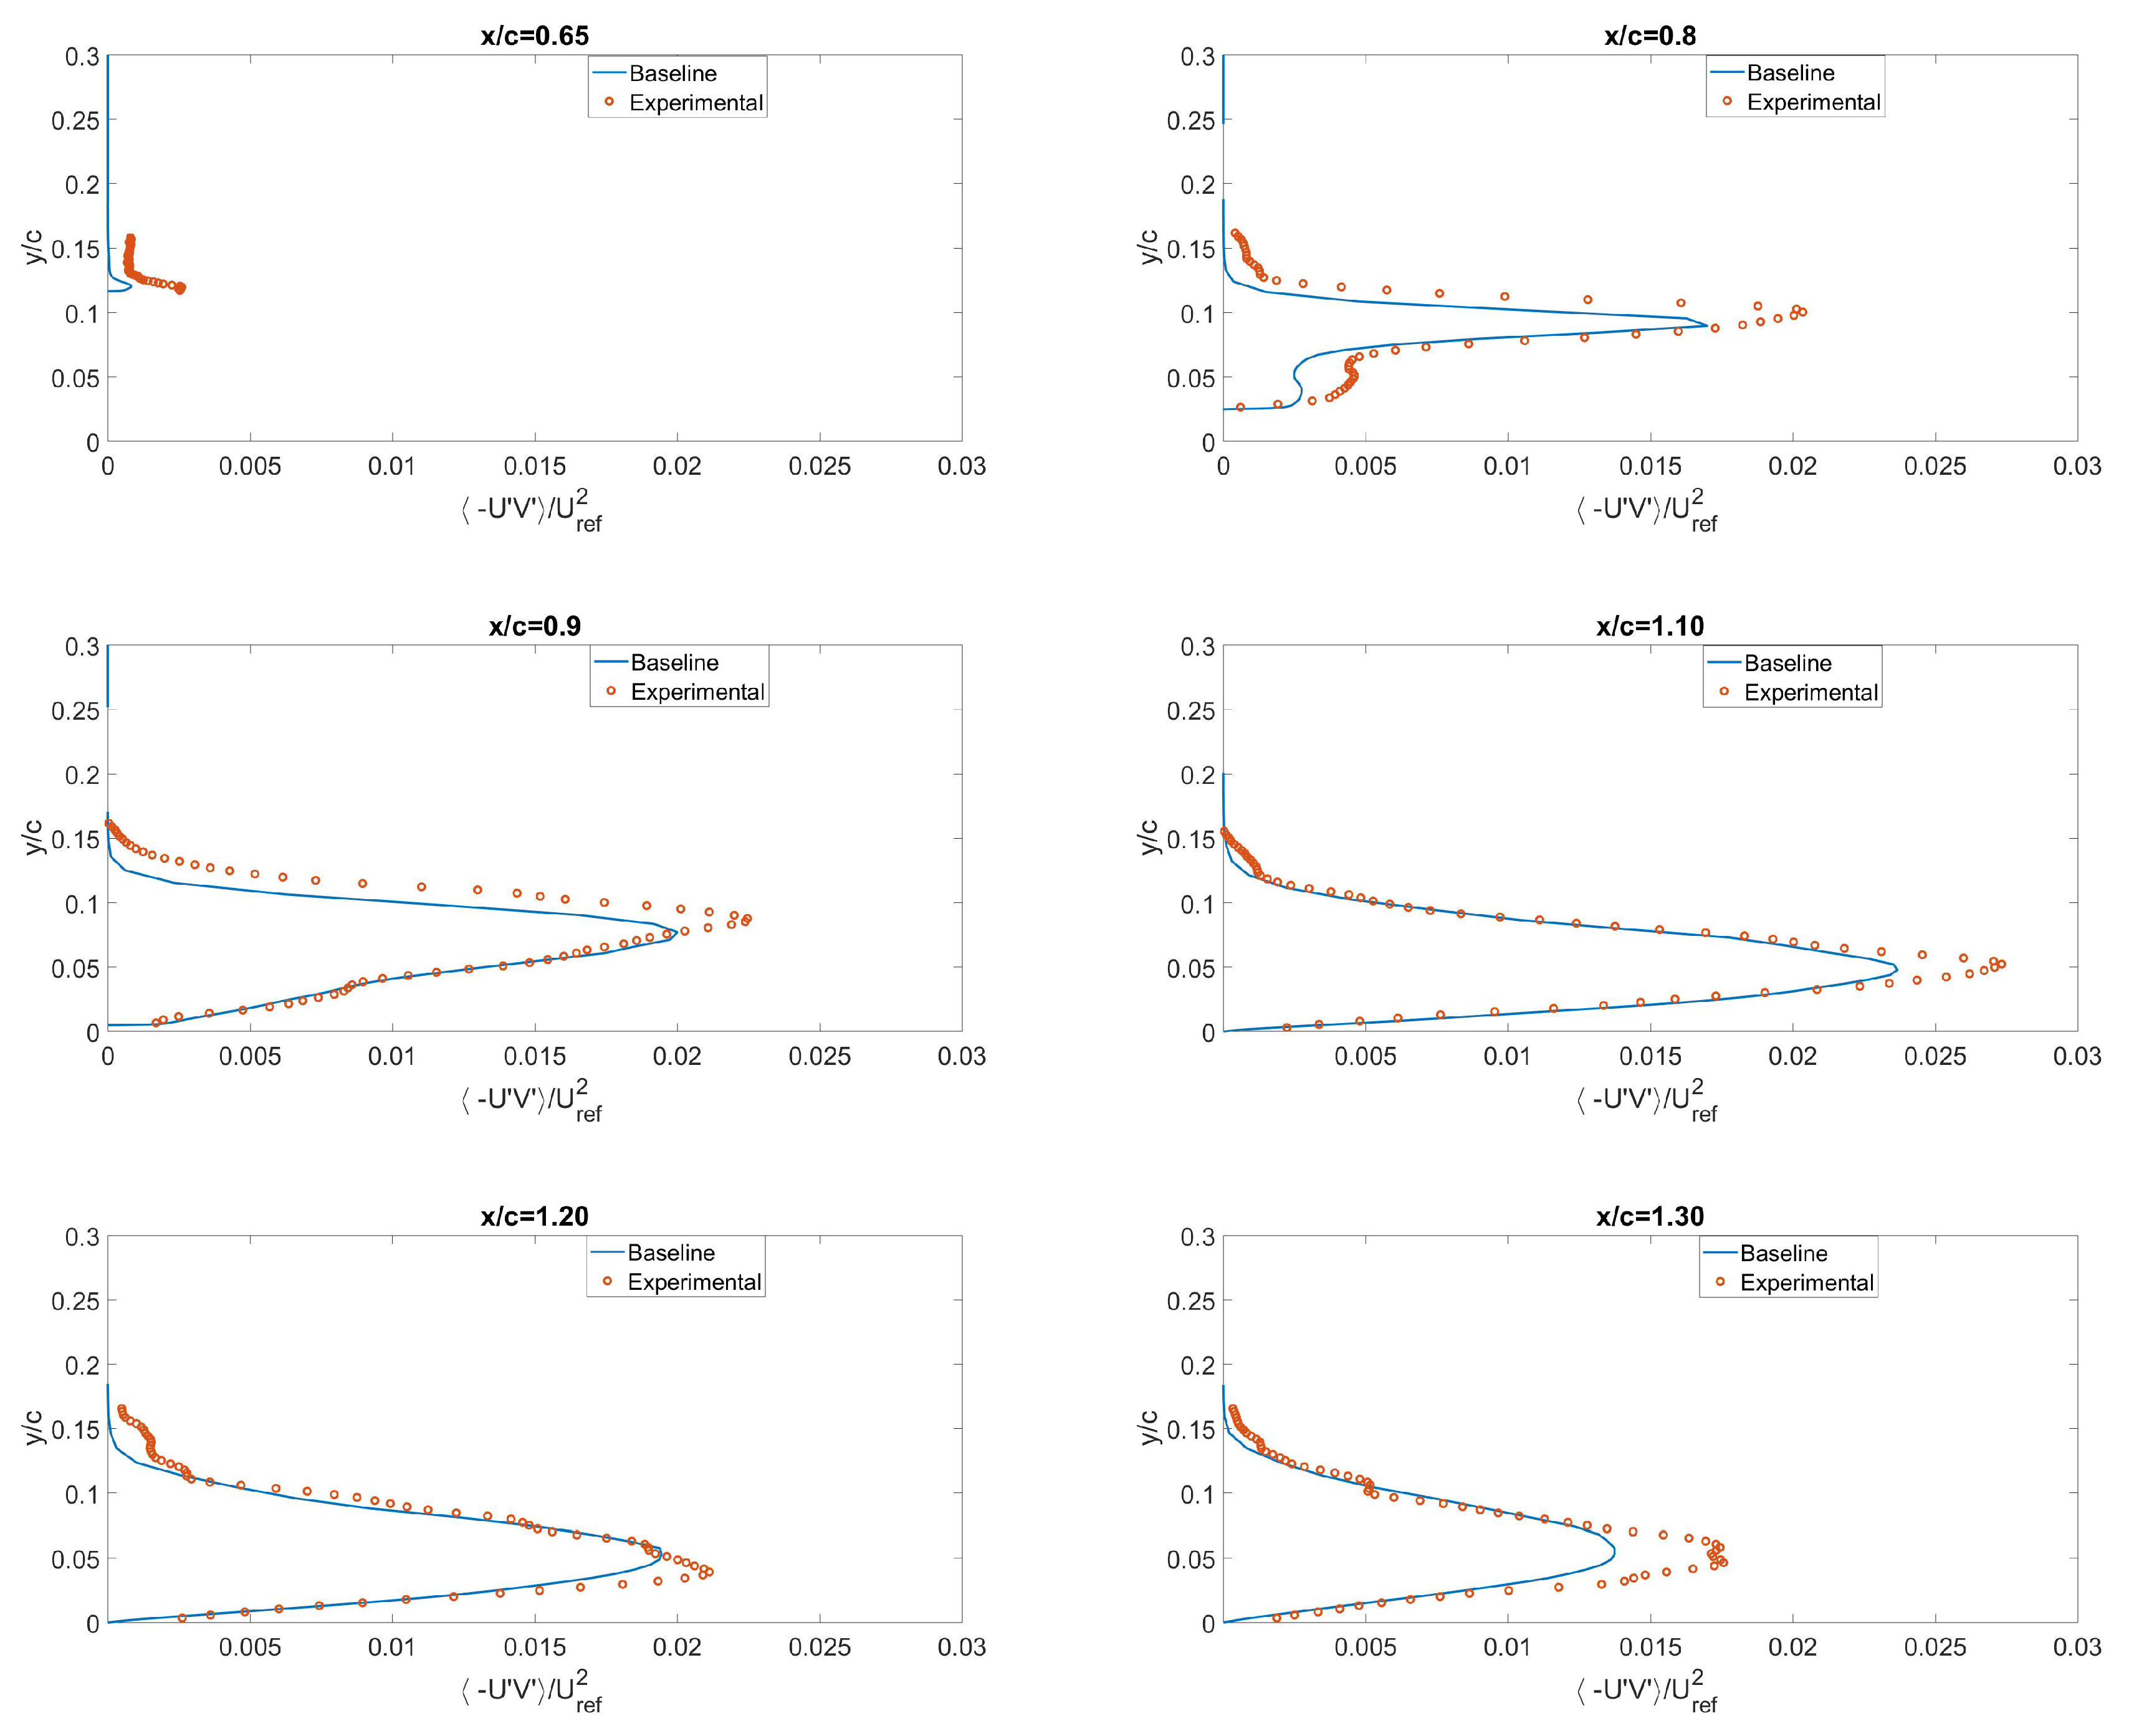
The Reynolds shear stresses were compared to the experimental values. Figure 13 shows the mean Reynolds shear stresses comparisons at similar streamwise locations that were shown in Figure 12. The numerical results underpredicted the Reynolds stresses compared to the experimental particle image velocimetry (PIV) results. The most noticeable difference was found at location x / c = 0.65 , which showed greater shear. The PIV technique inherently had measurement uncertainties close to the wall as seed particles could not get very close to the wall. This was one potential reason for the difference between the numerical and experimental results shown in Figure 13. The error sources of the PIV technique and relative uncertainties associated with it were mentioned in [52]. Smith et al. discussed Reynolds stress uncertainties due to PIV errors [53]. This inherent error is equally problematic for flows suffering separation. It was noted in [44] that the PIV experimental value just upstream of the flow separation is not sufficiently accurate in the near wall region. Figure 13 represents the mean u v normalized stress components and indicates added shear stress accompanied by the separation.

3.2. Plasma Actuator Case

The hump model is a modified design of the Glauert airfoil and is used as a benchmark model for the CFD validation in flow separation at the NASA Langley workshop for synthetic jets and turbulence separation control. The baseline results suggested that the separation began at position x / c = 0.66 , and so, the DBD plasma actuator was placed at that location. A total of five test cases were investigated for the plasma actuator simulations, based on the applied voltage frequency and the plasma actuator location. Table 2 below displays the test cases.
Section 3.2 only describes the results of Test Case 1, whereas, the remaining test cases are discussed in the subsequent subsections. The length and the height of the plasma actuator were denoted by b and a respectively, where the normalized height a / c = 0.018 and normalized length b / c = 0.024 . The plasma actuator location was modeled as a body force term in the momentum equation stated in Equation (14). The parametric values of the body force terms described in Table 3 were based on the original Shyy model.
The non-dimensional plasma body force term, D c , was calculated using the formulation stated in Equation (15). The value of D c was calculated based on model geometry and flow conditions. The plasma induced force pushed the existing fluid through the separation zone to reduce or eliminate the flow separation. The magnitude of this force was directly dependent on the plasma size, applied voltage frequency, and electric field strength. Thus, changing these parameters would cause changes in the magnitude of the force. The parameter values needed for the plasma model are illustrated in Table 3.
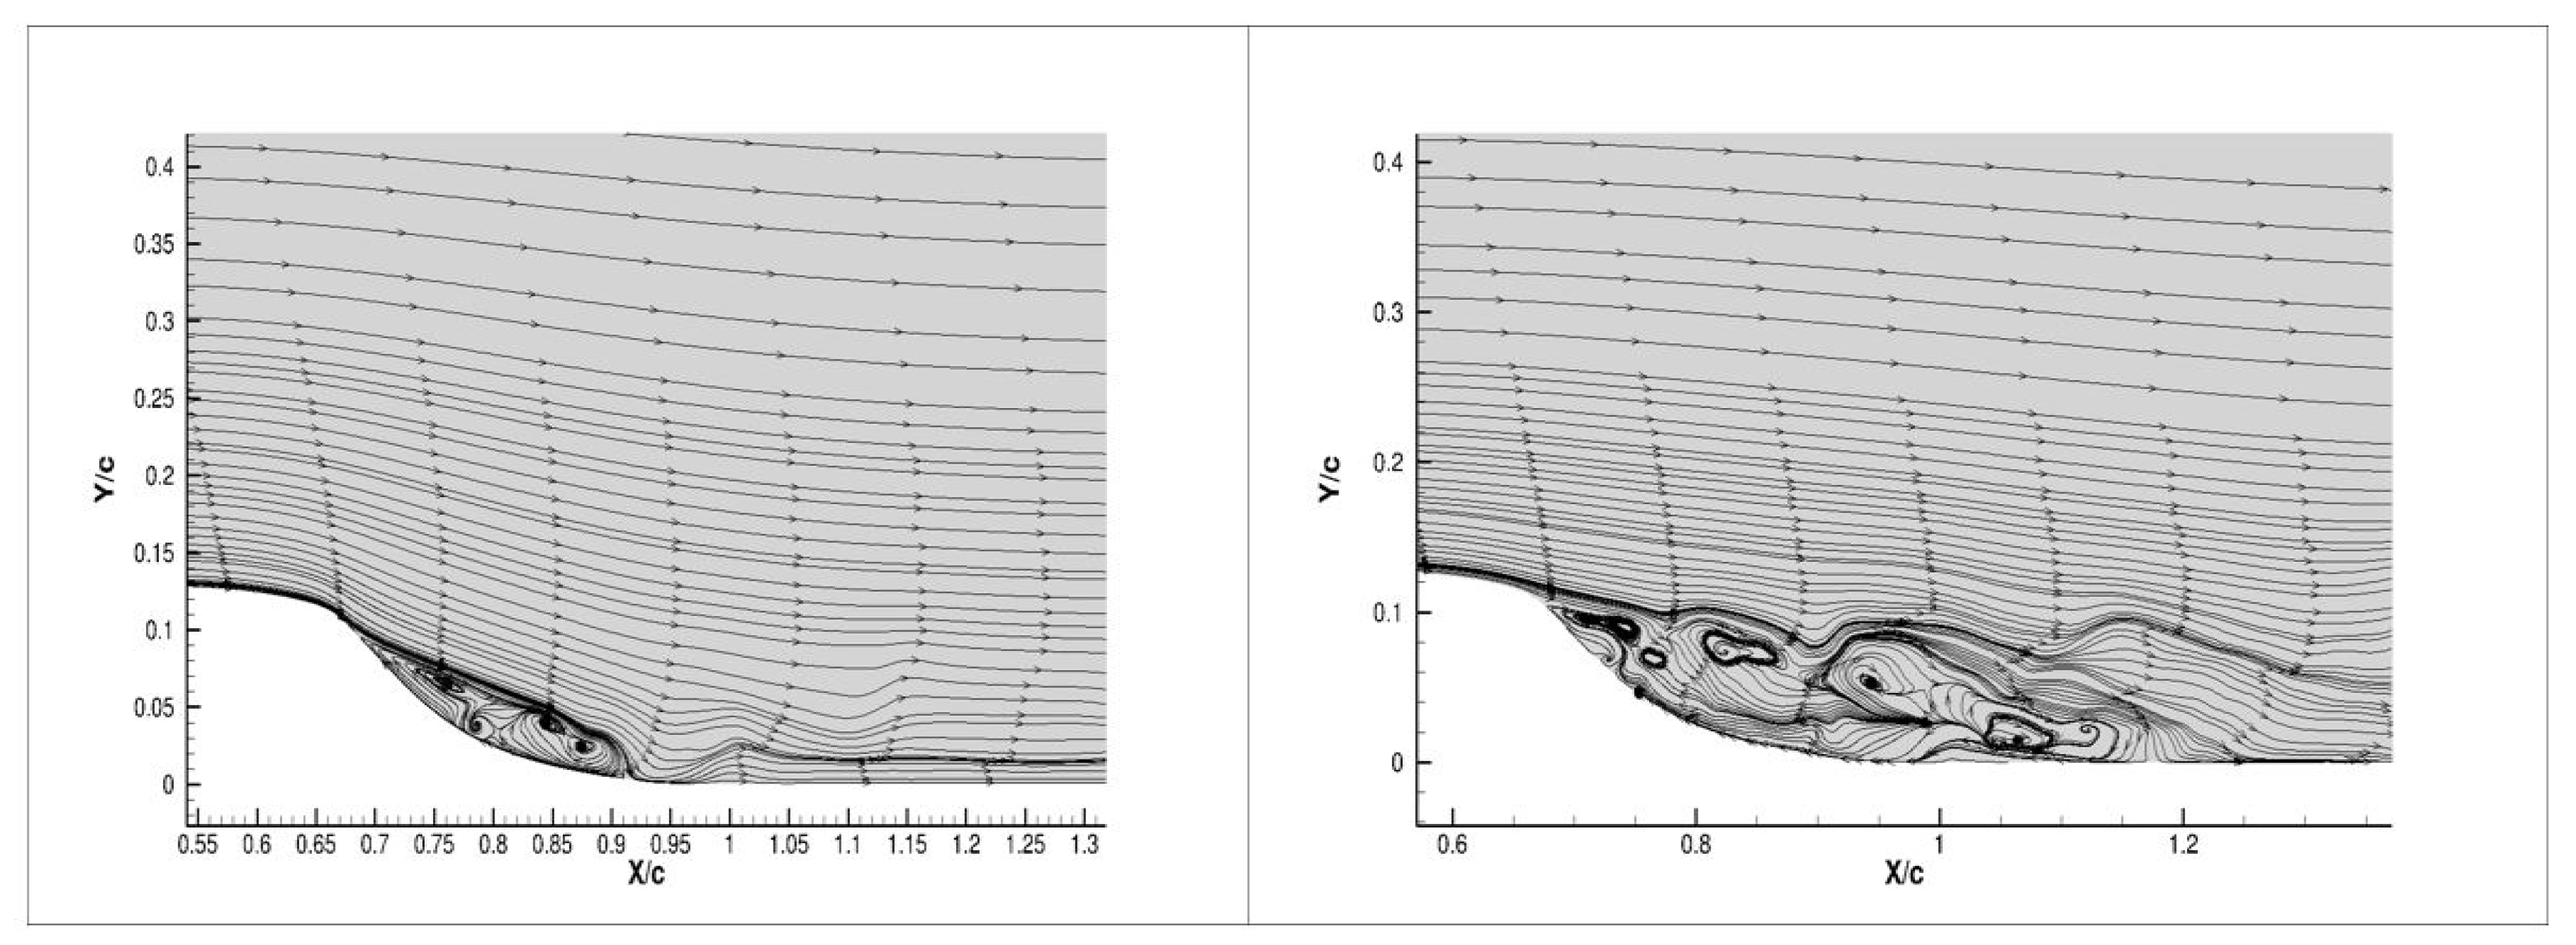
Figure 14 shows the comparison between the baseline and plasma cases using velocity streamlines. The plasma induced streamlines are at the left side of Figure 14, whereas the right side of the figure represents the baseline result also shown in Figure 6a. The side-by-side representation of the streamline results indicated the changes in the flow field due to the plasma actuator. There was a substantial reduction in flow separation over the hump surface due to plasma induced force. Nevertheless, the quantitative description of flow separation and flow reattachment was understood from the coefficient of skin friction and the coefficient of pressure displayed in Figure 15 and Figure 16, respectively.
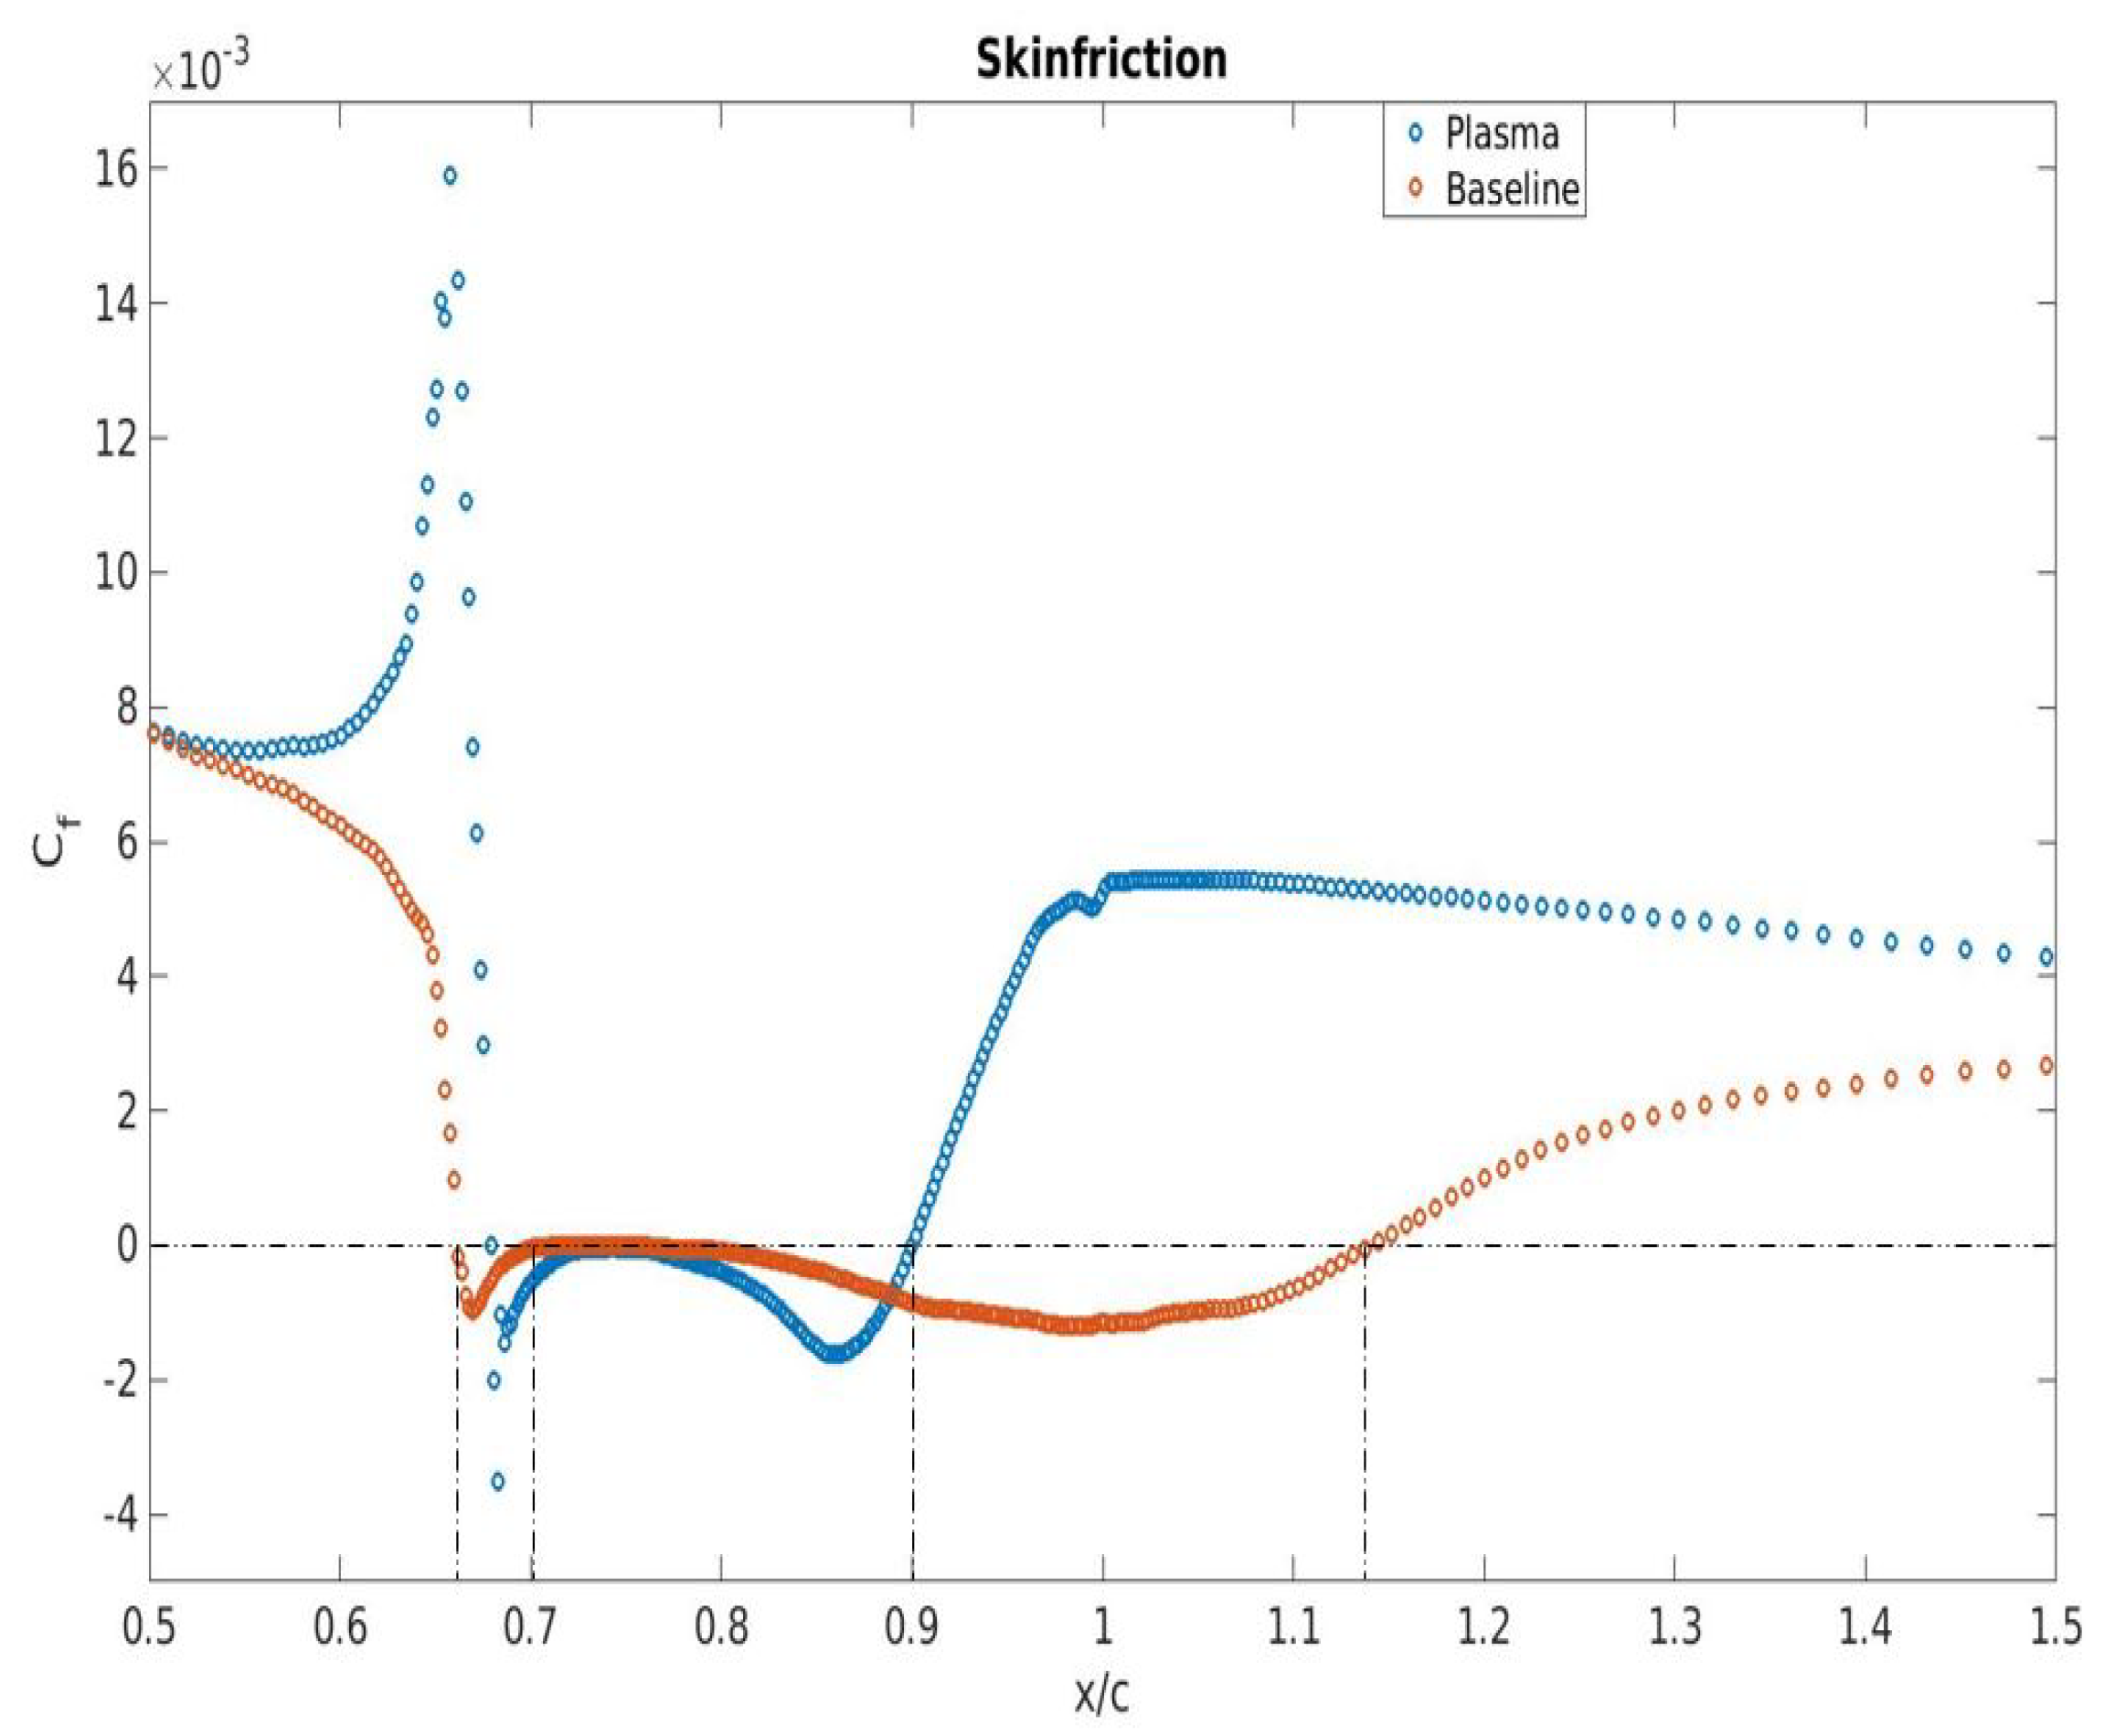
The skin friction coefficient gave a precise location of the flow separation and flow reattachment. At the time of flow separation, the C f value decreased to zero, and it rose to zero when the flow reattached. Figure 15 shows the skin friction coefficient in the plasma actuator case and compares the result to the baseline case. The blue line represents the plasma actuator case, and the red line represents the baseline case. A change in the skin friction coefficient is shown in the figure. There was a small delay in separation at the leeside of the hump. The separation started at location x / c = 0.69 . The biggest difference was found where the flow reattached. Flow reattachment occurred at location x / c = 0.9 . The overall separation region for the plasma enabled flow was from x / c = 0.68 to x / c = 0.90 , and the separation region was between location x / c = 0.66 and x / c = 1.13 for the baseline case. Thus, the overall flow separation was reduced by a reasonable margin. The horizontal dotted line is placed at C f equal to zero to determine the streamwise locations of separation and reattachment.
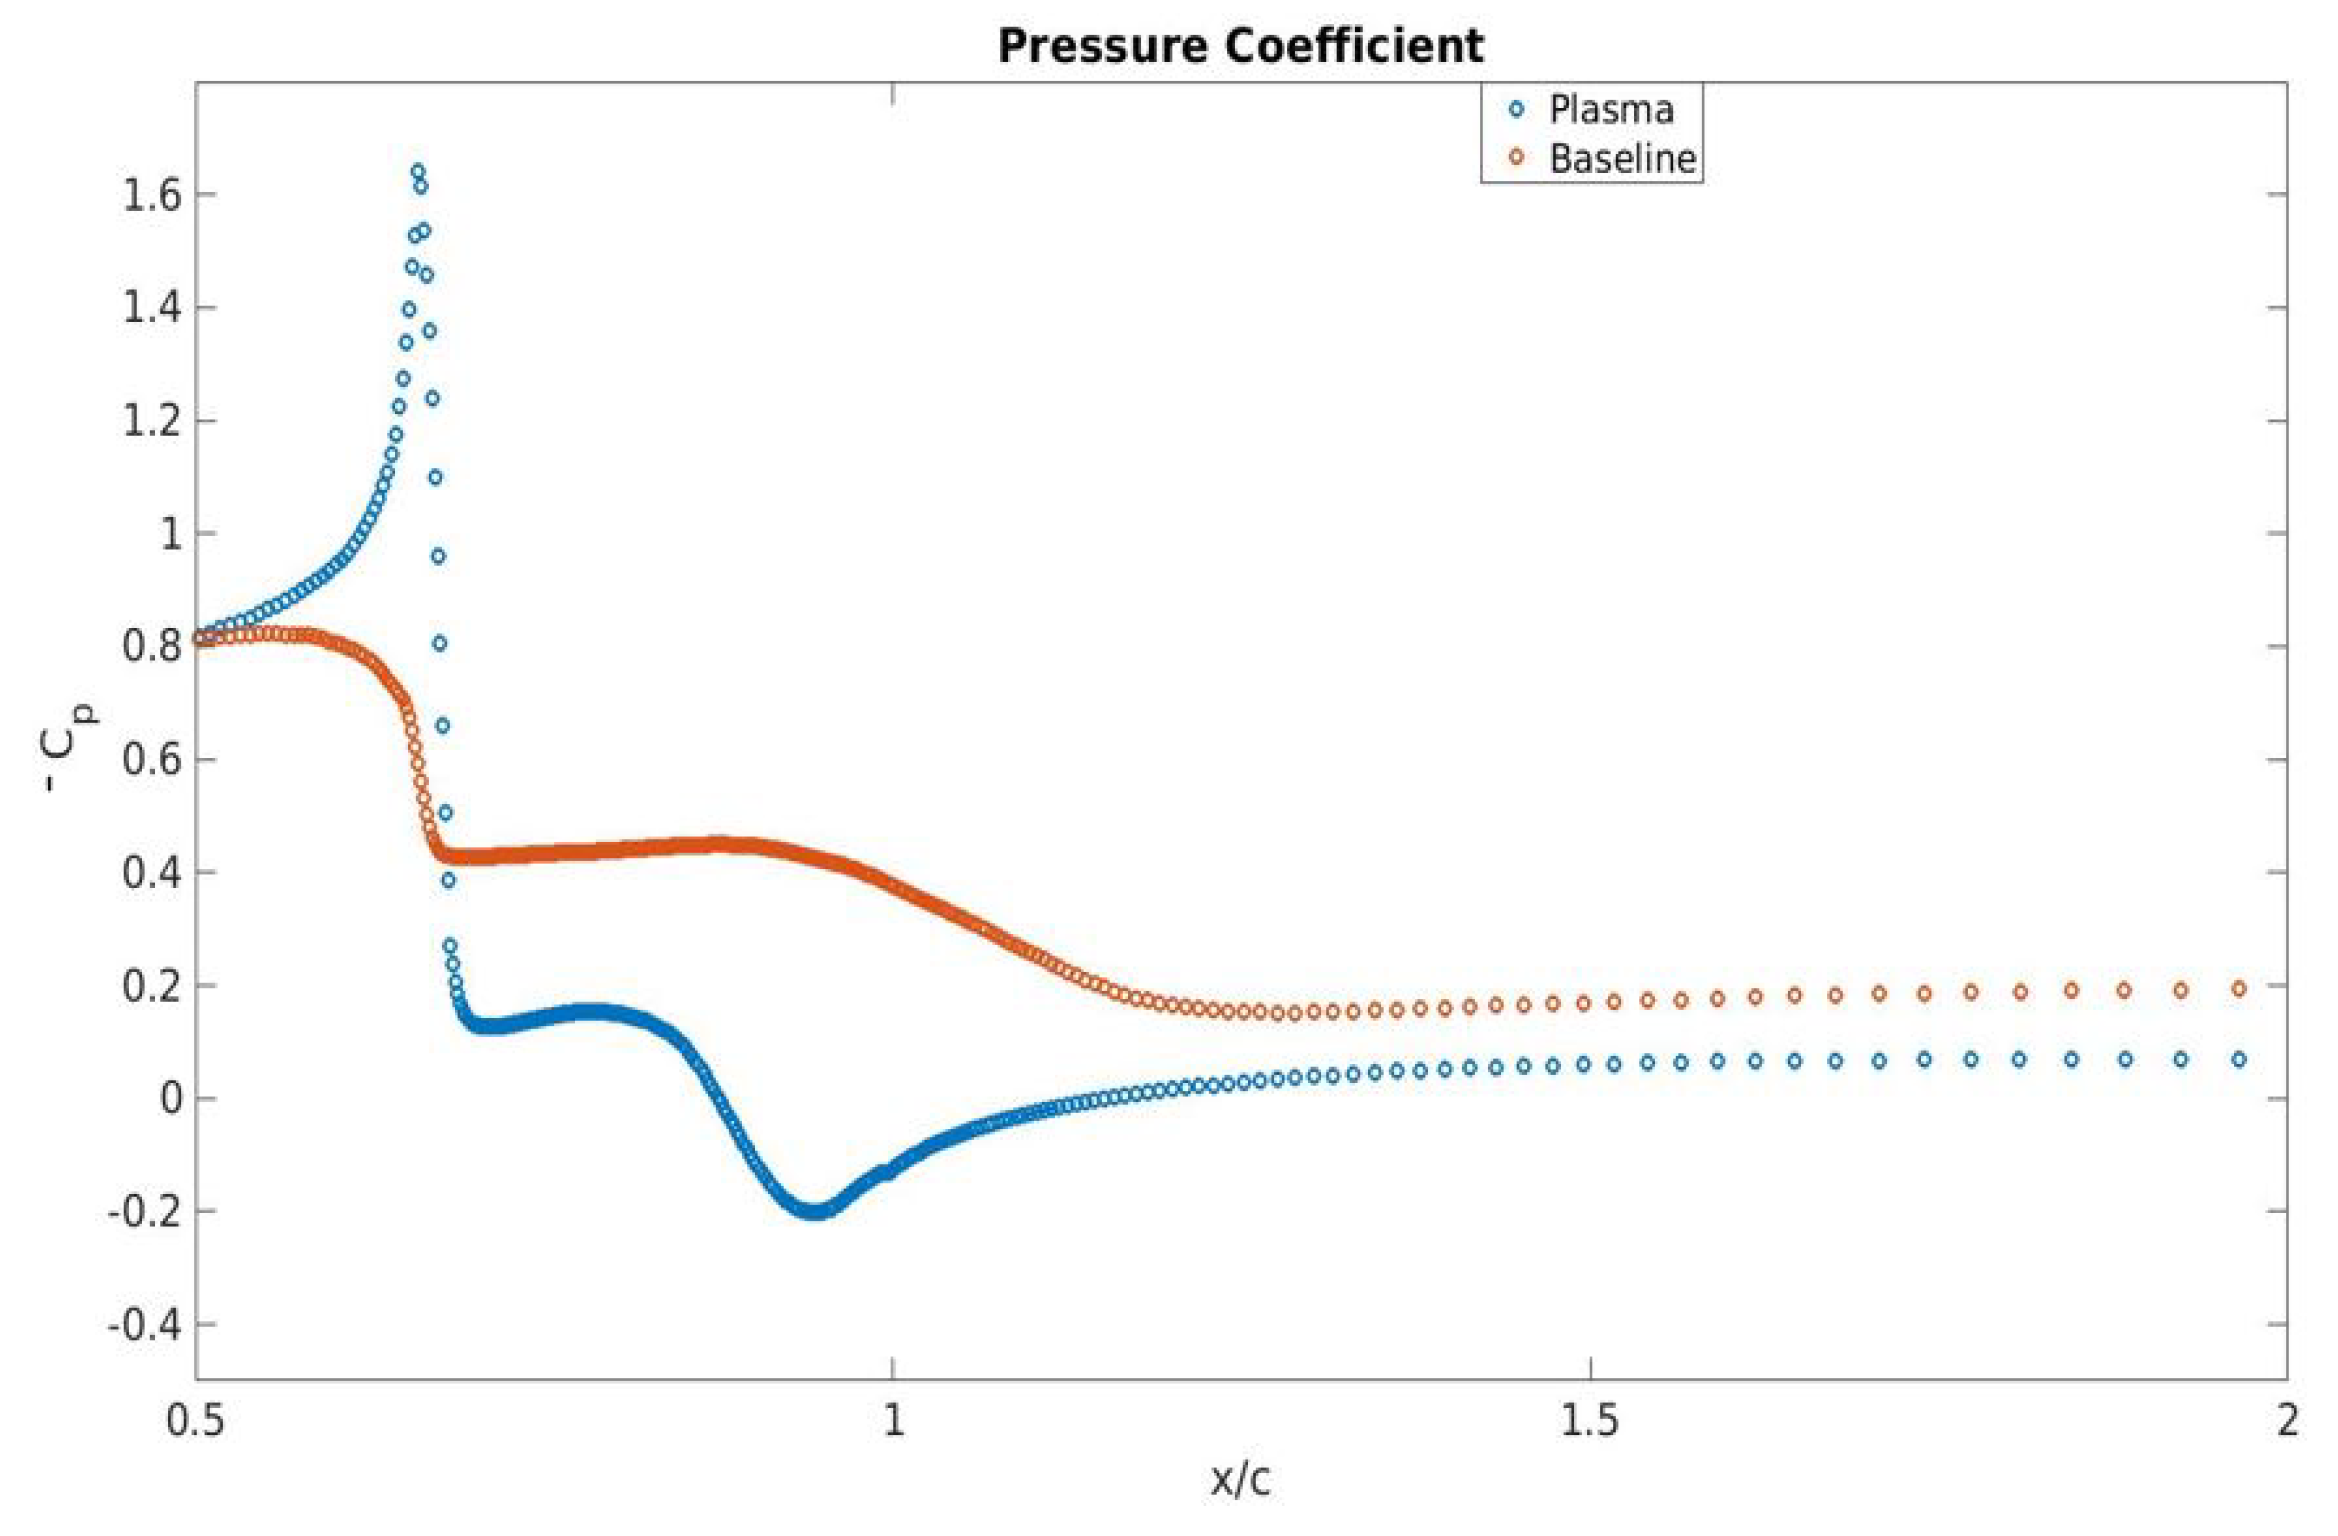
Figure 16 represents the change in pressure coefficient, C p , due to plasma actuator effects, and it compares the plasma result to the baseline result. The pressure dropped by a significant margin at the position where the separation started, i.e., x / c = 0.66 . The sudden decrease in C p indicated that the induced plasma body force increased the overall flow velocity compared to the baseline case. This flow remained separated and then reattached downstream of the trailing edge. The plasma force accelerated the fluid near the plasma affected area, which caused a local pressure drop. A significant increase in C p was observed at the same location, where a decrease in C p was seen for the baseline case. This was due to the pressure increasing suddenly at the separation point and caused the fluid flow near the wall to retard.
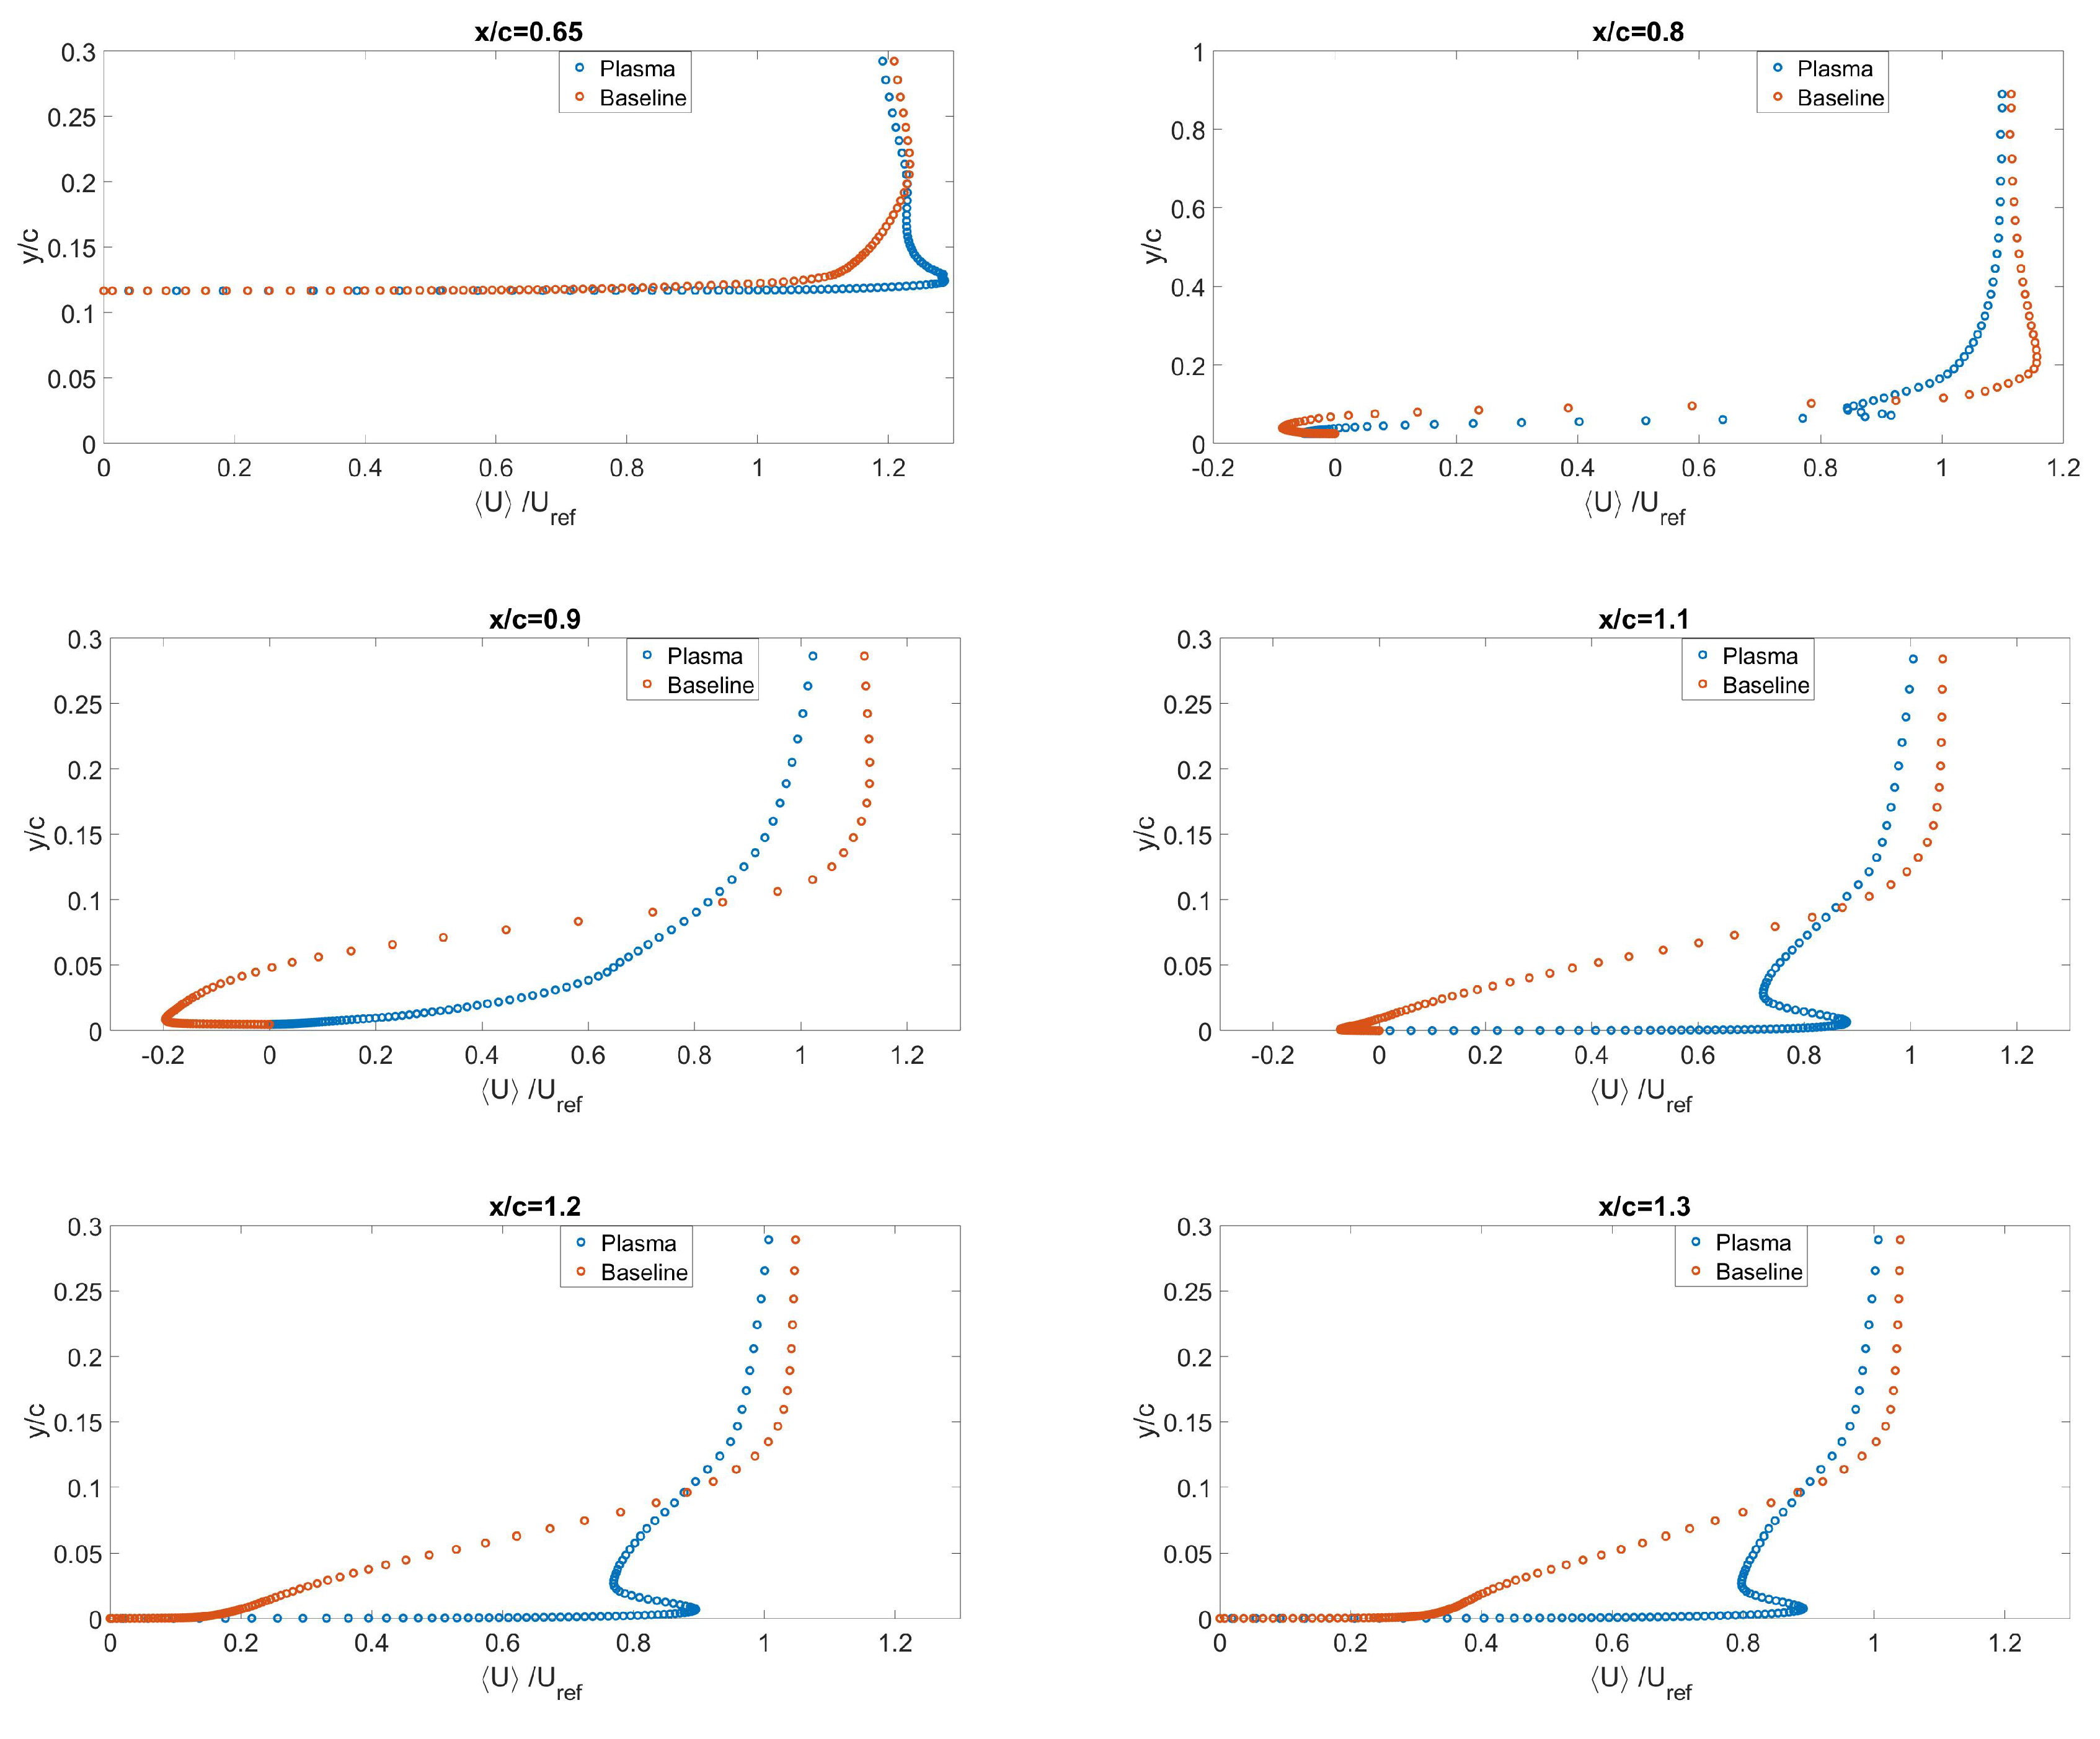
The idea behind the plasma actuator was to add momentum to this retarded flow through a plasma induced body force. This was achieved and displayed in Figure 16, where the pressure decreased rapidly to verify the plasma actuator’s effectiveness. The coefficient of pressure and the coefficient of skin friction plot shown above sufficiently shows the change in flow distribution, the reduction in flow separation, and the existence of added momentum. As the total mass was conserved, the increase in velocity along the y-axis would provide detailed information of the plasma actuator effect on the velocity field. Figure 17 shows the u-velocity profile along the y-axis at selected axial locations to compare to the baseline values.
Figure 17 helps us to understand the effects of the plasma actuator on the flowfield. For the baseline case, at the locations inside the flow separation, i.e., x / c = 0.80 , x / c = 0.90 , and x / c = 1.1 , the flow pattern in the boundary followed in the reverse direction for the separation and recirculation, which is also described in Figure 12. As the plasma actuator was located at the location where the separation began, the actuator assisted the flow to remain attached. Location x / c = 0.80 was still under the separation region, whereas location x / c = 0.90 was free from separation. Figure 17 also holds up the same conclusion with the skin friction coefficient results in Figure 15 regarding the flow reattachment at x / c = 0.90 . The further the location was from the flow reattachment, due to sudden flow acceleration, the velocity increased rapidly at the boundary, but slowed down due to relative low momentum flow at the top. This caused the velocity to rise to reach the freestream condition.
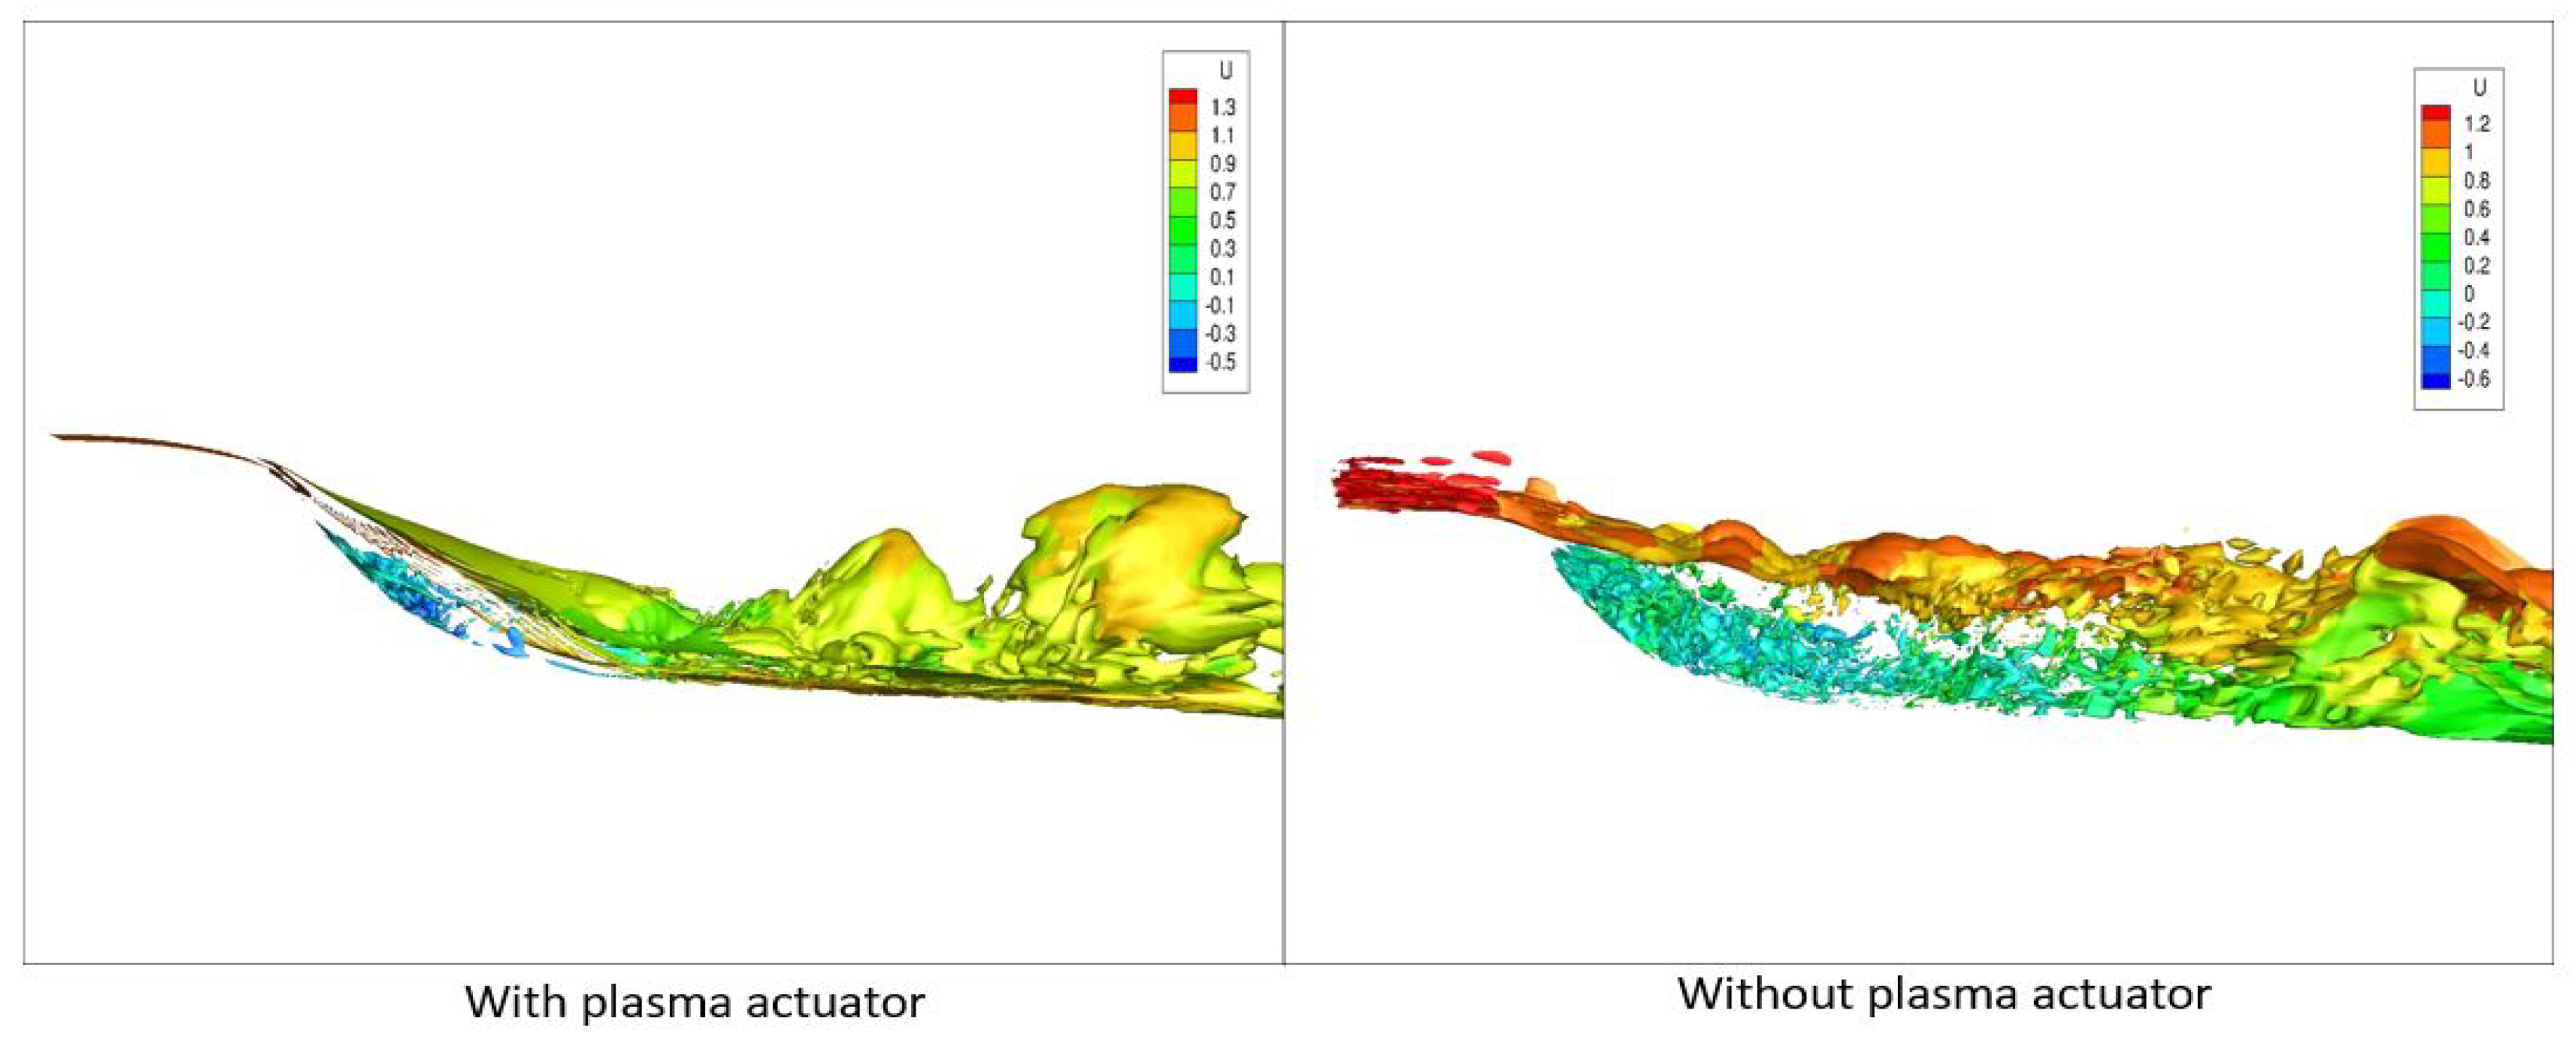
Figure 18 and Figure 19 show the effect of the plasma induced force by comparing the Q-criterion and the vorticity magnitude, respectively. The positive value of the Q-criterion was the proof of the dominance of rotational components over the strain or stretching components. A push in the flow downstream is visible in Figure 18, and it visually demonstrates the effects of the plasma enabled body force. The blue contours in Figure 19 indicate the reversed flow. It is seen that, for the plasma case, flow reversal, and hence the separation, was significantly smaller than the separation in the baseline case.
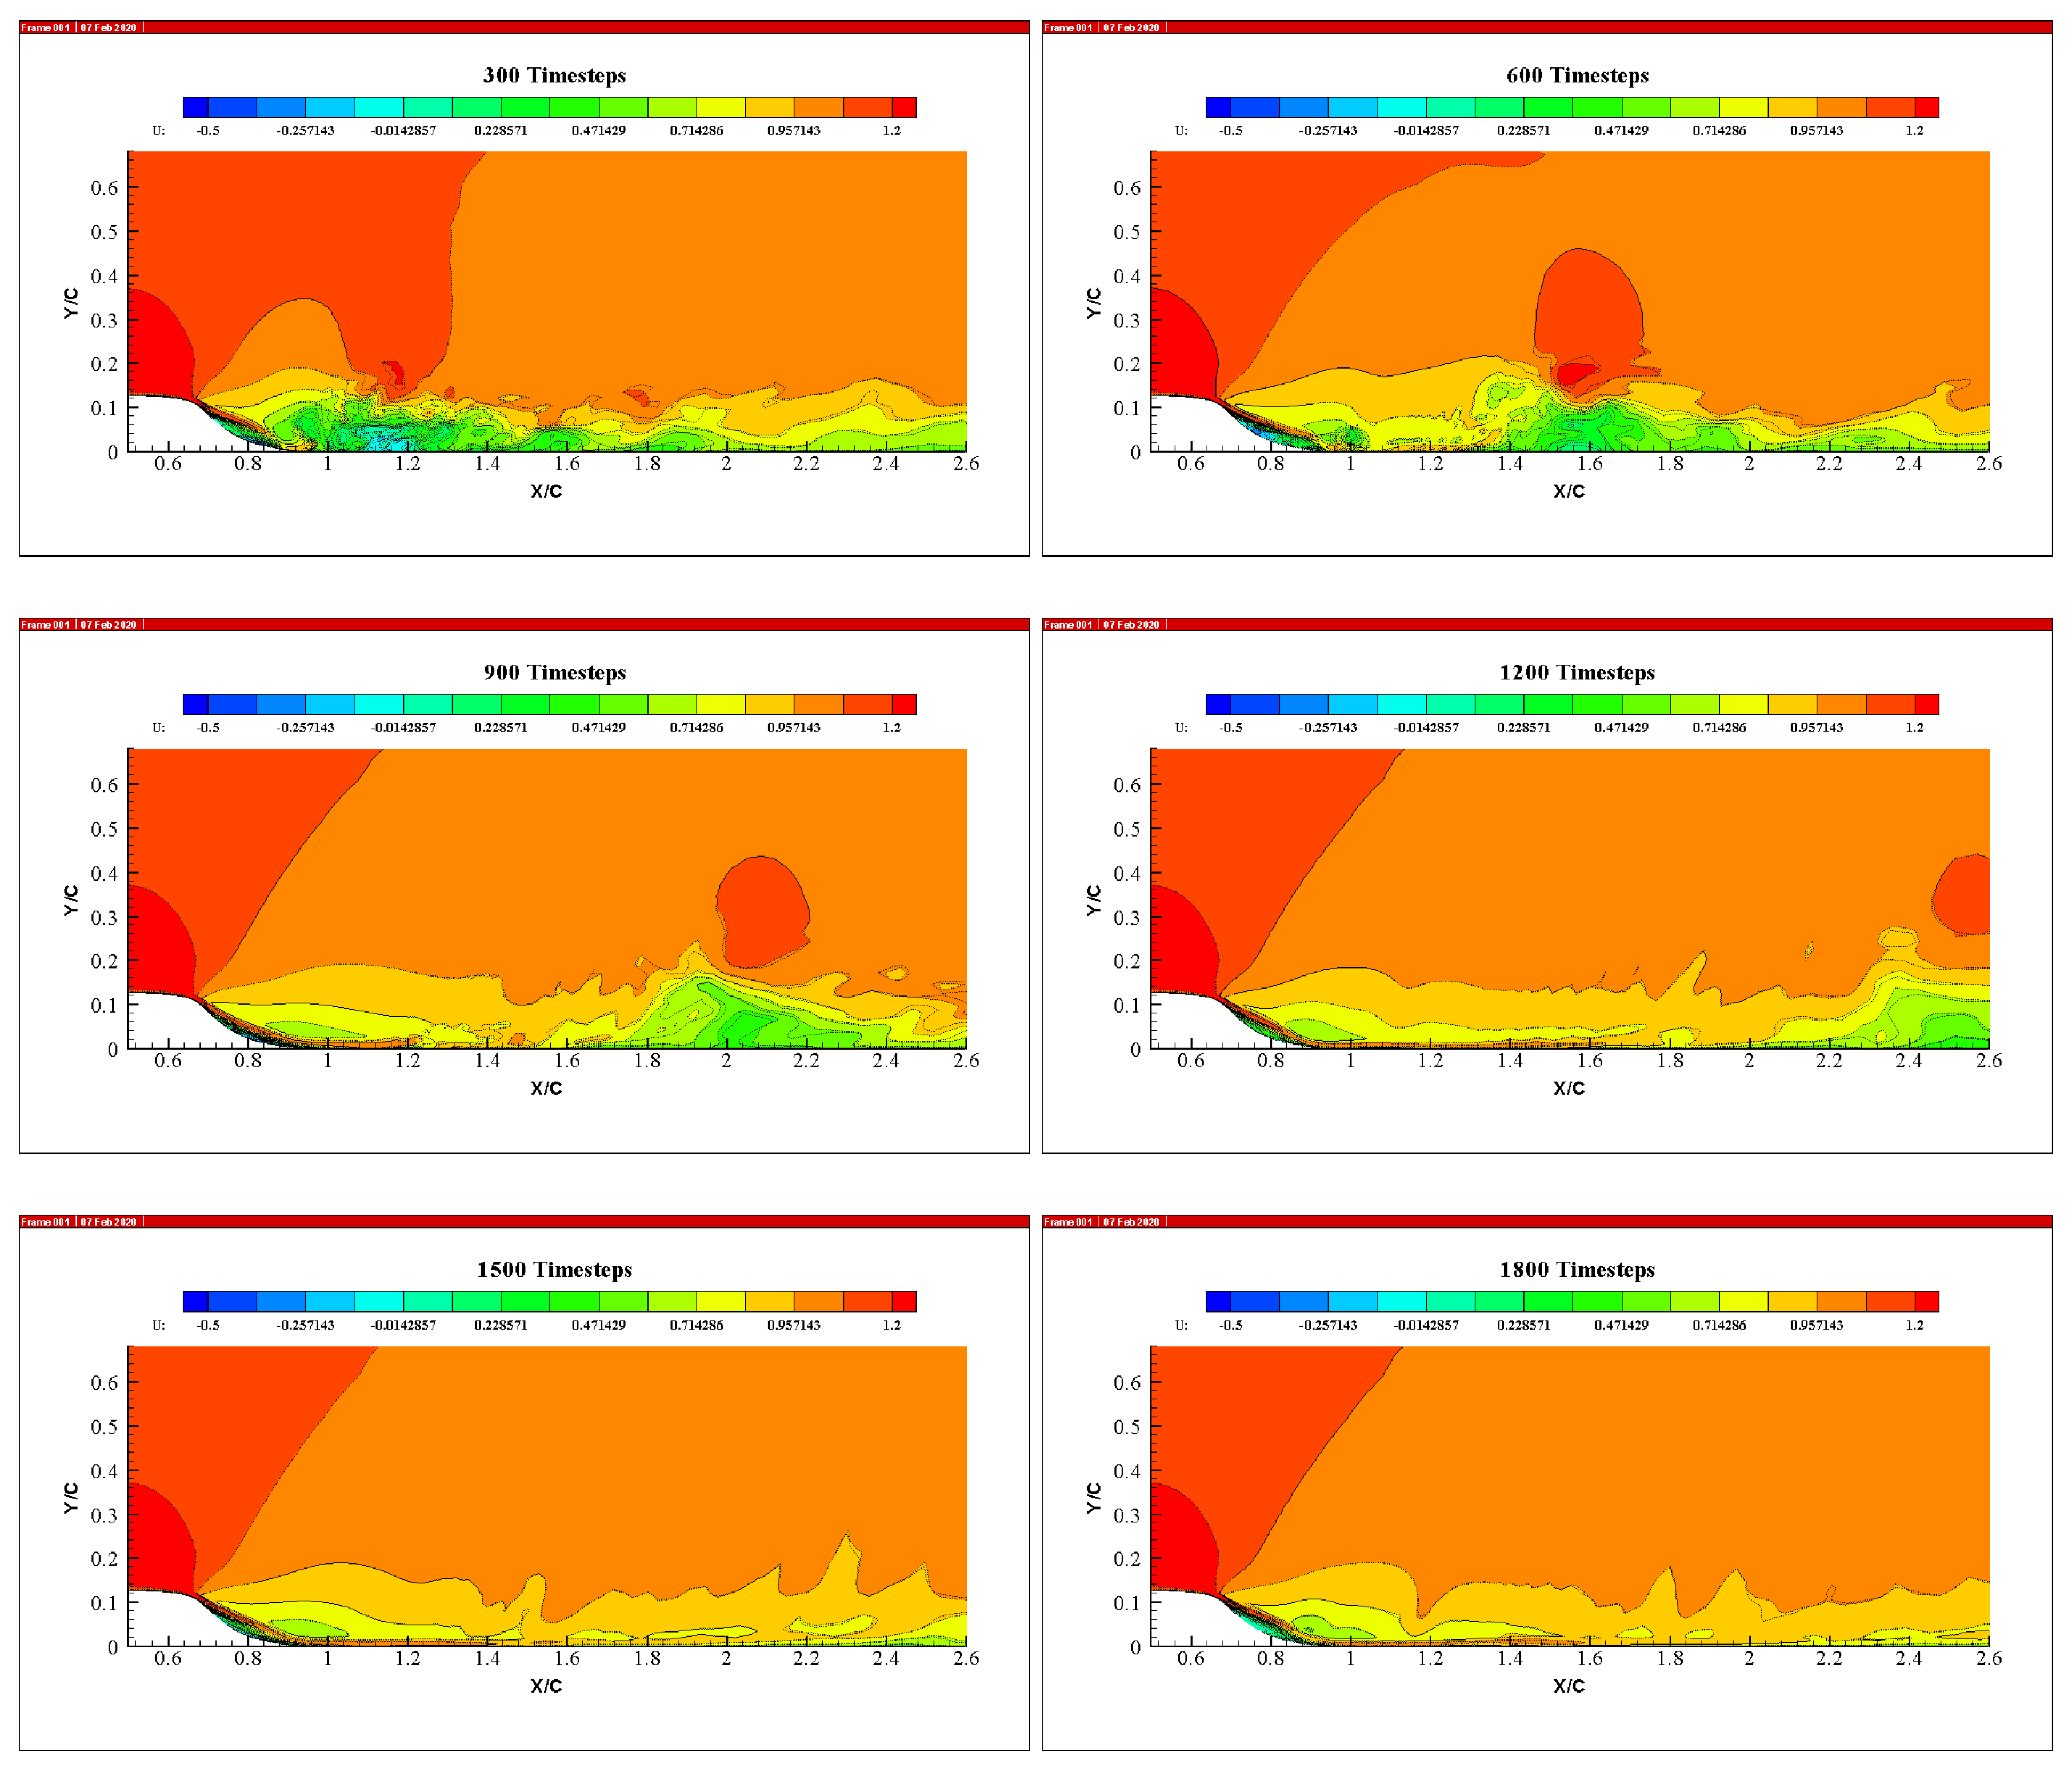
Figure 20 illustrates the plasma force effects on the instantaneous u-velocity over a certain period of time. After 300 time steps or 0.6 non-dimensional times, the initial accelerated momentum increased the velocity and reduced the flow instability near the wall, shown in the top left of Figure 20. The rest of the snapshots in the figure show the effects at later time steps. Flow separation and instabilities at the wall were pushed downstream with increasing time.

3.2.1. Plasma Actuator Location

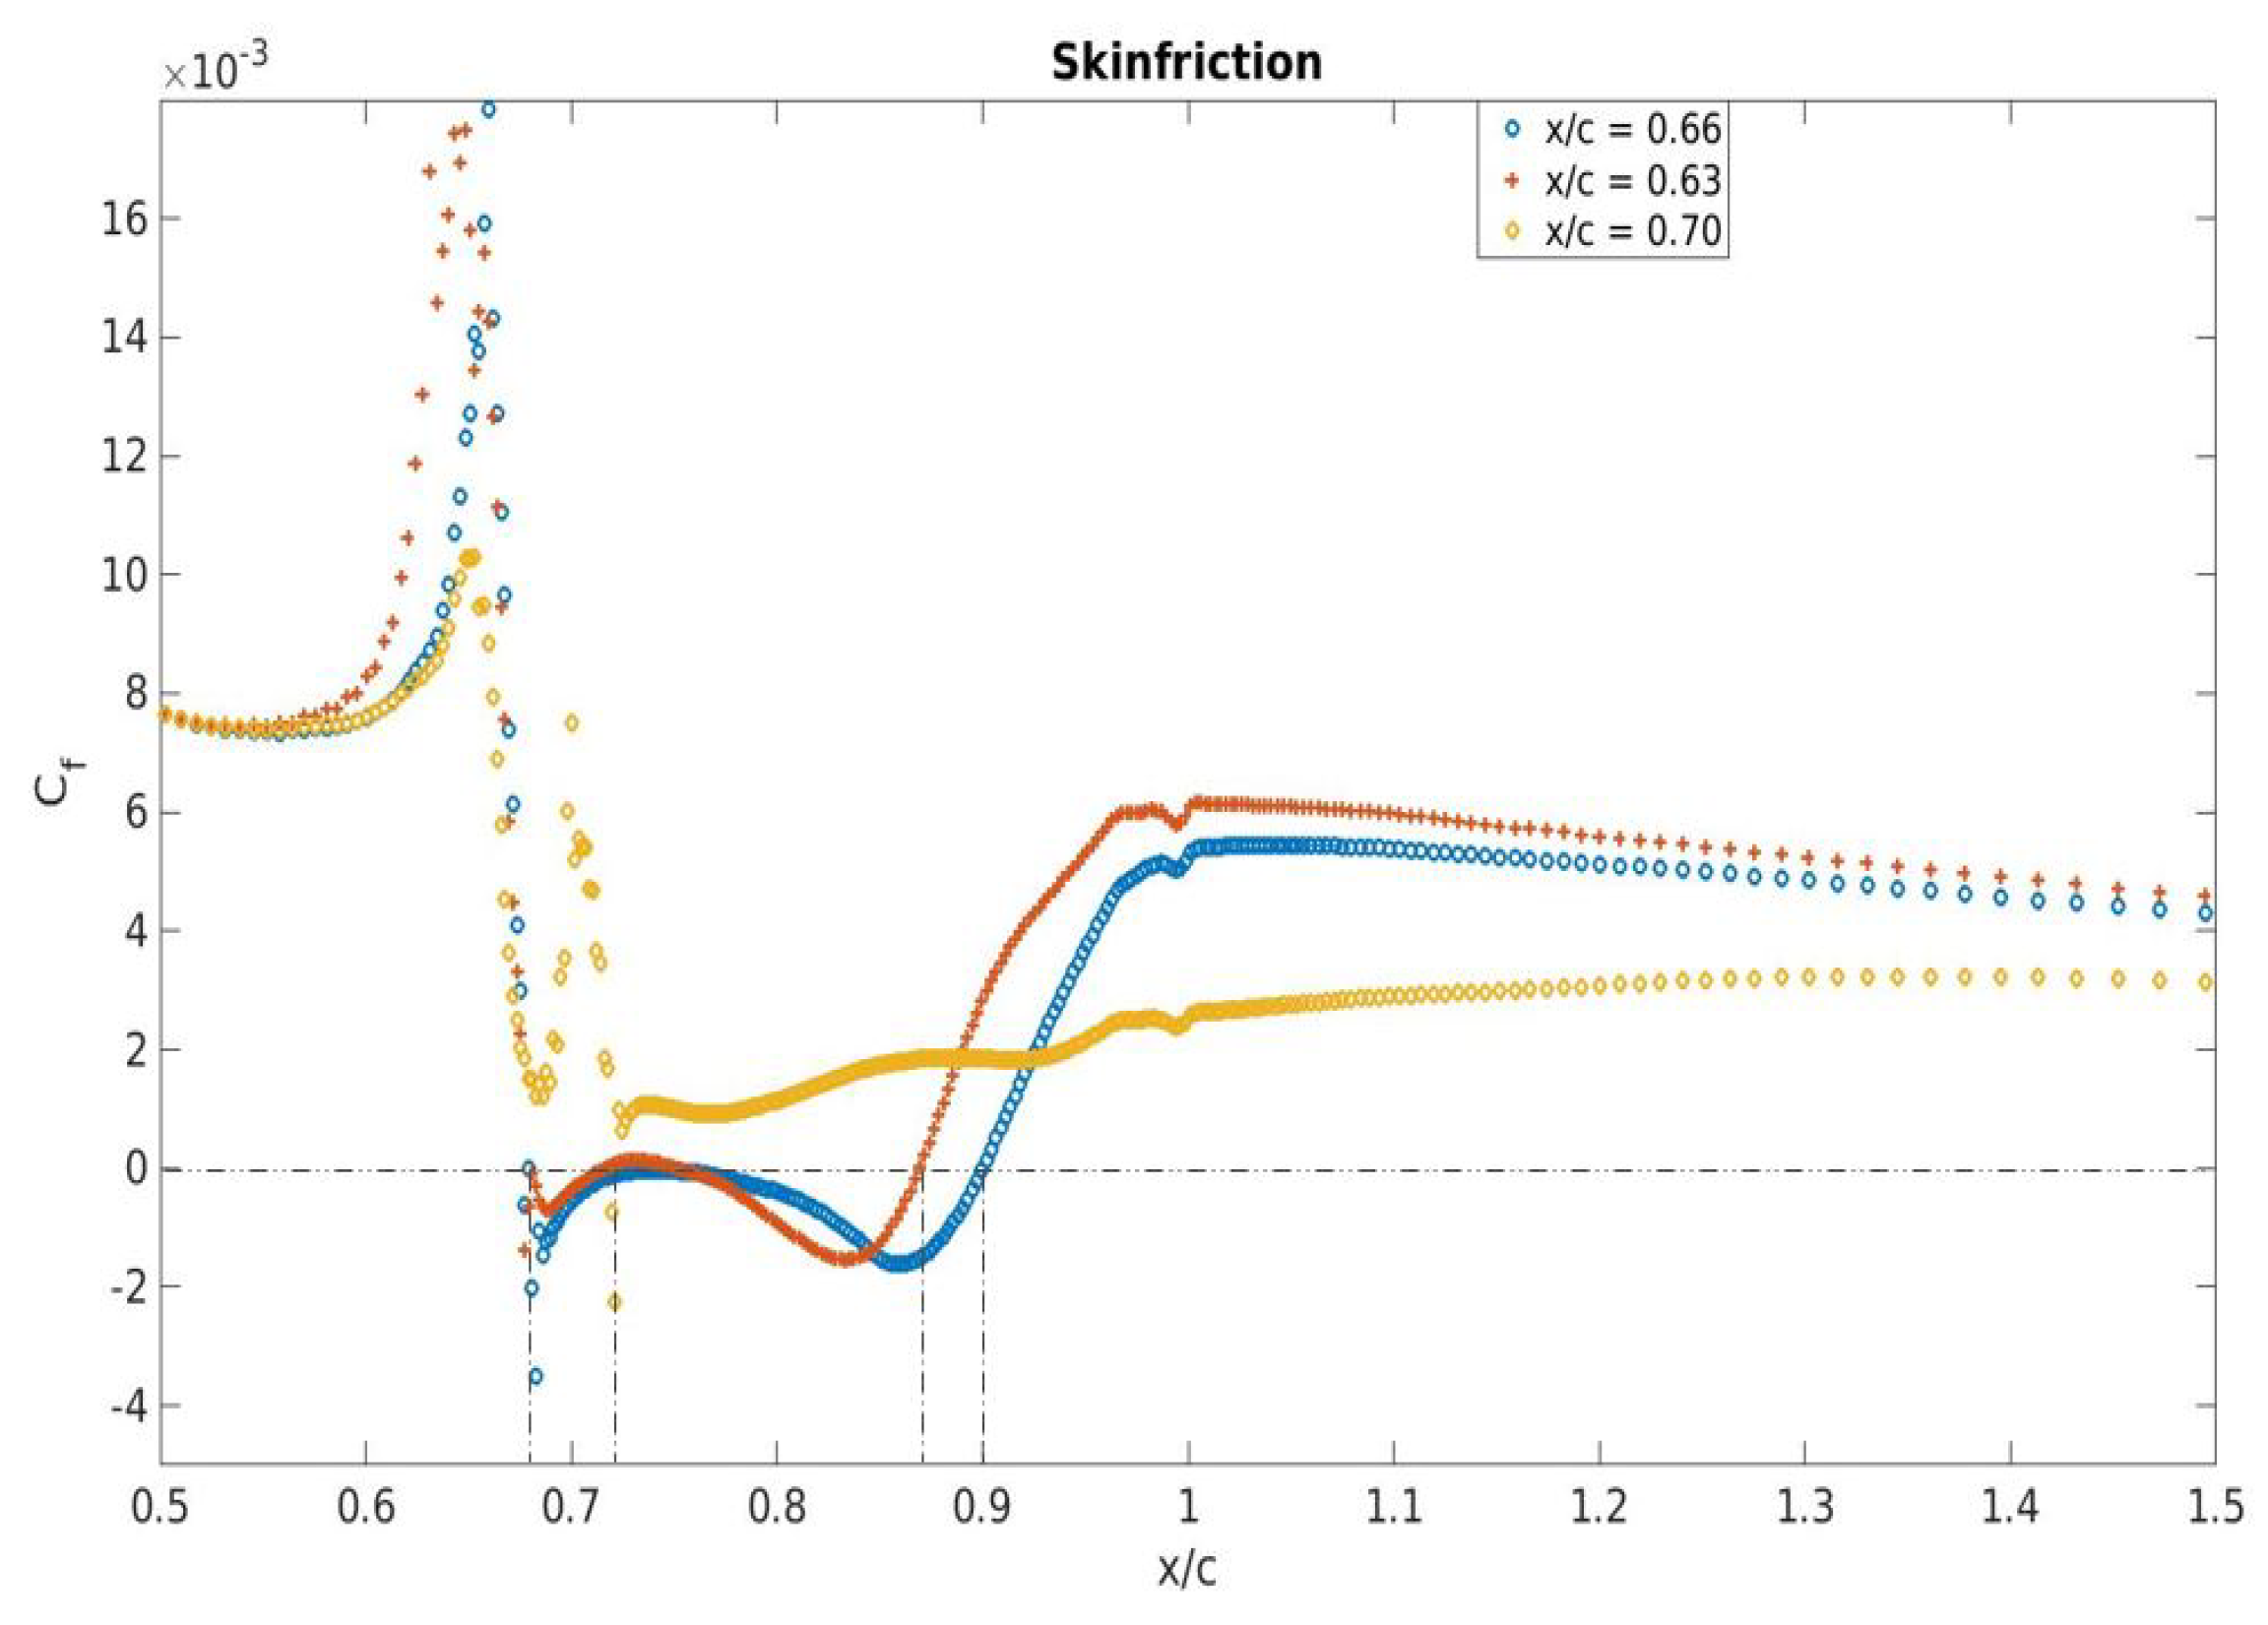
The results based on the plasma actuator showed that the flow separation and the overall flowfield were changed due to plasma based control. Moreover, a reduction in flow separation was observed for the plasma located at x / c = 0.66 . To test the plasma effect without changing its electric field strength or applied voltage frequency, additional analyses were completed by changing the plasma actuator location. The effect of changing the plasma actuator location is described in Figure 21 using the skin friction coefficient. Two specific locations were chosen: (1) upstream of the baseline separation point, i.e., x / c = 0.63 , and (2) downstream of the baseline separation point, i.e., x / c = 0.70 .
In Figure 21, the skin friction coefficient for three different plasma locations is compared. For the skin friction in both cases with the plasma actuator located at x / c = 0.63 and x / c = 0.66 , the line clearly crossed C f = 0 , thus demonstrating flow separation and flow reattachment. However, the line for x / c = 0.7 was different than those two positions, so it showed better flow quality in terms of flow separation. This was because the baseline flow separation was substantial at that location, and the plasma actuator positioned at x / c = 0.66 and x / c = 0.63 failed to eliminate the flow separation completely. However, an improvement in reducing the separated flow was evident when the plasma actuator was located downstream of the baseline flow separation location.

3.2.2. Applied Voltage Frequency

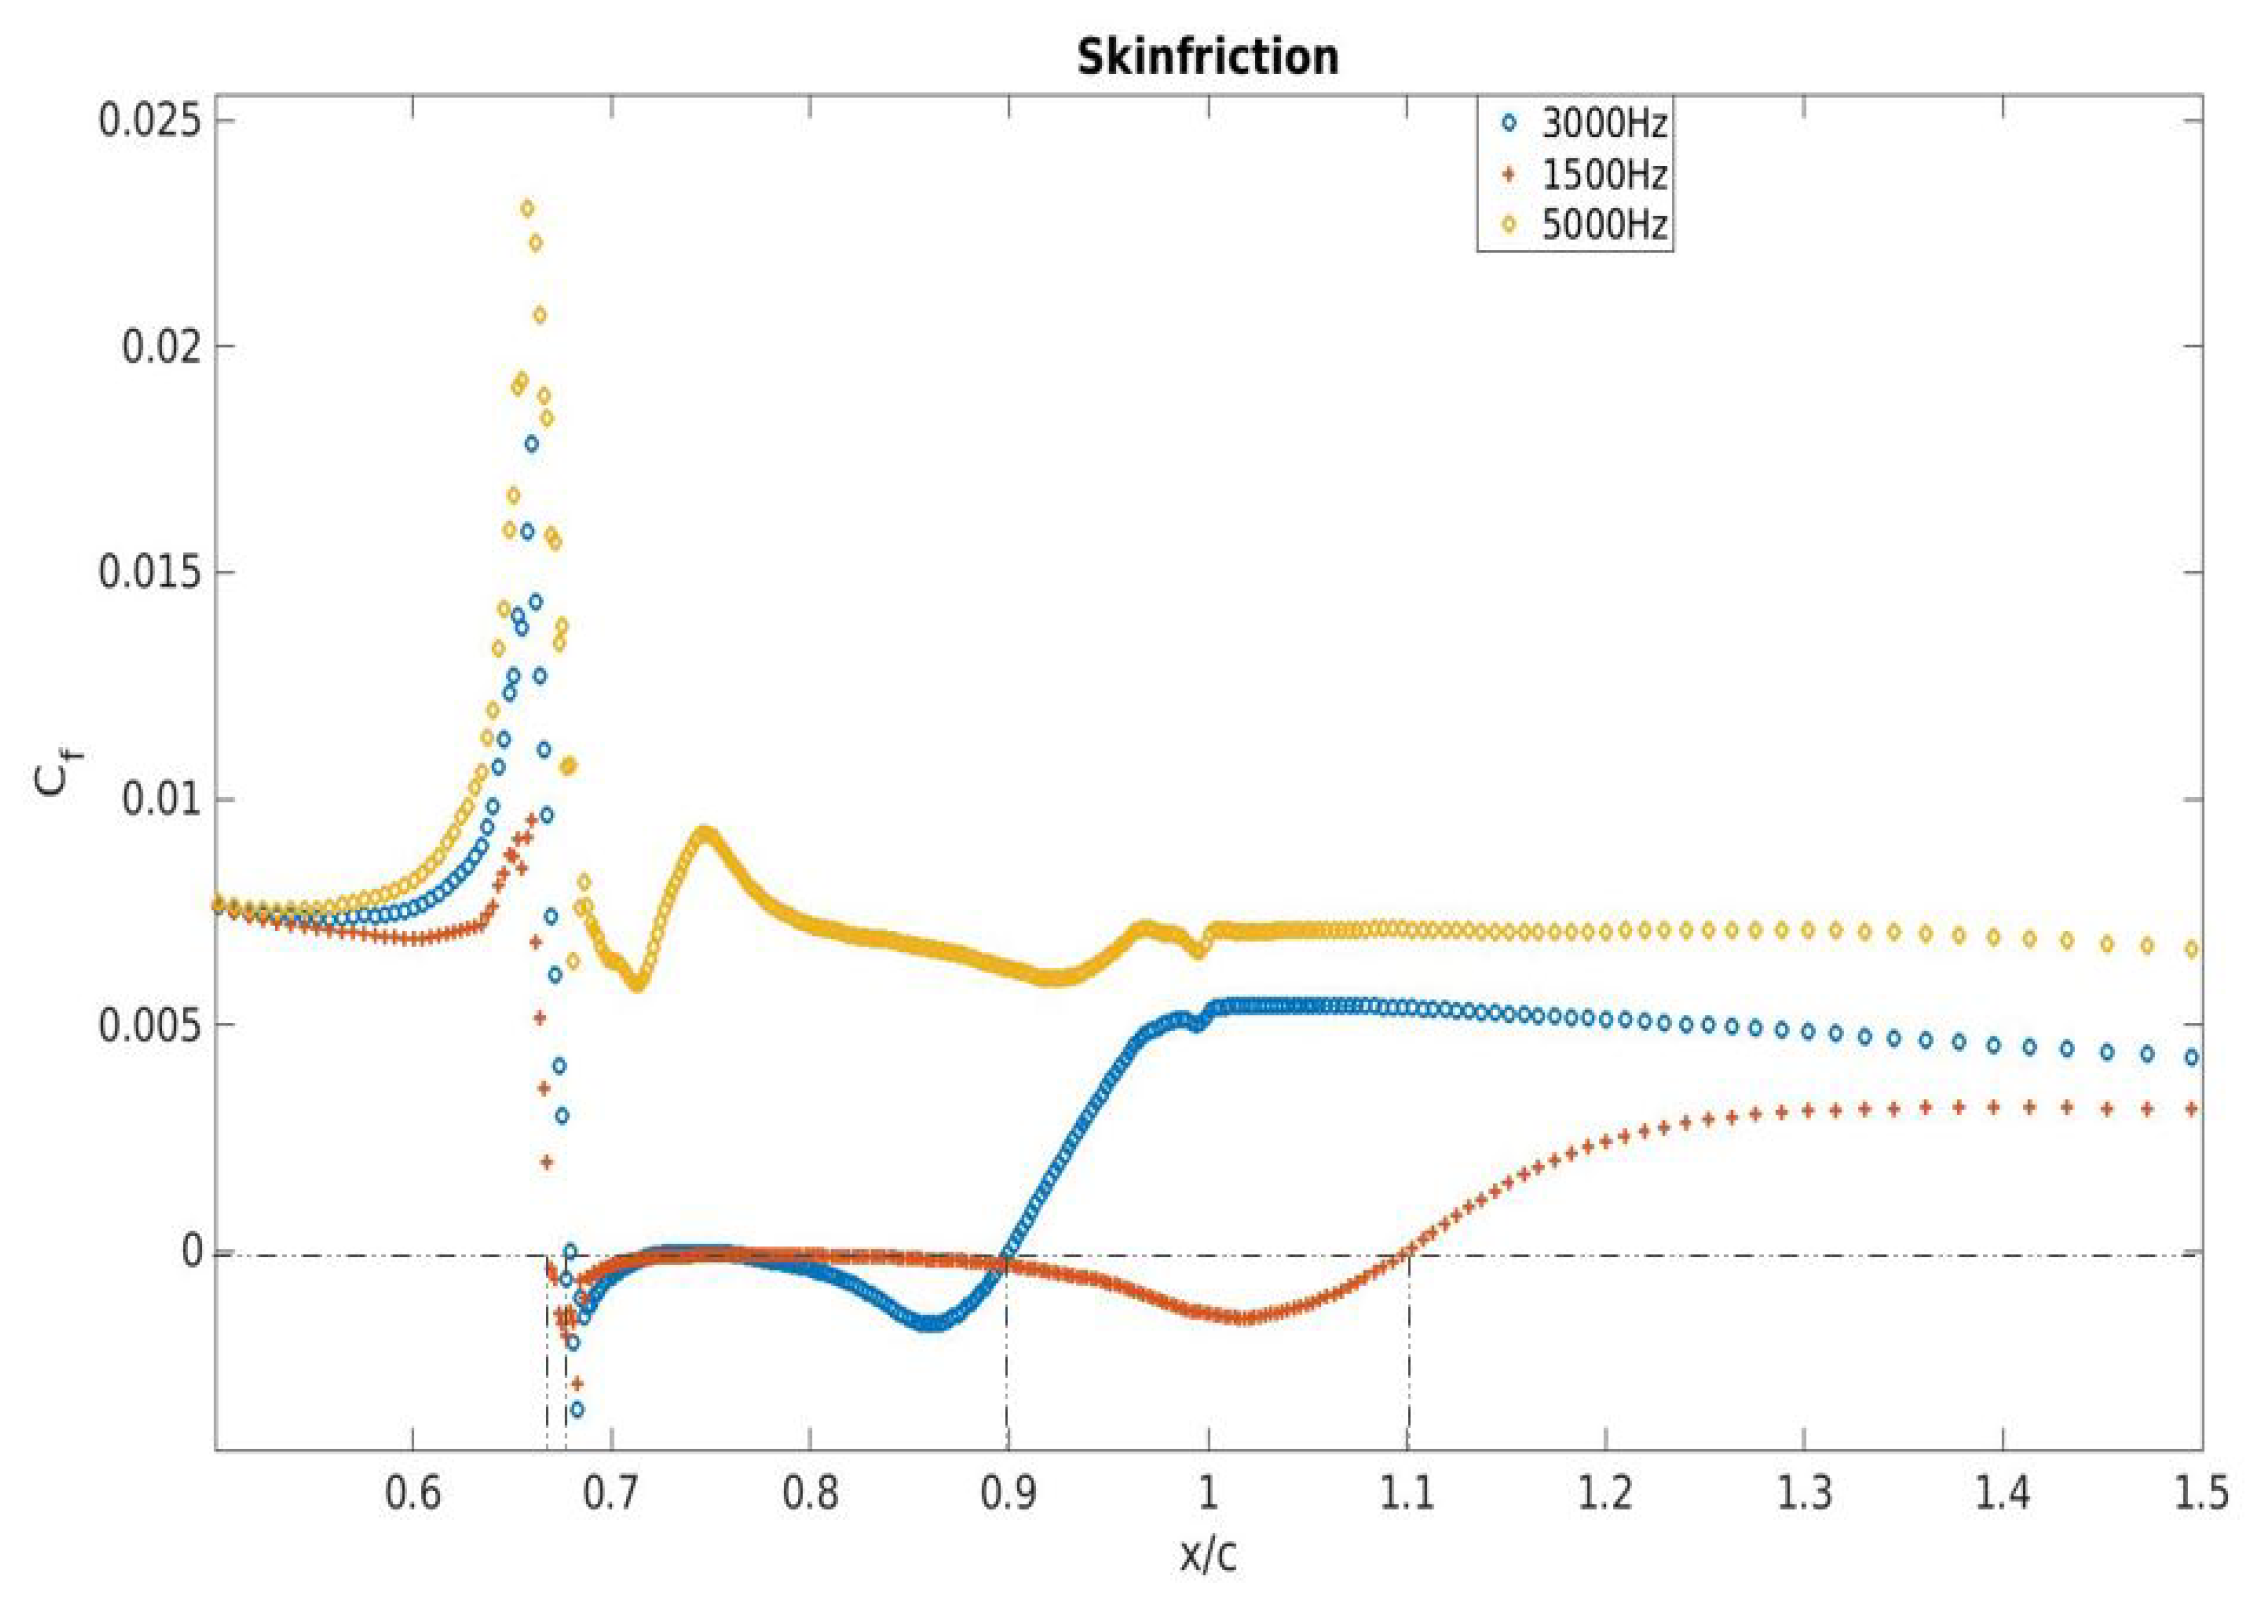
The applied voltage frequency used for the DBD plasma actuator was 3 kHz. As at this frequency, the DBD actuator could vary from 1–10 kHz [2], the analysis was done to understand the significance of the applied voltage frequency in the plasma body force. It should be noted that the plasma body force was proportional to the applied voltage frequency, and hence, an increase in frequency would increase the body force. However, this increased induced body force may not guarantee improvement in flow separation. To observe the effects and flow field conditions, skin friction coefficient analysis was done as displayed in Figure 22. Figure 22 indicates that the high frequency created no separation as the yellow line representing 5000 Hz does not cross the C f = 0 line. From the current analysis based on applied voltage frequency variation, it was concluded that the DBD plasma actuator with 5 kHz was more effective for flow separation control on the hump model and merited the need for future DBD plasma actuator simulations.
As stated earlier, a total of five test cases were run for the plasma actuator simulations, shown in Table 2. The summary of these five cases’ results is shown below in Table 4. Test Cases 3 and 5 gave us improved performances for the DBD plasma actuator.

4. Conclusions

A hybrid RANS-LES (PANS) turbulence model was used to compute the flow over a NASA wall-mounted hump model with and without a DBD plasma actuator. A phenomenological, linearized Shyy model was used over first principles based plasma actuator models for simplicity and accuracy. Comparison of the pressure coefficient, skin friction coefficient, and velocity profiles was made, and good agreement between the numerical and experimental results was found. This was consistent with the results obtained by similar numerical investigations. Hence, it validated the solver’s (CALC-LES) ability to reasonably predict flow separation and reattachment in an incompressible flowfield. This work was the first attempt to model a DBD plasma actuator as the source terms in CALC-LES. Here, the baseline code was modified to simulate “bulk” plasma actuator effects. Flow structure comparisons of the baseline case and plasma cases showed that the plasma reduced the separated flow region. The plasma actuator effectively “pushed” the separated fluid downstream and eventually reduced the overall flow separation. Active aerodynamic flow control techniques are still maturing, and optimization (e.g., power, location, frequency) of plasma based flow control devices is necessary for future aerospace applications. The goal of this research was to provide a framework for the implementation of phenomenological plasma based actuators to mitigate the adverse effects of separated flow.

5. Limitations

The authors did not perform a time independence test for this case study. The time step selected for the simulations was based a Strouhal number of 0.2. The grid used in the work was the mandatory grid from the ATAAC project for the hump model.

Author Contributions

Conceptualization, M.H. and M.A.; methodology, M.H.; software, M.H.; validation, M.H.; formal analysis, M.H.; investigation, M.H. and M.A.; resources, M.H.; writing, original draft preparation, M.H.; writing, review and editing, M.A. and M.H.; visualization, M.H.; supervision, M.A. All authors read and agreed to the published version of the manuscript.

Funding

This research received no external funding.

Acknowledgments

We would like to convey our special thanks to Lars Davidson of the Chalmers University of Technology for allowing us to use his solver CALC-LES, which is capable of turbulence LES and RANS-LES hybrid modeling.

Conflicts of Interest

The authors declare no conflict of interest.

Nomenclature

C l Coefficient of lift
C f Coefficient of skin friction
C p Coefficient of pressure
R e Reynolds number
S r Strouhal number
P r Prandtl number
MMach number
EElectric field strength (kV/Cm)
E 0 Maximum electric field strength (kV/Cm)
E 0 Breakdown electric field strength (kV/Cm)
dHorizontal electrode gap (mm)
α Collision factor
ϑ Operating voltage frequency (kHz)
ρ c Charge density (1/cm3)
e c Electron charge (C)
δ Kronecker delta function
Δ t Discharge time (µs)
e c Electron charge (C)
D c Non-dimensional plasma force parameter
h / c Hump height
H / c Channel height
a / c Plasma actuator height
b / c Plasma actuator length
kTurbulent kinetic energy
ω Turbulent dissipation rate
DBDDielectric barrier discharge
NSENavier–Stokes equations
CFDComputational fluid dynamics
RANSReynolds-averaged Navier–Stokes equations
LESLarge eddy simulation
PANSPartially-averaged Navier Stokes
EHDElectro-hydro dynamics
MACMarker and cell
ATAACAdvance Turbulence for Aerodynamic Application Challenges
SSTShear stress transport

References

  1. Gad-el Hak, M. Flow Control: Passive, Active, and Reactive Flow Management; Cambridge University Press: Cambridge, MA, USA, 2007. [Google Scholar]
  2. Neretti, G. Active flow control by using plasma actuators. In Recent Progress in Some Aircraft Technologies; IntechOpen: London, UK, 2016; pp. 57–76. [Google Scholar]
  3. Menter, F.R. Performance of popular turbulence model for attached and separated adverse pressure gradient flows. AIAA J. 1992, 30, 2066–2072. [Google Scholar] [CrossRef]
  4. Shen, X.; Avital, E.; Paul, G.; Rezaienia, M.A.; Wen, P.; Korakianitis, T. Experimental study of surface curvature effects on aerodynamic performance of a low Reynolds number airfoil for use in small wind turbines. J. Renew. Sustain. Energy 2016, 8, 053303. [Google Scholar] [CrossRef]
  5. Roberts, W. Calculation of laminar separation bubbles and their effect on airfoil performance. AIAA J. 1980, 18, 25–31. [Google Scholar] [CrossRef]
  6. Atkinson, M.D.; Poggie, J.; Camberos, J.A. Control of separated flow in a reflected shock interaction using a magnetically-accelerated surface discharge. Phys. Fluids 2012, 24, 126102. [Google Scholar] [CrossRef]
  7. Chen, F.F. Introduction to Plasma Physics and Controlled Fusion; Springer: Berlin/Heidelberg, Germany, 1984; Volume 1. [Google Scholar]
  8. Opaits, D.; Dmitry, F. Dielectric Barrier Discharge Plasma Actuator for Flow Control; NASA/CR-2012-217655, NASA Technical Reports; NASA: Washington, DC, USA, September 2012.
  9. Siemens, W. About the electrostatic induction and the delays in the flow in the bottle. Ann. Phys. 1857, 178, 66–122. [Google Scholar] [CrossRef]
  10. Bouchmal, A. Modeling of Dielectric-Barrier Discharge Actuator. Master’s Thesis, Delft University of Technology, Delft, The Netherlands, 2011. [Google Scholar]
  11. Jayaraman, B. Computational Modeling of Glow Discharge-Induced Fluid Dynamics; University of Florida: Gainesville, FL, USA, 2006. [Google Scholar]
  12. Hasan, M. Control Of Separated Flow Using a Dielectric Barrier Discharge Plasma Actuator. Master’s Thesis, ProQuest, Ann Arbor, MI, USA, 2019. [Google Scholar]
  13. Riley, M.; Greenberg, K.; Hebner, G.; Drallos, P. Theoretical and experimental study of low-temperature, capacitively coupled, radio-frequency helium plasmas. J. Appl. Phys. 1994, 75, 2789–2798. [Google Scholar] [CrossRef]
  14. Font, G.I. Boundary layer control with atmospheric plasma discharges. AIAA J. 2006, 44, 1572–1578. [Google Scholar] [CrossRef]
  15. Golubovskii, Y.B.; Maiorov, V.; Behnke, J.; Behnke, J. Modelling of the homogeneous barrier discharge in helium at atmospheric pressure. J. Phys. D Appl. Phys. 2002, 36, 39. [Google Scholar] [CrossRef]
  16. Massines, F.; Rabehi, A.; Decomps, P.; Gadri, R.B.; Ségur, P.; Mayoux, C. Experimental and theoretical study of a glow discharge at atmospheric pressure controlled by dielectric barrier. J. Appl. Phys. 1998, 83, 2950–2957. [Google Scholar] [CrossRef]
  17. Fiala, A.; Pitchford, L.; Boeuf, J. Two-dimensional, hybrid model of low-pressure glow discharges. Phys. Rev. E 1994, 49, 5607. [Google Scholar] [CrossRef]
  18. Shyy, W.; Jayaraman, B.; Andersson, A. Modeling of glow discharge-induced fluid dynamics. J. Appl. Phys. 2002, 92, 6434–6443. [Google Scholar] [CrossRef]
  19. Suzen, Y.; Huang, G. Simulations of flow separation control using plasma actuators. In Proceedings of the 44th AIAA Aerospace Sciences Meeting and Exhibit, Reno, Nevada, 9–12 January 2006; p. 877. [Google Scholar]
  20. Suzen, Y.; Huang, G.; Jacob, J.; Ashpis, D. Numerical simulations of plasma based flow control applications. In Proceedings of the 35th AIAA Fluid Dynamics Conference and Exhibit, Toronto, ON, Canada, 6–9 June 2005; p. 4633. [Google Scholar]
  21. Roth, J.; Sherman, D.; Wilkinson, S. Boundary layer flow control with a one atmosphere uniform glow discharge surface plasma. In Proceedings of the 36th AIAA Aerospace Sciences Meeting and Exhibit, Reno, NV, USA, 12–15 January 1998; p. 328. [Google Scholar]
  22. Enloe, C.; McLaughlin, T.E.; Van Dyken, R.D.; Kachner, K.; Jumper, E.J.; Corke, T.C. Mechanisms and responses of a single dielectric barrier plasma actuator: Plasma morphology. AIAA J. 2004, 42, 589–594. [Google Scholar] [CrossRef]
  23. Orlov, D.; Corke, T.; Patel, M. Electric circuit model for aerodynamic plasma actuator. In Proceedings of the 44th AIAA Aerospace Sciences Meeting and Exhibit, Reno, NV, USA, 9–12 January 2006; p. 1206. [Google Scholar]
  24. Khoshkhoo, R.; Jahangirian, A. Flow separation control over airfoils using DBD plasma body force. J. Braz. Soc. Mech. Sci. Eng. 2016, 38, 2345–2357. [Google Scholar] [CrossRef]
  25. Gaitonde, D.; Visbal, M.; Roy, S. Control of flow past a wing section with plasma based body forces. In Proceedings of the 36th AIAA Plasmadynamics and Lasers Conference, Toronto, ON, Canada, 6–9 June 2005; p. 5302. [Google Scholar]
  26. Yu, J.; Liu, H.; Wang, R.; Chen, F. Numerical study of the flow structures in flat plate and the wall-mounted hump induced by the unsteady DBD plasma. Plasma Sci. Technol. 2016, 19, 015502. [Google Scholar] [CrossRef]
  27. Mushyam, A.; Rodrigues, F.; Pascoa, J. A plasma-fluid model for EHD flow in DBD actuators and experimental validation. Int. J. Numer. Methods Fluids 2019, 90, 115–139. [Google Scholar] [CrossRef]
  28. Gang, L.; Chaoqun, N.; Yiming, L.; Junqiang, Z.; Yanji, X. Experimental investigation of flow separation control using dielectric barrier discharge plasma actuators. Plasma Sci. Technol. 2008, 10, 605. [Google Scholar] [CrossRef]
  29. Rodrigues, F.; Mushyam, A.; Pascoa, J.; Trancossi, M. A new plasma actuator configuration for improved efficiency: The stair-shaped dielectric barrier discharge actuator. J. Phys. D Appl. Phys. 2019, 52, 385201. [Google Scholar] [CrossRef]
  30. Corke, T.; Jumper, E.; Post, M.; Orlov, D.; McLaughlin, T. Application of weakly-ionized plasmas as wing flow-control devices. In Proceedings of the 40th AIAA Aerospace Sciences Meeting & Exhibit, Reno, NV, USA, 14–17 January 2002; p. 350. [Google Scholar]
  31. Rizzetta, D.P.; Visbal, M.R. Large-eddy simulation of plasma based turbulent boundary-layer separation control. AIAA J. 2010, 48, 2793–2810. [Google Scholar] [CrossRef]
  32. Hasan, M.; Atkinson, M. Control of Flow Separation on a Hump Model Using a Dielectric Barrier Discharge Plasma Actuator. Early Career Tech. J. UAB Sch. Eng. Mech. Eng. 2019, 18. [Google Scholar]
  33. Ma, L.; Wang, X.; Zhu, J.; Kang, S. Effect of DBD plasma excitation characteristics on turbulent separation over a hump model. Plasma Sci. Technol. 2018, 20, 105503. [Google Scholar] [CrossRef] [Green Version]
  34. He, C.; Corke, T.; Patel, M. Numerical and experimental analysis of plasma flow control over a hump model. In Proceedings of the 45th AIAA Aerospace Sciences Meeting and Exhibit, Reno, NV, USA, 8–11 January 2007; p. 935. [Google Scholar]
  35. Jayaraman, B.; Shyy, W. Modeling of dielectric barrier discharge-induced fluid dynamics and heat transfer. Prog. Aerosp. Sci. 2008, 44, 139–191. [Google Scholar] [CrossRef]
  36. Jayaraman, B.; Shyy, W. Flow control and thermal management using dielectric glow discharge concepts. In Proceedings of the 33rd AIAA Fluid Dynamics Conference and Exhibit, Orlando, FL, USA, 23–26 June 2003; p. 3712. [Google Scholar]
  37. Jahangirian, A.; Khoshkhoo, R. Numerical Simulation of Flow Separation Control over a Hump Using DBD Plasma Actuator. In Proceedings of the International Council of the Aeronautical Sciences, Daejeon, Korea, 25–30 September 2016. [Google Scholar]
  38. Davidson, L. CALC-LES: A Fortran Code for LES and Hybrid LES-RANS; Technical Report; Division of Fluid Dynamics, Department of Mechanics and Maritime Sciences: Goteborg, Sweden, 2018. [Google Scholar]
  39. Arvidson, S. Methodologies for RANS-LES Interfaces in Turbulence-Resolving Simulations; Department of Mechanics and Maritime Sciences, Division of Fluid Dynamics: Goteborg, Sweden, 2017. [Google Scholar]
  40. Davidson, L.; Peng, S.H. Hybrid LES-RANS modelling: A one-equation SGS model combined with ak–ω model for predicting recirculating flows. Int. J. Numer. Methods Fluids 2003, 43, 1003–1018. [Google Scholar] [CrossRef]
  41. Davidson, L. Two-equation hybrid RANS-LES models: A novel way to treat k and ω at the inlet. In Turbulence, Heat and Mass Transfer, THMT-15; Begell House, Inc.: Sarajevo, Bosnia and Herzegovina, 2015; pp. 15–18. [Google Scholar]
  42. Davidson, L.; Peng, S.H. Embedded large-eddy simulation using the partially averaged Navier–Stokes Model. AIAA J. 2013, 51, 1066–1079. [Google Scholar] [CrossRef] [Green Version]
  43. Davidson, L.; Peng, S.H. Embedded LES Using PANS. In Proceedings of the 6th AIAA Theoretical Fluid Mechanics Conference, Honolulu, HI, USA, 27–30 June 2011; p. 3108. [Google Scholar]
  44. Uzun, A.; Malik, M.R. Wall-resolved large-eddy simulation of flow separation over NASA wall-mounted hump. In Proceedings of the 55th AIAA Aerospace Sciences Meeting, Grapevine, TX, USA, 9–13 January 2017; p. 0538. [Google Scholar]
  45. Morgan, P.E.; Rizzetta, D.P.; Visbal, M.R. High-order numerical simulation of turbulent flow over a wall-mounted hump. AIAA J. 2006, 44, 239–251. [Google Scholar] [CrossRef]
  46. Balakumar, P. Computations of flow over a hump model using higher order method with turbulence modeling. In Proceedings of the 43rd AIAA Aerospace Sciences Meeting and Exhibit, Reno, NV, USA, 10–13 January 2005; p. 1270. [Google Scholar]
  47. Jakirlic, S. Test case ST02: 2D Wall mounted Hump. In Proceedings of the ATAAC, Manchester, UK, 1 March 2011. [Google Scholar]
  48. Greenblatt, D.; Wygnanski, I.J. The control of flow separation by periodic excitation. Prog. Aerosp. Sci. 2000, 36, 487–545. [Google Scholar] [CrossRef]
  49. Greenblatt, D.; Paschal, K.; Yao, C.; Harris, J.; Schaeffler, N.; Washburn, A. A separation control CFD validation test case. Part 1: Baseline & steady suction. In Proceedings of the 2nd AIAA Flow Control Conference, Portland, OR, USA, 28 June–1 July 2004; p. 2220. [Google Scholar]
  50. Duda, B.M.; Fares, E. Application of a Lattice-Boltzmann Method to the Separated Flow over the NASA Hump. In Proceedings of the 54th AIAA Aerospace Sciences Meeting, San Diego, CA, USA, 4–8 January 2016; p. 1836. [Google Scholar]
  51. Ma, J.; Peng, S.H.; Davidson, L.; Wang, F. A low Reynolds number variant of partially-averaged Navier–Stokes model for turbulence. Int. J. Heat Fluid Flow 2011, 32, 652–669. [Google Scholar] [CrossRef] [Green Version]
  52. Harris, J.; Smith, B.L.; Wilson, B. Investigation of relative importance of some error sources in particle image velocimetry. In Proceedings of the ASME 2012 Fluids Engineering Division Summer Meeting Collocated with the ASME 2012 Heat Transfer Summer Conference and the ASME 2012 10th International Conference on Nanochannels, Microchannels, and Minichannels, Rio Grande, PR, USA, 8–12 July 2012; pp. 1–11. [Google Scholar]
  53. Smith, B.; Howell, J. Uncertainty of Reynolds Stresses from PIV Measurements. In APS Meeting Abstracts; American Physical Society: College Park, MD, USA, 2017. [Google Scholar]
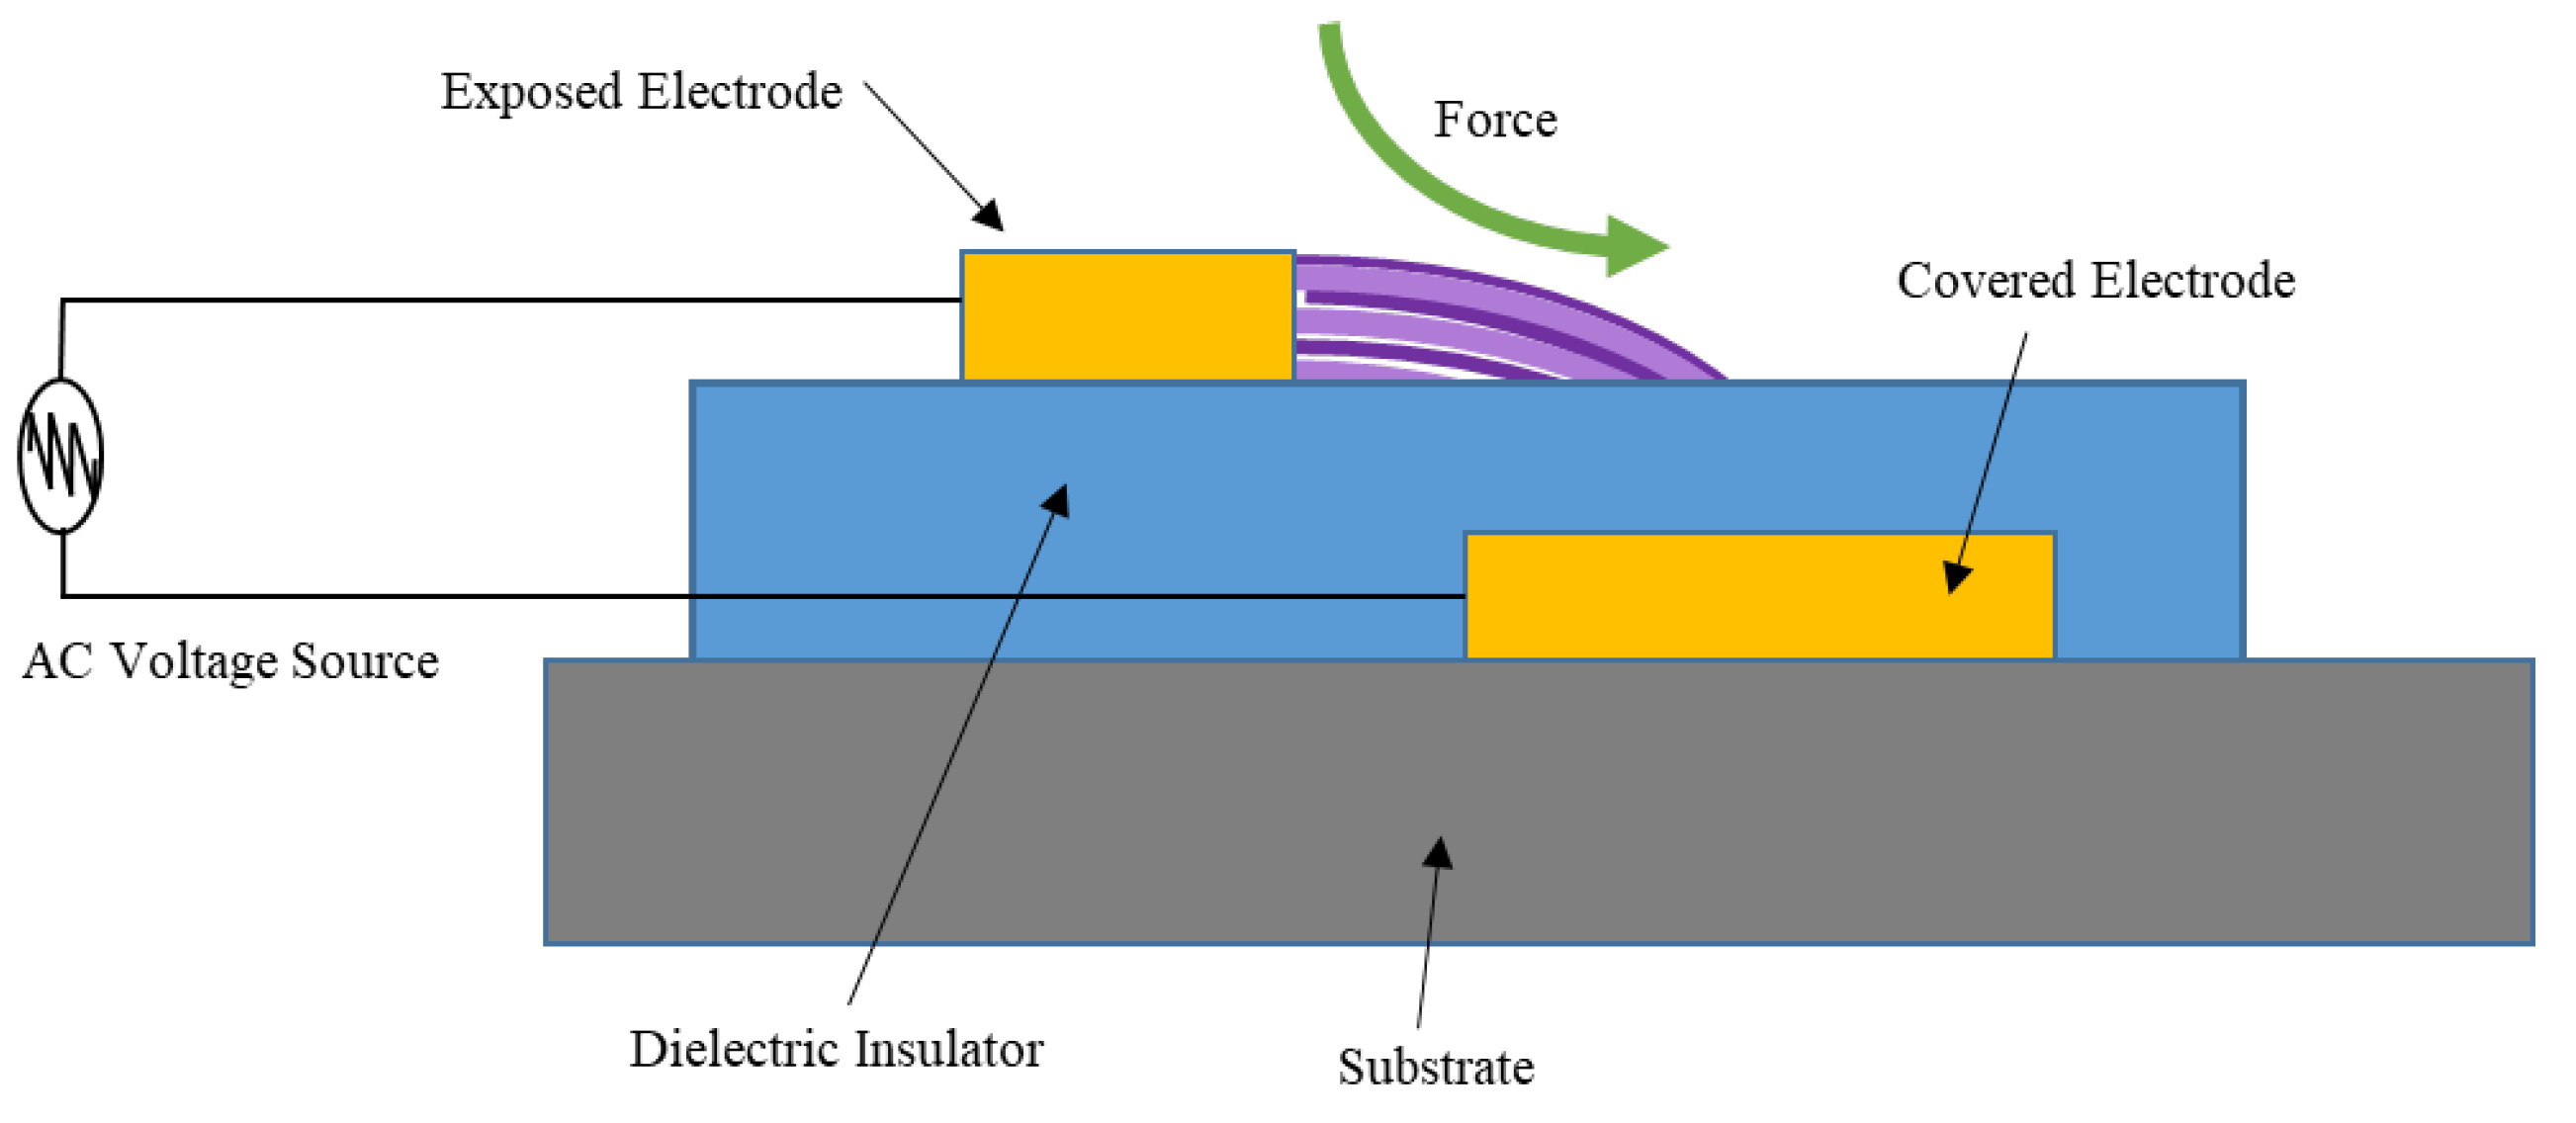
Figure 1. Schematic of a DBD plasma actuator.
Applsci 10 01911 g001
Figure 2. Electric field distributions in the actuator arrangement.
Applsci 10 01911 g002
Figure 3. Linearized electric field distributions.
Applsci 10 01911 g003
Figure 4. Two-dimensional geometry.
Applsci 10 01911 g004
Figure 5. Computational grid.
Applsci 10 01911 g005
Figure 6. Velocity streamlines and vectors showing the unsteady flow separation.
Applsci 10 01911 g006
Figure 7. Instantaneous u-velocity.
Applsci 10 01911 g007
Figure 8. Instantaneous iso-surface of Q = 150 showing complex flow structures.
Applsci 10 01911 g008
Figure 9. Instantaneous iso-surface of vorticity magnitude.
Applsci 10 01911 g009
Figure 10. Skin friction coefficient.
Applsci 10 01911 g010
Figure 11. Pressure coefficient.
Applsci 10 01911 g011
Figure 12. Normalized mean velocity along y / c at different streamwise stations.
Applsci 10 01911 g012
Figure 13. Normalized mean Reynolds stress along y/c at different streamwise locations.
Applsci 10 01911 g013
Figure 14. Velocity streamlines with the plasma actuator.
Applsci 10 01911 g014
Figure 15. Skin friction coefficient comparison between the baseline and plasma case.
Applsci 10 01911 g015
Figure 16. Coefficient of pressure comparison between the baseline and plasma case.
Applsci 10 01911 g016
Figure 17. Normalized mean velocity comparisons along y / c at different streamwise stations.
Applsci 10 01911 g017
Figure 18. Instantaneous iso-surface of Q-criterion with the active plasma actuator.
Applsci 10 01911 g018
Figure 19. Vorticity magnitude with the active plasma actuator.
Applsci 10 01911 g019
Figure 20. Plasma-induced instantaneous U-velocity at different time steps.
Applsci 10 01911 g020
Figure 21. Coefficient of skin friction comparisons for different plasma actuator locations.
Applsci 10 01911 g021
Figure 22. Coefficient of skin friction comparisons for different voltage frequencies.
Applsci 10 01911 g022
Table 1. Prescribed numerical parameters.
ParametersFreestream Values
Velocity34.6 m/s
Mach Number0.1
Reynolds Number936,000
Prandtl Number0.72
Strouhal Number0.2
Table 2. Plasma actuator test cases.
Case No.Actuator LocationApplied Voltage Frequency
1 x / c = 0.66 3 kHz
2 x / c = 0.63 3 kHz
3 x / c = 0.70 3 kHz
4 x / c = 0.66 1.5 kHz
5 x / c = 0.66 5 kHz
Table 3. Parametric values of the plasma body force modeling.
ParametersValues
Charge density, ρ 1 × 10¹¹/cm3
Electron charge, e1.6 × 10−19 C
Discharge time, Δ t 67 µs
Plasma height, a / c 0.018
Plasma length, b / c 0.024
Applied voltage frequency, ϑ 3 kHz
Breakdown electric field strength, E b 30 kV/Cm
Non-dimensional plasma force parameter, D c 110
Table 4. Plasma actuator test case results.
Case No.Actuator LocationApplied Voltage FrequencySeparation LocationReattachment Location
1 x / c = 0.66 3 kHz0.680.90
2 x / c = 0.63 3 kHz0.680.88
3 x / c = 0.70 3 kHz0.720.73
4 x / c = 0.66 1.5 kHz0.671.1
5 x / c = 0.66 5 kHz--