Article

Simulation Analysis and Experimental Validation of Cathode Tool in Electrochemical Mill-Grinding of Ti6Al4V

College of Mechanical & Electrical Engineering, Nanjing University of Aeronautics and Astronautics, Nanjing 210016, China
*
Author to whom correspondence should be addressed.
Appl. Sci. 2020, 10(6), 1941; https://doi.org/10.3390/app10061941
Submission received: 15 February 2020 / Revised: 29 February 2020 / Accepted: 9 March 2020 / Published: 12 March 2020
(This article belongs to the Section Mechanical Engineering)

Abstract

:
Electrochemical mill-grinding (ECMG) is an ideal technical means to achieve an efficient and precise machining of titanium alloy monolithic structural parts. In the rough ECMG process, the selection of a reasonable cutting depth can improve the machining efficiency of the rough machining. Adopting a reasonable cathode tool structure can achieve a higher precision in the formation of the rough surface, reduce the finishing allowance and tool wear of subsequent finishing. With this aim, the present research proposed a cathode tool with a reasonable structure. Simulation results showed that the designed cathode tool presented a good uniformity of the flow field in the machining gap, which resulted in a higher precision in the formation of the rough surface. For experimental validation, a larger cutting depth and a designed cathode tool was employed to carry out the rough and finish machining experiments on a Ti6Al4V titanium alloy. The experimental results show that a good flatness of the sidewall of the rough-machining groove was obtained by this scheme. Furthermore, the machining surface exhibited no flow marks, and rough machining accounted for 92.37% of total removal. Moreover, measurement of the micro-morphology, roughness and elemental composition of the machined surface, and the effects of different machining parameters on the surface quality of titanium alloys, were studied.

1. Introduction

Titanium alloy material is a structural material with a high temperature resistance, low density, high strength, and has a very important application value and broad application prospects in the fields of aerospace, electronic communication and marine engineering [1,2]. Due to their good mechanical properties, titanium alloys are mostly used in the manufacture of aerospace monolithic components such as integral wall panels and frame parts [3,4,5]. During the mechanical cutting process, due to the poor thermal conductivity of the titanium alloy materials and the strong adhesion between the tool and the workpiece material, tool wear easily occurs [6,7], thereby requiring a frequent change of the tool. In addition, usually the monolithic components are directly processed from the whole blank to produce features such as cavities and webs. As a result, the material removal ratio may exceed 90% [8], which increases the processing cost of the titanium monolithic components prominently. For this reason, it is necessary to explore the efficient and low-cost processing methods of titanium alloy monolithic components.
Electrochemical grinding (ECG) is an electrochemical mechanical composite machining method. During processing, the surface of the workpiece is oxidized into a dense anode passivation film under the effect of the current and the electrolyte [9,10]. The passivation film can be quickly scraped off by the abrasive on the grinding wheel, so that the new metal is exposed on the surface of the workpiece, and the process of electrolysis can continue. Obviously, this advantage is suitable for the processing of the easily passivated metals such as titanium alloys. In addition, compared to mechanical grinding, ECG has a higher productivity and less tool wear [11,12]. S. Zaborski and M. Lupak [13] found that the maximum linear wear of the grinding wheel after the mechanical grinding of the hard alloy and titanium alloy for 3 min was 8 times and 6 times, respectively, compared to that of ECG. In addition, they also observed that within the parameter range of the cutting depth of 0.01 to 0.06 mm and a feed rate of 25 to 200 mm min−1, the energy consumption of the ECG of titanium alloys was significantly lower than that of the mechanical grinding [14]. V. V. Lyubimov et al. [15] carried out ECG experiments on hard alloys with different compositions and found that compared to mechanical grinding; the grinding wheel loss was reduced by about 60% and the material removal rate increased by 73%. R. N. Goswami [16] and others found that in the machining of Al2O3/Al composites, the grinding force in ECG was reduced by about 75%~95% compared to that of mechanical grinding. In addition, under the test conditions of feed speed of 24 mm/min and cutting depth of 0.08 mm, the material removal rates obtained by the mechanical grinding and ECG were 0.053 g/min and 0.141 g/min, respectively.
However, currently ECG is mostly used to improve the surface characteristics of the workpiece by making a very small thickness of the material removal in a single pass. In addition, due to the size and shape of the conductive grinding wheel, the ECG process is difficult to apply in the manufacturing of complex structures and profiles, and the processing flexibility is poor. Electrochemical mill-grinding (ECMG) is a flexible composite processing method of electrochemical processing and mechanical processing, which was developed on the basis of ECG processing technology in recent years. It uses a rod-shaped tool with abrasive grains to achieve the processing of complex structures through a method similar to milling, but has higher a flexibility and productivity than the ECG. Qu et al. [17] integrated the advantages of the electrochemical milling and ECG and proposed the ECMG method for the first time with external liquid supply. Using a brazed diamond abrasive ball-end rod tool, they conducted an electrochemical mill-grinding test study on Inconel 718 using a cutting depth of 0.5 mm. Subsequently, the internal liquid supply method was also applied to ECMG. Li et al. [18] opened a single row of liquid spray holes in the side wall of an electroplated diamond abrasive tubular cathode tool with a cutting depth of 3 mm, and processed a boss structure on GH4169. Niu et al. [19] opened 4 outlet holes in the side wall of an electroplated diamond abrasive tubular tool with a cutting depth of 10 mm. By using a numerical simulation of the flow field and an experimental validation by an Inconel 718 cutting test, they found that compared with the vertical arrangement, the spiral arrangement effectively improved the flatness of the side of the workpiece.
When ECMG adopts the method of spraying liquid on the side wall of the tubular tool, it can directly perform the “cut-in” processing with a large cutting depth from the side wall of the workpiece. It has significant advantages and broad application prospects in the field of efficient manufacturing of the structural parts of difficult-to-machine materials. However, the current research on ECMG technology is mainly focused on the nickel-based superalloy Inconel 718/GH4169 [17,18,19,20], and there are no reports on the electrochemical mill-grinding of titanium alloys. In addition, the cutting depths of the previous studies are all within 10 mm. If the method of increasing the number of liquid outlet holes is still used to obtain a larger cutting depth, the reduction in the geometric accuracy of the cathode tool is possible. It is particularly important that the previous research showed that the uneven flow field distribution in the processing gap of the porous liquid outlet tool causes obvious flow marks on the processed surface of the workpiece [21,22], which adversely affects the precision.
In view of the above problems, the present research proposed the design and development of a cathode tool suitable for ECMG with large cutting depth. A reasonable electrolyte outlet layout ensured the uniformity of the flow field in the machining gap; so as to obtain a better precision in the formation of the rough-machining surface and reduce the removal of the finishing and tool wear. For this purpose, through the numerical simulation of the flow field, a scheme optimization study was carried out. Subsequently, using a larger cutting depth with the designed cathode tool scheme, the rough and finish machining of Ti6Al4V titanium alloy was performed and analyzed. In addition, the effects of different processing parameters on the surface quality of titanium alloys were studied by measuring the micro-morphology, roughness and elemental composition of the processed surface.

2. Simulation Analysis

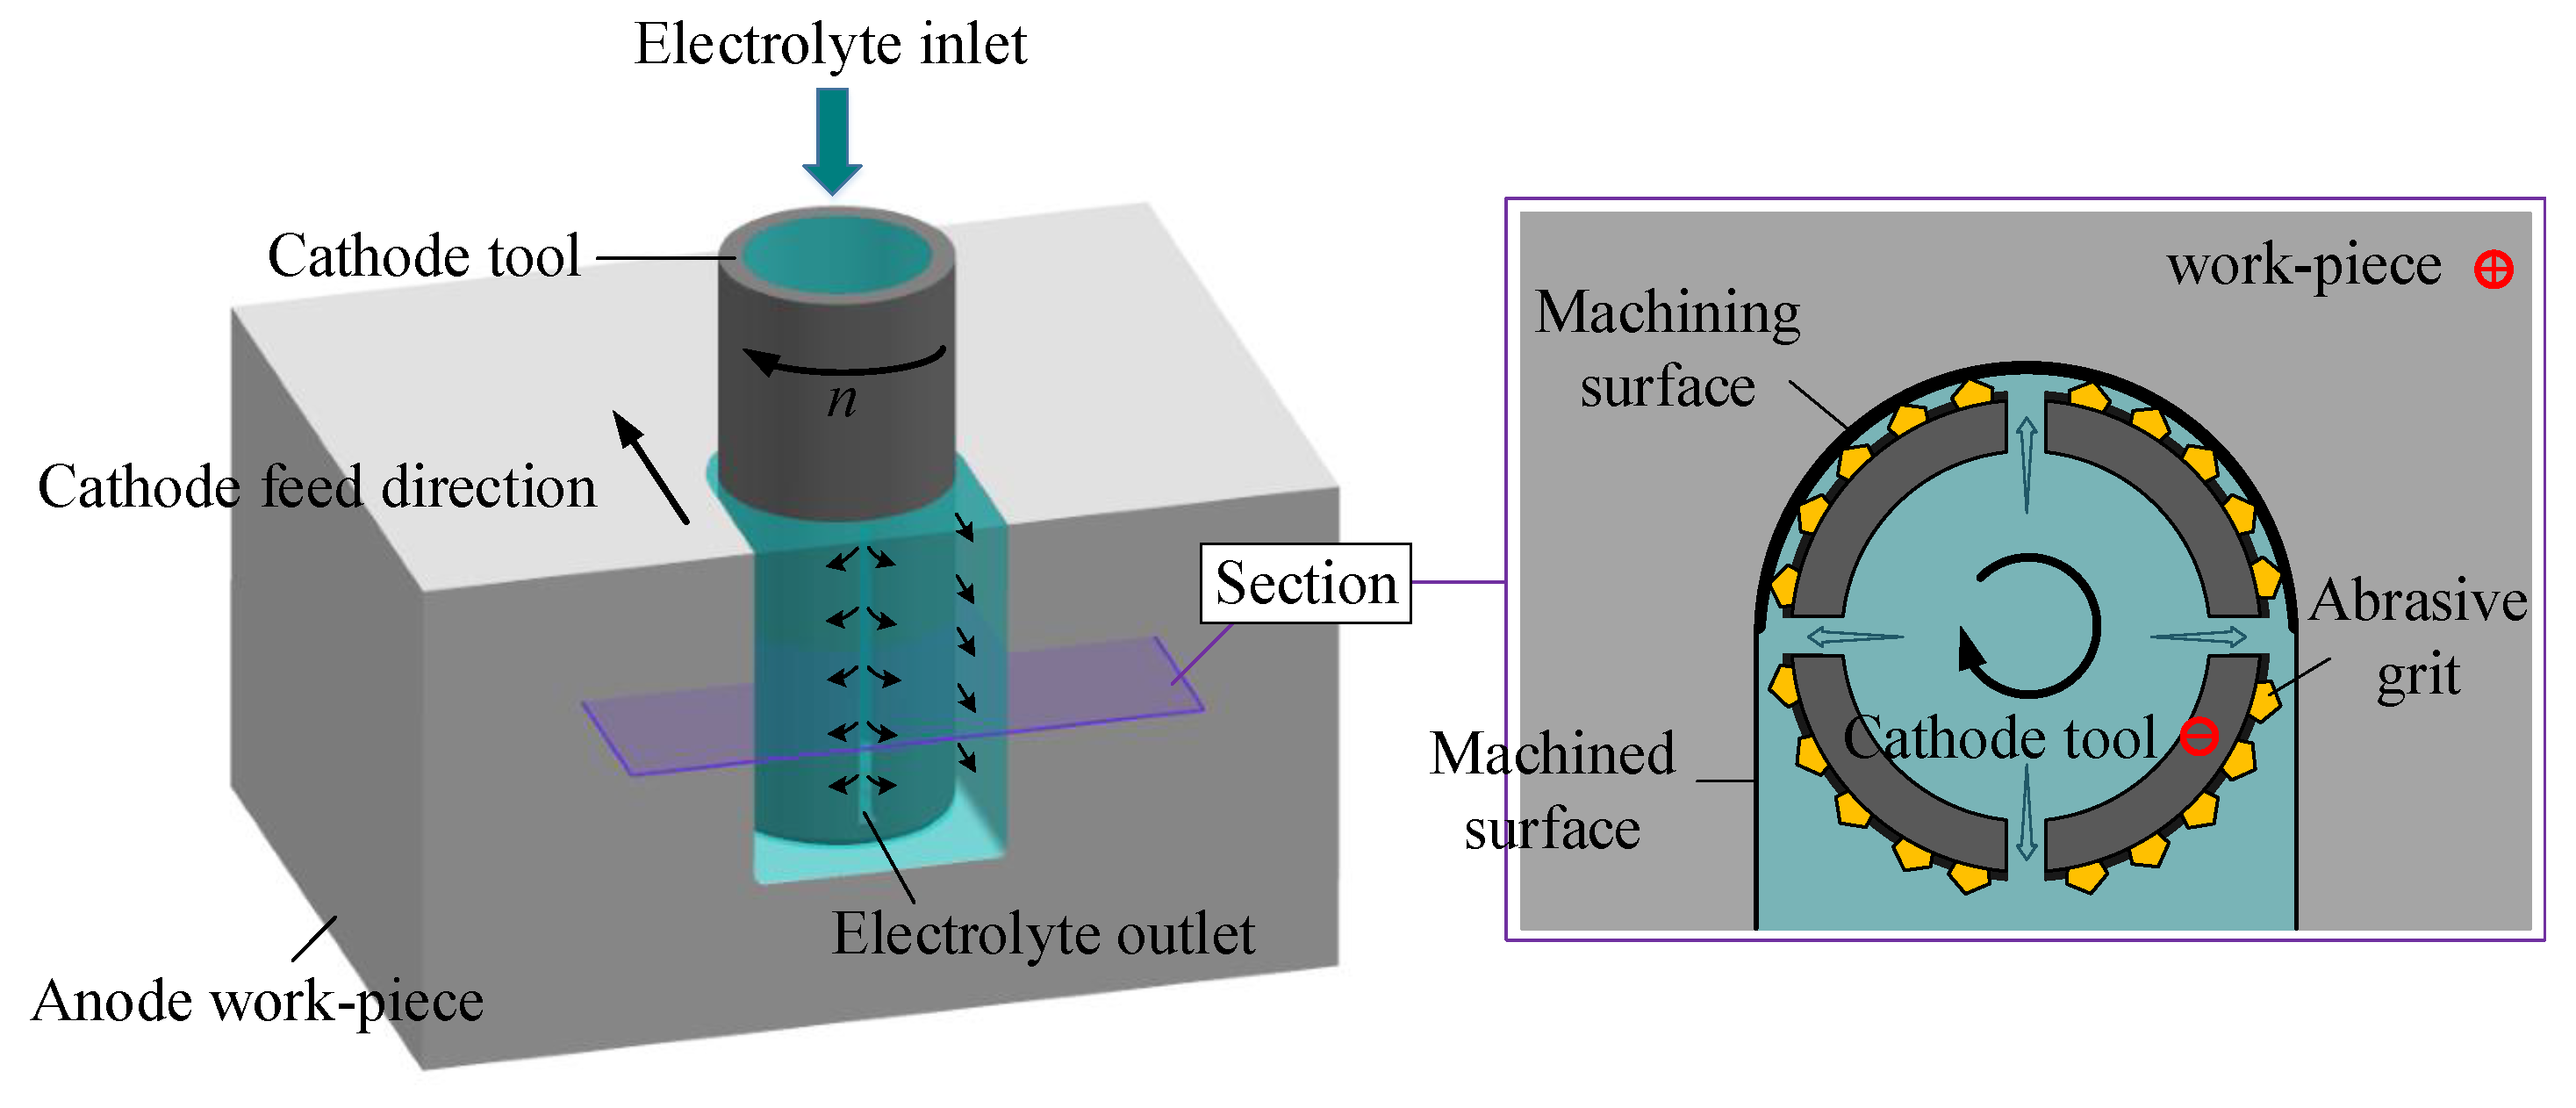
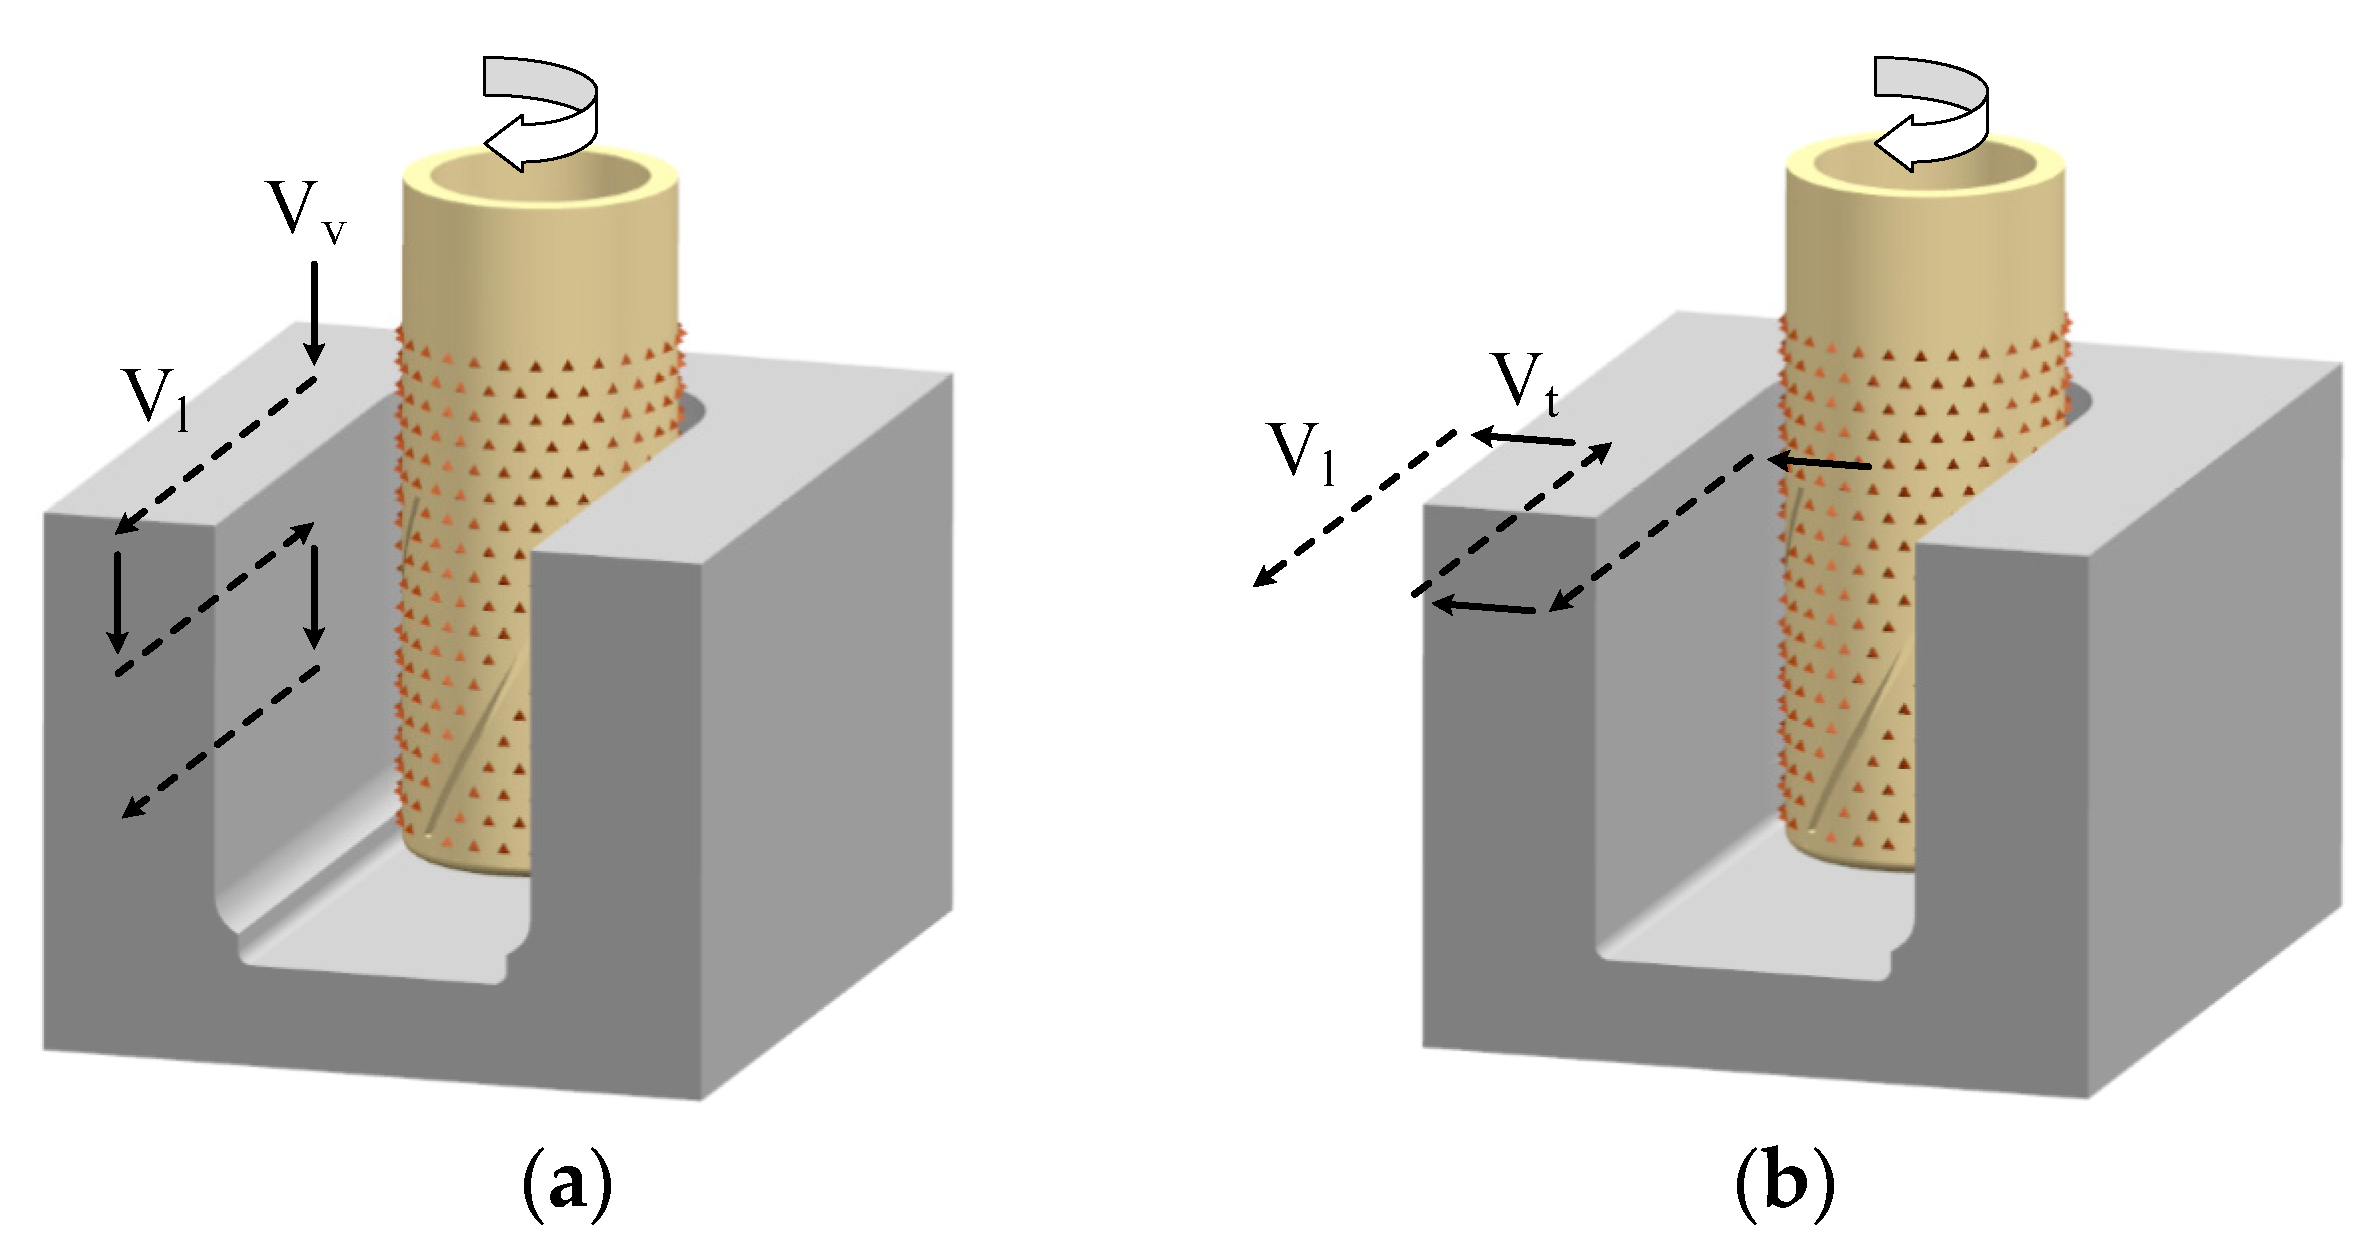
2.1. Principle of Electrochemical Mill-Grinding (ECMG)

When ECMG adopts the method of spraying liquid on the side wall of the tubular tool, it can directly perform the “cut-in” processing with a large cutting depth from the side wall of the workpiece. Figure 1 shows the schematic diagram of the ECMG. The cathode tool possessed a central blind hole along its axis, and a number of liquid outlet channels connected to the center hole were arranged on the sidewall. The surface of the cathode tool was covered with the protruding abrasive particles. During the processing, the workpiece was connected to the positive electrode of the power supply and the tool was connected to the negative electrode. The cathode tool rotated and fed relative to the anode workpiece. The electrolyte entered the blind hole shunt cavity, flowed out through the liquid outlet channel, entered the processing gap, participated in the electrolytic reaction, and carried away the processed products. When a high voltage was applied, the removal of the material mainly depended on the electrochemical dissolution, which was used to remove most of the machining allowance of the workpiece. When a lower voltage was applied, the passivation film on the surface of the material was mainly removed by the mechanical grinding, and the surface of the workpiece was leveled. The cathode tool was continuously fed relative to the anode workpiece by employing a computer program, until the required shape and size were processed.

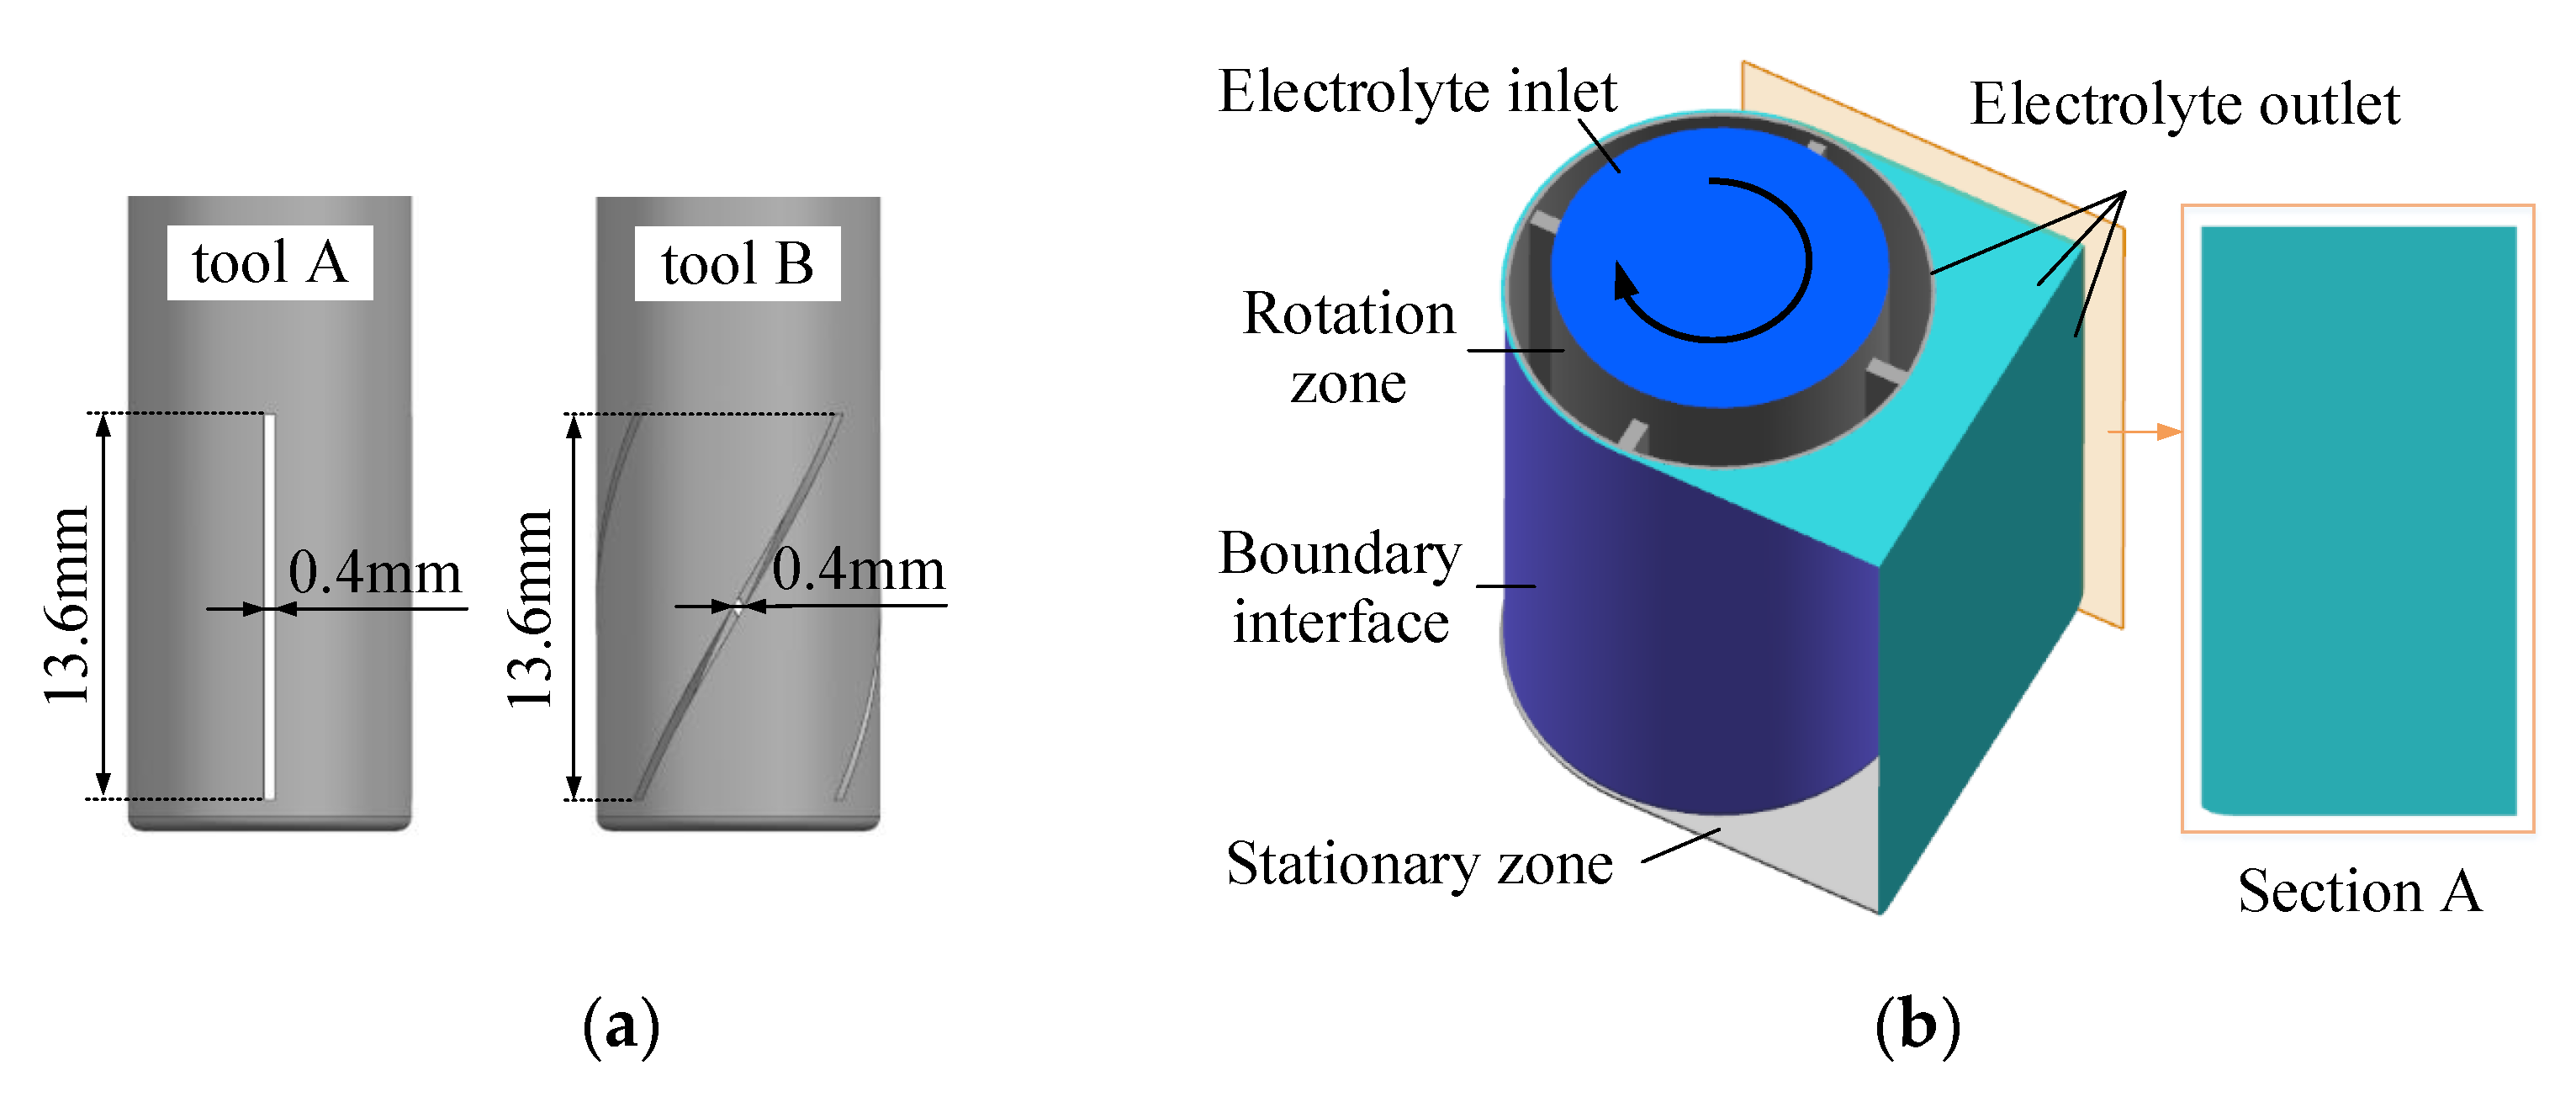
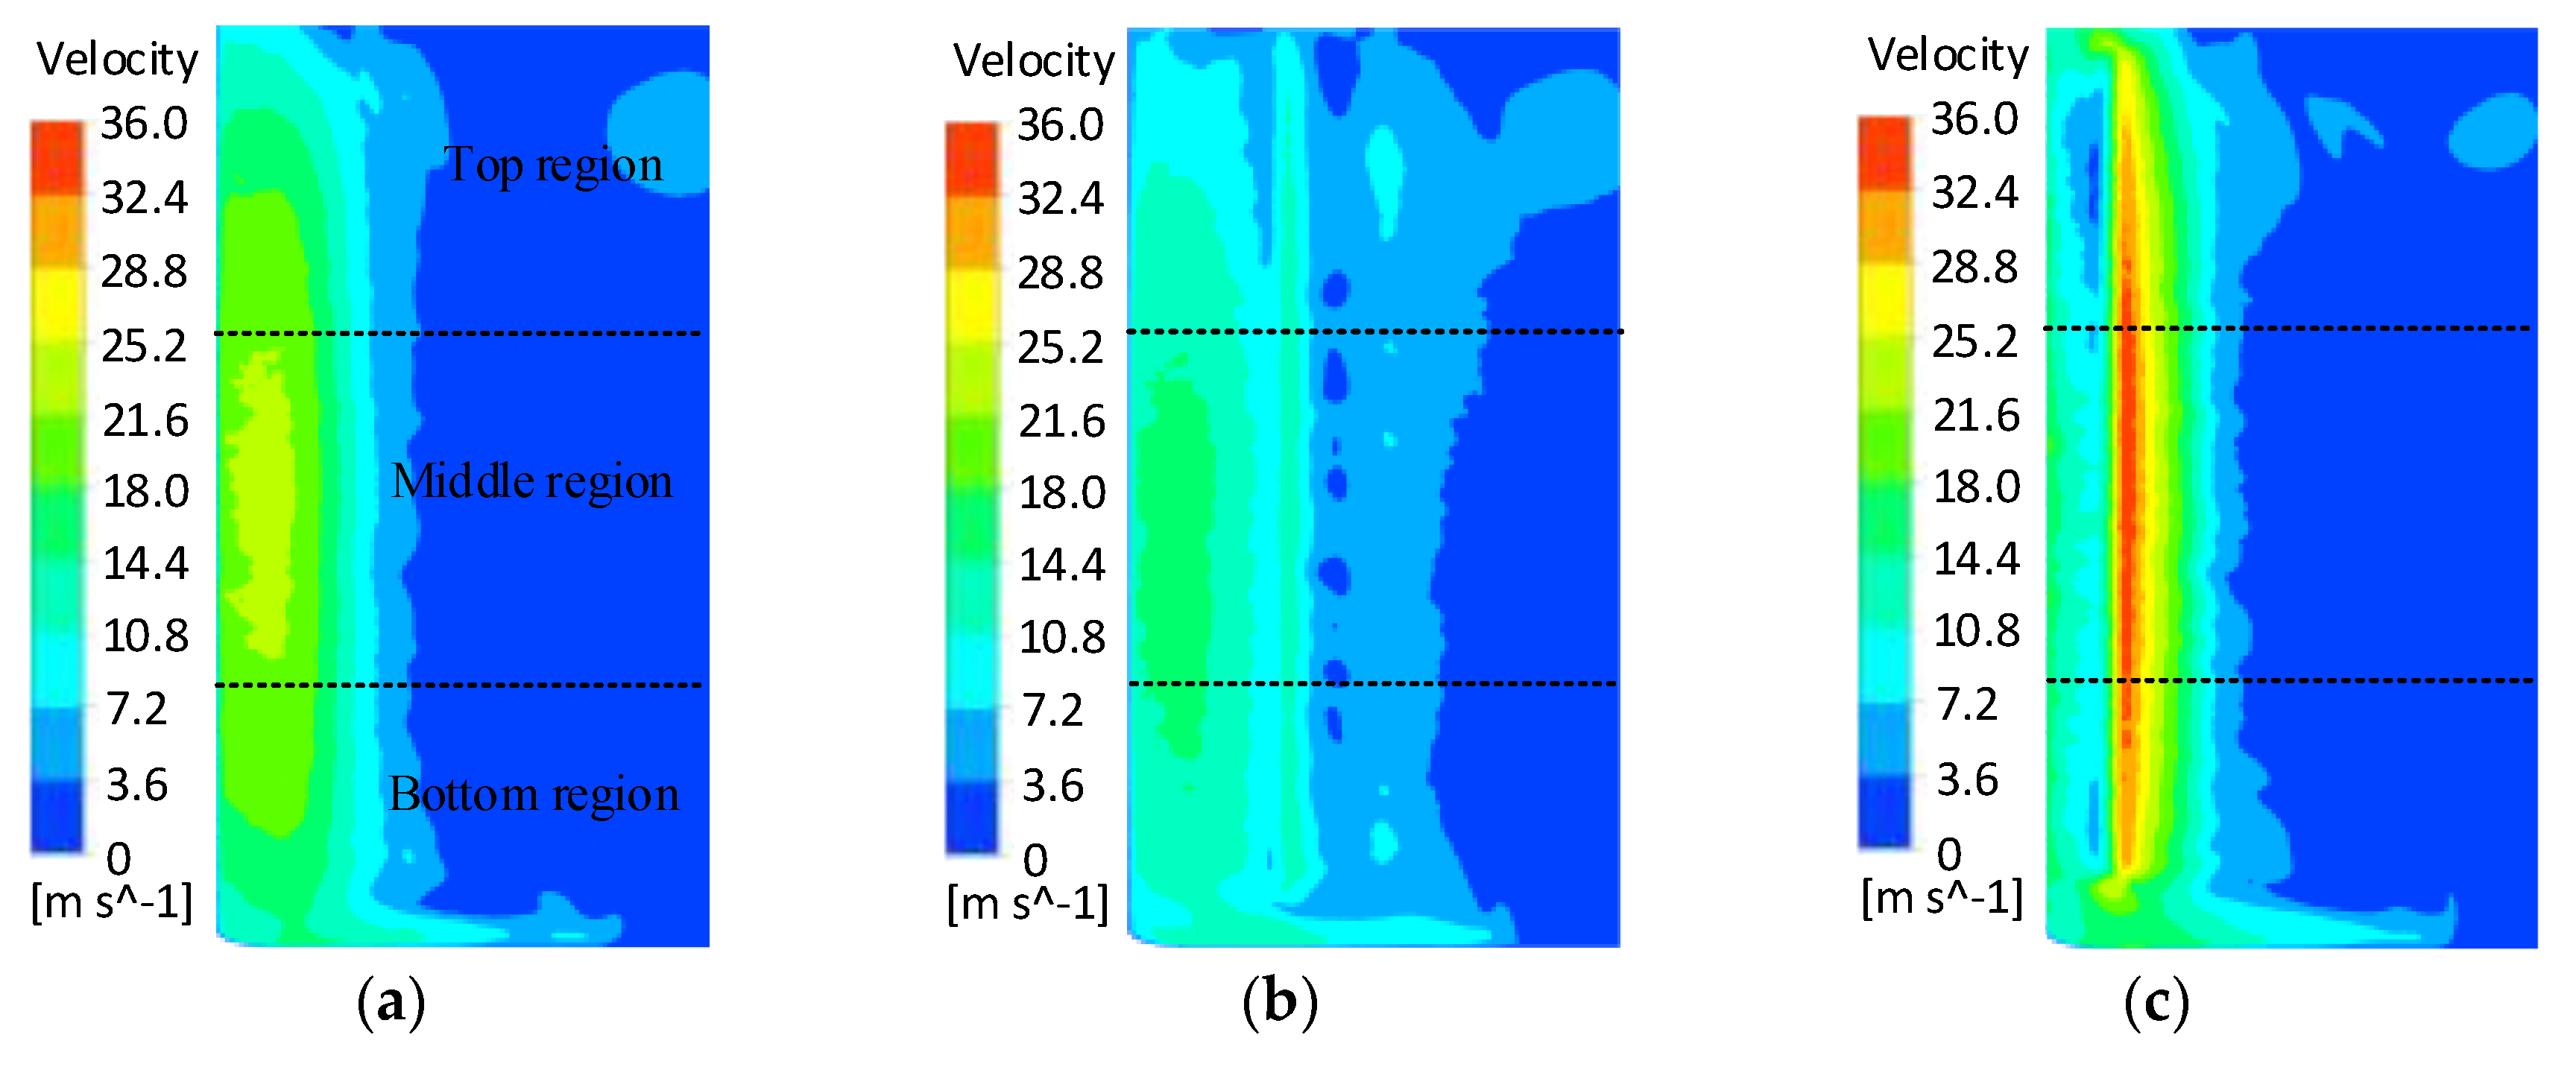
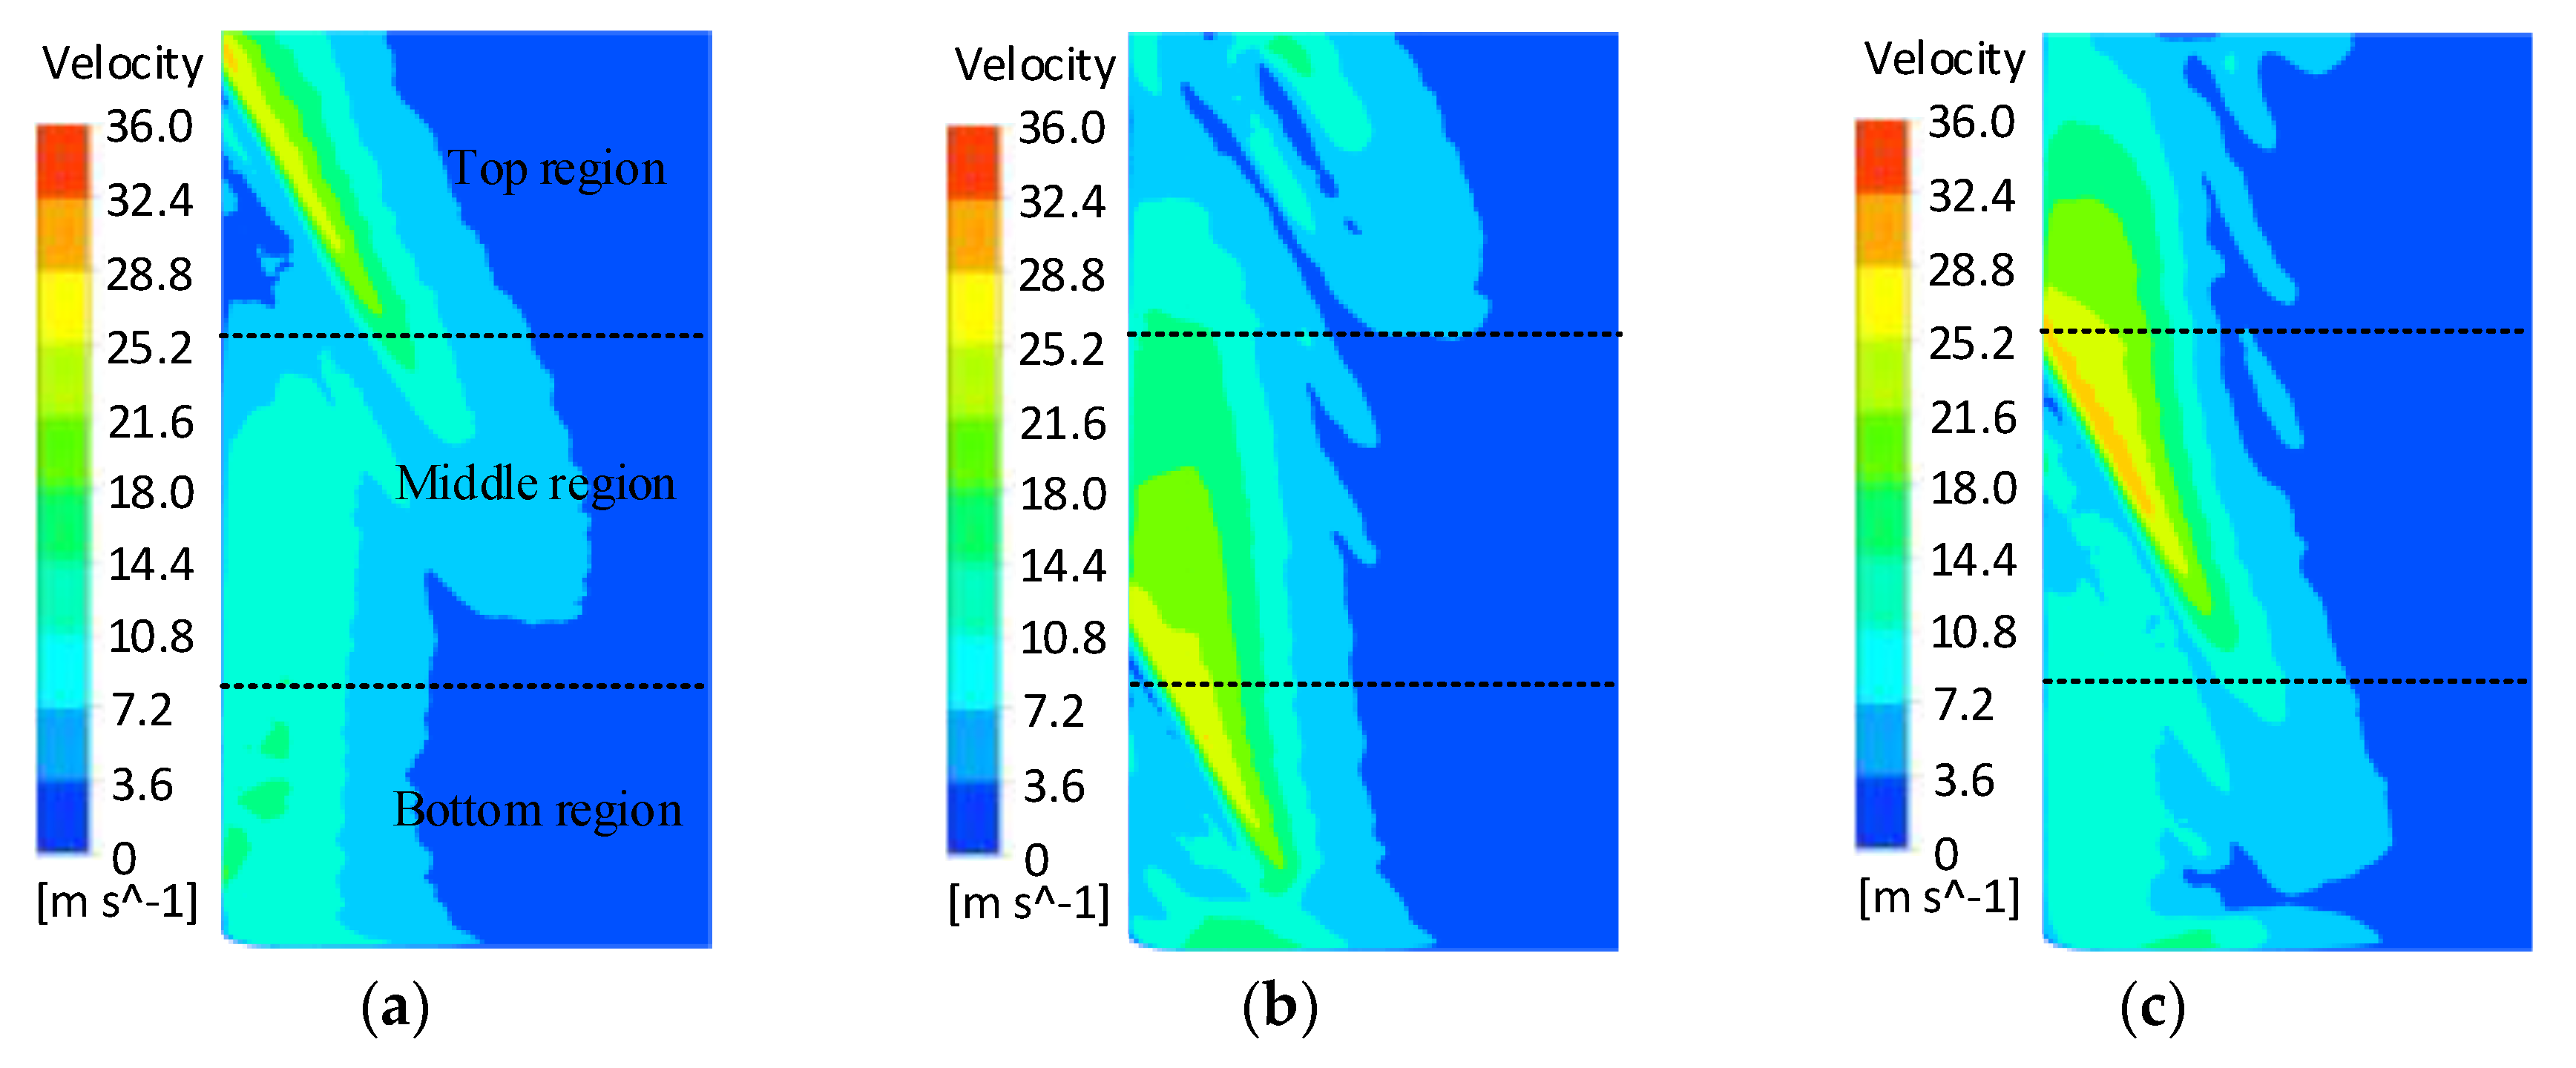
2.2. Flow-Field Simulation

The tool base used in this study was a tube electrode with a cut depth of 15 mm, a wall thickness of 1 mm, and a closed end. The outer and inner diameters were 10 mm and 8 mm, respectively. The electrolyte outlet channel on its side wall was in the form of a slit, and the slit height and slit width were 13.6 mm and 0.4 mm, respectively. Figure 2a shows the tool base of two different outlet slit arrangements, where the outlet slit arrangements of tools A and B were linear and spiral, respectively. The number of electrolyte outlet slits that distributed uniformly along the circumference of each tool base was 4. The distance between the bottom end of the outlet slit and the end surface of the cathode tool was 1.1 mm. The pitch of tool B was 54.4 mm, and the two ends of the adjacent outlet slits were on the same bus. In order to clarify the influence of the layout of the outlet slit on the flow velocity distribution of the electrolyte in the side gap, a flow field simulation geometric model of tools A and B was established. Considering the flow field simulation model of tool A, as an example, the boundary conditions were set as shown in Figure 2b. Section A was selected at a distance of 0.05 mm from the machined surface to observe the flow velocity distribution of the electrolyte in the side gap. The simulation parameters are shown in Table 1. The flow field simulation was performed in Fluent 17.0.
The four electrolyte outlet slits of the cathode tool were evenly distributed on the circumferential surface, which means that each time the cathode tool rotated, the same flow field state repeated 4 times. Therefore, we analyzed the flow field between the 0° and 90° rotation angle. Figure 3 presents the cloud diagram of the electrolyte flow velocity distribution in the side gap at different rotation angles of Tool A. When the cathode tool was rotated to 30° and 45° (see Figure 3a,b), the non-electrolyte-outlet-slit area was directly opposite section A, and the high-velocity area was distributed on a vertical straight line. The flow velocity decreased from the middle to the upper and lower ends. When the cathode tool was rotated to 90° (see Figure 3c), the electrolyte outlet slit was directly opposite section A. At this time, the area of high flow velocity was distributed on the parallel side of the electrolyte outlet slit, and the flow velocity in the middle was higher than that in the upper and lower ends.
Analysis of the simulation results shows that the distribution of the flow velocity was directly related to the layout of the outlet slit. The flow field of tool A was relatively concentrated. Even if the cathode tool was rotated through different angles, the high-velocity area always acted in the middle of the side gap. In the process of electrolytic processing, the flow field has a great influence on the conductivity. Electrolytic products accumulate at the locations with lower flow rates, resulting in a significant change in the composition and concentration of local electrolytes in the processing zone, thereby reducing the processing reaction rate [23]. The difference in the high and low flow rates under a non-uniform flow field for a long time resulted in different rates of material removal, and it was difficult for the tool A to ensure the flatness of the machined surface.
Flow field simulation was performed on tool B. Figure 4 is a cloud diagram of the flow velocity distribution of the electrolyte solution located in the side gap under different rotation angles of tool B. It can be seen from the figure that due to the shape of the spiral outlet slit; the high flow velocity area no longer converged in a straight line, but was distributed on the side of the outlet slit in an inclined form. During the rotation of tool B, the position of the electrolyte outlet slit facing the section A constantly changed, and the high flow velocity area was always concentrated near this position. When tool B was rotated at 30°, 60° and 90°, the high-flow areas were arranged obliquely at the top, bottom, and middle of section A, respectively. Because both ends of the adjacent electrolyte outlet slits were on the same bus, during the rotation of tool B, there was always a spiral electrolyte outlet slit continuously facing the section A in different positions. Every time the tool rotated a certain angle, the high velocity area distribution on section A was updated, so that the area that was repeatedly subjected to the high-speed electrolyte flow was reduced. According to the flow field analysis, compared to tool A, the uniformity of the flow velocity distribution of the electrolyte in the sidegap was greatly improved when tool B was continuously rotated, thus it was more suitable for ECMG.

3. Experimental

3.1. Experimental Set Up

Based on the simulation results of the flow field, the cathode tool with spiral slits was selected to perform the ECMG testing study. The actual cathode tool is shown in Figure 5. The base material of the rough and finish machining tools was 45 steel, the size of the base was similar to the design part. The side wall was plated with the diamond abrasive particles (particle size of the diamond abrasive was 170/200), and the outer diameter was about 10.2 mm. The end face of the rough-machining tool was insulated to suppress the electrochemical dissolution of the bottom surface of the workpiece and reduce the subsequent finishing allowances. Diamond abrasive particles were electroplated on the end surface of the cathode tool for finish machining of the bottom.
The test material was Ti6Al4V titanium alloy (mass fraction ratio Ti: 89.335%, Al: 6%, V: 4%, Fe: 0.3%, O: 0.2%, C: 0.1%, N: 0.05%, H: 0.015%). In order to select reasonable ECMG parameters, an electrochemical workstation (Zennium E, ZAHNER-elektrik GmbH & Co.KG, Kronach, Germany) was used to measure the anodic polarization curve of Ti6Al4V. The platinum electrode was used as a counter electrode and the calomel electrode was employed as the reference electrode. Polarization measurements were performed in 10% NaNO3 solution at 30 ± 1 °C with a scan rate of 10 mV/s and a scan range of 0 to 13 V.
The measurement results of the polarization curve of Ti6Al4V in 10% NaNO3 solution are shown in Figure 6. It can be seen that when the temperature of the electrolyte solution was 30 °C, the dissolving potential of Ti6Al4V was about 11 V. In the passive region, the current density value was almost zero, and the material did not dissolve at this time. When the dissolving potential was reached, the current density increased rapidly and continuously. The higher the potential, the higher the current density, and stronger was the electrochemical dissolution. After the current density exceeded 1.2 A/cm2, the current density still increased with the increase of the potential, but the rate of this increase decreased.

3.2. Groove-Machining Experiment

The schematic of rough machining by ECMG is shown in Figure 7. The cathode tool was directly plunged into the workpiece with a cutting depth of 15 mm from the side wall of the workpiece, with a feed distance of 25 mm. According to the measurement results of the polarization curve, when the temperature of the electrolyte solution was 30 °C, the dissolution potential of Ti6Al4V in a 10% NaNO3 solution was about 11 V. Therefore, the voltage applied in the rough-machining stage was less than 11 V. According to Faraday’s law, the current density is directly proportional to the dissolution of the material. When the voltage was greater than 11 V, the current density increased with an increase in the voltage. In order to improve the efficiency of electrochemical mill-grinding on Ti6Al4V, a voltage of 25 V was selected as the processing voltage in the test. The specific processing parameters are shown in Table 2.
In the rough-machining stage of ECMG, in order to pursue a high material removal rate, a higher voltage was necessary. However, this could cause a severe stray corrosion, resulting in poor quality of the processed surface. Therefore, it was necessary to perform a finish machining by ECMG on the surface of the workpiece after rough machining, so as to improve the surface quality of the workpiece and further improve the surface flatness. The Ti6Al4V polarization curve shows that the material began to dissolve when the potential exceeded 11 V. Therefore, in order to reduce the tool wear and stray corrosion in the processed area, a low voltage was selected in the finish-machining stage. Using a cathode tool that was not insulated at the bottom, the process of removing small amounts of material from the bottom and sides of the workpiece was performed layer by layer. The schematic diagram of ECMG finishing is shown in Figure 8. The tool first provided the finishing of the bottom. The longitudinal feed rate (Vl) and vertical feed rate (Vv) were 60 and 1mm/min, respectively. The tool performed the finishing of both sides based on the position of the bottom finishing. The longitudinal feed rate (Vl) and transverse feed rate (Vt) were 60 and 1mm/min, respectively. The specific processing parameters are shown in Table 3.
The Ti6Al4V workpieces were ultrasonically cleaned before and after each experiment, and after drying, they were weighed with an analytical balance (accuracy 0.01 g) to calculate the weight of the material removal.

4. Results and Discussion

The total material removal volume after the rough and finish machining stages was found to be 4767.27 mm3, of which the material removal in the rough-machining stage accounted for 92.37%. Figure 9a shows the cross section of the groove obtained by ECMG rough machining. It can be seen from the figure that after rough machining by the spiral slit cathode tool, the flatness of the sidewall was good. The material was removed uniformly, and there was no flow mark on the processed surface. However, the rounded corners and some poorly soluble electrolytic products still existed. Figure 9b shows the cross section of the groove obtained after the finish machining. It can be seen from the figure that after finish machining, the flatness of the side wall and bottom was further improved, and the rounded corners and insoluble electrolytic products were removed. The coordinates of the points on the corresponding profile of the rough and finished grooves were detected by a bridge type three coordinates measuring machine (ZEISS CONTURA, Germany), and the results are shown in Figure 9c. According to the measurement results of the profile, the maximum groove width and depth of the roughing were 12.16 mm and 15.67 mm, respectively. The maximum groove width and depth of the finishing were 12.62 mm and 15.93 mm, respectively. After rough machining, the sidewall was relatively flat and there were no pits on the bottom of the workpiece, and the removal margin of finish machining was small. This effectively reduced the finishing removal and tool wear.
The surface morphology of the grooves at the rough and finishing stages was detected by a scanning electron microscope (S-3400, Hitachi, Tokyo, Japan). It can be observed from Figure 10a that after rough machining, the surface exhibited severe stray corrosion, which was manifested by uneven selective dissolution, and the microstructure was porous. It can be seen from Figure 10b that the grinding marks on the surface were obvious after finish machining. Ridges were seen on the surface, and the ridge height of the material was different. This was a typical plough and chip formation characteristic in grinding [24]. This shows that during rough machining, the electrochemical dissolution played a leading role. In contrast, the grinding played a leading role in the finish machining. In addition, during the finishing process, the forming of the workpiece surface was no longer affected by stray corrosion.
A laser confocal microscope (OLS4100, Olympus, Tokyo, Japan) was used to scan the three-dimensional topography of the processed surface of the grooves after the ECMG rough and finish machining, and to check the surface roughness. The results are shown in Figure 11. It can be seen from Figure 11a that the surface after ECMG rough machining was rough and uneven. It was found that the surface wave peaks and valleys were undulating, and the measured surface roughness Ra was 5.182 μm. Figure 11b shows that after ECMG finish machining, the surface was relatively smooth, and the measured surface roughness was 0.760 μm Ra. Compared with the rough machining, the height fluctuation of the groove surface after finishing was significantly reduced, the surface roughness Ra was reduced by 85.3%, and the surface quality of the workpiece was significantly improved.
Figure 12 shows the energy spectrum measurement results (EDX) of the groove surface after rough and finish machining. It can be seen from Figure 12a that the contents of O, C, and Ti elements after rough machining were 36.95 wt%, 8.96 wt%, and 50.04 wt%, respectively. Furthermore, the content of O and C elements decreased significantly after finish machining, which were 1.13 wt% and 3.25 wt%, respectively, while the content of Ti element increased to 87.39 wt%. In addition, the content of Al and V elements also increased. The results show that after the rough-machining stage, due to the stray corrosion of the processed surface of the groove, a large amount of electrolytic products with high adhesion were generated and it was difficult to completely remove these by ultrasonic cleaning. In the ECMG finish machining stage, grinding played an important role, which crushed and removed the electrolytic products covering the processed surface of the groove and thus exposed more metal matrix materials. This further confirmed that no stray corrosion occurred on the surface of the workpiece during the finishing process.

5. Conclusions

The present research proposed the development of two types of cathode tools for the efficient machining of difficult-to-machine Ti6Al4V titanium alloys, with a cutting depth of 15 mm and an electrolyte outlet in the form of slits. Experiments were performed using a flow field simulation analysis and validated by the ECMG test. The major conclusions of the research are as follows:
(1)
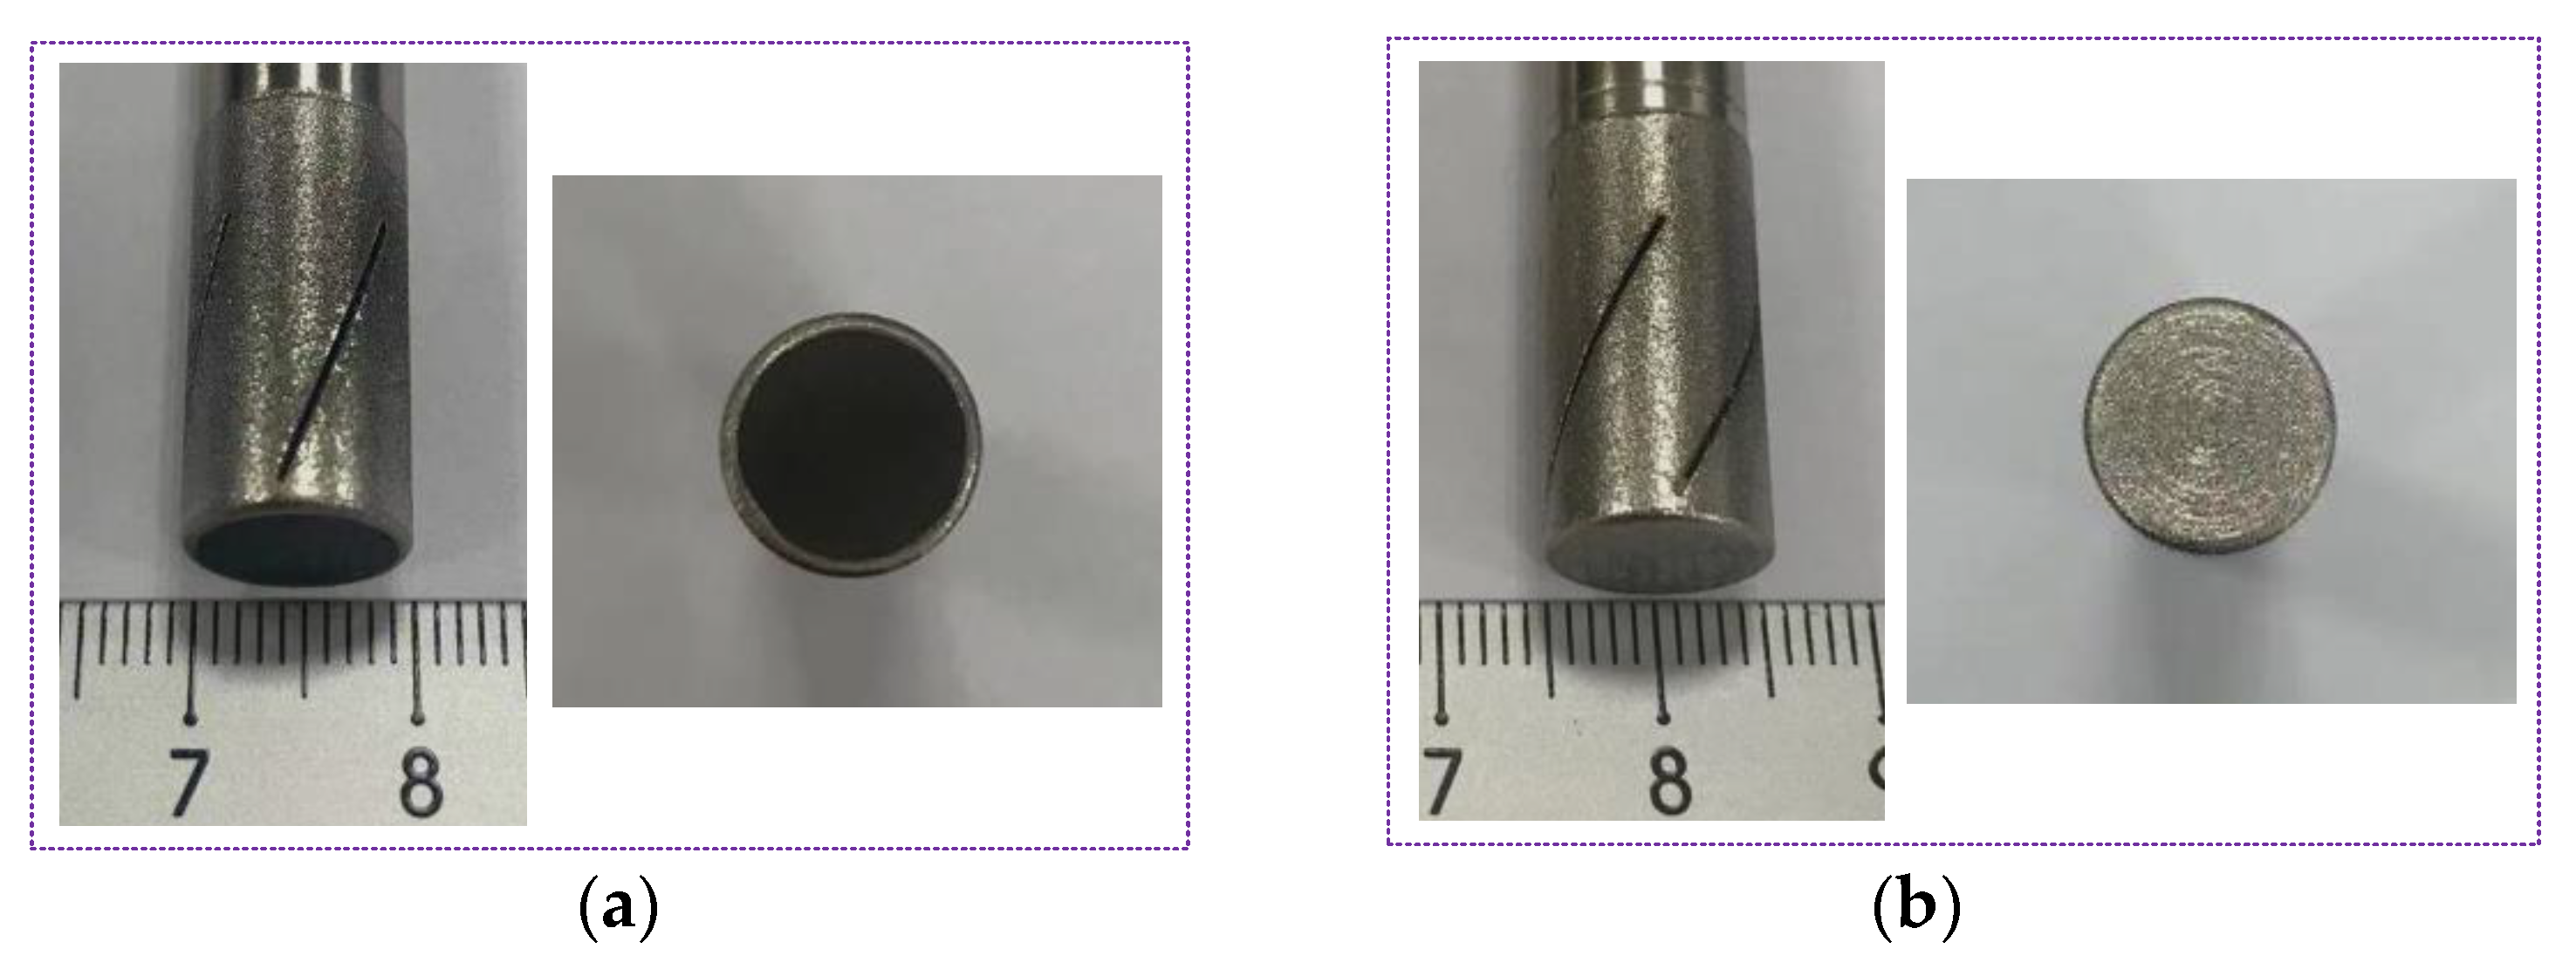
The FLUENT 17.0 flow field simulation results showed that the flow field in the cathode tool machining gap was unevenly distributed with a linear electrolyte outlet slit, and the flow field did not improve as the cathode tool rotated. The cathode tool with a spiral outlet slit provided a uniformly changing flow field with its rotation, which reduced the area repeatedly subjected to high-speed electrolyte flow.
(2)
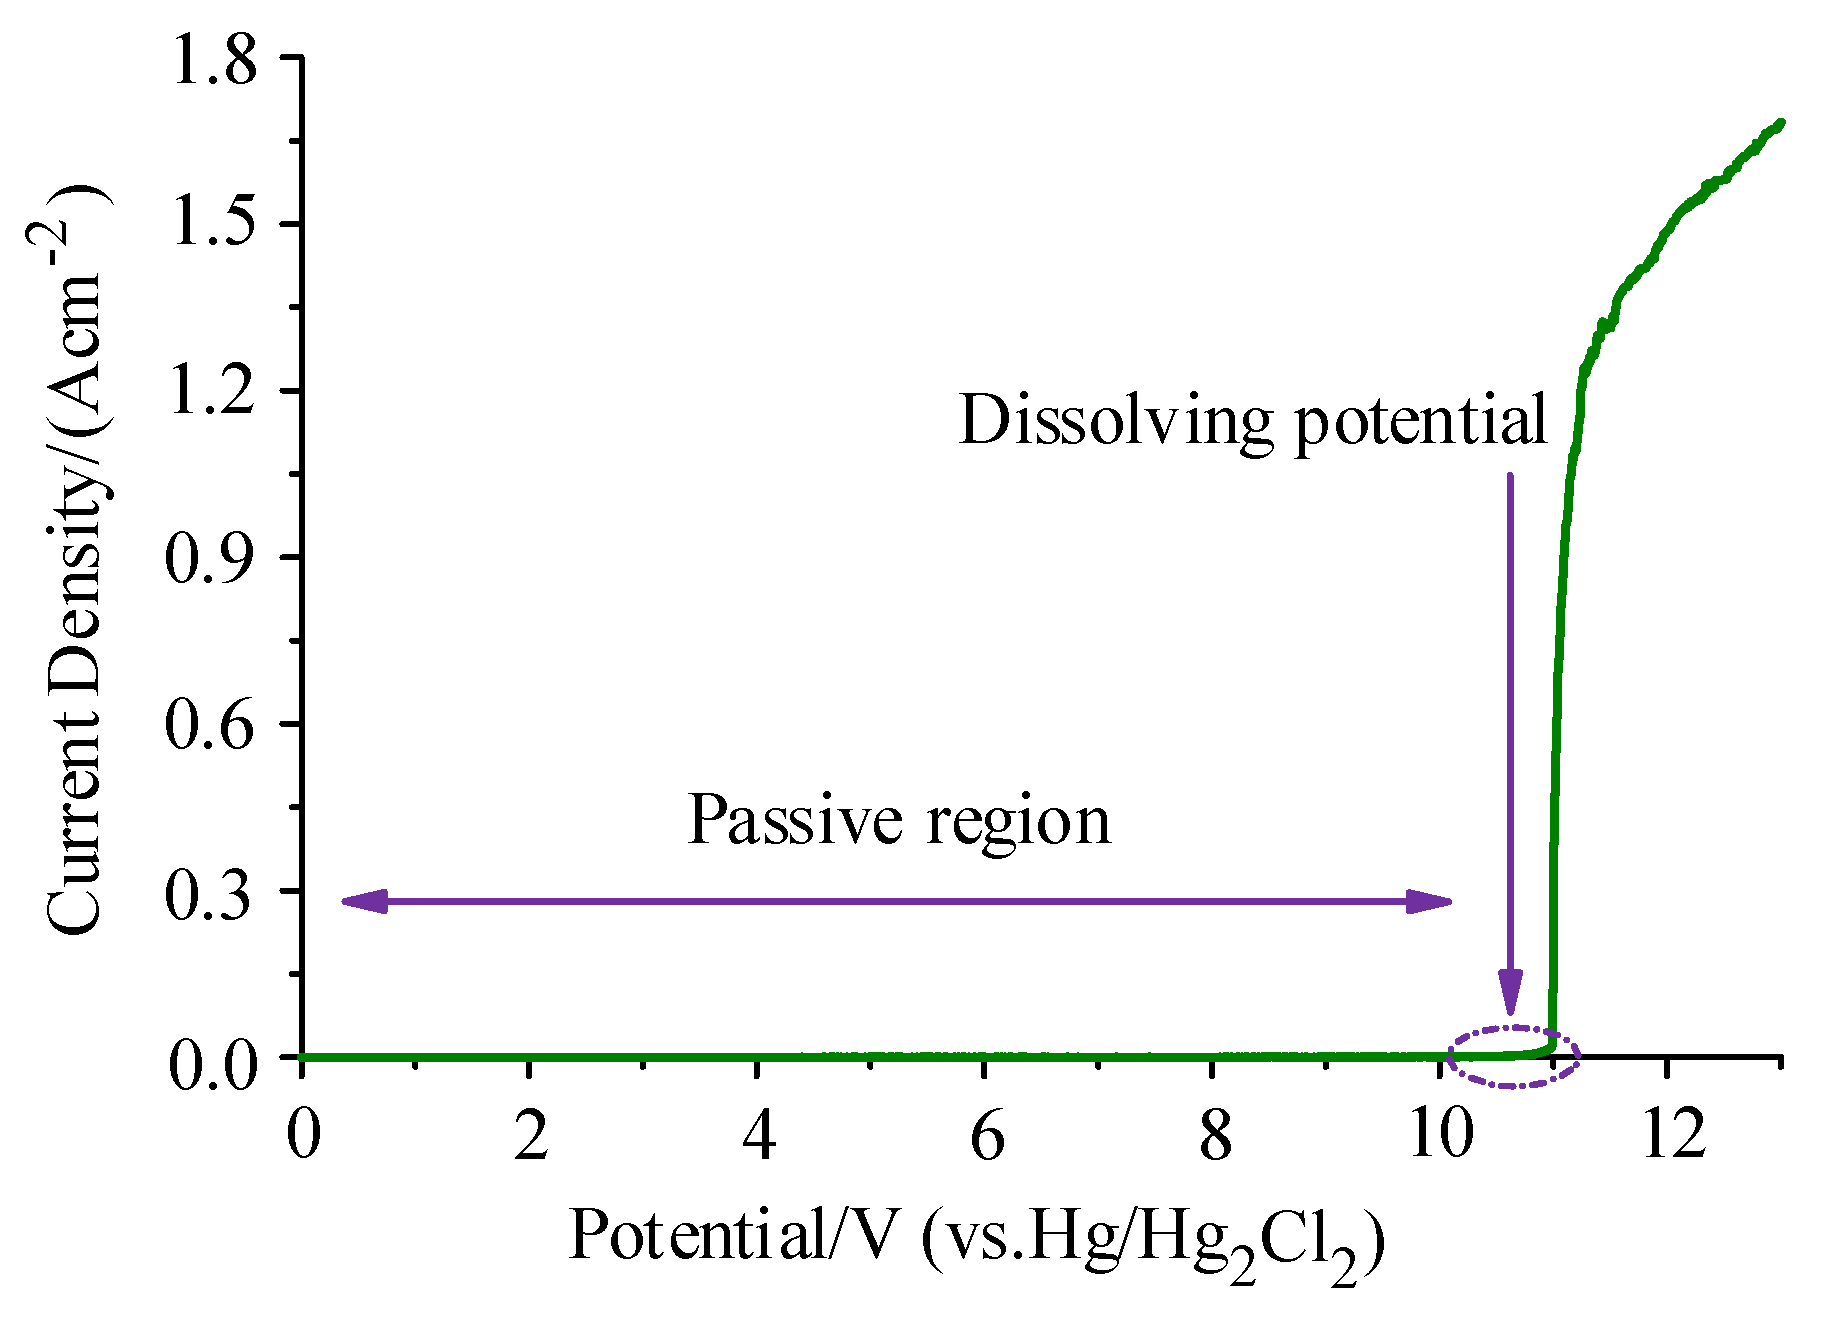
According to the measurement results of the polarization curve, the dissolution potential of Ti6Al4V in a 10% NaNO3 solution at 30 °C was about 11 V. Thus, choosing a reasonable machining voltage can effectively improve the efficiency of rough machining and the accuracy of finish machining.
(3)
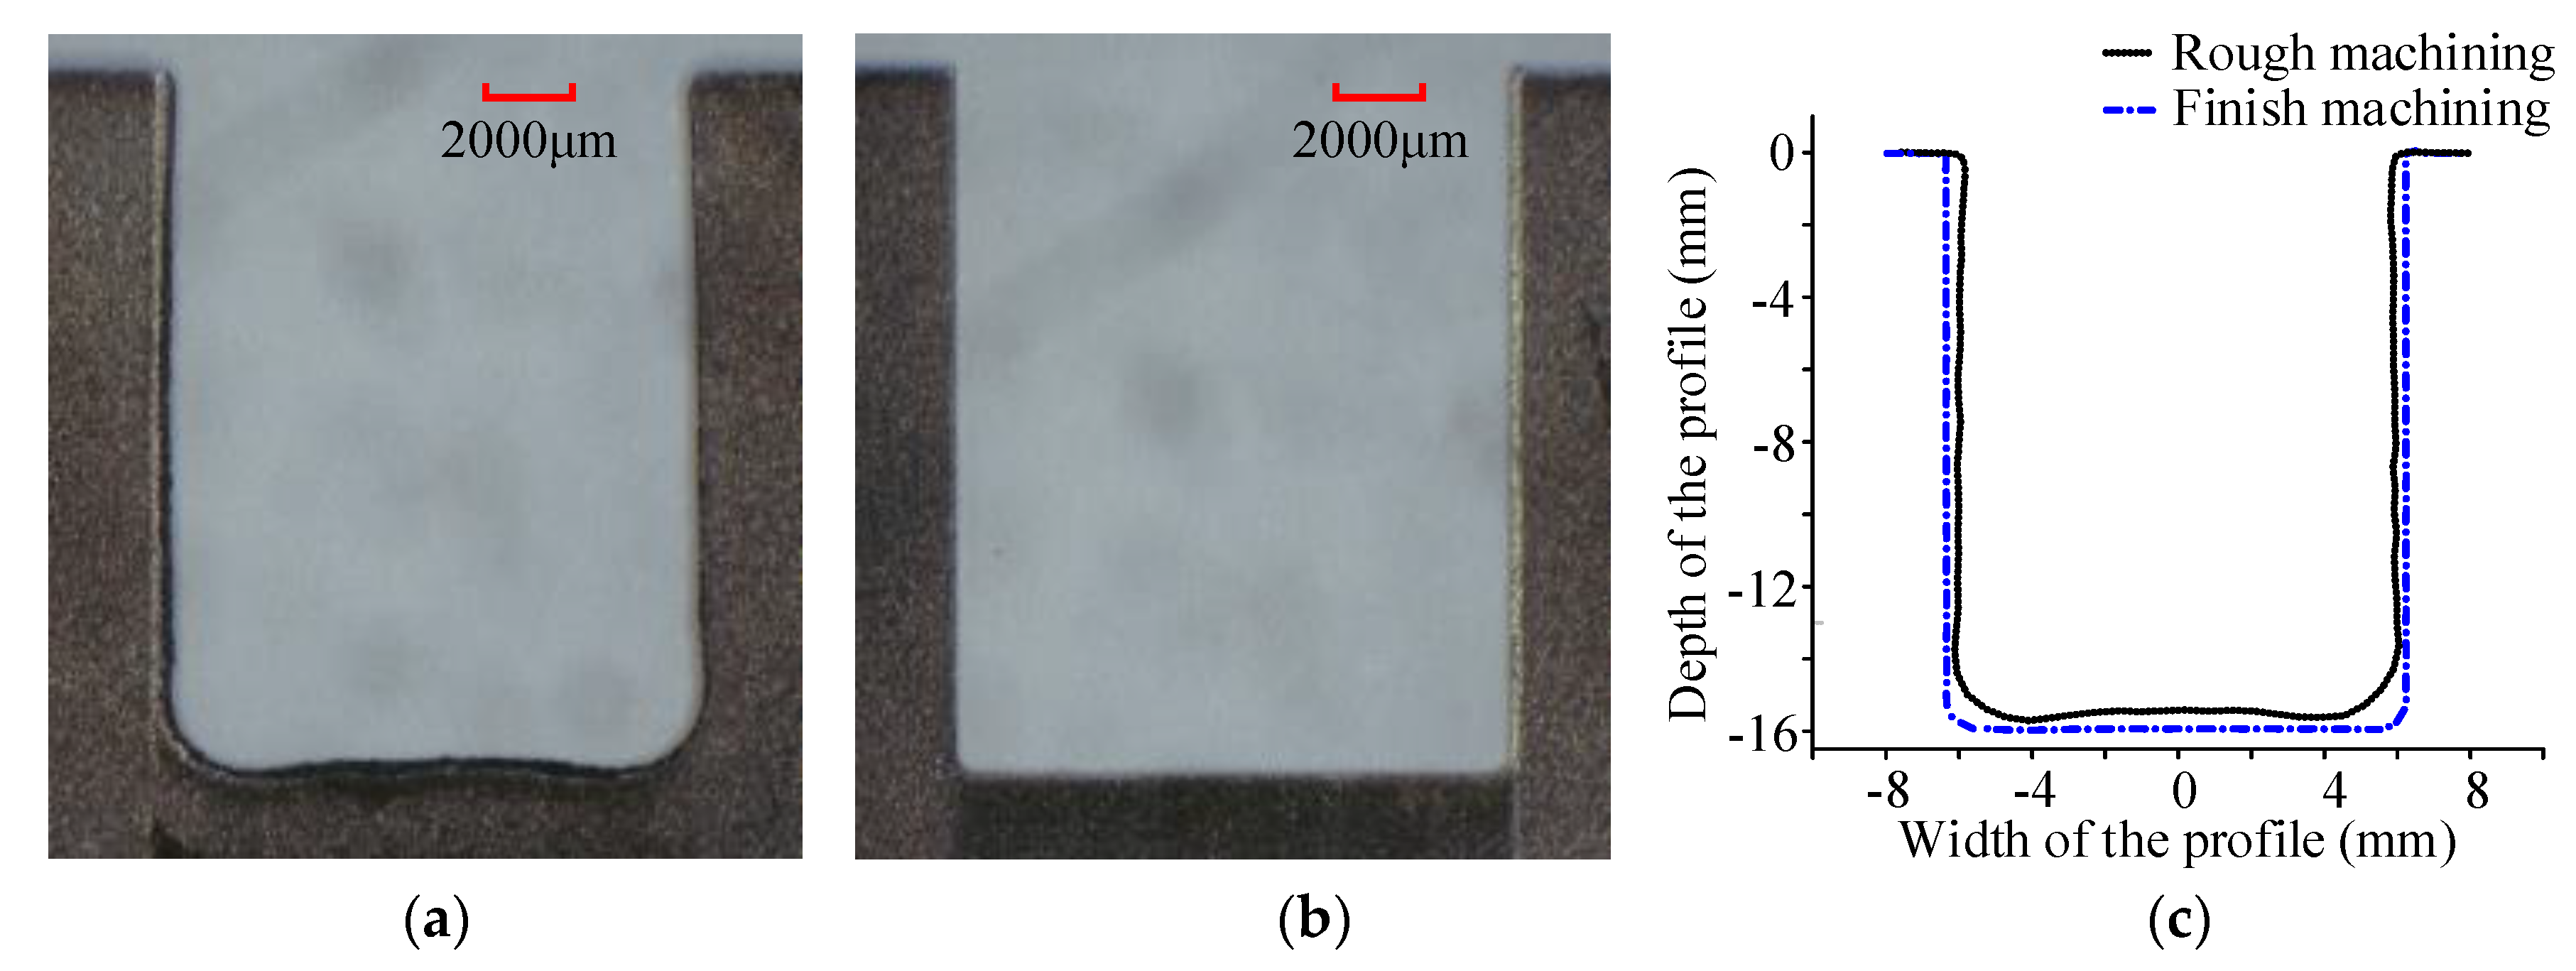
The cathode tool with a cutting depth of 15 mm and a spiral electrolyte outlet slit could realize the ECMG rough machining of the Ti6Al4V titanium alloy. In addition, the flatness of the rough-processed sidewall obtained by using the proposed cathode tool was good, the processed surface had no flow marks, and the rough machining accounted for 92.37% of total removal, which realized the efficient processing of difficult-to-machine materials.
(4)
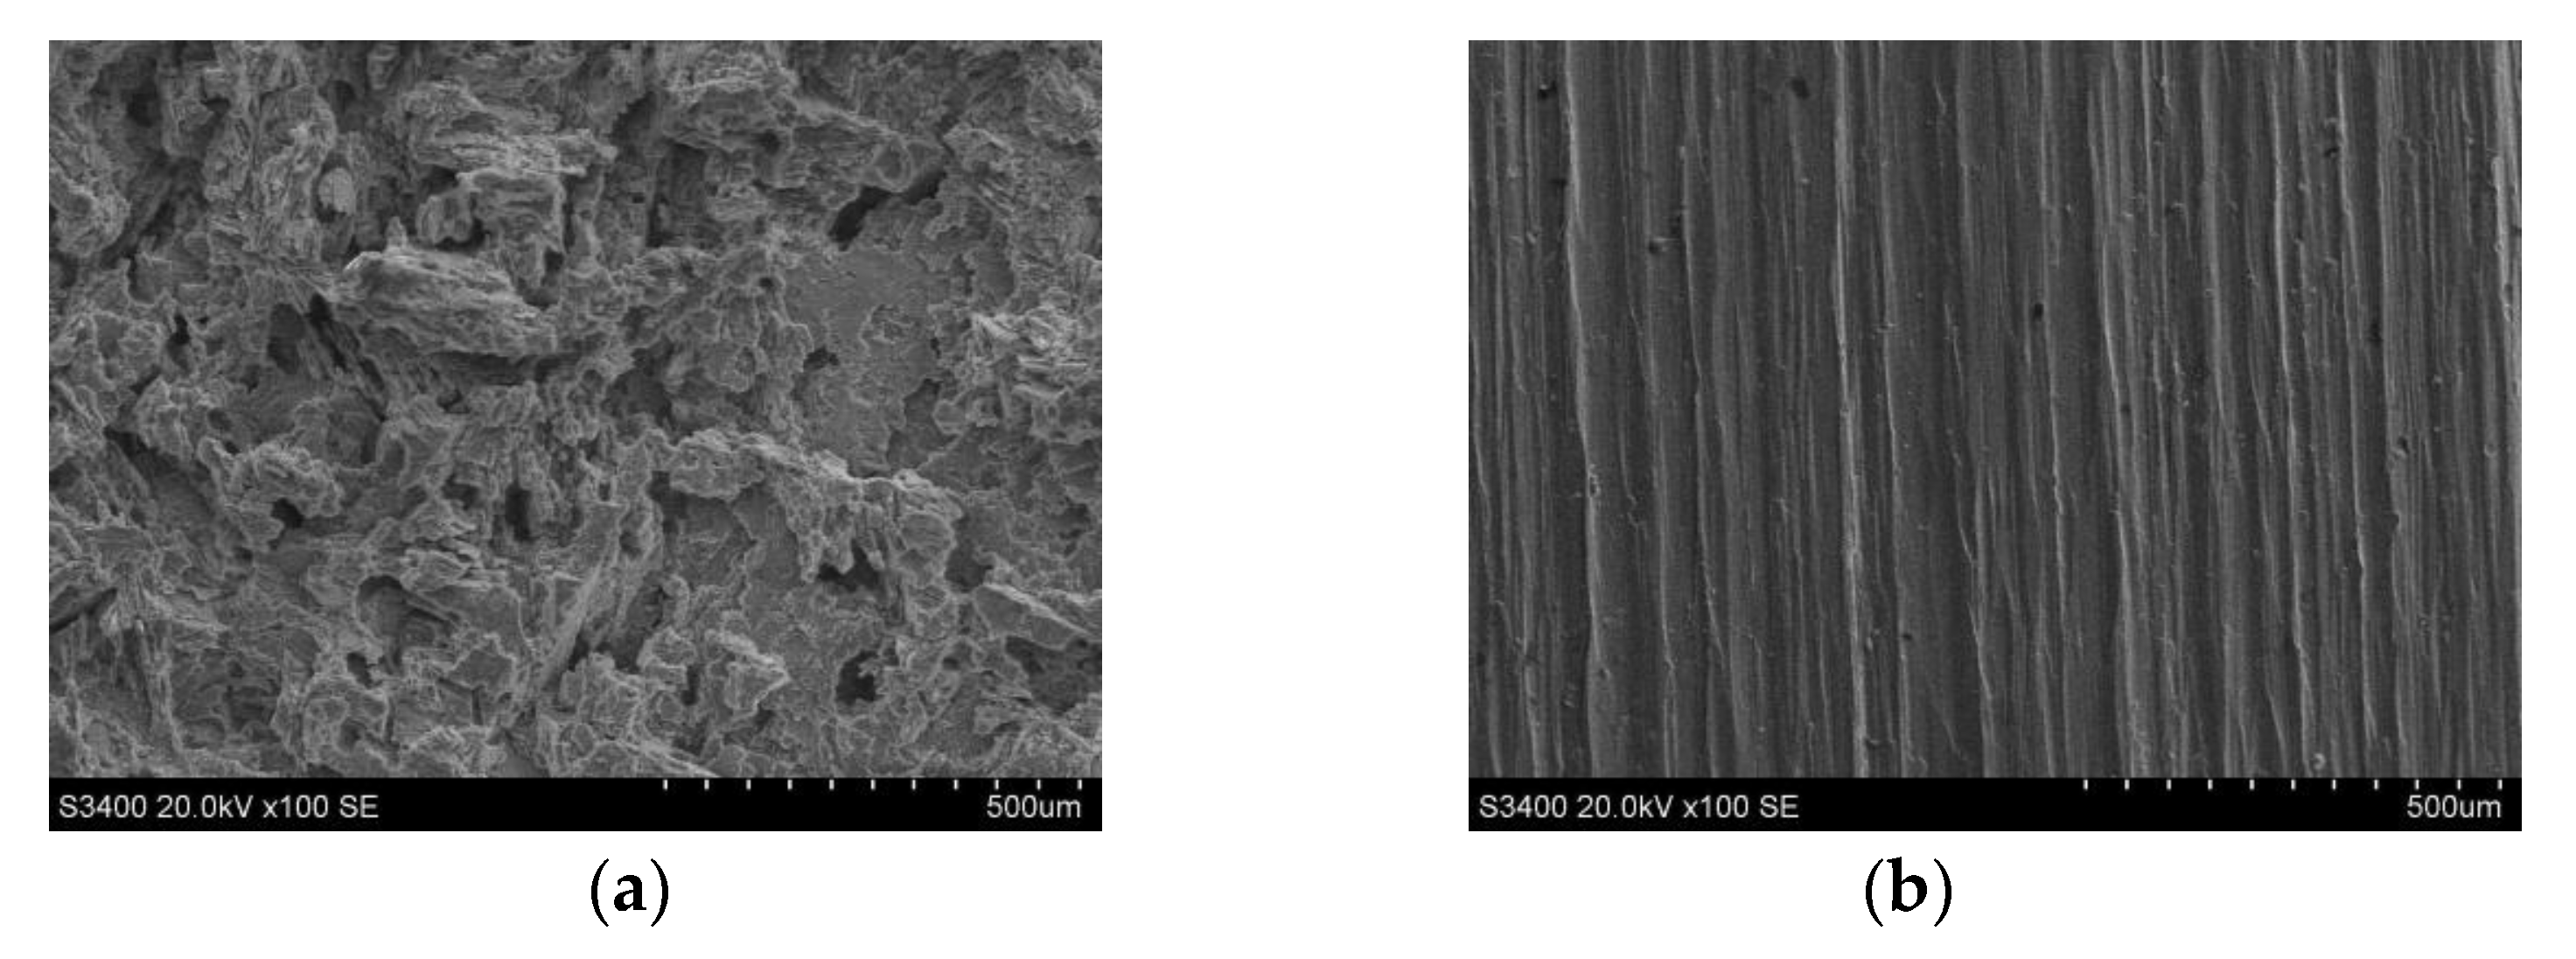
Under different processing parameters, the surface roughness of the titanium alloys varied greatly. At high voltage, a high amount of stray corrosion exhibited on the surface of the titanium alloy. At low voltage, the surface of the titanium alloy was not affected by stray corrosion. After finish machining, the surface roughness Ra was decreased from 5.182 μm to 0.760 μm.
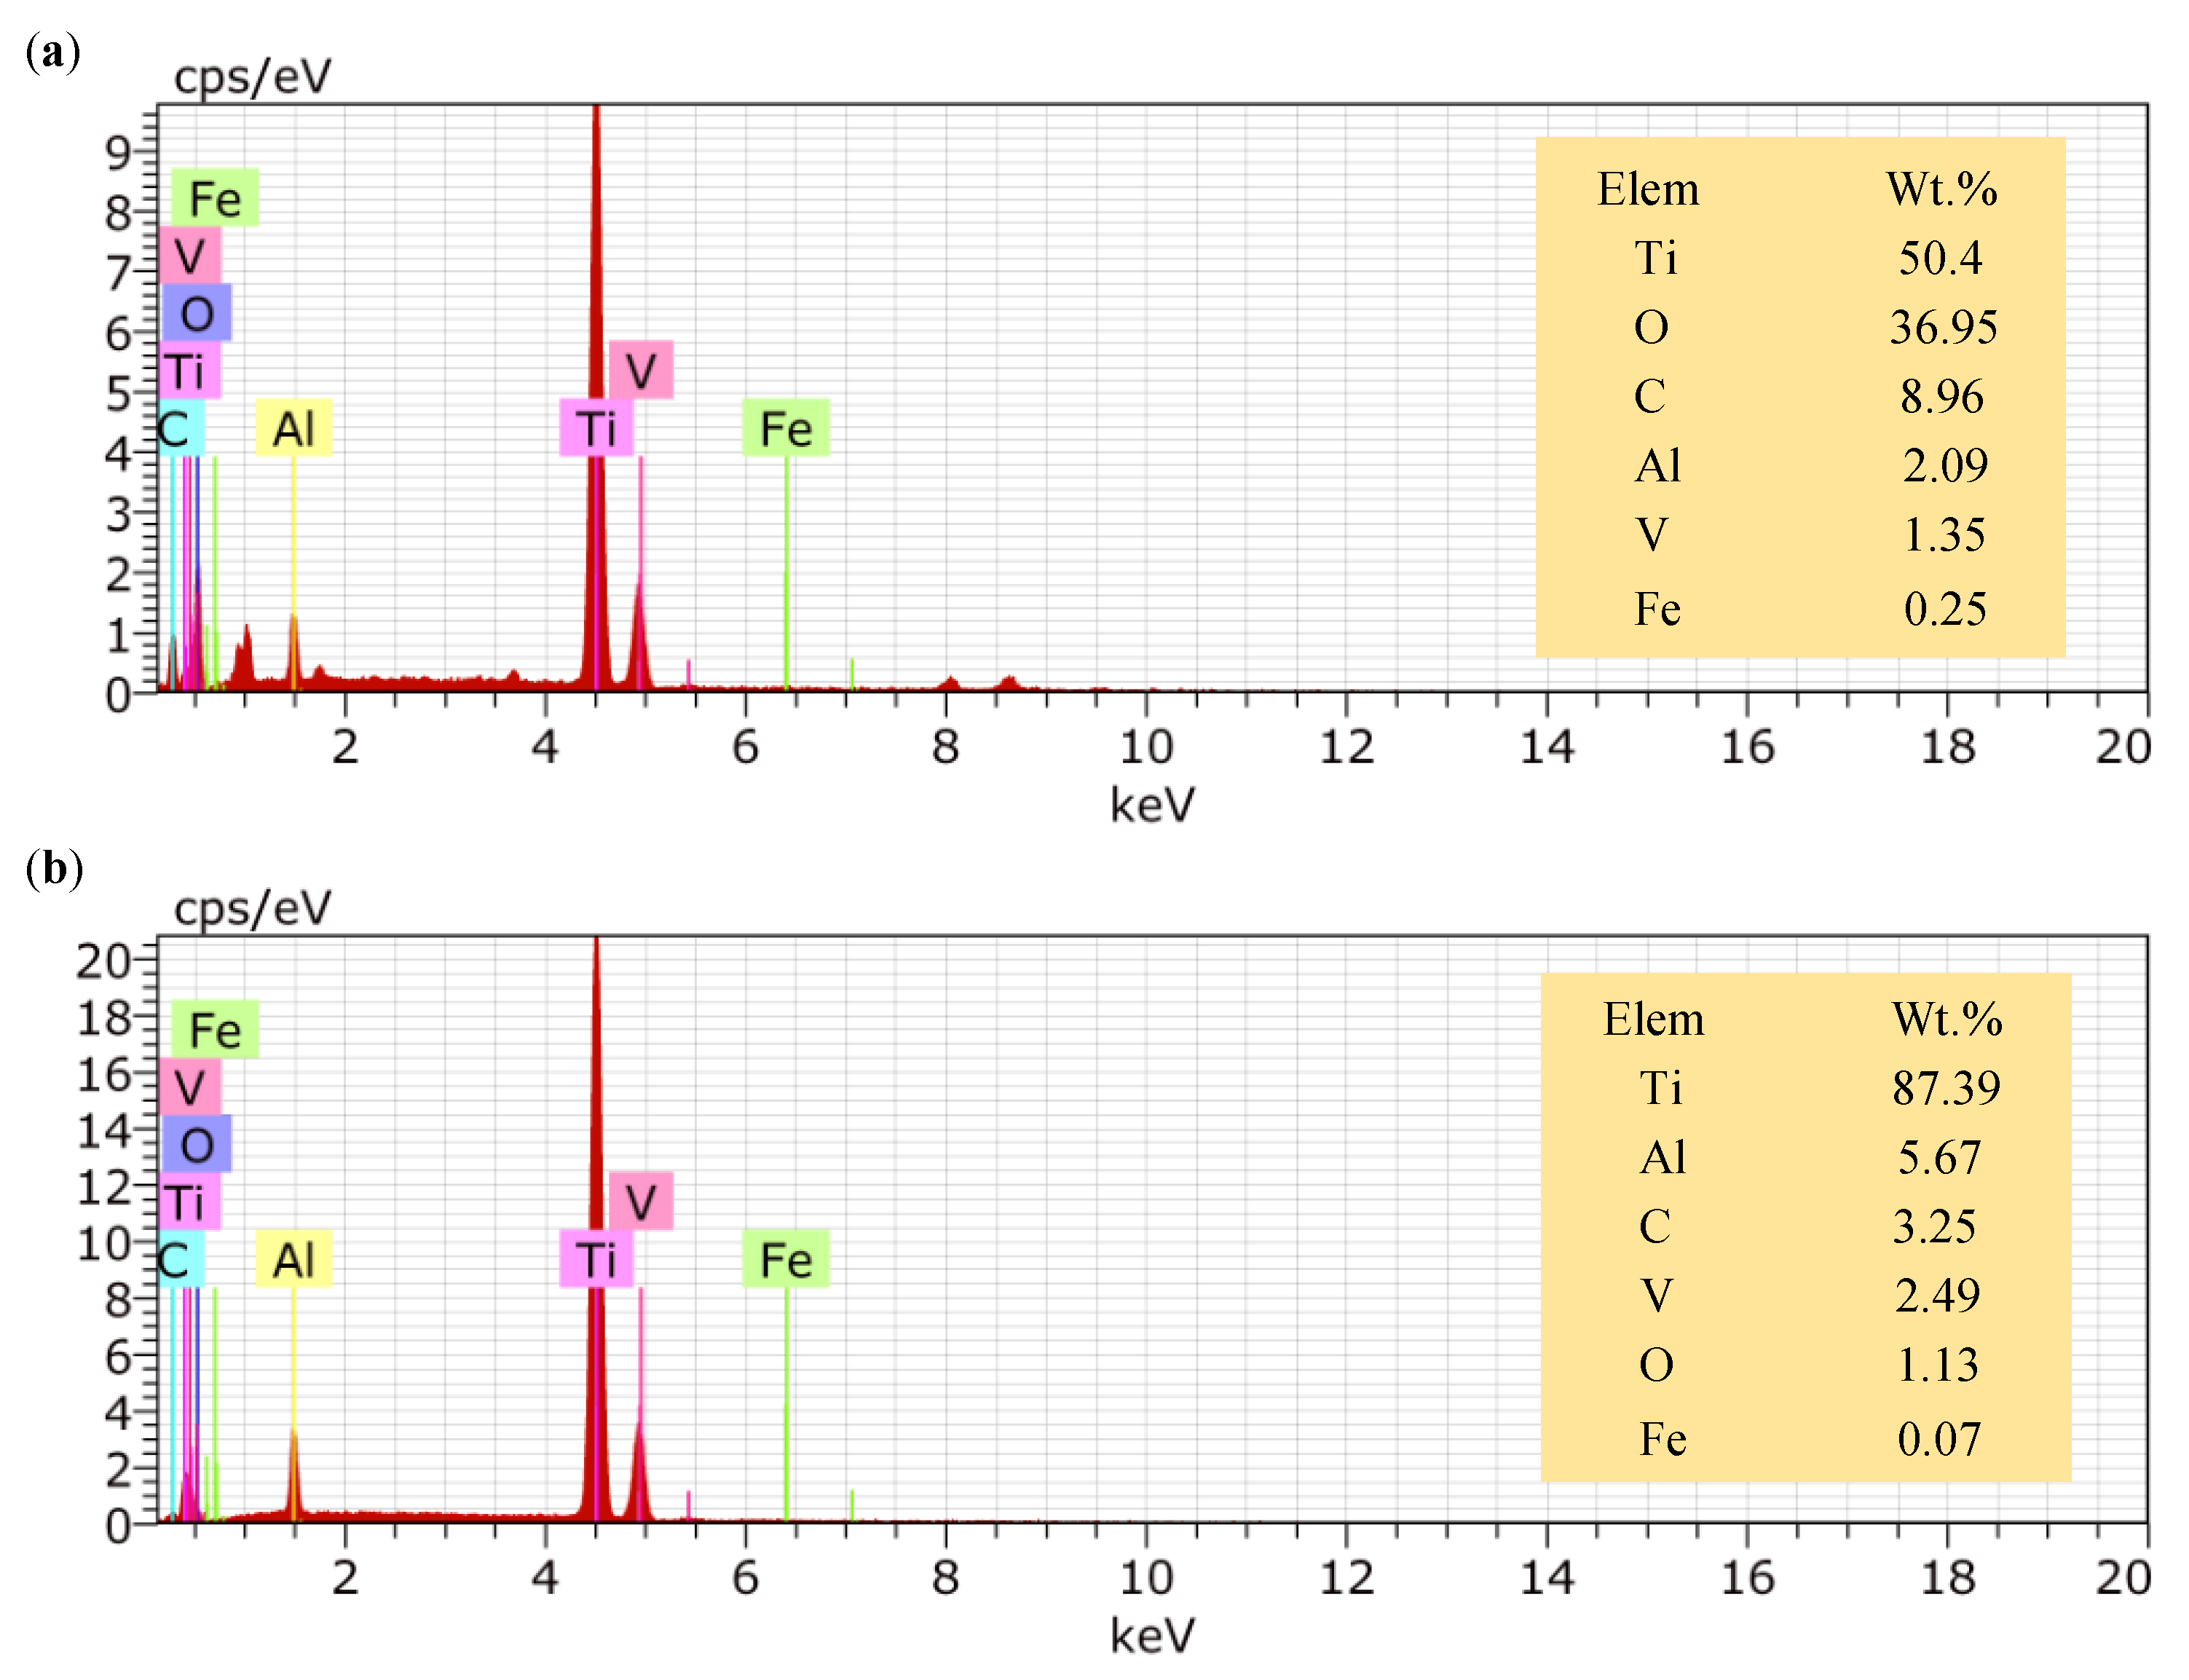
(5)
The insoluble electrolytic products formed in rough machining were effectively eliminated by finish machining. The oxygen content decreased from 36.95 wt% to 1.13 wt%, and the carbon content decreased from 8.96 wt% to 3.25 wt%.

Author Contributions

Formal analysis, J.L.; Investigation, J.L.; Project administration, J.L.; Writing—original draft, J.L.; Writing—review & editing, H.L., X.H., S.N. and G.X. All authors have read and agreed to the published version of the manuscript.

Funding

This work was supported by the National Natural Science Foundation of China (Grant No. 51875286) and the Postgraduate Research & Practice Innovation Program of Jiangsu Province (Grant No. SJCX19_0012).

Conflicts of Interest

The authors declare no conflict of interest.

References

  1. Ponce, M.B.; Vazquez-Martinez, J.M.; Davim, J.P.; Gomez, J.S. Analysis of secondary adhesion wear mechanism on hard machining of titanium aerospace alloy. Materials 2019, 12, 2015. [Google Scholar] [CrossRef] [Green Version]
  2. Babu, J.; Dutta, A. Low temperature superplasticity through grain refinement in Ti-6Al-4V by a novel route ofquench-roll-recrystallise. J. Mater. Res. Technol. 2015, 4, 348–352. [Google Scholar] [CrossRef] [Green Version]
  3. Singh, P.; Pungotra, H.; Kalsi, N.S. On the characteristics of titanium alloys for the aircraftapplications. Mater. Today: Proc. 2017, 4, 8971–8982. [Google Scholar]
  4. Baila, D.I.; Tonoiu, S. Hydrides precipitation in Ti6Al4V titanium alloy used for airframemanufacturing. Bull. Pol. Acad. Sci. Tech. 2019, 67, 643–649. [Google Scholar]
  5. Cotton, J.D.; Briggs, R.D.; Boyer, R.R.; Tamirisakandala, S.; Russo, P.; Shchetnikov, N.; Fanning, J.C. State of the art in beta titanium alloys for airframe applications. JOM 2015, 67, 1281–1303. [Google Scholar] [CrossRef] [Green Version]
  6. Zoya, Z.A.; Krishnamurthy, R. The performance of CBN tools in the machining of titanium alloys. J. Mater. Process. Technol. 2000, 100, 80–86. [Google Scholar] [CrossRef]
  7. Fox-Rabinovich, G.S.; Kovalev, A.I.; Aguirre, M.H.; Beake, B.D.; Yamamoto, K.; Veldhuis, S.C.; Endrino, J.L.; Wainstein, D.L.; Rashkovskiy, A.Y. Design and performance of AlTiN and TiAlCrN PVD coatings for machining of hard to cut materials. Surf. Coati. Technol. 2009, 204, 489–496. [Google Scholar] [CrossRef]
  8. Wang, T.; Zha, J.; Jia, Q.; Chen, Y.L. Application of low-melting alloy in the fixture for machining aeronauticalthin-walled component. Int. J. Adv. Manuf. Tech. 2016, 87, 2797–2807. [Google Scholar] [CrossRef]
  9. Lunarska, E.; Zaborski, S. Hydrogen effects in anodic grinding of Ti alloy. Wear 2001, 249, 606–616. [Google Scholar] [CrossRef]
  10. Liu, G.Y.; Guo, Z.N.; Li, Y.B.; Huang, Z.G. An Investigation on PRMMC Polishing with Electrochemical Mechanical Machining Process. Adv. Mater. Res. 2010, 135, 226–231. [Google Scholar] [CrossRef]
  11. Van Camp, D.; Qian, J.; Vleugels, J.; Lauwers, B. Experimental investigation of the process behaviour in Mechano-Electrochemical Milling. CIRP Ann. 2018, 67, 217–220. [Google Scholar] [CrossRef]
  12. Kozak, J.; Oczos, K.E. Selected problems of abrasive hybrid machining. J. Mater. Process.. Technol. 2001, 109, 360–366. [Google Scholar] [CrossRef]
  13. Zaborski, S.; Lupak, M.; Poros, D. Wear of cathode in abrasive electrochemical grinding of hardly machined materials. J. of Mater. Process. Technol. 2004, 149, 414–418. [Google Scholar] [CrossRef]
  14. Lupak, M.; Zaborski, S. Simulation of energy consumption in electrochemical grinding of hard-to-machine materials. J. Appl. Electrochem 2009, 39, 101–106. [Google Scholar] [CrossRef]
  15. Lyubimov, V.V.; Yerokhin, A.L.; Tchmir, M.Y. Mechanisms of synthetic diamond wear in tools forelectrochemical grinding. Diamond Relat. Materials 1998, 7, 1267–1271. [Google Scholar]
  16. Goswami, R.N.; Mitra, S.; Sarkar, S. Experimental investigation on electrochemical grinding (ECG) of alumina-aluminum interpenetrating phase composite. Int. J. Adv. Manuf. Tech. 2009, 40, 729–741. [Google Scholar] [CrossRef]
  17. Qu, N.S.; Zhang, Q.L.; Fang, X.L.; Ye, E.K.; Zhu, D. Experimental investigation on electro-chemical grinding of Inconel 718. Procedia CIRP 2015, 35, 16–19. [Google Scholar] [CrossRef] [Green Version]
  18. Li, H.S.; Fu, S.X.; Zhang, Q.L.; Niu, S.; Qu, N.S. Investigation of material removal in inner-jet electrochemical grinding of GH4169 alloy. Sci. Rep. 2017, 7, 608–616. [Google Scholar] [CrossRef] [Green Version]
  19. Niu, S.; Qu, N.S.; Yue, X.K. Effect of tool-sidewall outlet hole design on machining performancein electrochemical mill-grinding of Inconel 718. J. Manuf. Process. 2019, 41, 10–22. [Google Scholar] [CrossRef]
  20. Yue, X.K.; Qu, N.S.; Niu, S.; Li, H.S. Improving the machined bottom surface in electrochemical mill-grinding by adjusting the electrolyte flow field. J. Mater. Process. Technol. 2020, 276, 116413. [Google Scholar] [CrossRef]
  21. Li, H.S.; Fu, S.X.; Niu, S.; Qu, N.S. Simulation and experimental investigation of electrochemical mill-grinding of GH4169 alloy. Int. J. Electrochem. Sci. 2018, 13, 6608–6625. [Google Scholar] [CrossRef]
  22. Ge, Y.C.; Zhu, Z.W.; Ma, Z.; Wang, D.Y. Tool design and experimental study on electrochemical turning of nickel-based cast superalloy. J. Electrochem. Soci. 2018, 165, 162–170. [Google Scholar] [CrossRef]
  23. Riggs, J.B.; Muller, R.H.; Tobias, C.W. Prediction of work piece geometry in electrochemical cavity sinking. Electrochim. Acta 1981, 26, 961–969. [Google Scholar] [CrossRef]
  24. Qian, N.; Ding, W.F.; Zhu, Y.J. Comparative investigation on grindability of K4125 and Inconel718 nickel-based superalloys. Int. J. Adv. Manuf. Tech. 2018, 97, 1649–1661. [Google Scholar] [CrossRef]
Figure 1. Schematic diagram of electrochemical mill-grinding (ECMG).
Applsci 10 01941 g001
Figure 2. Schematic diagram of (a) cathode tool electrolyte outlet slit layout (b) flow field simulation geometric model of tool A.
Applsci 10 01941 g002
Figure 3. Electrolyte velocity distribution in the side gap when using tool A at different angles: (a) 30°, (b) 60°, (c) 90°.
Applsci 10 01941 g003
Figure 4. Electrolyte velocity distribution in the side gap when using tool B at different angles: (a) 30°, (b) 60°, (c) 90°.
Applsci 10 01941 g004
Figure 5. ECMG of the cathode tool: (a) in rough machining, (b) in finish machining.
Applsci 10 01941 g005
Figure 6. Polarization curve of Ti6Al4V in 10% NaNO3.
Applsci 10 01941 g006
Figure 7. Schematic diagram of rough machining by ECMG.
Applsci 10 01941 g007
Figure 8. Finishing in the ECMG: (a) finishing of groove bottom, (b) finishing of groove sidewall.
Applsci 10 01941 g008
Figure 9. Cross-section profiles and measurement results of the grooves in the rough- and finish-machining processes using the cathode tool with spirally arranged outlet slits: (a) cross-section profile after rough machining, (b) cross-section profile after finish machining, (c) measurement results of the cross-section profiles after rough and finish machining.
Applsci 10 01941 g009
Figure 10. Micro-morphology and roughness of surface groove surface after: (a) rough machining, (b) finish machining.
Applsci 10 01941 g010
Figure 11. Surface morphology (left) and surface roughness (right) of the groove after (a) rough machining, and (b) finish machining.
Applsci 10 01941 g011
Figure 12. Energy spectrum analysis of groove surface after (a) rough machining, (b) finish machining.
Applsci 10 01941 g012
Table 1. Flow field simulation parameters.
ParameterValue
Inlet pressure (MPa)0.6
Outlet pressure (MPa)0
Side and bottom gap (mm)0.2
Rotational speed (rpm)1000
Step times (s)2.5 × 10⁻³
Total simulation times (s)6.25 × 10⁻²
Table 2. Processing parameters of rough-machining test.
Processing ParameterValue
Processing voltage (V)25
Electrolyte temperature (°C)30
Electrolyte pressure (MPa)0.6
Feed rate V (mm·min−1)1.2
Cutting depth (mm)15
Spindle speed (rpm)1000
Table 3. Process parameters of the finish-machining test.
Processing ParameterValue
Processing voltage (V)1
Electrolyte temperature (°C)30
Electrolyte pressure (Mpa)0.2
Feed rates Vl/Vv/Vt (mm·min−1)60/1/1
Cutting depth (mm)0.05
Spindle speed (rpm)1000

