Abstract
The scouring and deposition of sediment caused by unsteady flows (e.g., storm waves and floods) produces many secondary disasters. The resultant bed-load movement exhibits different transport laws compared with that by steady flow. In this study, the flume experiments were performed to study the bed-load movement under unsteady flow with different velocity skewness. The movement of uniform and non-uniform non-cohesive sediment under unsteady flow as well as the influence of the steady and unsteady flow on sediment transport rate are compared. Additionally, the non-uniform sediment transport formula of fine-to-coarse particle diameter ratio was investigated. The results showed that the sediment transport rate between uniform and non-uniform sand under the same median diameter is different. The non-uniform sediment transport rate is 1.27-, 3.19-, and 0.68-times as large as that in uniform sediment under d50 = 0.664, 1.333, and 2.639 mm under unsteady flow, respectively. For non-uniform sand, the transport rate of non-uniform sand with a larger adjacent particle size ratio (δ = 0.29) was 1.31-times greater than that of the non-uniform sand with a smaller adjacent particle size ratio (δ = 0.50). Moreover, theoretical deduction was carried out and the incipient sediment motion was analyzed from the force mechanism. A new unsteadiness parameter based on the acceleration concept was proposed. The relationship between the travel distance and velocity skewness of sediment particles was set up. The experimental results and theoretical analysis showed that sediment under unsteady flow were easier to start and transport than those under steady flow in the same flow effect. The travel distance of sediment particles was longer under unsteady flow than that under steady flow.
1. Introduction
The unsteady flow caused by storm waves and other disasters in nature often causes severe sediment movement and significant morphological changes, which exhibit extremely harmful effect to human activities and buildings [1,2]. These strong flows cause significant erosion and deposition in affected coastal areas, and results in severe economic losses [3]. The unsteady flow is characterized as a process of acceleration or deceleration and a strong unsteadiness effects on sediment particles during a short time [4,5,6,7], which affects the threshold motion of sediment and bed-load transport. Besides, sediment transported in natural coastal zone and rivers is usually heterogeneous in particle sizes. A further consequence of mixed grain sizes shows that sediment transport rate is controlled not only by water hydraulics but also by the interaction between different sized particles within transported sediment and bed materials [8]. Recent experimental studies provide some insight for better understanding mechanisms involved in sediment transport under different flow conditions.
The uniform and non-uniform sediment transports under steady flow condition have been extensively studied [9,10,11,12]. Besides, some numerical simulations were carried out under unsteady flow condition [13,14,15,16]. The above studies were mostly focused on uniform sediment under steady flow conditions. The force acting on the sediment particle was more complicated under unsteady flow compared to steady flow [17]. In addition to the conventional forces such as drag force, the particles are also usually suffered to some additional forces caused by the sharp change of flow velocity. The representative one of those forces is defined as inertia force that is non-negligible, which could characterize additional loading on the particles under unsteady flow, and that will disappear in the steady flow [18].
Meanwhile, the unsteadiness of flow has significant effects on the structure of flow field and the sediment movement since unsteadiness enhances sediment transport [19]. Some researchers introduced unsteady parameters to characterize the unsteadiness effect on flow structure and sediment transport, and then the relationship between uniform sediment transport intensity and unsteady flow parameters has been established [20,21]. The transport rate was closely related to the unsteady parameters of the water flow [22]. Phillips et al. [23] calculated the changes in shear stress during the flood process and measured the sediment transport rate for a range of hydrograph durations and shapes. It was considered that the total sediment transport capacity was slightly affected by the transient stress of the unsteady flow which had been also found in natural rivers [24,25]. Mrokowska and co-workers stated that the initial bed conditions and unsteadiness of flow had significant effects on bed-load transport intensity and total sediment yield [26]. The unsteadiness of flow exhibits influence on bed-load transport rate through variable bed shear stress and stream power.
Turbulence condition plays an essential role in the entrainment of sediment. Under turbulent flow condition, Diplas et al. [27] and Valyrakis et al. [28] found that in addition to the magnitude of the instantaneous turbulent forces applied on a sediment grain, the duration of these turbulent forces was also important in determining the sediment grain’s threshold of motion via entrainment experiments. Although many studies have been carried out on sediment movement under unsteady flow, most of these were based on general unsteady flow that originated from open channel flows. For the unsteady flow such as floods and storm waves with strong flow unsteadiness and high sediment transport intensity, whether these theories and formulas are valid needs further investigations.
Furthermore, none of the above considered the influence of sediment particle size. The mutual interference among different components in particle size makes the calculation of bed-load initiation and transport rates more complicated [29,30]. Generally, when dealing with the bed-load transport rate of non-uniform sediment, a kind of bed-load representative of particle sizes was proposed, and then the total bed-load transport rate of non-uniform sediment was calculated by using the transport formula of uniform sediment [31]. Otherwise, the non-uniform sediment particle size is grouped and the fractional sediment transport rate is calculated by using the formula of uniform sediment [32]. Almedeij et al. [33] proposed a method to calculate the bed-load transport rates of two bimodal components by using two independent fractions of fine and coarse sand. The results indicated that the proportion of non-uniform sand components had a great impact on sediment transport rate. As for the insufficient effect of existing relationships on bimodal sediments, Patel et al. [34] developed a new relationship for fractional bed-load transport considering the critical shear stress of non-uniform unimodal and bimodal sediments. Elhakeem et al. [35] developed a bed-load transport model for the prediction of the transport rate of non-uniform sediment that considered the density function of sediment entrainment with no active layer.
Due to the non-uniformity of bed-load sediment particles, the distribution of sediment transport was affected by the interaction among particles, such as hiding and exposure effects [12,36]. Wu et al. [21] proposed formulas with a correction factor to explain the hiding and exposure mechanisms of non-uniform sediment transport. The formulas were used to calculate the fractional transport rates of non-uniform bed load and suspended load. The results obtained based on steady flow are not enough to explain the principles of non-uniform sediment transport under unsteady flow. The initiation and transport movement of non-uniform and non-cohesive sediment under unsteady flow is more complicated. The mechanisms of initiation and transport have not been explained clearly, and further research is still needed. There are few studies focusing on the non-uniform sand transport under unsteady flow due to its complexity, but it is important in improving the theory of sediment movement and guiding sand beach regulation projects.
Therefore, a physical modeling non-uniform and non-cohesive sediment motion under unsteady flow condition was conducted by referring to the basis of uniform sediment movement under unsteady condition. The objective of this paper is to investigate the influence of unsteady flow on sediment incipient motion and transport, and compare bed-load transport rates with varying flow and sediment conditions. A new unsteadiness parameter based on the acceleration concept was proposed to examine the effect of unsteadiness on the mechanism of sediment transport under unsteady flow conditions. A suitable parameter to represent horizontal inertial force in the theoretical model is selected to evaluate effects of different velocity skewness on bed-load movement. This study tests the theoretical model against experimental data obtained under unsteady flow to see whether there is a good fit. Additionally, the relationship between the travel distance and velocity skewness of sediment particles is built to show a change in the trend.
2. Laboratory Experiments
2.1. Experimental Setup
The experiments were carried out in the flume at Changsha University of Science and Technology, P. R. China, which was 40.0 m in length, 0.8 m in depth, and 0.5 m in width (See Figure 1). Both sides of the flume were composed of tempered glass for ease of observation. The experimental area was located in the middle of the flume, and the transition section was 0.5 m long, which was paved with uniform gravel. The gravels would not be initiated under the investigated experimental flow rate, thus avoiding large turbulence caused by the transition from the fixed bed to moving bed. The experimental area was 0.5 × 0.353 × 0.1 m (length × width × depth) for the purpose of sufficient sediment source. A sediment collection box was placed in the sediment transport section, which was 0.5 m in length and 0.36 m in width. The height is slightly lower than that of the sediment laying surface. to ensure the transported sediment can be completely deposited in the collection box. The sediment in the sandbox was then collected, dried and weighed to obtain the amount and rate of sediment transport under unsteady flow. The water depth of the all the experiments are maintained at 0.25 m.
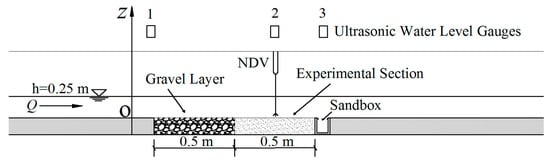
Figure 1.
Experimental setup.
2.2. Instrumentations
The velocities are collected by a high-resolution acoustic velocimeter—Nortek Acoustic Doppler Velocimeters (NDV) (Range: ±0.01–±4 m/s, Accuracy: ±0.5% of measured value ±1 mm/s,), which was placed in the middle of the experimental section at 2 mm high from the bed to measure the instantaneous point velocity of the near-bottom flow. Data collection frequency was set to 100 Hz. water level gauge probes (denoted as “1”,“2”, and “3”) were placed in front of the gravel layer above the test section and above the sandbox respectively. These are for the measurement of the water surface changes during the process and the surface elevations were sampled at 20 Hz.
2.3. Experimental Procedures
In order to characterize accurately the properties of unsteady flow and compare the influence of different velocity skewness on the mass transfer, we define the velocity skew characteristic value as:
where a is the unsteady flow velocity skewness characteristic value, Ub is the base flow velocity, Up is the peak flow velocity, t0 is the unsteady flow start time, and t is the end time of the process.
The Q–t curve was used to generate the unsteady flow. The flow increased from 90 m3/h to 260 m3/h, followed by the decrease to 90 m3/h, and the time interval Δt between flows was changed to produce different unsteady flow patterns. The ensemble mean of the flow velocity ub was obtained by the “rlowess” smoothing algorithm based on linear fitting in Matlab, which belongs to the instantaneous and the mean point velocity at z = 2 mm above the bed, as shown in Figure 2a under a = 1.08 × 10⁻³ m/s2. The method was used to generate five different periods of Q–t curves, as illustrated in Figure 2b. Five different skewed unsteady flows were generated, and the water level changes have been accompanied by this process.
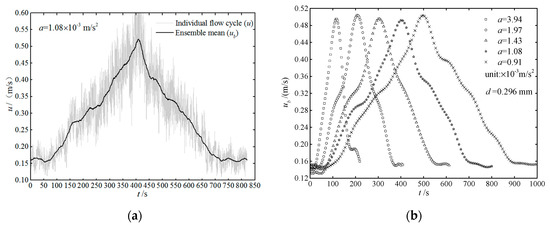
Figure 2.
Unsteady flow rate curve under d = 0.296 mm (a is the velocity skewness, d is the particle diameter). (a) Ensemble mean of the flow velocity and (b) Variation of flow velocity in different (continuous lines).
Five kinds of non-cohesive uniform sand were used in the experiment, and the particle diameters d were 0.296 mm, 0.664, 1.333, 2.639, and 3.741 mm, respectively. The non-uniform sand was obtained according to the equal mass ratio, such as φ0.296:φ0.664:φ1.333=1:1:1, φ0.664:φ1.333:φ2.639 = 1:1:1, φ1.333:φ2.63:φ3.741 = 1:1:1, and φ0.296:φ1.33:φ3.741 = 1:1:1 Table 1. Four non-cohesive non-uniform sands A, B, C, and D, corresponding to the median diameter d50 of 0.664, 1.333, 2.639, and 1.333 mm, respectively. The φd represents the mass of particle diameter d.

Table 1.
The sediment composition.
The smoothed unsteady flow hydrographs and equivalent steady flow conditions will be considered in this study. It should be noted that a steady flow process has the same total water volume as an unsteady flow hydrograph, which is referred to as the equivalent steady flow [37,38]. The method is that the ub~t curve of the unsteady flow is converted into the steady flow ub~t curve by the equivalent area integration, namely , as shown in Figure 3. The corresponding sediment transport rate was measured. Otherwise, different steady flows were generated in the flume, which will make same sediment transport rate as the unsteady flow. A constant head pump was applied to re-circulate water in the flume. The control of flow was achieved with the discharge through changing of the pump rotational speed.
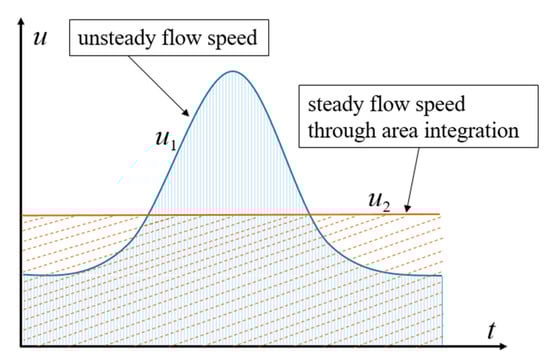
Figure 3.
Unsteady flow and steady flow through area integration of the unsteady flow.
Many researchers use unsteady parameters to describe the hydrodynamic characteristics of the unsteady flow in detail. The stronger the unsteadiness effects, the greater influence on the bed surface sediment movement [20,22]. According to the characteristics of the flow combined with the measured data of this experiment, the unsteady parameters are defined as:
where B is the width of the flume, ub is the flow velocity of the water flow, up is the peak flow velocity of the water flow, Tr is the duration of the unsteady flow rise period that is same with drop period, hb is the water depth of the base flow, and hp is the water depth at the peak flow time which is multiplied by a factor of 104 to increase the magnitude of W to facilitate the next comparative analysis.
Each experiment was repeated at least twice under the same condition to ensure pleasant repeatability of the sample sediment transport. Once the two sediment transport weight changes was obtained within 5%, the next set of experiments would be carried out. Otherwise, the experiment was performed again.
3. Bed-Load Sediment Transport under Uniform Sand Conditions
3.1. Effect of Velocity Skewness on Sediment Transport Rate
Figure 4 shows the variations of all the uniform sand transport rates gb with different velocity skewness a under unsteady flow conditions. It can be seen that for the same particle size, the sediment transport rate increased with the increase of velocity skewness except for the case of d = 0.664 mm. It was initially increased to 11.89 g/m/s, but then decreased after a = 1.18 × 10⁻³ m/s2 and ultimately followed by a surge to 13.61 g/m/s when a = 4.31 × 10⁻³ m/s2. Based on the experimental video, it was found that the bed surface changes and sand waves appeared at the velocity skewness a = 1.98 × 10⁻³ m/s2 (Δt = 20 s), and a = 1.53 × 10⁻³ m/s2 (Δt = 30 s). With the sand waves slowly moving forward in the limited time, the subsequent transport process was hindered. Thus, the sediment particles were not effectively transported into the sand collecting box under unsteady flow. The amount of sediment collected in these two cases was small, which caused a lower sediment transport rate. When the velocity skewness continued to go up (Δt = 10 s), the bed sand wave was fully developed and transferred to the sand collecting box throughout the flow cycle. In general, the sediment transport rate increased with the rise of the velocity skewness under uniform sand conditions.
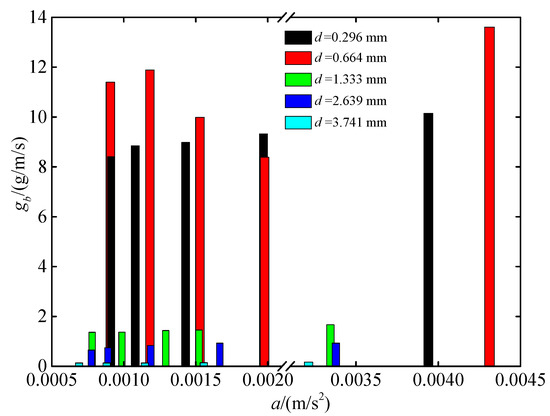
Figure 4.
Variation of sediment transport rate of five uniform sands with different velocity skewness under unsteady flow conditions.
3.2. Effect of Particle Size on Sediment Transport Rate
Figure 5 depicts the change of sediment transport rate of five uniform sands under five unsteady flow conditions. It can be seen that with the increase of sediment particle size d, the sediment transport rate gb firstly increased but then decreased. Around the particle size d = 0.664 mm, the sand rate basically reached a maximum under different velocity skewness, except the red bars (Δt = 20 s). It keeps declining from 9.32 to 0.14 g/m/s when Δt = 20 s.
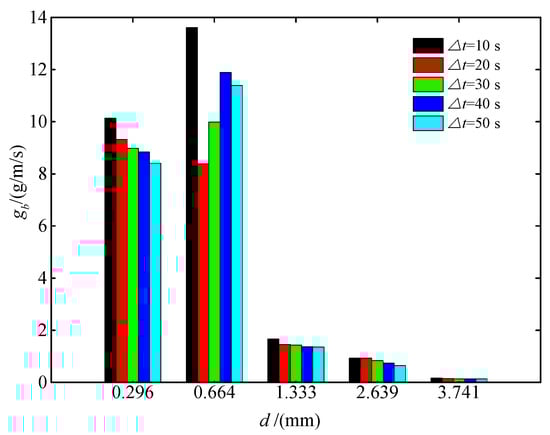
Figure 5.
Variation of sediment transport rate of five uniform sands with different sediment particle sizes under unsteady flow conditions.
3.3. Effect of Unsteady Flow Characteristics on Sediment Transport Rate
Figure 6 presents the variation of sediment transport rate with different velocity skewness under steady flow through area integration and unsteady flow conditions. The sediment transport rate under unsteady flow was significantly greater than those obtained by integrating the steady flow during the same time. In the cases of particle diameters d = 0.296 mm and d = 0.664 mm, the steady flow obtained by the integration reached the sediment incipient threshold, while in the case of d = 1.333, 2.639, and 3.741 mm, the steady flow velocity was not adequate to initiate sediment transport, and the sediment transport rate was zero. Therefore, the sediment transport result of the steady flow obtained by the area integration of the unsteady flow was not equivalent to that of the unsteady flow. The results indicated that the aforementioned two situations were not identical in terms of the sediment transport effect, and the unsteady flow characteristics of the flow had a great influence on the sediment transport.
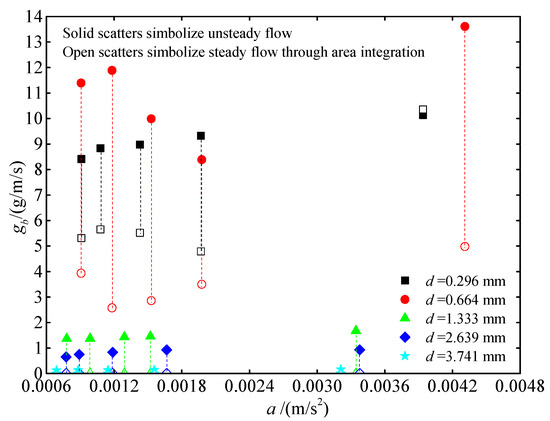
Figure 6.
Comparison between steady flow through integration and unsteady flow transport rate under five uniform sand conditions.
Figure 7 illustrates a comparison of the flow obtained by the unsteady flow at the same sediment transport rate and steady flow through integration. Herein, Δu denotes the difference between the steady flow velocity with the same sediment transport rate under unsteady flow condition and the steady flow velocity obtained by integrating the unsteady flow. It can be found that the flow rate of the steady flow was significantly greater than the steady flow rate obtained from the integration of the unsteady flow if we intend to get the same sediment transport rate. The unsteady flow had a larger impact on the sediment entrainment and souring on the riverbed.
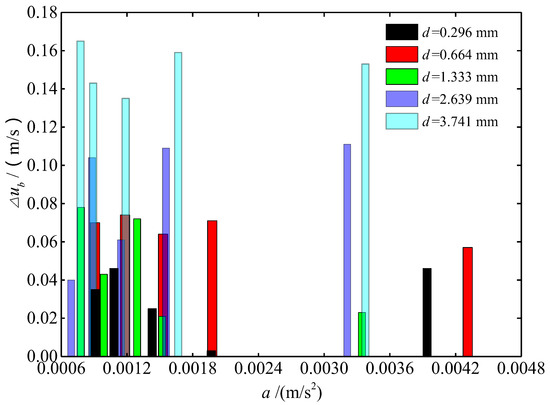
Figure 7.
Velocity comparison between steady flow corresponding to the same transport rate as the unsteady flow and steady flow through integration.
The sediment transport intensity is an effective factor to characterize the state of the bed-load movement. Combined with the experimental conditions, it is proposed to use the bed-load transport intensity dimensionless parameter to explore the relationship between the unsteadiness and sediment transport intensity [39,40,41].
Taking the size distribution of uniform sand bed with d = 0.296mm as an example, the relationship between the unsteady parameter W and the sediment transport intensity Φ1, Φ2, and Φ3 was plotted. Figure 8 depicts the intrinsic law of the influence of unsteady parameters on sediment transport intensity. It was indicated that the sediment transport intensity increased with the increase of unsteady parameters (dashed line). The unsteady parameter had an exponential relationship with the sediment transport intensity. The growth rate of sediment transport intensity declined with the increase of unsteady parameters. Therefore, the relationship between the sediment transport intensity and the unsteady parameter was not simply linear, it follows Φ ~ (aW2 + bW + c), where a, b, and c were constant.
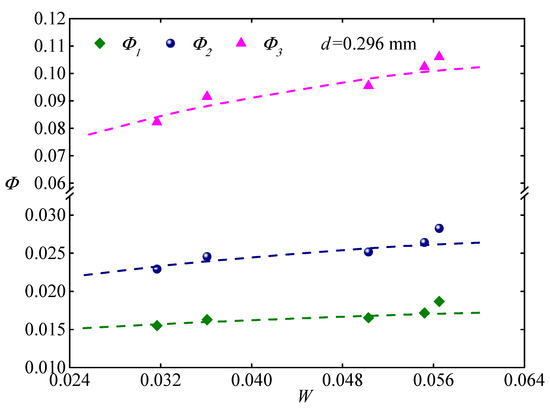
Figure 8.
Relationship between unsteady parameters and sediment transport intensity parameters.
4. Bed-Load Transport under Non-Uniform Sand Condition
4.1. Effect of Velocity Skewness on Sediment Transport Rate
Figure 9 shows the effect of velocity skewness on sediment transport rate under non-uniform sand conditions. It can be seen that the variation of different non-uniform sand ratios does not show a consistent change with the velocity skewness, which reflects the randomness of the non-uniform sand transport movement. There were intermittent and jumping properties of sediment particles in the process of transport, which made the travel distance of sediment particles and movement time become a nonlinear relationship, and the travel distance did not increase with time. At the same time, due to the unsteadiness effect of flow, the force of the sediment particles showed unsteadiness during the process of acceleration and deceleration.
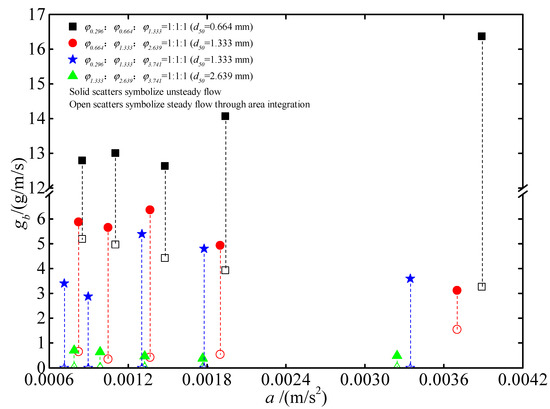
Figure 9.
Transport rate comparison between steady flow obtained through unsteady flow area integration and unsteady flow under four non-uniform sand conditions.
4.2. Effect of Unsteady Flow Characteristics on Sediment Transport Rate
Figure 9 shows that the comparison of transport rate between steady flow through area integration and unsteady flow under non-uniform sand conditions. It was suggested that the sediment transport rate under unsteady flow was significantly greater than that obtained by steady flow under equal time condition. In the case of non-uniform sand φ0.296:φ0.664:φ1.333 (d50 = 0.664 mm) and φ0.664:φ1.333:φ2.639 (d50 = 1.333 mm), the steady flow obtained by integration was larger than the sediment incipient threshold. However, the steady flow velocity did not reach the incipient velocity of other two non-uniform sands, and the sediment transport rate was zero. Meanwhile, the changes of sediment transport under the unsteady flow and the corresponding steady flow through integration were not consistent with different velocity skewness. The sediment transport rate under the unsteady flow increased with the increase of the velocity skewness, the transport rate under steady flow obtained by the integration of unsteady flow declined with the rise up of velocity skewness.
4.3. Effect of Particle Size on Sediment Transport Rate
Figure 10 shows the variation of the transport rate among the different groups of non-uniform sand. It was demonstrated that in the same composed grains the sediment transport rate under unsteady flow was greater than that of the steady flow. The unsteady flow also had a stronger transport capacity for the large-size particle than that of the steady flows. For the small-sized particles, such as φ0.296:φ0.664:φ1.333, the transport capacity(d = 0.296 mm) under the steady flow condition was stronger than that under the unsteady flow, and the transport rate difference was less than 23.4%. Whereas in large-sized particles (d = 1.333 mm), the transport capacity under the steady flow condition was weaker than that under the unsteady flow, and the transport rate difference is less than 12.1%. For the same non-uniform sand, there existed certain difference in the sediment transport rate of the same particle size between steady flow and unsteady flow, which was determined by the hydrodynamic characteristics of the unsteady flow.
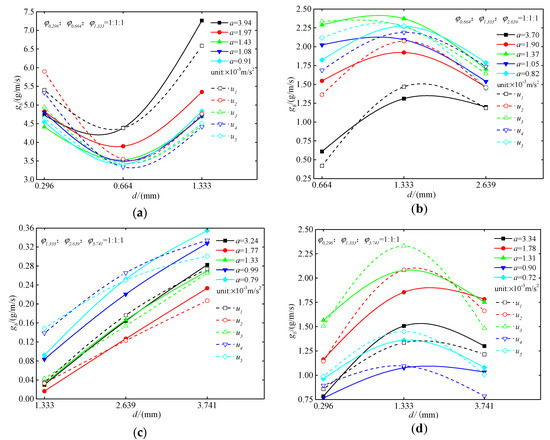
Figure 10.
Sediment transport rate of different non-uniform sand groups under unsteady flow (solid scatters denote unsteady flow, and open scatters indicate steady flow corresponding to the same transport). (a) d50 = 0.664 mm; (b) d50 = 1.333 mm; (c) d50 = 2.639 mm; and (d) d50 = 1.333 mm.
In the process of motion, the unsteady flow would produce acceleration and deceleration, and the generated inertial force should not be negligible. Meanwhile, the velocity changed sharply in a short time, and then the particle impulsive motion was strong which would cause the particles a sharp change in force. The movement of the particles was greatly different from that of the steady flow.
The experimental results showed that the particle size ratio and flow conditions had important influences on the mass ratio of coarse and fine sediment transport, which could be described by dimensionless parameters, as follows:
where η is the mass ratio of the coarse and fine sediment transported in the results; δ1 and δ2 refer to the diameter ratio before movement starting between the previous and latter particle size in the same group respectively; δ = (δ1 + δ2)/2 represents the average grain of the original bed sediment diameter ratio; and 2(Up − Ub)/[(t − t0)g] = a/g characterizes unsteady flow properties-relative velocity skewness. Therefore, the relationship between the mass ratio of different grain sizes that collected in the box, the original sediment particle size distribution and the relative velocity skewness of the flow can be obtained based on the following Equation (4). The R2 was 0.80, and the statistical significance P was less than 0.05, showing a good power function. The relationship is shown in Figure 11.
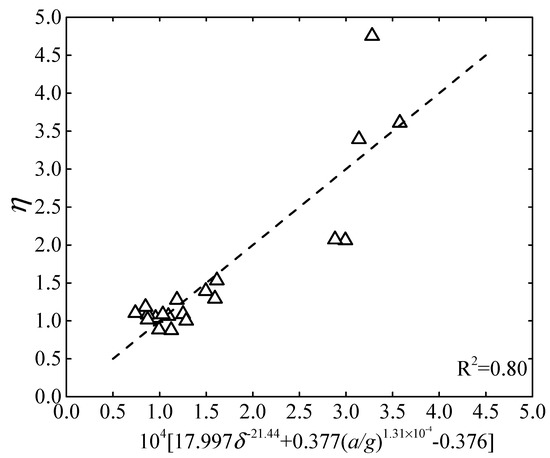
Figure 11.
Relationship between particle mass ratio and original sediment particle size ratio and the flow velocity skewness in sediment transport results.
It can be seen from Equation (4) that when the size ratio increases, the size ratio of the coarse and fine sediment obtained by transporting decreases and tend to be uniform. The increase of the flow velocity skewness increases the ratio of the coarse and fine sediment, and the amount of coarse sediment transport is greater than that of fine sediment. The reason is that when the ratio of the sediment particle size increases, the smaller size counterparts are easier to start to move under the condition of the certain flow. However, the initiation and transport of the larger sediment particles became more and more difficult, resulting in a decrease in the ratio of the transported sediment. When the skewness of the flow was increased, the unsteadiness effect of flow was enhanced, allowing the easier start for large-sized sediment particles which resulted in the increase in the ratio of the coarse and fine sediment obtained.
Figure 12 shows the comparison of transport rate of the same median particle size of non-uniform sand and uniform sand under unsteady flow. It was found that the non-uniform sediment transport rate is 1.27-, 3.19-, and 0.68-times as large as that in uniform sediment under d50 = 0.664, 1.333, and 2.639 mm, respectively. For non-uniform sand, the transport rate of non-uniform sand with a larger adjacent particle size ratio (δ = 0.29) was 1.31-times greater than that of the non-uniform sand with a smaller adjacent particle size ratio (δ = 0.50). The sediment transport rate of uniform sand and non-uniform sand were not equivalent. Therefore, the median particle size of the non-uniform sand cannot be simply used as an indicator to characterize the particle size of the non-uniform sediments or directly brought into the sediment transport rate formula for uniform sand. Through theoretical analysis and experimental researches, Einstein [42], Acker-White [43], and Maddock [44] found that the sediment transport capacity of non-uniform sand was greater than that of uniform sand. White and Day [45] believed that different bed surface sediment distribution and different flow conditions correspond to different equivalent particle sizes of non-uniform sand. Thereby, a single bed surface particle size such as d35, d50, etc. cannot fully characterize the effect of particles on sediment transport capacity. The uneven parameters of the sediment bed surface exhibited a significant impact on sediment movement.
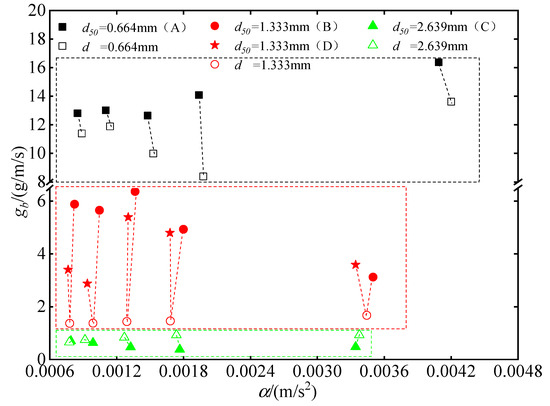
Figure 12.
Comparison of non-uniform sand and uniform sand transport rate of the same median diameter under unsteady flow.
5. Theory Analysis and Discussion
In order to further analyze the sediment transport characteristics of unsteady flow, a theoretical model was incorporated in the study to obtain analytical solution of incipient motion and travel distance under unsteady flow conditions. The experimental phenomena observed in this study were analyzed in the force mechanism.
5.1. Analysis of Incipient Sediment Movement
As shown in Figure 13, the forces during the rolling of the sediment particles included the water flow drag force FD, the uplift force FL, the gravity G, the additional mass force Fm, the vertical motion resistance Fz, the centrifugal force Fc, the normal reaction force FN, and the shear stress Fτ on the contact point e.
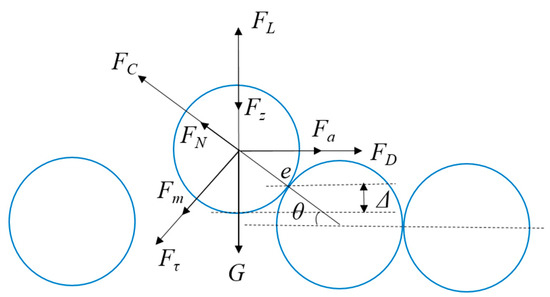
Figure 13.
Sediment particle force model.
In the case of uniform sand, considering the conditions of unsteady flow, the expressions of each force element are listed as follows:
where CD is the drag coefficient of sediment; CL is the uplift force coefficient of sediment; Cm is the additional mass force coefficient, which can be approximated 1/2; A1 and A2 are the area correction coefficient of sediment particles respectively, A1 = A2 = π/4; A3 is the particle volume correction coefficient, A3 = π/6; ub is the near-bottom flow velocity of sediment bed; ux is the velocity of sediment particles along the water flow direction; ρ is the density of water; γs and γ is the bulk density of sediment and water respectively; D is the diameter of sediment particle; and m is the mass of sediment particles, which can be expressed as A3ρsD3; R is the radius of the spherical sediment particle.
For the unsteady flow, the inertial force Fa was generated due to the flow change. The particles were accelerated or decelerated and it would produce a horizontal inertial force Fa acting on the particle [46,47], as follows:
where Ca is inertial force coefficient, V is the volume of the particle.
I0 is the moment of inertia of the mass to the centroid, and I is the moment of inertia of the particle to the centroid. The expressions are given by:
The vertical motion resistance Fz is given by:
where C is the resistance coefficient; uy is the vertical movement velocity of the particles.
The tangential equation of the centroid motion of the sediment particles is given by:
The normal equation of centroid motion is:
The equation of rotation of the sediment particles relative to the center of mass is:
In Equation (17), β is the angle at which the particles rotate around the centroid. For the calculation of the force arm, according to the parabolic distribution of the flow velocity, the moment of the horizontal drag force was R/3. Since the lifting torque is much smaller than the pushing torque, the lifting torque is approximately R/3. Assuming that no slip occurs, β = 2θ, and is eliminated by combining Equations (8) and (15).
Substituting Equation (17) into Equation (14).
In order to obtain the rolling equation of the sediment particles, the Equations (7)–(9) and (14) are substituted into the Equation (19), and the solution is obtained by:
Simplifying the analysis of the force model of the sediment particles and calculate the force arm of each force to the contact point e:
The condition for the critical start of the sediment particles is:
The bottom flow velocity of the critical incipient sediment particles is solved by:
5.2. Effect of Velocity Skewness on Sediment Incipient Motion
It can be seen from Equation (25) that when the flow is steady, the flow acceleration is zero and the velocity skewness is equal to zero, results in becomes zero. The flow velocity of the critical start of the sediment particles is , then , namely the incipient velocity of the sediment particles under the unsteady flow during the acceleration process was smaller than the incipient velocity of the sediment particles under the steady flow. Therefore, the sediment particles under unsteady flow conditions were easier to start transport. As shown in Figure 7, to achieve the same sediment transport rate, the flow velocity of the steady flow was obviously larger than the steady flow velocity through integration of unsteady flow. Therefore, the sediment particles under the unsteady flow were more likely to start and move.
5.3. Effect of Velocity Skewness on the Travel Distance
In order to analyze the movement behavior of the sediment particles in details, the interaction between the particles and the state of the force were applied to study the contact rolling motion of the particles on the bed surface, and the expression of the moving distance was derived to reflect the sediment transport behavior under unsteady flow.
When the particle reaches the critical rolling state from the still, the angular acceleration = 0, the angular velocity , ub = ub0, θ = θ0, which is brought into Equation (20):
For accelerated motion, and ub − ux>0, based on the premise that the above assumption is true, there is:
When the initial condition is ux = u0, t = 0, Equation (28) is solved by:
where , , bring the initial condition t = 0, x = 0 to solve the equation:
In order to study the relationship between the travel distance of particles and the skewness of the unsteady flow velocity, bring the conditions that a = 0~0.45 m/s2, CD = 0.4, CL = 0.1, ρ = 1000 kg/m3, ρs = 2650 kg/m3, t = 1 s, D = 2R = 1~2 mm, ∆ = 1 mm, ub = 0.5 m/s, and u0 = 0.2 m/s to solve Equation (25), and bring the data into Equation (30) to get the relationship between the velocity skewness and the travel distance of the sediment particles, as shown in Figure 14. The experimental data are also given in the figure for comparison. It clearly shows that the theoretical results have good agreements with experimental data.
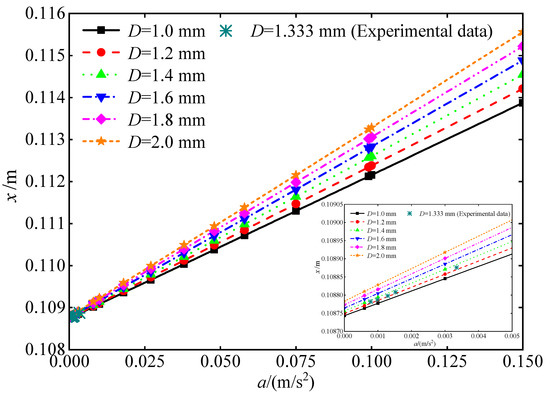
Figure 14.
Relationship between the travel distance and velocity skewness of sediment particles.
It was suggested that in the same period of time, the rolling motion distance of the sediment particles increased as the flow velocity skewness increased. The travel distance of the particles can effectively characterize the length of the moving distance of particles on the bed surface. Therefore, the travel distance of the sediment particles can effectively reflect the sediment transport rate of the horizontal bed surface within a certain period of time, and thus the velocity skewness had a positive relation with the sediment transport rate of the bed load, and the sediment transport rate increased with the increase of the velocity skewness. Since the unsteady flow had velocity skewness compared to the steady flow, it is inferred that the unsteady flow produce a larger sediment transport rate than the steady flow in the same period, as shown in Figure 6 and Figure 8. The sediment transport rate under the unsteady flow was significantly larger than the steady flow through area integration of the unsteady flow, which was consistent with the phenomenon observed during the experiment.
During the deceleration motion, ub − ux < 0. When ux = u0, t = 0, the solution of Equation (28) is obtained.
further solution:
where . When t = 0, x = 0, Equation (32) is solved:
The influence of the flow velocity skewness on travel distance of the particle under deceleration was also analyzed. The initial conditions that a = 0~0.28 m/s2, CD = 0.4, CL = 0.1, ρ = 1000 kg/m3, ρs = 2650 kg/m3, t = 0.3 s, D = 2R = 1~2 mm Δ = 0.5 mm, ub = 0.5 m/s, and u0 = 0.2 m/s are given to deal with the travel distance Equation (33), deriving the relationship between the travel distance and the velocity skewness in the deceleration phase, as is shown in Figure 15. In this figure, theoretical results are compared with experimental data in the study, which can be found that the theoretical results are agreed with experimental data well.
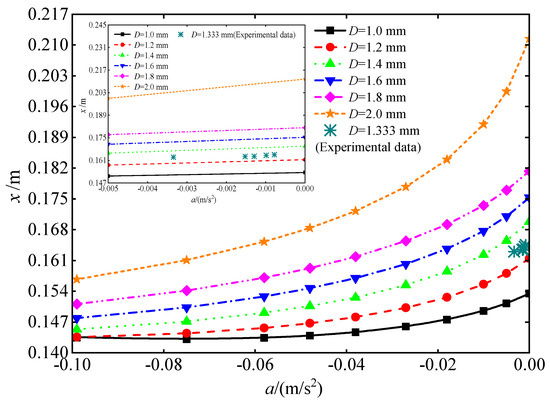
Figure 15.
Relationship between the travel distance and velocity skewness of sediment particles.
It was indicated that the travel distance of the rolling motion of the sediment particles increased with the increase of the flow skewness during the deceleration process, and the growth rate of the single particle travel distance rose up with the drop of reverse flow velocity. The impact of the velocity skewness on the movement distance of the sediment particles on the bed surface was thus gradually becoming notable.
6. Conclusions
In this study, laboratory experiments on the sediment transport of uniform and non-uniform sand under unsteady flow was performed. The effects of the velocity skewness and particle size on sediment transport rate were investigated. It was found that the sediment transport rate under unsteady flow was greater than that of steady flow, a formula for the coarse/fine sediment ratio of the non-uniform sand transport under unsteady flow was established. Furthermore, the inertial force was introduced to derive the analytical solution of the sediment incipient velocity and the travel distance under unsteady flow. There is a good fit between the theoretical model and experimental data obtained under unsteady flow. Compared with steady flow, the sediment particles are easier to start to transport under unsteady flow and the movement distance was longer.
Author Contributions
Conceptualization and development of the main idea of the paper, Z.D. and J.C.; writing-original draft preparation, Z.D.; writing-review and editing, J.C. and X.L.; project administration, C.J.; supervision, B.Z.; funding acquisition, J.C. and C.J. All authors have read and agreed to the published version of the manuscript.
Funding
The study is financially supported by the National Natural Science Foundation of China (Grant No. 51979014 and 51839002). Partial support also comes from the Natural Science Foundation of Hunan Province, China (Grant No. 2018JJ3546) and the Key Project of Scientific Research Project of Education Department of Hunan Province, China (Grant No. 18A123).
Conflicts of Interest
The authors declare no conflict of interest. The funders had no role in the design of the study; in the collection, analyses, or interpretation of data; in the writing of the manuscript; or in the decision to publish the results.
References
- Wu, Z.; Jiang, C.; Chen, J.; Long, Y.; Deng, B.; Liu, X. Three-Dimensional Temperature Field Change in the South China Sea during Typhoon Kai-Tak (1213) Based on a Fully Coupled Atmosphere–Wave–Ocean Model. Water 2019, 11, 140. [Google Scholar] [CrossRef]
- Wu, Z.; Chen, J.; Jiang, C.; Liu, X.; Deng, B.; Qu, K.; He, Z.; Xie, Z. Numerical investigation of Typhoon Kai-tak (1213) using a mesoscale coupled WRF-ROMS model—Part II: Wave effects. Ocean Eng. 2020, 196, 106805. [Google Scholar] [CrossRef]
- Chen, J.; Duan, Z.; Jiang, C. Laboratory study on tsunami erosion and deposition under protection of rigid emergent vegetation. Nat. Hazards 2018, 92, 995–1010. [Google Scholar] [CrossRef]
- Yang, S.Q. Formula for sediment transport in rivers, estuaries, and coastal waters. J. Hydraul. Eng. 2005, 131, 968–979. [Google Scholar] [CrossRef]
- Yang, S.Q. Formula for sediment transport subject to vertical flows. J. Hydraul. Eng. 2019, 145, 04019013. [Google Scholar] [CrossRef]
- Park, H.; Cox, D.T.; Lynett, P.J. Tsunami inundation modeling in constructed environments: A physical and numerical comparison of free-surface elevation, velocity, and momentum flux. Coast. Eng. 2013, 79, 9–21. [Google Scholar] [CrossRef]
- Alsina, J.M.; Van der Zanden, J.; Caceres, I. The influence of wave groups and wave-swash interactions on sediment transport and bed evolution in the swash zone. Coast. Eng. 2018, 140, 23–42. [Google Scholar] [CrossRef]
- Wainwright, J.; Parsons, A.J.; Cooper, J.R. The concept of transport capacity in geomorphology. Rev. Geophys. 2015, 53, 1155–1202. [Google Scholar] [CrossRef]
- Li, Z.; Cao, Z.; Liu, H. Graded and uniform bed load sediment transport in a degrading channel. Int. J. Sediment Res. 2016, 31, 376–385. [Google Scholar] [CrossRef]
- Nelson, P.A.; Morgan, J.A. Flume experiments on flow and sediment supply controls on gravel bedform dynamics. Geomorphology 2018, 323, 98–105. [Google Scholar] [CrossRef]
- Sharma, A.; Kumar, B. Sheet flow hydrodynamics over a non-uniform sand bed channel. Int. J. Sediment Res. 2018, 33, 313–326. [Google Scholar] [CrossRef]
- Zhang, Y.; Chen, D.; Garrard, R. Influence of bed clusters and size gradation on operational time distribution for non-uniform bed-load transport. Hydrol. Process. 2016, 30, 3030–3045. [Google Scholar] [CrossRef]
- Kuai, K.Z.; Tsai, C.W. Discrete-time markov chain model for transport of mixed-size sediment particles under unsteady flow conditions. J. Hydrol. Eng. 2016, 21, 04016039. [Google Scholar] [CrossRef]
- Chen, X.; Li, Y.; Chen, G. Generation of net sediment transport by velocity skewness in oscillatory sheet flow. Adv. Water Resour. 2018, 111, 395–405. [Google Scholar] [CrossRef]
- Chen, X.; Wang, F.; Chen, G. Sediment transport in pure acceleration-skewed oscillatory sheet flow. J. Hydrodyn. 2018, 30, 1045–1054. [Google Scholar] [CrossRef]
- Memarzadeh, R.; Barani, G.; Ghaeini-Hessaroeyeh, M. Numerical modeling of sediment transport based on unsteady and steady flows by incompressible smoothed particle hydrodynamics method. J. Hydrodyn. 2018, 30, 928–942. [Google Scholar] [CrossRef]
- Redolfi, M.; Bertoldi, W.; Tubino, M. Bed load variability and morphology of gravel bed rivers subject to unsteady flow: A laboratory investigation. Water Resour. Res. 2018, 54, 842–862. [Google Scholar] [CrossRef]
- Ren, D.G.; Dou, X.; Li, T. Incipient motion of sediment by waves. Sci. China Ser. E Technol. Sci. 2001, 44, 309–318. [Google Scholar]
- Wang, L.; Cuthbertson, A.J.; Pender, G.; Cao, Z. Experimental investigations of graded sediment transport under unsteady flow hydrographs. Int. J. Sediment Res. 2015, 30, 306–320. [Google Scholar] [CrossRef][Green Version]
- Ma, A.; Lu, Y.; Lu, Y. Experimental study on gravel bed-load transport in unsteady flow. J. Hydraul. Eng. 2013, 44, 800–809. [Google Scholar]
- Wu, W.; Wang, S.S.Y.; Jia, Y. Nonuniform sediment transport in alluvial rivers. J. Hydraul. Res. 2000, 38, 427–434. [Google Scholar] [CrossRef]
- Bombar, G.; Elci, Ş.; Tayfur, G. Experimental and Numerical Investigation of Bed-Load Transport under Unsteady Flows. J. Hydraul. Eng. 2011, 137, 1276–1282. [Google Scholar] [CrossRef]
- Phillips, C.B.; Hill, K.M.; Paola, C. Effect of flood hydrograph duration, magnitude, and shape on bed load transport dynamics. Geophys. Res. Lett. 2018, 45, 8264–8271. [Google Scholar] [CrossRef]
- Phillips, C.B.; Martin, R.L.; Jerolmack, D.J. Impulse framework for unsteady flows reveals super diffusive bed load transport. Geophys. Res. Lett. 2013, 40, 1328–1333. [Google Scholar] [CrossRef]
- Imhoff, K.S.; Wilcox, A.C. Coarse bedload routing and dispersion through tributary confluences. Earth Surf. Dyn. 2016, 4, 591–605. [Google Scholar] [CrossRef]
- Mrokowska, M.M.; Rowiński, P.M.; Książek, L. Laboratory studies on bedload transport under unsteady flow conditions. J. Hydrol. Hydromech. 2018, 66, 23–31. [Google Scholar] [CrossRef]
- Diplas, P.; Dancey, C.L.; Celik, A.O. The role of impulse on the initiation of particle movement under turbulent flow conditions. Science 2008, 322, 717–720. [Google Scholar] [CrossRef]
- Valyrakis, M.; Diplas, P.; Dancey, C.L. Entrainment of coarse particles in turbulent flows: An energy approach. J. Geophys. Res. Earth Surf. 2013, 118, 42–53. [Google Scholar] [CrossRef]
- Mao, J.; Dai, H.; He, W. Calculating incipient velocity of non-uniform sediment through stress analysis. Int. Symp. Water Resour. Environ. Prot. 2011, 1, 607–609. [Google Scholar]
- Patel, S.B.; Patel, P.L.; Porey, P.D. Threshold for initiation of motion of unimodal and bimodal sediments. Int. J. Sediment Res. 2013, 28, 24–33. [Google Scholar] [CrossRef]
- Almedeij, J.H.; Diplas, P. Bedload transport in gravel-bed streams with unimodal sediment. J. Hydraul. Eng. 2003, 129, 896–904. [Google Scholar] [CrossRef]
- Kleinhans, M.G.; van Rijn, L.C. Stochastic prediction of sediment transport in sand-gravel bed rivers. J. Hydraul. Eng. 2002, 128, 412–425. [Google Scholar] [CrossRef]
- Almedeij, J.H.; Diplas, P.; Al-Ruwaih, F. Approach to separate sand from gravel for bed-load transport calculations in streams with bimodal sediment. J. Hydraul. Eng. 2006, 132, 1176–1185. [Google Scholar] [CrossRef]
- Patel, S.B.; Patel, P.L.; Porey, P.D. Fractional bed load transport model for nonuniform unimodal and bimodal sediments. J. Hydro Environ. Res. 2015, 9, 104–119. [Google Scholar] [CrossRef]
- Elhakeem, M.; Imran, J. Bed load model for nonuniform sediment. J. Hydraul. Eng. 2016, 142, 06016004. [Google Scholar] [CrossRef]
- Yang, F.; Liu, X.; Yang, K. Study on the angle of repose of nonuniform sediment. J. Hydrodyn. B 2009, 21, 685–691. [Google Scholar] [CrossRef]
- Parker, G.; Marwan, H.; Peter, W. 10 Adjustment of the bed surface size distribution of gravel-bed rivers in response to cycled hydrographs. Dev. Earth Surf. Process. 2007, 11, 241–285. [Google Scholar]
- Humphries, R.; Venditti, J.G.; Sklar, L.S.; Wooster, J.K. Experimental evidence for the effect of hydrographs on sediment pulse dynamics in gravel-bedded rivers. Water Resour. Res. 2012, 48, 1. [Google Scholar] [CrossRef]
- Einstein, H.A. The Bed-Load Function for Sediment Transportation in Open Channel Flows; US Department of Agriculture: Washington, DC, USA, 1950.
- Kalinske, A.A. Movement of sediment as bed load in rivers. Eos Trans. Am. Geophys. Union 1947, 28, 615–620. [Google Scholar] [CrossRef]
- Yalin, M.S. An expression for bed-load transportation. J. Hydraul. Div. 1963, 89, 221–250. [Google Scholar]
- Einstein, H.A. Bed Load Transportation in Mountain Creek. In Technical Paper No.55, Soil Conservation Service; United States Department of Agriculture: Washington, DC, USA, 1944. [Google Scholar]
- Ackers, P.; White, W.R. Sediment transport: New approach and analysis. J. Hydraul. Div. 1973, 99, 621–625. [Google Scholar]
- Maddock, T. The Behavior of Straight Open Channels with Movable Beds; U.S. Geological Survey Professional Paper 622-A: Washington, DC, USA, 1969; pp. 1–70.
- White, W.R.; Day, T.J. Transport of graded gravel bed material. In Gravel-Bed Rivers, Fluvial Process, Engineering and Mangement; Hey, R.D., Bathurst, J.C., Thorne, C.R., Eds.; John Wiley and Sons: Chichester, UK, 1982; pp. 181–233. [Google Scholar]
- Zhou, Y.R.; Chen, Y.P.; Ma, Q.N. Threshold of sediment movement in different wave boundary layers. China Ocean Eng. 2001, 15, 509–520. [Google Scholar]
- Zhang, S.; Chen, Y.; Zhang, B. A study on incipient sediment motion and the stability conditions of rubble. Eng. Lett. 2015, 23, 49–54. [Google Scholar]


© 2020 by the authors. Licensee MDPI, Basel, Switzerland. This article is an open access article distributed under the terms and conditions of the Creative Commons Attribution (CC BY) license (http://creativecommons.org/licenses/by/4.0/).