Abstract
The structural integrity of post-tensioning prestressed concrete structures with tendon ducts highly depends on the grouting quality in construction. This paper proposes a real-time approach to monitoring the grouting compactness in tendon ducts using the multi-sensing electro-mechanical impedance (EMI) method. When Lead Zirconate Titanate (PZT) transducers with different pre-selected dimensions are serially connected and mounted on a structure at distributed locations, each PZT provides unique resonance frequency coupled with the local structural physical property. Therefore, the impedance with multiple peaks of the serially connected multiple PZTs can be captured during a single measurement, which significantly simplifies the measurement procedure and reduces the data processing time. In addition, the wiring for the PZT sensors is also simplified. In this research, the feasibility of the proposed method was experimentally and numerically investigated to monitor the grouting compactness in a tendon duct specimen. The 3-dB mean absolute percentage deviation (MAPD) was applied to quantify the variations of the impedance signatures measured from five different grouting levels. Both experimental and numerical results verify the feasibility of using the proposed method for monitoring the grouting compactness in tendon ducts.
1. Introduction
Many factors contribute to the deterioration of civil infrastructures [,,], and among them, corrosion exists in almost all structures [,,] and is often responsible for various structural damages [,,], such as cracks, reduced stiffness, and eventually reduced or lost bearing capacity. Prestressed concrete structures have been widely used in modern concrete infrastructures because of its advantage of high stiffness, crack resistance, and good durability [], and the post-tensioned method is often used in the production of prestressed concrete structures []. However, insufficient grouting of the prestressed tension duct provides channels for water/moisture migration and chloride diffusion [], resulting in the corrosion of prestressing tendons, which may lead to the severe degradation of the bearing capacity of post-tensioned prestressed concrete structures [,,]. Therefore, an effective technique to evaluate the grouting compactness should be developed.
Various non-destructive testing (NDT) techniques, including the impact-echo (IE) method [,], the X-ray penetration method [], the ultrasonic testing method [,,,], and the ground penetrating radar (GPR)-based method [] have been developed to detect the grouting compactness. However, the above methods are usually performed with a structural downtime, which make these methods unsuitable for the real-time monitoring of civil structures.
With the advantage of real-time capacity, structural health monitoring (SHM) has become an emerging topic in the field of civil engineering [,,,]. Lead Zirconate Titanate (PZT) transducers have been widely studied and applied in the field of SHM due to their multiple advantages of wide bandwidth [,], quick response [,], dual capacity as a sensor and an actuator [], and energy harvesting [,,]. In addition, various packaging and protection methods have been developed for PZT transducers [,,] so that they can be easily deployed for real-time structural monitoring through embedment for concrete structures [,,] or surface bonding for steel structures, concrete structures, and composite structures [,]. PZT-based structural health monitoring methods include the active sensing approach [,,,], electro-mechanical impedance (EMI) approach [,,], and passive sensing method [,,].
Among these methods, the PZT-based active sensing method has been used to monitor the grouting compactness. Yan et al. [] proposed a detection approach based on the time reversal theory to detect the compactness of concrete, in which two damage indexes were defined to determine the existence and location of artificial and real damage areas. Jiang et al. [,] used the PZT-based active sensing method to monitor the grouting compactness in a post-tensioning tendon duct (PTTD) and established a two-dimensional finite element model (FEM) to further explain the wave propagation in a PTTD with different grouting compactness. Tian et al. [] developed a new PZT-enabled time-reversal method by installing a PZT ring on the prestressed steel to monitor the grouting quality of a post-tensioning tendon duct in real-time. An ultrasonic time difference of arrival (TDOA) algorithm was applied by Xu et al. [] to monitor the grouting compactness of the concrete-filled fiber-reinforced polymer tube (CFFT). However, it limits the use of the PZT-based active sensing approach in that it requires two or more sensors to generate and detect the stress wave.
The EMI is another powerful technique for a PZT-based SHM. In this technique, a PZT patch, which is bonded on or embedded into the structure, acts as both a sensor and an actuator []. The basic principle of the EMI technique is to track the electrical impedance of the PZT patch bonded on or embedded into the structure. The change of mechanical properties of the structure changes the mechanical impedance of the structure, which may also cause the variation of electrical impedance of the PZT patch [,]. By using the EMI method, Shi et al. [] investigated the grout compactness of concrete-filled fiber-reinforced polymer tubes and proposed the grout compactness index (CI) based on the root-mean-square deviation (RMSD), which could assess the grouting compactness precisely. However, many PZT sensors may be used in the long-span post-tensioned prestressed concrete structures []. Hence, it is impractical to measure the electrical impedance of a large number of sensors one by one through the EMI approach.
In this paper, we proposed a multi-sensing technique based on EMI to monitor the grouting compactness. The experimental study of tendon duct specimens with five different grouting compactness levels (empty, 25%, 50%, 75%, 100% compactness) was carried out to verify the proposed technique. In this experiment, three different diameter PZT wafers, which have different resonant frequencies, were connected in series and mounted onto the different locations of the duct surface, so that the impedance signature at each frequency peak contains information about the grouting compactness of the duct at different locations. The impedance values of the PZT wafers were obtained by a single frequency sweep, which significantly simplifies the measurement procedure and reduces the data processing time. The serial connection also simples the wiring of the transducers. In addition, the 3-dB mean absolute percentage deviation (MAPD) based on MAPD was proposed to function as a quantitative index of grouting compactness. Finally, a finite element analysis was used to further understand the principle of the proposed method.
2. Methodology
2.1. Multi-Sensing EMI Method
In 1994, Liang et al. [] first proposed a one-dimensional EMI theoretical model. In this model, the PZT patch is considered a thin bar undergoing axial vibration in response to an applied alternating voltage. The altering voltage and output current of the PZT patch are respectively denoted as V and I, respectively. As shown in Figure 1, the PZT patch is considered fixed at one end, and the other end is attached to structure represented by a single-degree-of-freedom (SDOF) spring–mass–damper system. The frequency-dependent electrical admittance of PZT patches coupled to the structure is given by:
where i is the imaginary unit; w represents the angular frequency of the excitation; a is the geometry constant of the PZT patch; is the dielectric constant of the PZT patch at zero stress; is the piezo-electric coupling constant in the arbitrary x direction at zero stress; is the complex Young’s modulus of the PZT at the zero electric field; and and denote the mechanical impedance of the structure and the PZT patch, respectively. The mechanical property of the PZT patch remains unchanged during the monitoring process; hence, the frequency-related electrical admittance is directly related to the mechanical properties of the structure. The real part of the impedance was used in this paper, as it has been reported to be less sensitive to temperature changes compared to the imaginary part [,].
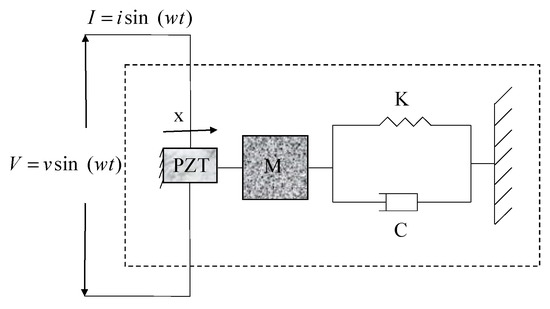
Figure 1.
The electromechanical impedance model of a Lead Zirconate Titanate (PZT)-driven structural system.
As shown in Figure 2, the multi-sensing EMI method is achieved by connecting several PZT patches serially and mounting them onto the different locations of a structure, and the impedance signatures can be obtained by a frequency sweep [,]. In Figure 2, Mn, Cn, and Kn (n = 1,2,3…) represent the mass, damping, and rigidity of different locations of the structure, respectively. It is worth mentioning that each PZTn (n = 1,2,3…) has different resonant frequencies, which ensures that multiple frequency peaks can be obtained when the PZT patches are connected in series []. The change of the physical characteristics of the structure in different regions will change the vibration state of the PZT patch at the corresponding position, which will be reflected by the change in the impedance signature at different frequency peaks.
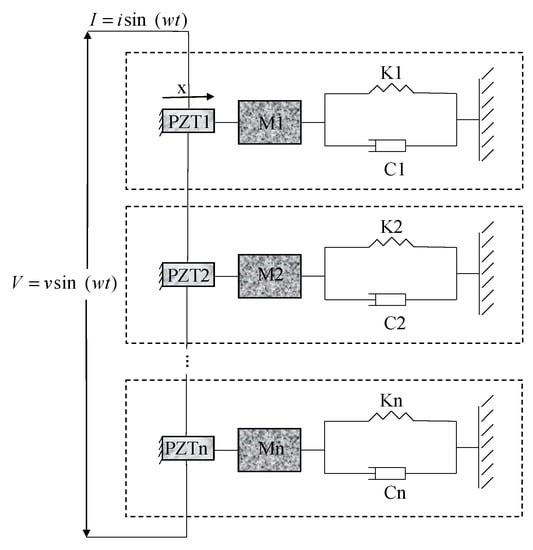
Figure 2.
The schematic diagram of the multi-sensing electro-mechanical impedance (EMI) method.
2.2. Monitoring of Grouting Compactness Based on Multi-Sensing EMI Method
The schematic of the principle of monitoring of grouting compactness based on the multi-sensing EMI method is shown in Figure 3. Here, an example of three PZT patches connected in series is introduced. Three PZT patches of different sizes are installed at the bottom, middle, and top of the duct and connected to the impedance analyzer through a series connection. The impedance signatures of the PZT patches that are connected in series and mounted onto an empty duct are obtained by triggering a single sweep signal, as shown in Figure 4. We can clearly see the three peaks P1, P2, and P3 in the impedance signature, which respectively correspond to the mechanical characteristics of structures near PZT1, PZT2, and PZT3. According to the aforementioned analysis in Section 2.1, as the grout compactness increases, the stiffness of the prestressed duct will increase, which will be reflected by the changes of the impedance signatures at different frequency peaks. Additionally, since the EMI method has different sensitivities to different regions, when the grouting reaches a certain level, the impedance signals at different peak frequencies change differently. As shown in Figure 3 and Figure 4, when the grouting compactness is greater than 50% and less than 100%, the impedance corresponding to the peak frequency P1 and P2 changes greatly, while the impedance signal corresponding to the peak frequency P3 changes slightly.
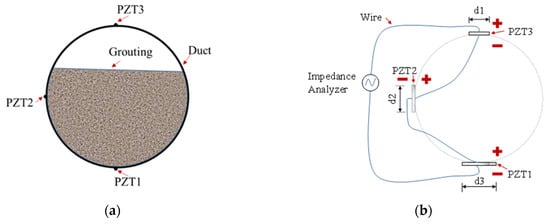
Figure 3.
The schematic principle of monitoring of grouting compactness based on the multi-sensing EMI method. (a) Schematic; (b) Connection diagram of PZT patches.
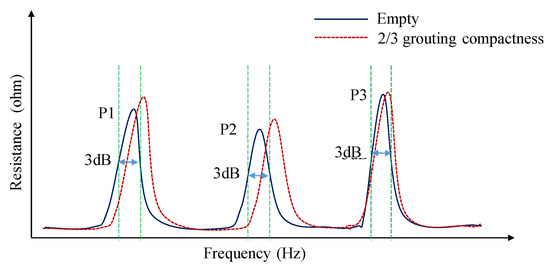
Figure 4.
The impedance signatures for the PZT patches connected in series.
To determine the variation of the impedance signatures at different frequency peaks quantitatively, the 3-dB mean absolute percentage deviation (MAPD)-based index is proposed. The 3-dB MAPD is a MAPD value of the impedance in the 3-dB bandwidth of peak frequency, which is shown in Figure 4. The MAPD is defined as follows []:
where N represents the total number of sampling points of the impedance signature, represents the impedance signature in empty grouting compactness for the ith frequency, and represents the actual impedance signature for the ith frequency.
2.3. PZTs for Monitoring of Grouting Compactness Based on the Multi-Sensing EMI Method
For multi-sensing monitoring grouting compactness based on the EMI technique, it is very important to select the PZT patches with different resonant frequencies. Park et al. [] have confirmed that the lateral mode impedance has a larger sensing area than the thickness mode impedance. Therefore, the radial vibration modes of PZT wafers were adopted in this paper. According to the literature [], the resonant frequency of radial vibration of PZT wafer is
where is a function of , ; is the Poisson ratio of the PZT wafer at zero electric field; r is the radius of the PZT wafer; represents the density of the PZT wafer; and is the elastic compliance at the constant electric field in the loading direction of the PZT sensors. Equation (3) indicates that after the material of the PZT wafer is determined, the resonant frequency of the radial vibration of the PZT wafer depends on its radius and vibrational order. Therefore, multiple frequency peaks can be obtained by connecting several PZT wafers with different radii in series and adopting their first vibrational order to realize a multi-sensing EMI method.
3. Experimental Setup
To study the feasibility of the proposed multi-sensing EMI approach for grouting compactness monitoring, a post-tensioning tendon duct with a 100 mm outer diameter and a prestressed steel with 12 mm outer diameter were prepared in the laboratory. Three PZT wafers, PZT1, PZT2, and PZT3, which are connected in series, are mounted onto the top, middle, and bottom of the same section of the duct surface and then connected to the impedance analyzer (Keysight E4990A). During the experiments, the grout was poured into the post-tensioning tendon duct through the grout hole. The experimental setup of grouting compactness monitoring based on the multi-sensing EMI method is shown in Figure 5.
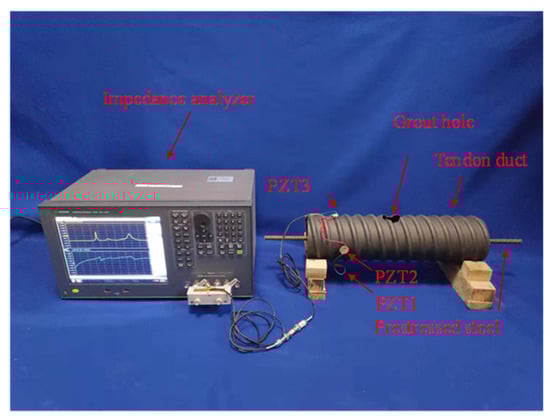
Figure 5.
Experimental setup.
To avoid the overlapping of different peak frequencies, three PZT wafers with different diameters were used. The materials used for PZT wafers are PZT-5H. The dimension and material properties of PZT wafers are shown in Table 1 and Table 2, respectively.

Table 1.
Dimension of PZT wafers.
Table 2.
Material properties of PZT-5H.
In this experiment, five different levels (empty, 25%, 50%, 75%, and 100%) of grouting compactness, which is represented by case Gi (i = 1, 2, 3, 4, 5) for simplicity, were studied and shown in Figure 6. According to the literature [], the frequency range of the EMI technique is selected by manually finding the resonance peak and setting a specific range for analysis. Prior to the test, the resonant frequencies of the PZT wafers used in this experiment were measured as 80–90 kHz, 110–120 kHz, and 160–190 kHz, respectively. Therefore, a sweep frequency signal was generated from 20 to 200 kHz to monitor the impedance signature corresponding to different grouting compactness levels. These impedance signatures consist of 1601 data points within the defined frequency range. The impedance signature for the empty grouting compactness was measured and defined as a baseline.
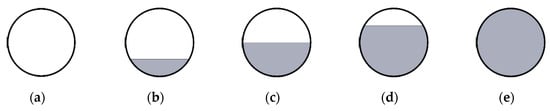
Figure 6.
Five grouting levels. (a) Case G1; (b) Case G2; (c) Case G3; (d) Case G4; and (e) Case G5.
4. Experimental Results
The measured impedance signatures in the frequency range from 20 to 200 kHz for three PZTs for the unloaded and loaded conditions are shown in Figure 7. The unloaded condition means that the PZTs are separate and not bonded onto the duct. The loaded conditions mean that the PZTs are connected in series and mounted onto the duct with empty grouting compactness. As shown in Figure 7a, the peak frequencies of three PZT wafers are different from each other, which is consistent with the analysis in Section 2.3. The resistance signal of serially connected PZTs in Figure 7b indicates that the three frequency peaks can be obtained when three PZT wafers of different diameters are connected in series and mounted onto the duct. Compared with unloaded conditions, the peak of these three PZTs for the loaded conditions are shifted to the left, and the impedance values are reduced.
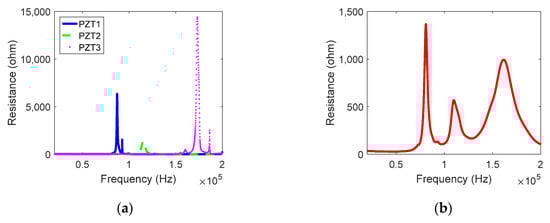
Figure 7.
The measured impedance signature of PZTs for unloaded conditions and loaded conditions: (a) unloaded condition; (b) loaded conditions.
The electrical impedance signatures of the serially connected PZTs mounted onto tendon duct at different grouting compactness levels are shown in Figure 8. The frequency peaks labeled P1, P2, and P3 correspond to PZT1, PZT2, and PZT3, respectively. For the first frequency peak P1, when the grouting compactness increases from empty to 25%, the impedance signal has a clear upward trend, which reflects that the stiffness of the structure near PZT1 increases as the grouting compactness increases. When the grouting compactness increases from 25% to 100%, the impedance signal changes slightly. For the second frequency peak P2, the impedance signature changes obviously during the grouting compactness from 25% to 50%. Relatively speaking, the impedance signature does not change significantly from empty to 25% and from 50% to 100% of grouting compactness, which means that there are relatively sensitive areas when the EMI method is used to monitor structural health. For the third frequency peak P3, the resistance values change slowly from empty to 75% grouting compactness and vary considerably from 75% to 100% grouting compactness, which could be used to judge whether the grout is compact or not. The above analyses show that by comparing the relative changes of the impedance signatures at each frequency peak, the grouting compactness can be determined qualitatively.
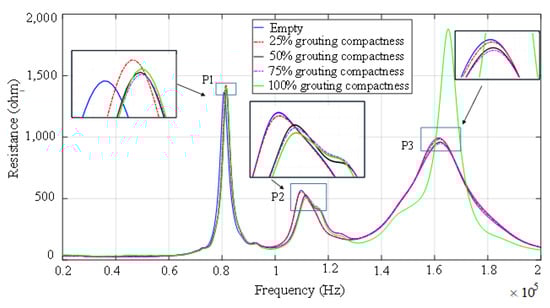
Figure 8.
The measured impedance signature of PZTs at different grouting compactness levels.
Based on Equation (3), 3-dB MAPDs for different grouting compactness levels are calculated and shown in Figure 9. It can be seen that the 3-dB MAPD increases with the increases of grouting compactness, which indicates that the 3-dB MAPD could be used to determine the grouting compactness quantitatively. Additionally, it is clearly shown that there is a sudden rise in the 3-dB MAPD for each frequency peak, which can be used to determine the approximate location of the grouting level.
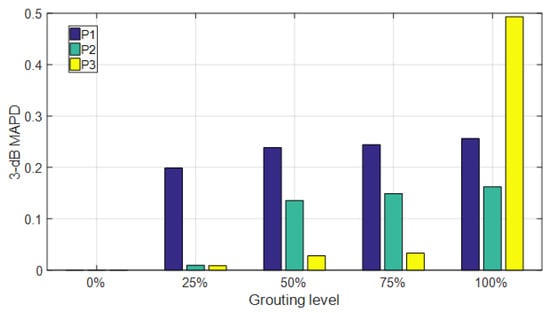
Figure 9.
3-dB mean absolute percentage deviation (MAPD) for different grouting compactness levels.
5. Numerical Simulation
To further understand the principle of the proposed multi-sensing EMI method, an FEM of grouting compactness was established by using COMSOL Multiphysics. As shown in Figure 10, a two-dimensional finite element model, which consists of a duct, grouting, and three PZT patches, was established. The outer diameter of the tendon duct is 100 mm, and its thickness is 2 mm. Three PZT patches with the lengths of 20 mm, 16 mm, and 12 mm and the thickness of 0.3 mm are labeled as PZT1, PZT2, and PZT3. The physical properties of the material in the model are shown in Table 3, and the physical properties of the PZT patches are shown in Table 2.
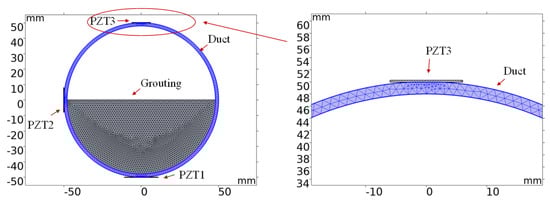
Figure 10.
Finite element model of grouting compactness.
Table 3.
Material properties.
In the numerical simulation model, three PZT patches, PZT1, PZT2, and PZT3 were mounted onto the bottom, middle, and top outside of the duct using a thin layer of epoxy. The numerical model ignores the thin layer of epoxy and connects PZT patches with duct by using the Form Union. In order to have sufficient contact with the PZT patches, the local area of the duct surface is ground to a flat surface, which is shown in Figure 10. A terminal voltage with the amplitude of 1 V was applied to the upper surface of the top PZT patch, and the lower surface of the bottom PZT patch is grounded. Suspension potential was used to simulate the serial electrical connectivity of PZT patches. Roll supports were placed on the side of each PZT patch away from the duct to limit its normal displacement. In order to simulate the piezoelectric effect, a multi-physical coupling of the piezoelectric effect was established. The corresponding current of the series PZT patches was acquired after a frequency analysis over a certain frequency range from 20 to 200 kHz; then, the electrical impedance signatures of the series PZT patches can be calculated by dividing the terminal voltage by current. Five grouting levels—empty, 25%, 50%, 75% and 100%—were established to simulate the grouting process. For the accuracy of the simulation results, the maximum size of the mesh partition is 1/10 of the wavelength [].
Figure 11 shows the simulation impedance signatures of at different grouting compactness levels. The three frequency peaks, which are labeled P1, P2 and P3, are corresponding to PZT1, PZT2, and PZT3 respectively. It can be seen that when the grouting level reaches 25%, 50% and 100%, the impedance signature values of P1, P2, and P3 successively change significantly, which is consistent with the experimental results. However, there are two significant changes in the impedance of P2 when the grouting level reached 50% and 75%, while the experimental results showed only one significant change in the impedance of P2 when the grouting compactness reached 50%. This is because it is difficult to ensure that the grouting compactness is exactly 50% during the experiment. During the experiment, the grouting level was slightly above 50%, so the stiffness of the structure near PZT2 did not change significantly during the subsequent grouting. This also indicates that PZT2 is more sensitive to changes in physical properties of local regions.
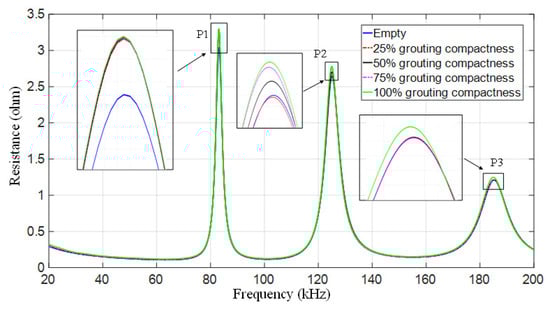
Figure 11.
Simulated impedance signatures for different grouting compactness.
Based on Equation (3), the 3-dB MAPDs of impedance signatures acquired in the numerical model for different grouting compactness were also calculated and are shown in Figure 12. It can be found that the 3-dB MAPD values of P1, P2, and P3 have a sudden increase when the grouting compactness reaches 25%, 50%, and 100% respectively, which is consistent with the experimental results and can be used to determine the grouting compactness level.
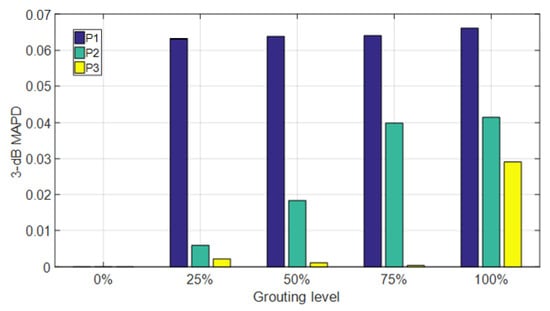
Figure 12.
3-dB MAPD of simulated impedance signatures for different grouting compactness levels.
When the structure is excited by PZT patches at three different frequencies—P1, P2, and P3, respectively—the displacement diagrams of the numerical model at empty, 25% grouting compactness, 50% grouting compactness, 75% grouting compactness, and 100% grouting compactness are shown in Figure 13, Figure 14 and Figure 15. As shown in Figure 13, the increase of grouting compactness changes the deformation of the model near PZT1, and then it changes the vibration state of PZT1. Specifically, the change of the deformation of the model around PZT1 is 0.15×10⁻⁶ mm in the process of grouting compactness from empty to 25%. The change of the deformation is 0.02×10⁻⁶ mm, 0.01×10⁻⁶ mm, and 0.01×10⁻⁶ mm during the rest of the grouting process. Therefore, the change of the deformation of the model around PZT1 from empty to 25% is much larger than that of the other grouting processes, which explains why the resistance of P1 changes significantly in the process of grouting compactness from empty to 25%. According to Figure 14, as the grouting compactness increases, the deformation of the model around PZT2 changes, thus changing the vibration state of PZT2. Figure 14b–d show that the deformation of the model near PZT2 is 0.19×10⁻⁶ mm in the process of grouting compactness from 25% to 75% and obviously greater than the deformation variation of other grouting processes, which means that the impedance signature of PZT2 is sensitive to the physical characteristics of this region. According to Figure 15, as the grouting compactness increases, the deformation of the model around PZT3 changes, thus changing the vibration state of PZT3. Figure 15d,e show that the grouting compactness from 75% to 100% has a particularly significant influence on the deformation of the model around PZT3. According to the above analysis, it can be seen that the displacement diagram corresponding to different peak frequency excitations is basically consistent with the change of impedance at each peak frequency, indicating the basic principle of the multi-sensing EMI method to monitor the grouting compactness.
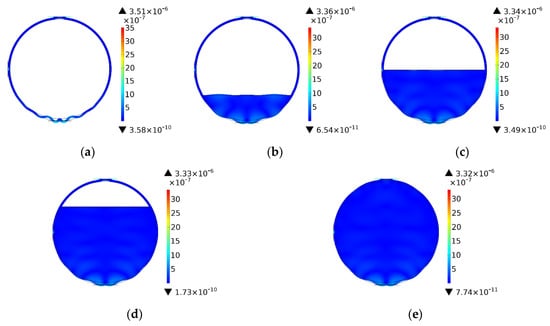
Figure 13.
The structural deformation excited by PZT patches at frequency P1 (unit: mm). (a) Empty; (b) 25%; (c) 50%; (d) 75%; (e) 100%.

Figure 14.
The structural deformation excited by PZT patches at frequency P2 (unit: mm). (a) Empty; (b) 25%; (c) 50%; (d) 75%; (e) 100%.
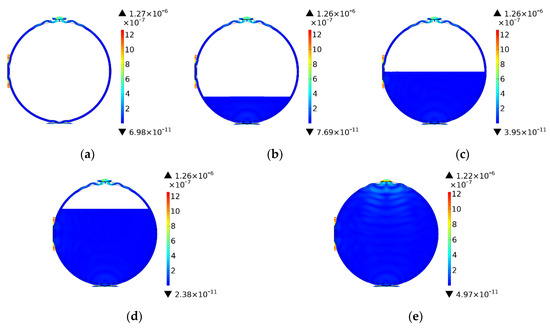
Figure 15.
The structural deformation excited by PZT patches at frequency P3 (unit: mm). (a) Empty; (b) 25%; (c) 50%; (d) 75%; (e) 100%.
6. Discussion
Firstly, to discuss the validity of the proposed method, the results obtained from this study are compared with previous research [], which uses four independent PZT patches for grouting compactness monitoring. It can be seen that 3-dB MAPD indices provide similar accuracy with the Root-Mean-Square Deviation indices established in []. In addition, there is still a challenge of using PZT-enabled EMI technology to determine the compactness level at 50% in a tendon duct. Secondly, compared to the separate impedance measurements for three independent PZT patches [], the proposed serially connected PZT array significantly simplifies the measurement procedure and reduces the signal process time, which provides possible solutions for practical applications. Thirdly, there is a certain deviation between the experimental and simulation results of P3 indices. The reason is partly attributed to the simplified 2D model used in this research. An improved 3D model and simulations will be considered in the future work. The future work also includes the design of a wearable sensing system with an embedded PZT array which will solve the current sensor installation problems and extend the PZT service life.
7. Conclusions
This paper demonstrates the feasibility of using the multi-sensing electro-mechanical impedance (EMI) method to monitor the grouting compactness. Three Lead Zirconate Titanate (PZT) wafers of different diameters, connected in series, were attached to different parts of the duct surface. The advantage of this method is that the impedance signature at different peak frequencies, which, corresponding to the physical properties at different locations of the duct, can be obtained through only one sweep. As the grouting compactness increases from empty to 100%, the impedance signatures at different frequency peaks changes gradually, and the grouting compactness level can be well judged by the significant change of the impedance signatures at different frequency peaks. In addition, the proposed 3-dB mean absolute percentage deviation (MAPD)-based index can be used to determine the grouting compactness quantitatively. The results from finite element analysis by using a simplified 2D model further explain the principle of monitoring of grouting compactness based on the multi-sensing EMI method. In summary, both the numerical and experimental studies validate that the multi-sensing EMI method can be used to monitor the grouting compactness. EMI methods have been widely used for concrete hydration monitoring [,,,], and future work will involve explore concrete hydration monitoring using the proposed multi-sensing EMI.
Author Contributions
D.C., L.H. and G.S. conceived the original ideas. D.C., L.H. and G.S. designed the experiments. B.G and D.C. conducted the experiments. B.G. analyzed the data under advice from L.H. and G.S. G.S. planned the outline of the paper. B.G. wrote the paper under guidance from D.C., L.H. and G.S. L.H. made critical revisions to the paper. All authors have read and agreed to the published version of the manuscript.
Funding
This research received no external funding.
Conflicts of Interest
The authors declare no conflicts of interest.
References
- Jiang, B.; Oh, K.H.; Kim, S.Y.; He, X.Y.; Oh, S.K. Technical Evaluation Method for Physical Property Changes due to Environmental Degradation of Grout-Injection Repair Materials for Water-Leakage Cracks. Appl. Sci. 2019, 9, 1740. [Google Scholar] [CrossRef]
- Yang, Y.; Peng, J.; Cai, C.; Zhang, J. Improved Interval Evidence Theory-Based Fuzzy AHP Approach for Comprehensive Condition Assessment of Long-Span PSC Continuous Box-Girder Bridges. J. Bridge Eng. 2019, 24, 12. [Google Scholar] [CrossRef]
- Li, W.; Xu, C.; Ho, S.C.M.; Wang, B.; Song, G. Monitoring Concrete Deterioration Due to Reinforcement Corrosion by Integrating Acoustic Emission and FBG Strain Measurements. Sensors 2017, 17, 657. [Google Scholar] [CrossRef] [PubMed]
- Xiao, L.; Peng, J.; Zhang, J.; Ma, Y.; Cai, C. Comparative assessment of mechanical properties of HPS between electrochemical corrosion and spray corrosion. Constr. Build. Mater. 2020, 237, 117735. [Google Scholar] [CrossRef]
- Huo, L.; Li, C.; Jiang, T.; Li, H. Feasibility Study of Steel Bar Corrosion Monitoring Using a Piezoceramic Transducer Enabled Time Reversal Method. Appl. Sci. 2018, 8, 2304. [Google Scholar] [CrossRef]
- Furusawa, A.; Takenaka, Y.; Nishimura, A. Proposal of Laser-Induced Ultrasonic Guided Wave for Corrosion Detection of Reinforced Concrete Structures in Fukushima Daiichi Nuclear Power Plant Decommissioning Site. Appl. Sci. 2019, 9, 3544. [Google Scholar] [CrossRef]
- Peng, J.; Xiao, L.; Zhang, J.; Cai, C.; Wang, L. Flexural behavior of corroded HPS beams. Eng. Struct. 2019, 195, 274–287. [Google Scholar] [CrossRef]
- Li, W.; Ho, S.C.M.; Song, G. Corrosion detection of steel reinforced concrete using combined carbon fiber and fiber Bragg grating active thermal probe. Smart Mater. Struct. 2016, 25, 045017. [Google Scholar] [CrossRef]
- Na, S.; Paik, I. Application of Thermal Image Data to Detect Rebar Corrosion in Concrete Structures. Appl. Sci. 2019, 9, 4700. [Google Scholar] [CrossRef]
- Zheng, Y.; Zhou, L.; Xia, L.; Luo, Y.; Taylor, S.E. Investigation of the behaviour of SCC bridge deck slabs reinforced with BFRP bars under concentrated loads. Eng. Struct. 2018, 171, 500–515. [Google Scholar] [CrossRef]
- Lee, K.; Jeong, S.; Sim, S.H.; Shin, D.H. A Novelty Detection Approach for Tendons of Prestressed Concrete Bridges Based on a Convolutional Autoencoder and Acceleration Data. Sensors 2019, 19, 1633. [Google Scholar] [CrossRef] [PubMed]
- Peng, J.; Hu, S.; Zhang, J.; Cai, C.; Li, L. Influence of cracks on chloride diffusivity in concrete: A five-phase mesoscale model approach. Constr. Build. Mater. 2019, 197, 587–596. [Google Scholar] [CrossRef]
- Minh, H.; Mutsuyoshi, H.; Niitani, K. Influence of grouting condition on crack and load-carrying capacity of post-tensioned concrete beam due to chloride-induced corrosion. Constr. Build. Mater. 2007, 21, 1568–1575. [Google Scholar] [CrossRef]
- Schokker, A.J.; Breen, J.E.; Kreger, M.E. Grouts for bonded post-tensioning in corrosive environments. ACI Mater. J. 2001, 98, 296–305. [Google Scholar]
- Carino, N.J.; Sansalone, M. Detection of voids in grouted ducts using the impact-echo method. ACI Mater. J. 1992, 89, 296–303. [Google Scholar]
- Jaeger, B.J.; Sansalone, M.J.; Poston, R.W. Detecting voids in grouted tendon ducts of post-tensioned concrete structures using the impact-echo method. ACI Struct. J. 1996, 93, 462–473. [Google Scholar]
- Zou, C.; Chen, Z.; Dong, P.; Chen, C.; Cheng, Y. Experimental and Numerical Studies on Nondestructive Evaluation of Grout Quality in Tendon Ducts Using Impact-Echo Method. J. Bridge Eng. 2016, 21, 9. [Google Scholar] [CrossRef]
- An, L.; Zheng, Y.-M. Experimental study of grouting voids of post-tensioned prestressing concrete structure by X-ray penetration method. J. Highway Trans. Res. Dev. 2008, 25, 92–97. [Google Scholar]
- Wang, F.; Zhang, F. Experimental Research on Detection of Duct Grouting Quality of Prestressed Corrugated Pipe with Ultrasonic. Road Mach. Constr. Mech. 2015, 2, 73–77. [Google Scholar]
- Krause, M.; Milmann, B.; Mielentz, F.; Streicher, D.; Redmer, B.; Mayer, K.; Langenberg, K.J.; Schickert, M. Ultrasonic imaging methods for investigation of post-tensioned concrete structures: A study of interfaces at artificial grouting faults and its verification. J. Nondestruct. Eval. 2008, 27, 67–82. [Google Scholar] [CrossRef]
- Dong, W.; Wu, Z.; Zhou, X.; Tan, Y. Experimental studies on void detection in concrete-filled steel tubes using ultrasound. Constr. Build. Mater. 2016, 128, 154–162. [Google Scholar] [CrossRef]
- Iyer, S.; Sinha, S.K.; Tittmann, B.R.; Pedrick, M.K. Ultrasonic signal processing methods for detection of defects in concrete pipes. Autom. Constr. 2012, 22, 135–148. [Google Scholar] [CrossRef]
- Muldoon, R.; Chalker, A.; Forde, M.C.; Ohtsu, M.; Kunisue, F. Identifying voids in plastic ducts in post-tensioning prestressed concrete members by resonant frequency of impact-echo, SIBIE and tomography. Constr. Build. Mater. 2007, 21, 527–537. [Google Scholar] [CrossRef]
- Ko, J.M.; Ni, Y.Q. Technology developments in structural health monitoring of large-scale bridges. Eng. Struct. 2005, 27, 1715–1725. [Google Scholar] [CrossRef]
- Kwon, Y.S.; Seo, D.C.; Choi, B.H.; Jeon, M.Y.; Kwon, I.B. Strain measurement distributed on a ground anchor bearing plate by fiber optic OFDR sensor. Appl. Sci. 2018, 8, 2051. [Google Scholar] [CrossRef]
- Na, D.Y.; Choi, K.W.; Kang, D.H.; Chung, W.S. Electrical resistance analysis of cement/carbon nanotube composite for pore detection of PC bridges. J. Korean Soc. Nondestruct. Test. 2018, 38, 394–400. [Google Scholar] [CrossRef]
- Naeem, K.; Kwon, Y.S.; Chung, Y.; Kwon, I.B. Bend-loss-free distributed sensor based on Rayleigh backscattering in ge-doped-core PCF. IEEE Sens. J. 2017, 18, 1903–1910. [Google Scholar] [CrossRef]
- Wu, A.; He, S.; Ren, Y.; Wang, N.; Ho, S.C.M.; Song, G. Design of a New Stress Wave-Based Pulse Position Modulation (PPM) Communication System with Piezoceramic Transducers. Sensors 2019, 19, 558. [Google Scholar] [CrossRef]
- Yu, L.; Santoni-Bottai, G.; Xu, B.; Liu, W.; Giurgiutiu, V. Piezoelectric wafer active sensors for in situ ultrasonic-guided wave SHM. Fatigue Fract. Eng. Mater. Struct. 2008, 31, 611–628. [Google Scholar] [CrossRef]
- Liu, Y.; Zhang, M.; Yin, X.; Huang, Z.; Wang, L. Debonding detection of reinforced concrete (RC) beam with near-surface mounted (NSM) pre-stressed carbon fiber reinforced polymer (CFRP) plates using embedded piezoceramic smart aggregates (SAs). Appl. Sci. 2020, 10, 50. [Google Scholar] [CrossRef]
- Chuang, H.; Luo, M.; Gong, P.; Song, G. Quantitative evaluation of bolt connection using a single piezoceramic transducer and ultrasonic coda wave energy with the consideration of the piezoceramic aging effect. Smart Mater. Struct. 2020, 29, 027001. [Google Scholar]
- Park, H.W.; Sohn, H.; Law, K.H.; Farrar, C.R. Time reversal active sensing for health monitoring of a composite plate. J. Sound Vibr. 2007, 302, 50–66. [Google Scholar] [CrossRef]
- Zhou, S.X.; Yan, B.; Inman, D.J. A Novel Nonlinear Piezoelectric Energy Harvesting System Based on Linear-Element Coupling: Design, Modeling and Dynamic Analysis. Sensors 2018, 18, 1492. [Google Scholar] [CrossRef] [PubMed]
- Wang, C.; Lai, S.K.; Wang, Z.C.; Wang, J.M.; Yang, W.; Ni, Y.Q. A low-frequency, broadband and tri-hybrid energy harvester with septuple-stable nonlinearity-enhanced mechanical frequency up-conversion mechanism for powering portable electronics. Nano Energy 2019, 64, 103943. [Google Scholar] [CrossRef]
- Ji, Q.; Ding, Z.; Wang, N.; Pan, M.; Song, G. A Novel Waveform Optimization Scheme for Piezoelectric Sensors Wire-Free Charging in the Tightly Insulated Environment. IEEE Internet Things J. 2018, 5, 1936–1946. [Google Scholar] [CrossRef]
- Kong, Q.; Fan, S.; Bai, X.; Mo, Y.L.; Song, G. A novel embeddable spherical smart aggregate for structural health monitoring: Part I. Fabrication and electrical characterization. Smart Mater. Struct. 2017, 26, 095050. [Google Scholar] [CrossRef]
- Kong, Q.; Fan, S.; Mo, Y.L.; Song, G. A novel embeddable spherical smart aggregate for structural health monitoring: Part II. Numerical and experimental verifications. Smart Mater. Struct. 2017, 26, 095051. [Google Scholar] [CrossRef]
- Jiang, J.; Jiang, J.; Deng, X.; Deng, Z. Detecting Debonding between Steel Beam and Reinforcing CFRP Plate Using Active Sensing with Removable PZT-Based Transducers. Sensors 2019, 20, 41. [Google Scholar] [CrossRef]
- Kong, Q.; Robert, R.H.; Silva, P.; Mo, Y.L. Cyclic Crack Monitoring of a Reinforced Concrete Column under Simulated Pseudo-Dynamic Loading Using Piezoceramic-Based Smart Aggregates. Appl. Sci. 2016, 6, 341. [Google Scholar] [CrossRef]
- Xu, K.; Ren, C.; Deng, Q.; Jin, Q.; Chen, X. Real-Time Monitoring of Bond Slip between GFRP Bar and Concrete Structure Using Piezoceramic Transducer-Enabled Active Sensing. Sensors 2018, 18, 2653. [Google Scholar] [CrossRef]
- Kong, Q.; Song, G. A Comparative Study of the Very Early Age Cement Hydration Monitoring Using Compressive and Shear Mode Smart Aggregates. IEEE Sens. J. 2017, 17, 256–260. [Google Scholar] [CrossRef]
- Zhou, L.; Zheng, Y.; Song, G.; Chen, D.; Ye, Y. Identification of the structural damage mechanism of BFRP bars reinforced concrete beams using smart transducers based on time reversal method. Constr. Build. Mater. 2019, 220, 615–627. [Google Scholar] [CrossRef]
- Li, N.; Wang, F.; Song, G. New entropy-based vibro-acoustic modulation method for metal fatigue crack detection: An exploratory study. Measurement 2020, 150, 9. [Google Scholar] [CrossRef]
- Wang, F.; Song, G. Bolt early looseness monitoring using modified vibro-acoustic modulation by time-reversal. Mech. Syst. Signal Process. 2019, 130, 349–360. [Google Scholar] [CrossRef]
- Watkins, R.; Jha, R. A modified time reversal method for Lamb wave based diagnostics of composite structures. Mech. Syst. Signal Proc. 2012, 31, 345–354. [Google Scholar] [CrossRef]
- Wang, F.; Chen, Z.; Song, G. Monitoring of multi-bolt connection looseness using entropy-based active sensing and genetic algorithm-based least square support vector machine. Mech. Syst. Signal Proc. 2020, 136, 106507. [Google Scholar] [CrossRef]
- Xu, J.; Wang, C.; Li, H.; Zhang, C.; Hao, J.; Fan, S. Health monitoring of bolted spherical joint connection based on active sensing technique using piezoceramic transducers. Sensors 2018, 18, 1727. [Google Scholar] [CrossRef]
- Wang, F.; Ho, S.C.M.; Huo, L.; Song, G. A Novel Fractal Contact-Electromechanical Impedance Model for Quantitative Monitoring of Bolted Joint Looseness. IEEE Access 2018, 6, 40212–40220. [Google Scholar] [CrossRef]
- Dziendzikowski, M.; Niedbala, P.; Kurnyta, A.; Kowalczyk, K.; Dragan, K. Structural Health Monitoring of a Composite Panel Based on PZT Sensors and a Transfer Impedance Framework. Sensors 2018, 18, 1521. [Google Scholar] [CrossRef]
- Xu, J.; Dong, J.; Li, H.; Zhang, C.; Ho, S.C. Looseness Monitoring of Bolted Spherical Joint Connection Using Electro-Mechanical Impedance Technique and BP Neural Networks. Sensors 2019, 19, 1906. [Google Scholar] [CrossRef]
- Wang, J.; Huo, L.; Liu, C.; Peng, Y.; Song, G. Feasibility Study of Real-Time Monitoring of Pin Connection Wear Using Acoustic Emission. Appl. Sci. 2018, 8, 1775. [Google Scholar] [CrossRef]
- Li, W.; Kong, Q.; Ho, S.C.M.; Mo, Y.L.; Song, G. Feasibility study of using smart aggregates as embedded acoustic emission sensors for health monitoring of concrete structures. Smart Mater. Struct. 2016, 25. [Google Scholar] [CrossRef]
- Di, B.; Wang, J.; Li, H.; Zheng, J.; Zheng, Y.; Song, G. Investigation of Bonding Behavior of FRP and Steel Bars in Self-Compacting Concrete Structures Using Acoustic Emission Method. Sensors 2019, 19, 159. [Google Scholar] [CrossRef] [PubMed]
- Yan, S.; Fu, J.; Sun, W.; Qi, B.; Liu, F. PZT-Based Detection of Compactness of Concrete in Concrete Filled Steel Tube Using Time Reversal Method. Math. Probl. Eng. 2014. [Google Scholar] [CrossRef]
- Jiang, T.; Kong, Q.; Wang, W.; Huo, L.; Song, G. Monitoring of Grouting Compactness in a Post-Tensioning Tendon Duct Using Piezoceramic Transducers. Sensors 2016, 16, 1343. [Google Scholar] [CrossRef]
- Jiang, T.; Zheng, J.; Huo, L.; Song, G. Finite Element Analysis of Grouting Compactness Monitoring in a Post-Tensioning Tendon Duct Using Piezoceramic Transducers. Sensors 2017, 17, 2239. [Google Scholar] [CrossRef]
- Tian, Z.; Huo, L.; Gao, W.; Song, G.; Li, H. Grouting monitoring of post-tensioning tendon duct using PZT enabled time-reversal method. Measurement 2018, 122, 513–521. [Google Scholar] [CrossRef]
- Xu, Y.; Luo, M.; Hei, C.; Song, G. Quantitative evaluation of compactness of concrete-filled fiber-reinforced polymer tubes using piezoceramic transducers and time difference of arrival. Smart Mater. Struct. 2018, 27, 035023. [Google Scholar] [CrossRef]
- Huo, L.; Chen, D.; Liang, Y.; Li, H.; Feng, X.; Song, G. Impedance based bolt pre-load monitoring using piezoceramic smart washer. Smart Mater. Struct. 2017, 26, 057004. [Google Scholar] [CrossRef]
- Park, S.; Ahmad, S.; Yun, C.B.; Roh, Y. Multiple crack detection of concrete structures using impedance-based structural health monitoring techniques. Exp. Mech. 2006, 46, 609–618. [Google Scholar] [CrossRef]
- Chen, D.; Huo, L.; Song, G. EMI based multi-bolt looseness detection using series/parallel multi-sensing technique. Smart Struct. Syst. 2020, in press. [Google Scholar]
- Shi, Y.; Luo, M.; Li, W.; Song, G. Grout compactness monitoring of concrete-filled fiber-reinforced polymer tube using electromechanical impedance. Smart Mater. Struct. 2018, 27, 055008. [Google Scholar] [CrossRef]
- Lacroix, R. Prestressed post-tensioned concrete in bulidings. In Proceedings of the Modern Applications of Prestressed Concrete—International Symposium on Modern Applications of Prestressed Concrete, Beijing, China, 3–6 September 1991. [Google Scholar]
- Liang, C.; Sun, F.; Rogers, C.A. Coupled electromechanical analysis of adaptive material systems—Determination of the actuator power-consumption and system energy-transfer. J. Intell. Mater. Syst. Struct. 1994, 5, 12–20. [Google Scholar] [CrossRef]
- Gyuhae, P.; Hoon, S.; Farrar, C.R.; Inman, D.J. Overview of piezoelectric impedance-based health monitoring and p ath forward. Shock Vibr. Dig. 2003, 35, 451–463. [Google Scholar] [CrossRef]
- Park, G.; Kabeya, K.; Cudney, H.H.; Inman, D.J. Impedance-based structural health monitoring for temperature varying applications. JSME Int. J. Ser. A Solid Mech. Mater. Eng. 1999, 42, 249–258. [Google Scholar] [CrossRef]
- Na, W.S.; Park, K.T. A cost-effective impedance-based structural health monitoring technique for steel structures by monitoring multiple areas. J. Intell. Mater. Syst. Struct. 2017, 28, 154–162. [Google Scholar] [CrossRef]
- Na, S.; Lee, H.K. A multi-sensing electromechanical impedance method for non-destructive evaluation of metallic structures. Smart Mater. Struct. 2013, 22, 095011. [Google Scholar] [CrossRef]
- Sikorski, W. Development of Acoustic Emission Sensor Optimized for Partial Discharge Monitoring in Power Transformers. Sensors 2019, 19, 1865. [Google Scholar] [CrossRef]
- Giurgiutiu, V.; Zagrai, A. Damage detection in thin plates and aerospace structures with the electro-mechanical impedance method. Struct. Health Monit. 2005, 4, 99–118. [Google Scholar] [CrossRef]
- Lin, S. Analysis on the resonance frequency of a thin piezoelectric ceramic disk in radial vibration. J. Shaanxi Norm. Univ. Nat. Sci. Ed. 2006, 34, 27–31. [Google Scholar]
- Na, W.S.; Baek, J. A Review of the Piezoelectric Electromechanical Impedance Based Structural Health Monitoring Technique for Engineering Structures. Sensors 2018, 18, 1307. [Google Scholar] [CrossRef] [PubMed]
- Bouillard, P.; Allard, J.F.; Warzee, G. Superconvergent patch recovery technique for the finite element method in acoustics. Commun. Numer. Methods Eng. 1996, 12, 581–594. [Google Scholar] [CrossRef]
- Kim, J.W.; Kim, J.; Park, S.; Oh, T.K. Integrating embedded piezoelectric sensors with continuous wavelet transforms for real-time concrete curing strength monitoring. Struct. Infrastruct. Eng. 2015, 11, 897–903. [Google Scholar] [CrossRef]
- Kim, J.; Kim, J.; Shin, K.J.; Lee, H.; Park, S. ANN-based tensile force estimation for pre-stressed tendons of PSC girders using FBG/EM hybrid sensing. Insight 2017, 59, 544–552. [Google Scholar] [CrossRef]
- Choi, S.K.; Tareen, N.; Kim, J.; Park, S.; Park, I. Real-time strength monitoring for concrete structures using EMI technique incorporating with fuzzy logic. Appl. Sci. 2018, 8, 75. [Google Scholar] [CrossRef]
- Negi, P.; Chakraborty, T.; Kaur, N.; Bhalla, S. Investigations on effectiveness of embedded PZT patches at varying orientations for monitoring concrete hydration using EMI technique. Constr. Build. Mater. 2018, 169, 489–498. [Google Scholar] [CrossRef]
© 2020 by the authors. Licensee MDPI, Basel, Switzerland. This article is an open access article distributed under the terms and conditions of the Creative Commons Attribution (CC BY) license (http://creativecommons.org/licenses/by/4.0/).