1. Introduction
In many countries, greenhouse gas emission reduction plans have been implemented and one of the promising solutions is transport electrification. Electric vehicle (EV) is a transport mean that emits zero direct greenhouse gas and produces minimal noise. Thus, the EV, whose powertrain depends on electric motors and battery storage [
1], is considered to be one of the most effective ways to reduce oil dependence and greenhouse gas emissions [
2,
3]. EV deployment has been growing rapidly over the past ten years, with the global stock of electric passenger cars passing five million in 2018, an increase of 63% from the previous year [
4]. The increased number of electric vehicles (EVs) can have a significant impact on the power distribution system [
5]. Frequent charging of EVs using the public grid causes problems in power quality as well as power system stability [
6]. Moreover, when the EV charging process is consistent with the peak load of the public grid, the impact of the charging load will be more serious [
7].
In order to reduce the impact on the public grid, researchers have developed a number of possible solutions. The swapping of batteries is researched in [
8,
9] and optimal pricing algorithm and strategy are given [
10,
11] for charging EVs. Fattahi, M et al. [
12] proposed a two-stage charging strategy for solving charging control issues of EVs, which is proved to reduce load peak and smooth transformers load profile. In Li, Q et al. [
13], a max-weight EV dispatch algorithm is proposed to control the EV charging rates, which can optimally utilize the distribution system capacity, respecting to power system’s physical limits. The author of [
5] discussed three main charging patterns of EV drivers from observations on measured data and proposed a novel schedule strategy based on “valley filling” concept to manage EV charging behaviors in order to relieve its impact on the public grid. However, the proposed methods do not make EVs to downscale the total charging power absorbed from the public grid.
Xu, Z et al. [
14] proposed a three-level (provincial level, municipal level, and charging station level) EV charging strategy that jointly optimizes system load profile and charging costs while satisfying customer charging requirements, which reduces system peak demand charging costs. A robust energy management strategy for EV charging stations is proposed in [
15]. It is based on randomized algorithms and determines a day-ahead upper bound profile on the power consumption of EV charging stations and strictly respected in real-time, guarantying the grid stability in a more efficient and less costly manner. However, no additional storage unit could be used to compensate for EV uncertainties.
Although various charging strategies have been employed to design different EV charging protocols in existing work, the current research outcomes are still limited to the interactions and power transfer between EVs and the public grid. The distributed energy generation system has attracted wide attention because of its on-site power consumption, which improves the peak performance of the public grid without increasing the grid capacity [
16,
17]. Due to its simple operation, the photovoltaic (PV) source is considered to be the most effective choice for on-site sources. However, PV power has intermittent properties, thus, an energy storage system is used to complement the PV sources to overcome and sustain PV power output [
18,
19]. Sechilariu, M et al. [
20] presents a social acceptance study of microgrids dedicated to EV charging stations, which shows that a large majority of EV drivers accept the intelligent charging station for recharging EVs powered by microgrid. Economic analysis is an essential point for decision-makers. EV charging stations empowered by a PV-based microgrid can work in self-consumption mode so that reducing the impact on the public grid. In terms of PV and storage sources, the investment and initial installation costs are high and the means to reduce these costs are to extend the service life and improve the energy conversion rate. However, in operation, the energy costs for recharging EVs are minimized by the use of renewable PV energy. Regarding the public grid, taking into account a power limit reduces the negative impact on the stability of the system. EV charging stations empowered by PV-based microgrid have been supported by government departments and achieved social acceptance [
21].
Considering the EV charging station modelling proposed in Locment, F et al. [
22,
23], this paper presents an EV charging station model empowered by a direct current (DC) microgrid. The DC microgrid aggregates EVs, a storage system, a public grid connection, and a PV source, aiming at power balancing of the system [
24], and bringing various interests Yong, J.Y. et al. [
25], such as the peak power of the public grid is lowered, the profits of the charging station are increased, and the EV drivers’ charging costs are reduced. Due to the intermittency of the PV power, the capacity limitation of the storage, and the power limitation of the public grid, the power of an EV charging station can be reduced. In addition, this power limitation of an EV charging station is variable in different situations, according to the weather and the charging time slots.
Drivers without private chargers must go to public charging stations. EV charging stations mainly includes three types of charging systems: single cable with single charger, multiple cables integrated in single charger, multiple cables with multiple chargers. The second and the third are considered suitable for installation in residential areas or near workplaces taking investment costs into consideration [
26]. Intelligently controlled charging can reduce manual maintenance, and more importantly, can meet the drivers’ needs and overcome the intermittency of the PV power. The EV charging station requires precise management taking drivers’ needs and power limitations into consideration. It should be noted that in real life, charging modes chosen by drivers are impossible to predict. The choices of the same drivers are not necessarily the same at different times and in different conditions. Meanwhile, the arrival time and its initial state of charge (
) are random. In the EV charging process, the driver has the possibility to leave at any time. When the power of the station is insufficient, the shedding operation should be considered. The restoration operation should be considered if there are EVs on waiting because of EV shedding operation.
A spatial and temporal model of EV charging demand for a rapid charging station is developed in [
27], and the charging demand is forecasted by the queueing theory with the arrival rate of discharged vehicles. The paper [
28] proposes a mathematical model for the spatial-temporal charging demand for EVs, which helps to obtain the charging spatial-temporal parameters: charging mode, charging location and charging time based on the input parameters. EV parameters include the number of EVs, EV charging power, and battery capacity. However, load shedding and load restoration are not considered in this model. The authors of [
29,
30] present a load shedding/restoration real-time optimization for DC microgrid building-integrated, which solves the load shedding and load restoration when the available microgrid power is less than the load demanded power and provides a reference for the shedding operation and restoration operation of the EV charging station. However, designing a complete power management strategy for an EV charging station remains an open issue. The motivation for the proposed power management strategy comes from the fact that charging station stability and drivers’ satisfaction are of great value for the future development of EVs, which requires managing an EV charging station in a reliable and intelligent way.
In this paper, the real-time management strategy of an EV charging station is investigated under power limitation and considering most of the drivers’ need from the perspective of combining theory with practice, in which drivers’ choices, the disconnection operation, the standby mode, the shedding operation, and the restoration operation are included. Meanwhile, the arrival time of EVs, the initial , and drivers’ choices are random, which emulates the uncertainty of the EV charging behavior, and provides drivers’ interface with the largest right to choose the charging modes. The intelligent shedding operation and the restoration operation based on the same theory as computer stack are proposed.
The main contributions of this work are:
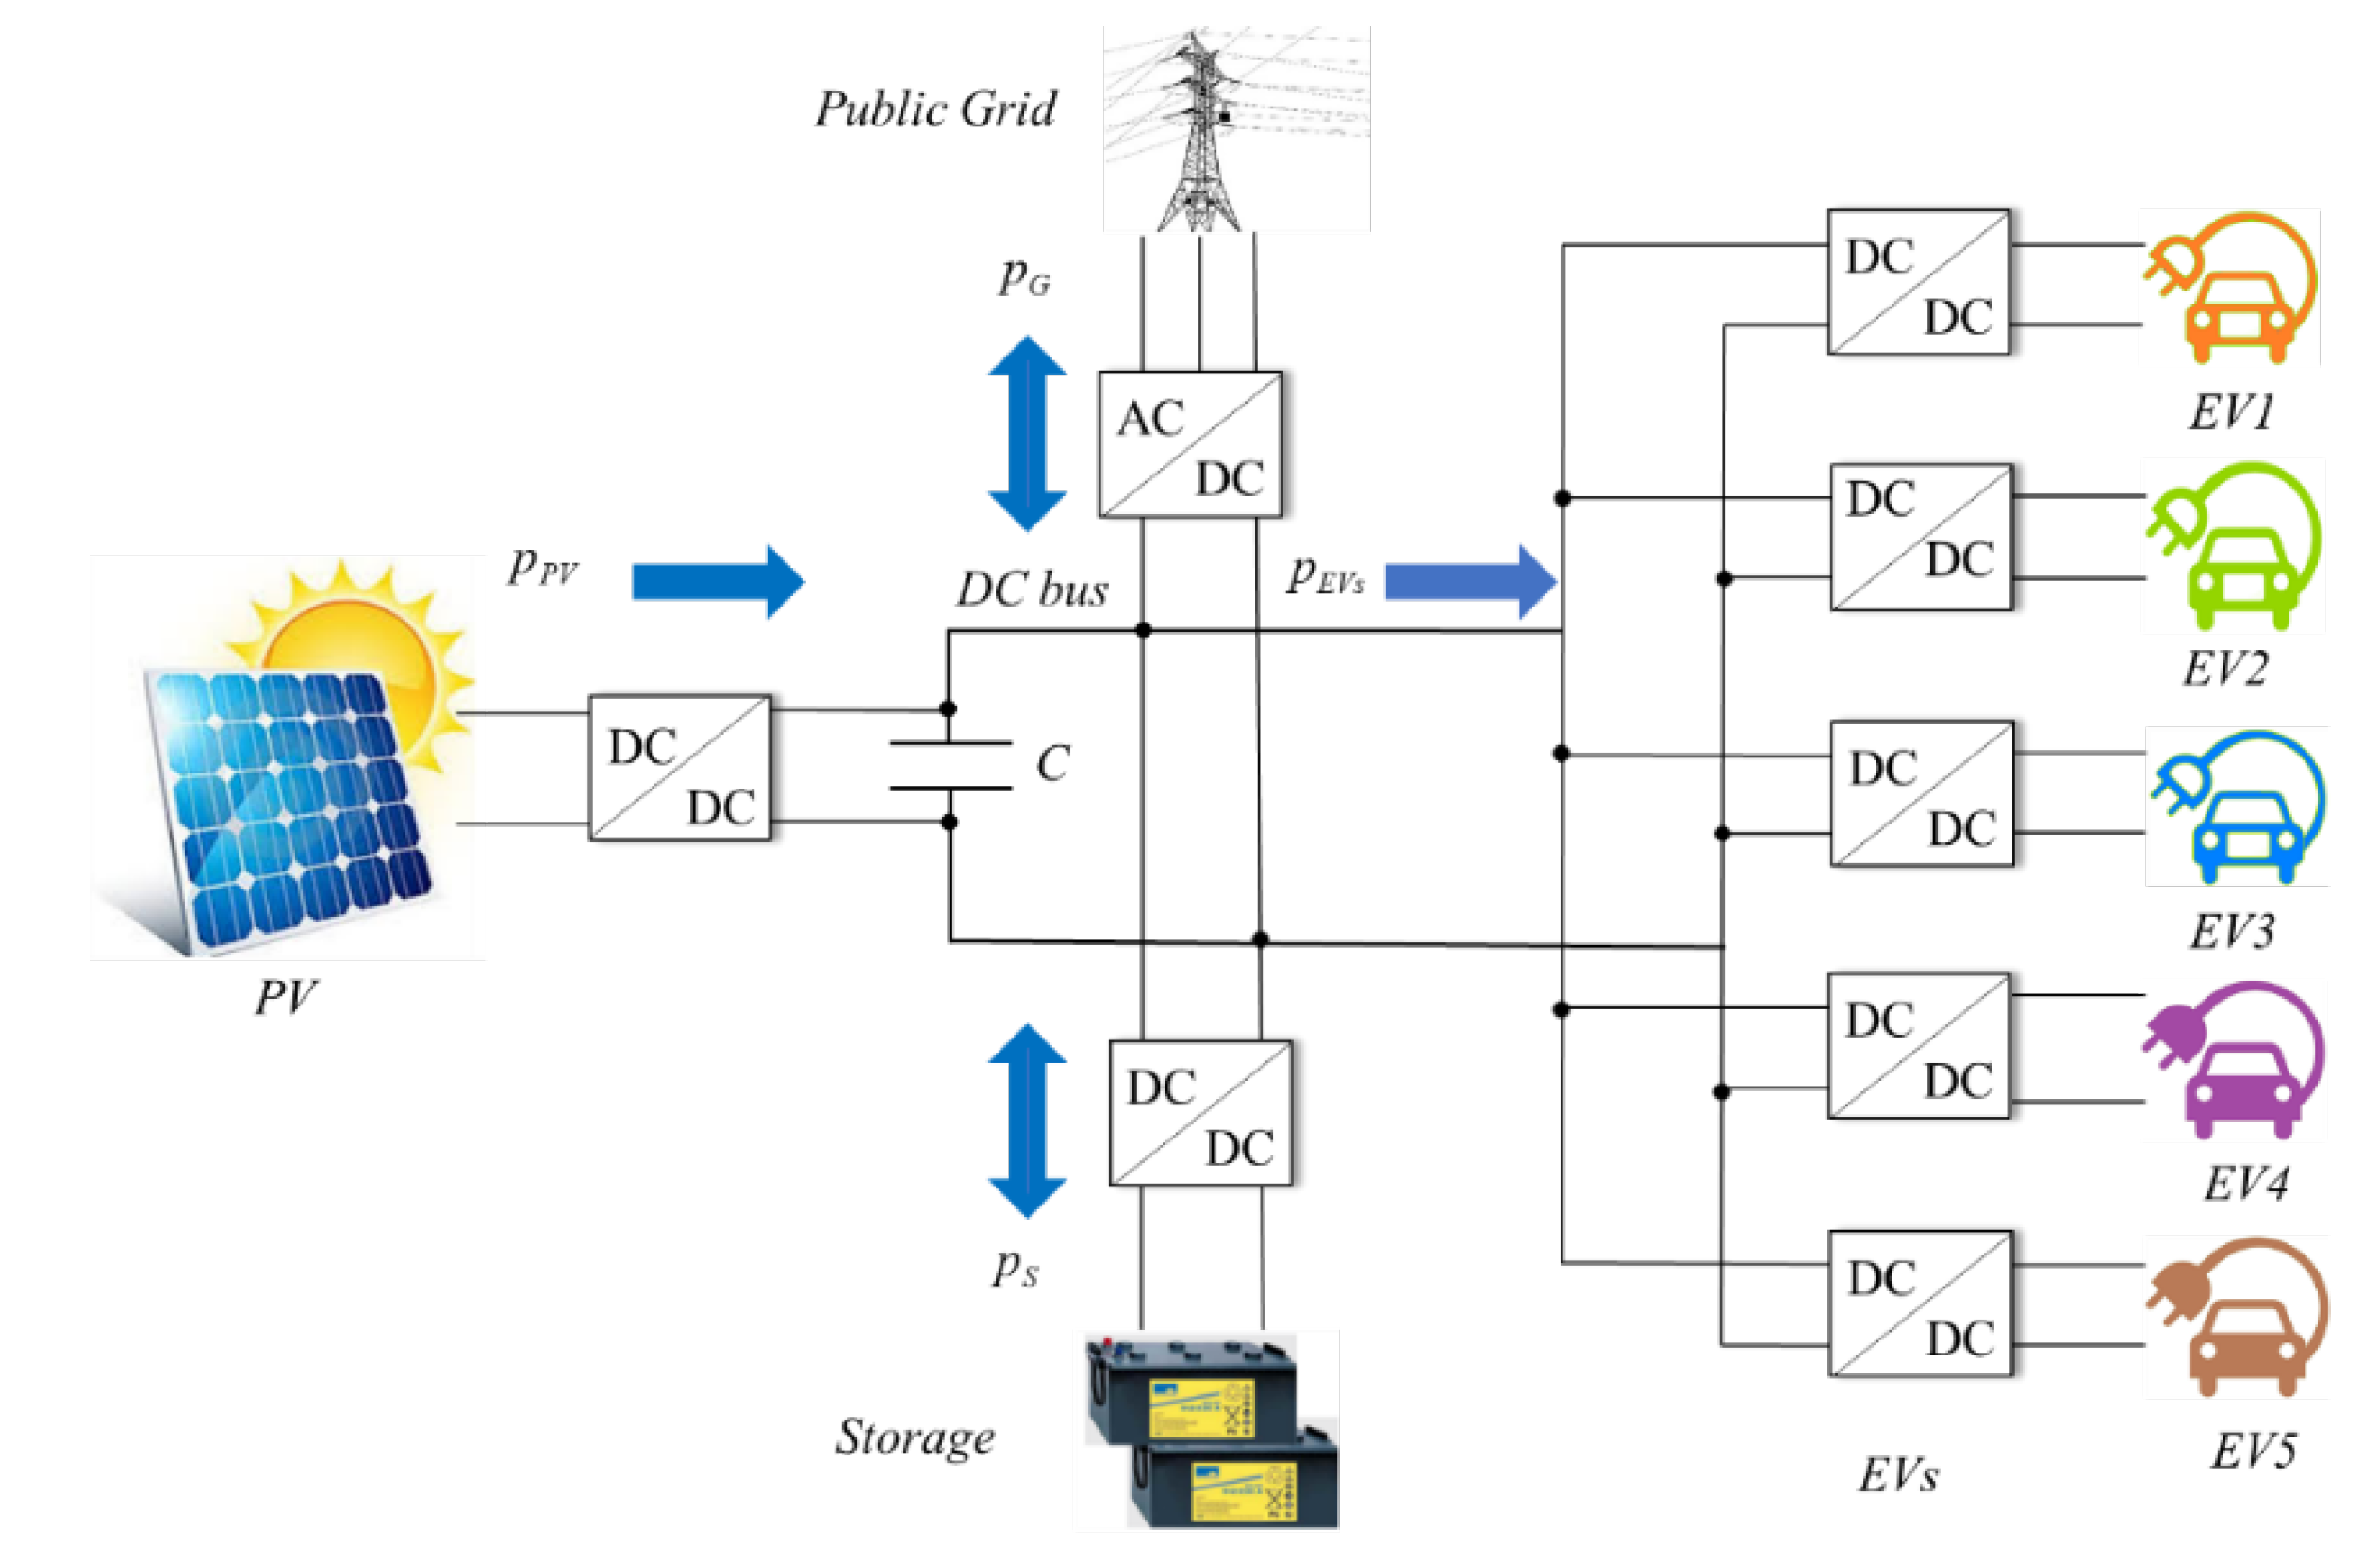
(1) This paper proposes a microgrid-based EV charging station topology. The microgrid is composed of PV sources, an electrochemical storage system, a public grid connection, five chargers associated with their parking spots, and a DC common bus. The PV system can operate in maximum power point tracking algorithm (MPPT) mode and power-constrained mode. The public grid can operate under its power constraints obtained from the public grid operator in real-time. The storage system operates under its power and capacity constraints to protect the over-charging and, over-discharging for long-life support. The five chargers in five parking spots are designed to respect the real small charging station.
(2) This paper proposes a real-time power management strategy for an EV charging station and a real-time interface. The management strategy fully considers the randomness and unpredictability of drivers’ choices based on power availability. Meanwhile, the real-time power management strategy considers the constraints of the physical components of the microgrid. The real-time interface can deal with microgrid’s sources and interact with drivers. When an EV arrives, the driver can set his/her choice through the interface according to the microgrid’s current condition.
(3) This paper deals with the uncertainties of EV drivers’ behaviors. The arrival time of EVs and the initial are randomly and non-schedulable to emulate the real condition of EV arrival. An EV charging algorithm is presented to deal with the uncertainties of EV driver behaviors. Drivers may choose three charging modes: fast mode, average mode, and slow mode. In addition, it is also considered that the driver can disconnect the EV from the charger at any time.
(4) A simple EV shedding and restoration method is applied according to the available power of the proposed microgrid and the EV power demand. The EV shedding and restoration method is based on the number of parking spots. The earliest arrival EV has the highest parking spot number. The EV with a higher parking spot number has a higher priority to be shed and a less priority to be restored.
Following the presented considerations, the topology and modelling of the studied system are described in
Section 2. The EV charging station management strategy is introduced in
Section 3. The simulation results and analyses are presented in
Section 4. Conclusions and further works are given in
Section 5.
3. EV Charging Station Management Strategy
The management strategy of the EV charging station mainly depends on the charging choice of the EV drivers. Different charging modes correspond to different charging costs. If the drivers choose the fast mode, they will save time along with relatively high fees. On the contrary, if drivers choose an average mode or a slow mode, the cost will be lower. The interaction diagram between sources and the EV charging station is shown in
Figure 5. The driver’s interface is supposed to present the choices listed in
Table 2. The available power and possible options are presented in
Table 3. The flowchart of the EV charging station is shown in
Figure 6.
3.1. Interaction with the EV Drivers
The DC microgrid’s sources provide the available power , namely power limitation for the EV charging station. The EV charging station outputs the power demand to the DC microgrid, which is a closed loop. EV charging depends on the charger priority and, in this paper, the EVs are assigned on a first-come-first-serve method.
As shown in
Figure 6, when a new EV arrives, the driver chooses a charging mode. If the power demanded by the chosen charging mode is less than the available power of the EV charging station, the EV is connected to the charger. If the power demanded by the chosen charging mode is greater than the available power of the EV charging station, the driver can choose waiting or departure. If the driver’s choice is waiting, when the available power is greater than the demanded power, the EV starts to be charged. During the charging process, the driver can disconnect the EV at any time and leave the EV charging station. Therefore, this strategy provides the driver with the possibility to choose the charging mode.
The EV charging station power limitation
is provided by
,
, and
, as expressed by Equation (11):
3.2. Disconnect EV
The EV disconnection from the charger is always possible, permitting the driver to stop charging and leave immediately.
3.3. Standby Mode
The EV charger is in standby mode if the driver chooses to wait for the power availability. In standby mode, the EV is not charged until the available power is enough for the chosen charging mode. There are two cases of standby modes. In the first case, when the EV just arrives at the station, the EV enters the initial waiting mode due to insufficient power. In the second case, the EV enters the waiting mode from the charging mode due to insufficient power, and it is a state between the EV shedding operation and EV restoration operation.
3.4. EV Shedding Operation
The human–machine interface communicates with both the power management strategy of the DC microgrid and the EV shedding and restoration algorithm by sending information about the EV priorities. The EV shedding algorithm operates following the scheme presented in
Figure 7.
In the beginning, the value of EV charging station power limitation and the power demand are read and a decision is made. If the power demand is less than the power limitation, the algorithm does not perform the EV shedding operation. Otherwise, when the power limitation is insufficient to attend the EV power demand, the EV charging station automatically performs the EV shedding operation in the order from EV5 to EV1, respecting the priority order first come first serve. For example, when is greater than , if EV5 is being charged, it enters a waiting state after shedding operation.
The simulation is designed considering that the EV number “n” is connected to charger number “n”, where “n” takes values from 1 to 5.
3.5. EV Restoration Operation
The EV restoration algorithm operates following the scheme presented in
Figure 8.
If the power demand is more than the EV charging station power limitation, the algorithm does not perform the EV restoration. Otherwise, when the power limit is sufficient to attend the EV power demand, the EV charging station automatically performs the EV restoration operation in the order from EV1 to EV5, if there are EVs on waiting connected to a charger. For example, when the is less than the , if EV1 is on waiting. Therefore, the EV1 will be charged first during the restoration operation.
4. Simulation Results and Analyses
The EV charging station management strategy simulation is performed with MATLAB/Simulink, in which the process CC/CV with three charging modes is implemented. An integral proportional controller controls the current and voltage of EVs during the EV charging process. The simulated scenario follows the described EV charging station based on DC microgrid and under power limitation. When an EV arrives, the driver chooses the charging mode. Under the power limitation, if the charging station available power is greater than the maximal power demanded by the charging mode chosen by the driver, the EV charges directly. If not, the system offers options for drivers. Five EV chargers are set in the simulation model, according to the priority order, namely from the charger 1 to charger 5, the order from top to bottom in
Figure 1.
4.1. Simulation Conditions
In order to better emulate real situations, assuming that all EVs have the same battery characteristics, the arrival time of each EV is random and different and the initial
is randomly generated in the simulation. Different drivers will take the charging price and charging time into account to choose the charging mode they need, and to emulate this action, the charging mode is also randomly generated. The parameters of the PV, EV, battery storage, public grid, and DC bus are detailed in
Table 4,
Table 5,
Table 6,
Table 7 and
Table 8, respectively.
In
Table 4,
is the estimated PV power under standard test conditions. In
Table 5,
is the EV fast charging time for a period of 0.5 h;
is the EV average charging time for a period of 1.5 h;
is the EV slow charging time for a period of 4 h. In
Table 6,
is the rated voltage of the DC microgrid storage and
is its capacity. The rated DC bus voltage was chosen as 400 V according to [
31].
4.2. Simulation Results
Figure 9 shows the real solar irradiance and PV cell temperature during the day of 28 May 2019 at Compiegne, France.
The steady DC bus voltage is 400 V and it reaches a steady state at 9:05, as illustrated in
Figure 10, which proves that the strategy works well to balance the powers.
To extend battery life, the storage current should be limited.
Figure 11 presents the storage current limitation for a value of 115 A.
Storage
and distribution coefficient
are shown in
Figure 12 where
if only the storage is working and
if only the public grid is working. If
is between 0 and 1, the power is shared simultaneously between the storage and the public grid during the current limitation periods. To reduce storage damage
upper limit is 80% and
lower limit is 20%.
The powers’ evolution is recorded, and the powers’ flow is shown in
Figure 13. PV sources work in two modes: PV-constrained production control and PV-MPPT control. When the storage and the public grid reach their upper limits, the PV production should be constrained [
32].
Furthermore, means that the storage charges EVs, represents that PV sources inject excess energy into the storage, shows that PV sources and the storage cannot provide sufficient energy for EVs so that the public grid needs to inject electricity into EVs, and illustrates that the storage has reached its upper limit so that the excess PV energy is sold to the public grid.
The results show that the power management strategy is well respected.
4.3. Drivers’ Choice
In order to better analyze the simulation results, they can be divided into three-time slots: 9:00–12:00, 12:0–15:00, and 15:00–18:00. The number of records for the EV charging station is listed in
Table 9. In the first time slot, 9:00–12:00, five EVs arrive at the station; three EVs choose to be charged respectively as fast mode, slow mode, and slow mode, while the other two EVs choose to wait. In the second time slot, 12:00–15:00, five EVs arrive at the station; four EVs choose to be charged respectively as average mode, average mode, average mode, and slow mode, while one EV chooses to wait. In the third time slot, 15:00–18:00, six EVs arrive at the station: five EVs choose to be charged respectively as average mode, average mode, average mode, slow mode, and average mode, while one EV chooses departure.
Charge evolution refers to the display , but it is not the real storage capacity of EV batteries. The original battery capacity is 100%, but it only can be used about 80%–90% taking battery safety and service life into consideration. If the charging is too full, once the charging system is faulty, it may cause a safety accident due to overcharging. The battery management system generally reserves a certain bottom line on redundancy as a guarantee, which is used for the situation that the EV is not used for a long time; it must have a small amount of residual electricity when the driver thinks that the power reaches 0%.
EV charging power and
evolution connected to charger 1 are shown in
Figure 14. The power requested by charger 1 in the first time slot with peak values close to 90 kW indicates that the charging mode chosen by drivers is fast mode; the power requested by charger 1 in the second time slot with peak values close to 30 kW indicates that the charging mode chosen by drivers is average mode. EV charging power and
evolution connected to charger 2 are shown in
Figure 15. EV charging power and
evolution connected to charger 3 are shown in
Figure 16. The curve shape of the power requested by charger 3 in the second time slot is high frequency oscillating because the EV switches frequently between waiting and charging due to the power limitation.
EV charging power and
evolution connected to charger 4 are shown in
Figure 17. The power requested by charger 4 in the first and third time slots with peak values close to 10 kW, indicates that the charging mode chosen by drivers is slow mode. The curve shape of the power in the first and third time slot is rectangular, because the EV disconnects from the charger before fully charged. The power requested by charger 4 in the second time slot suddenly becomes zero because the EV enters a waiting state due to power limitation.
EV charging power and
evolution connected to charger 5 are shown in
Figure 18. The power requested by charger 5 in the first and second time slots with peak values close to 10 kW indicates that the charging mode chosen by drivers is slow mode; the power requested by charger 5 in the third time slot with peak values close to 30 kW indicates that the charging mode chosen by drivers is average mode. The power requested by charger 5 in the first time slot suddenly becomes zero because the EV enters a waiting state due to power limitation. The curve shape of the power requested by charger 5 in the second and third time slots is high frequency oscillating because the EVs switch frequently between waiting and charging due to power limitation.
4.4. Disconnection
In the first and third time slots of
Figure 17, the EVs connected to the charger 4 disconnect from the charger at 11:15 and 17:15 respectively, because the drivers have an emergency and need to leave immediately, and the charging evaluation values are 76.7% and 71.8% respectively. In the first and second time slots of
Figure 18, the EVs connected to the charger 5 disconnect from the charger at 11:15 and 14:15 respectively, before being fully charged. Their charging evaluation values are 82.8% and 78.4% respectively. The other EVs have completed the full charging process and no EVs leave before fully charged.
4.5. EVs on Waiting
In the first time slot of
Figure 15, and in the first and second time slots of
Figure 16, the charging evaluation values of EVs are constant at the beginning of the period, because the initial choices of the EVs are waiting.
In the second time slot of
Figure 16, in the second time slot of
Figure 17, and in the first, second, and third time slots of
Figure 18, when
is less than
, the EV connected to chargers enter a waiting state.
4.6. EV Shedding Operation
During the charging process of an EV, the EV enters a waiting state due to a power limit, which is called EV shedding operation. When the power is insufficient, shedding priority is according to the number from EV5 to EV1, in which situation, the is constant. In the first and third time slots, the EV connected to charger 5 is shed because of insufficient power. In the second time slot, the EVs connected to charger 5, charger 4, and charger 3 are shed in sequential order because of insufficient power.
4.7. EV Restoration Operation
After EV shedding operation, there are EVs on waiting. When the power is available, restoration priority is from EV1 to EV5, in which situation the EV continues to be charged with the original chosen charging mode, and the is continuous. In the first and third time slots, the EVs connected to charger 5 switches back and forth between shedding operation and restoration operation. In the second time slot, the EVs connected to charger 3, charger 4, and charger 5 are recharged in sequential order when the power is sufficient.
4.8. Recording of EV Charging
It is necessary that the EV charging station has the function of recording data in real-time, which will provide a data base for adjustment and future planning of the station. The recording of EV charging station is shown in
Figure 19. It can be seen that N1, N2, N3, N4, and N5 are the number of EVs arrived at the station, the number of EVs being charged, the number of EVs fully charged, the number of EVs on waiting, and the number of departing EVs, respectively.
One notes that N1 is the sum of N2, N3, N4, and N5. The equation is expressed by Equation (12):
The results show that most of the EVs arrived at the charging station choose to be charged. When the available power of the charging station is insufficient, the drivers are more inclined to wait or choose other charging modes. Thus, the current planning of this charging station is reasonable.
The management strategy has a strong applicability in real life. At the physical level, EV charging stations based on a DC microgrid, consisting of PV source, storage system, public grid connection, are easy to design and implement in shopping malls, school parking lots, community parking lots, etc. The PV-based EV charging station takes full advantage of renewable energy that PV sources provide, improves peak performance of the public grid without increasing the grid capacity and, most importantly, it has succeeded in achieving social acceptance during a social acceptability study [
20,
21]. In addition, the proposed power management deals with the uncertainties of EV driver’s behavior considering its arbitrary and random choices through the human–computer interface, which considers most of the drivers’ choices and is easy to be accepted by users.


