Article

Numerical Investigation on Aerodynamic Performance of SCO2 and Air Radial-Inflow Turbines with Different Solidity Structures

1
MOE Key Laboratory of Thermo-Fluid Science and Engineering, School of Energy and Power Engineering, Xi’an Jiaotong University, Xi’an 710049, China
2
Shaanxi Engineering Laboratory of Turbomachinery and Power Equipment, School of Energy and Power Engineering, Xi’an Jiaotong University, Xi’an 710049, China
*
Author to whom correspondence should be addressed.
Appl. Sci. 2020, 10(6), 2087; https://doi.org/10.3390/app10062087
Submission received: 24 February 2020 / Revised: 4 March 2020 / Accepted: 9 March 2020 / Published: 19 March 2020

Abstract

:

Featured Application

This work can provide the design reference of rotor solidity for SCO2 and air radial-inflow turbines as well as a new splitter structure to improve the performance of low solidity case.

Abstract

Supercritical carbon dioxide (SCO2) is of great use in miniature power systems. It obtains the characteristics of high density and low viscosity, which makes it possible to build a compact structure for turbomachinery. For a turbine design, an important issue is to figure out the appropriate solidity of the rotor. The objective of this research is to present the aerodynamic performance and provide the design reference for SCO2 and air radial-inflow turbines considering different solidity structures. For the low solidity case of SCO2 turbine, new splitter structures are proposed to improve its performance. The automatic design and simulation process are established by batch modes in MATLAB. The numerical investigation is based on a 3D viscous compressible N-S equation and the actual fluid property of SCO2 and air. The distributions of flow parameters are first presented. Rotor blade load and aerodynamic force are then thoroughly analyzed and the aerodynamic performances of all cases are obtained. The SCO2 turbine has larger power capacity and higher efficiency while the performance of the air turbine is less affected by rotor solidity. For both SCO2 and air, small solidity can cause the unsatisfactory flow condition at the inlet and the shroud section of the rotor, while large solidity results in the aerodynamic loss at the trailing edge of rotor blade and the hub of rotor outlet. A suction side offset splitter can greatly improve the performance of the low solidity SCO2 turbine.

1. Introduction

In recent years, the study of supercritical carbon dioxide (SCO2) Brayton cycle and its components has attracted lots of attention. Various heat sources including solar power [1,2,3,4,5], nuclear power [6,7] and waste-heat utilization [8] are employed. As the key component in a Brayton cycle, the design and characteristics of turbomachinery deserve to be investigated in depth. SCO2 has a critical point around room temperature (7.38 MPa, 304.25 K). As a working fluid in a power cycle, SCO2 has a large number of advantages. First of all, it is environmentally friendly and the critical point is easy to reach. Hence, it is safe and cheap in industrial applications. Additionally, the high density and low viscosity of SCO2 can result in the high efficiency and compact mechanical structure of turbines and compressors in the power system [9,10,11]. The rapid changes of density near the critical point can reduce the compressor work and lead to a higher heat transfer coefficient in heat regenerators and precoolers [12]. Finally, there is little phase change in a SCO2 power cycle. Thus, it needs fewer valves and no condenser, which results in a concise cycle.
To realize this proposed technology, Sandia National Laboratory has developed several SCO2 power cycles including various power class [13]. The radial turbine and compressor test rigs were established to investigate the key techniques. However, the outcomes of efficiency and rotation speed were far from the expectations. Hence, the design method and flow mechanism need to be further considered before the commercialization of this technique. A traditional design process of the turbomachinery is time-consuming. It needs several engineers to conduct multiple numerical calculation to obtain the case of best performance. Hence, it is vital to establish an automatic process in order to save the manpower and accelerate the design.
The flow conditions are rather complex in turbomachinery, which results in the difficulty of turbine design. In the past years, the research of design, influence of key parameters and optimization are widely covered [14,15,16,17]. Solidity, as a design parameter, plays an important role in turbine design. It was proposed by Zweifel [18] in 1945, in which he estimated the optimum solidity for turbines with large angular deflection. However, Horlock [19] pointed out that the prediction of Zweifel’s optimum solidity correlation was limited to the outlet flow angle of the blade. In the past investigations, the influence of solidity on axial wind turbine performance occupied the vast majority. Chen et al. [20] investigated the effects of flanged diffusers on rotor performance of small wind turbines with different rotor solidities and wind speeds. Mohamed [21] studied the effect of the turbine solidity and the usage of hybrid system between drag and lift types on small wind turbine performance numerically and experimentally. Eboibi et al. [22] experimentally investigated the influence of solidity on the performance and flow field aerodynamics of vertical axis wind turbines at low Reynolds numbers. Gao et al. [23] thoroughly analyzed the effects of rotor solidity and leakage flow on the unsteady flow in axial turbine.
Some researches focus on the solidity of stator vane in radial-inflow turbines. Simpson et al. [24] conducted the numerical and experimental study of the performance effects of varying vaneless space and vane solidity in radial turbine stators. Pereiras et al. [25] concentrated on the influence of the guide vane solidity on the performance of a radial impulse turbine with pitch-controlled guide vanes. Dong et al. [26] evaluated the effects of outlet blade angle, solidity, blade height, expansion ratio, and surface roughness on the stator velocity coefficient.
To sum up, the stator solidity has been considered in radial-inflow turbines while the choice of rotor solidity is rarely investigated, especially its impact in a SCO2 turbine. As the working fluid approaches the critical point at the outlet of a SCO2 turbine and the value of solidity tends to decrease along the flow direction in a radial-inflow rotor, the concentration of rotor solidity is needed. We establish an automatic design process by batch modes in MATLAB 2019b of MathWorks (Natick, MA, USA) with an accurate numerical simulation method of radial-inflow turbines. Several solidity structures are considered and new splitter structures are proposed and analyzed to improve the performance of low solidity case. The distributions of flow parameters are first presented. Rotor blade load and aerodynamic force are then thoroughly analyzed and the aerodynamic performances are obtained. The design reference of rotor solidity for SCO2 and air turbines are provided.

2. Modeling

2.1. Establishment of Automatic Design Process

To accelerate the design process, an automatic design and calculation process of the radial-inflow turbine is firstly established by calling batch modes in MATLAB. The flow chart is shown in Figure 1. The initial geometric model of the turbine is obtained based on design parameters, such as inlet pressure and temperature, outlet pressure, output power, rotation speed, etc. Then, the rotor solidity and working fluid used in the calculation are determined. The macro files of batch mode are called by MATLAB to execute the process in Workbench BladeGen, Turbogrid, CFX, and CFD-Post. The modeling, discretization, numerical simulation and post-processing are then completed. Finally, the program repeats this procedure to obtain the results of the required different cases.
The thermodynamic design is based on the conservation of momentum, mass and energy equations. The fluid properties of SCO2 and air are obtained from NIST REFPROP. The basic principal for the thermodynamic design is to ensure the highest efficiency at a given rotation speed [27]. Due to space limits, the following formulas are some of the calculations in the thermodynamic design program. The influence of friction loss at the wheel back and the flow loss in the volute are ignored. The loss producing by nozzle and impeller are considered. Hence, the isentropic efficiency can be estimated as Equation (1):
η is = 1 ( 1 α ) ( 1 ζ 2 ) ( ω out C is ) 2 ( 1 ψ 2 1 )
where α is the degree of reaction. ζ and ψ are the velocity coefficient of nozzle and impeller respectively, which represents the loss in nozzle and impeller. We adopt 0.96 for ζ and 0.84 for ψ. ωout and Cis are, respectively, the relative velocity at turbine outlet and the isentropic ideal velocity.
To gain the best isentropic efficiency in the thermodynamic design, we can correspondingly acquire the degree of reaction, the velocity ratio and etc. For example, the degree of reaction is chosen as 0.47 and the velocity ratio is 0.67. After the determination of design parameters, we can calculate the geometry parameters. For example, the impeller diameter is acquired by Equation (2):
D = 60 ν in π r
where r is the rotating speed, which is 50,000 rpm in this case. vin is the linear velocity at the inlet of the impeller.
The blade height at the turbine inlet can be calculated as Equation (3):
l in = m ˙ π D ρ in ω in
where m ˙ is the mass flow rate, ρin and ωin are, respectively, the density and the relative velocity at the rotor inlet.
The area of turbine outlet is calculated in Equation (4):
A out = m ˙ ρ out ω out sin β out
where βout is the flow angle at turbine outlet, ρout and ωout are, respectively, the density and the relative velocity at rotor outlet. With the empirical coefficients regarding to impeller diameter, the average outlet diameter and axial length are determined. Then we can obtain the geometric parameters of meridian plane for the rotor.
The geometric parameters are calculated by estimating the velocity at both inlet and outlet of the stator and the rotor. To compare the difference of air and SCO2, we firstly conduct the thermodynamic design using SCO2 and then, estimate the working condition with air to conduct the numerical simulation with the same radial-inflow turbine model.

2.2. Research Model

The working fluid first flows into the nozzle flow passage. In the nozzle, the pressure gradually declines and accordingly, the velocity increases. Figure 2 presents the geometry model of nozzle. A straight blade with uniform geometry angles from hub to shroud direction is adopted due to the low blade height. The geometry of nozzle is identical in all conditions with different solidity structures. The red part represents high temperature and pressure while the blue part stands for lower temperature and pressure. Detailed geometric parameters, i.e., the diameter of inlet and outlet, the blade height, and the geometry angle of the inlet and outlet are given in Figure 2.
After the process in the nozzle, the working fluid enters from a radial direction into the impeller. In this process, SCO2 expands in the impeller and exits from axial direction. The backward bent vane is adopted to guarantee the designed velocity triangle and a shrouded impeller is used to promote the aerodynamic efficiency. Figure 3 shows the geometry model of impeller, taking blade number 12, as an example. After the calculation of impeller diameter, blade height of inlet and outlet, external diameter of outlet and axial length, the arc to connect each point is determined by design experience. In Figure 3, the red arrow stands for high temperature and pressure while the blue arrow represents relatively low temperature and pressure. Brennen [28] gave the definition of solidity for radial pumps. Likewise, we define the solidity with cord length and pitch in a radial-inflow turbine. These parameters are obtained in Workbench BladeGen while modelling. In this research, the rotor solidity is defined by c/s, where c is the cord length of the rotor blade and s is the trailing edge pitch at the outlet of the impeller, as shown in Figure 3.
The concrete geometric parameters of impeller are shown in Table 1. Generally, the number of nozzle blades and the number of impeller blades should be relatively prime for the consideration of reducing the exciting force of turbomachinery. Hence, while the nozzle blade number is designed as 13, we choose five kinds of rotor solidity, which are realized by changing the rotor blade numbers. They are even from 8 to 16. The large range of rotor solidity can present its effect on aerodynamic performance.
High solidity usually results in large weight and axial thrust of the wheel. In some application environments such as aerospace and warships, the weight of the wheel is limited. The overlarge axial thrust and the trans-critical problem of the high solidity case also need consideration in the turbine design. Hence, for the low solidity case of SCO2 turbine mentioned above, we try to establish a new structure to improve the flow condition at the leading edge of the rotor blade. A splitter, which is normally used in centrifugal compressors, is introduced here. We establish a pressure side (ps) offset splitter and a suction side (ss) offset splitter to compare with the normal one, as shown in Figure 4. The offset value is 20% of the local pitch, that is, the distance between the splitter blade the closest main blade is 30% of the local pitch.

3. Methodology

A 3D viscous compressible CFD simulation is carried out in commercially-available software CFX 18.2. In this research, the computing resource of an i7-3770 CPU and eight threads is used. In order to obtain the specific characteristics of SCO2 and air radial-inflow turbines with different solidity structures, an accurate numerical simulation model needs to be established. The following sections introduce the validation of turbulence model, working fluids as well as the discretization method used in numerical calculations.

3.1. Validation of Computational Method

In CFD simulation, the conservation equation of mass, energy and momentum are solved by Reynolds-Averaged Navier–Stokes (RANS) method. In this investigation, a compressible and steady turbulent flow is simulated. The equations can be expressed as below:
( ρ u i ) x j = 0
( ρ u i u j ) x j = p x i + ( μ x i x j ρ u i u j ¯ ) x j + S i
( ρ u i T ) x j = ( Γ T x j ρ u i T ¯ ) x j + S
where u stands for velocity components, x is displacement term, Si and S are, respectively, the source term of momentum and inner heat. To handle the governing equations of turbulent flow, the RANS method is adopted. Hence, a turbulence model is needed for the calculation of Reynolds stress.
To discretize the governing equations, an element-based finite volume method is adopted. TurboGrid 18.2 is employed to generate the hexahedral meshes in all fluid domains, which correspond to lower truncation error. To obtain the best accuracy and the influence of the wake flow, a full cycle of the impeller and the nozzle is adopted in the investigation. Figure 5 shows the mesh of the fluid domain including the partially enlarged view of the leading edge of the nozzle, the rotor-stator interface and the trailing edge of the rotor. O-type mesh is applied around the rotor blades and nozzle blades. The mesh of the boundary layers has been densely generated to adapt the turbulence model. Concretely, the discretization in the boundary layer area ensures the averaged solver y+ is set around 1as recommended in the CFX User Guide.
For the determination of near-wall velocities, the automatic wall function is chosen. Total energy equation including the viscous work term is used for energy conservation. A high-resolution advection scheme of CFX is used. The boundary conditions employed in this research are listed in Table 2. We use total pressure and temperature as inlet boundary conditions. To simulate the inlet volute, the flow angle at the nozzle inlet is set as 45°. The static pressure is used for outlet boundary condition while the rotation speed is set as 50,000 rpm for the rotor. A frozen-rotor method is adopted to handle the interface between stator and rotor. An automatic domain initialization method is used.
The computation is considered converged when RMS residuals are below 10–5. In the meantime, we evaluate the mass flow rate of the turbine inlet and outlet. If they are equal and slightly fluctuate with each iteration step, the case reaches convergence.
In order to validate the method of CFD simulation, we choose a similar radial-inflow turbine working with air from Deng et al. [29], which possesses experimental results. A CFD simulation with Deng’s model and boundary conditions under design point is conducted. Four common turbulence models for turbomachinery simulation including k-ε, RNG k-ε, k-ω, and SST k-ω are adopted and the validation results are given in Figure 6. It can be seen from Figure 6 that compared with the results in [29], the mass flow rate and efficiency calculated by k-ε models are higher. Compared with the experiment, we adopt a shrouded impeller in the design. The leakage flow derived from tip clearance is not taken into account. Besides, due to the simplification of the research model, the leakage flow between the nozzle and impeller is not considered in the numerical simulation. These cause the simulated mass flow rate higher than Deng’s experiment. Comparing four turbulence models, SST k-ω turbulence model has the smallest error. The relative errors of the mass flow and efficiency are, respectively, 3.9% and −0.12%. Therefore, we use the SST k-ω turbulence model in the CFD analysis. The turbulence model was first proposed by Menter [30] and it was based on the k-ε and k-ω turbulence models. This model can accurately simulate the wall region and does not acquire high mesh quality as in the k-ω turbulence model.
To guarantee the accuracy of the numerical simulation, a mesh independence test has been conducted under the condition of solidity 11.94. Grid convergence index (GCI) measurement is employed, which was proposed by Roache [31] to provide an objective asymptotic approach to quantification of uncertainty of grid convergence. It is based on the theory of generalized Richardson Extrapolation and involves the comparison of discrete solutions at different grid resolutions. The method of GCI is commonly employed in the grid refinement study [32].
To calculate the GCI, three mesh sizes are used with a constant refinement ratio r = 1.2. The value of Fs is chosen 1.25 as suggested by Roache [31]. The results are presented in Table 3. The convergence condition is evaluated by the convergence ratio R = (f3f2)/(f2f1), which is 0.625 considering mass flow rate and 0.333 considering output power. Hence, it corresponds to monotonic convergence in this case. The small value of GCI indicates the reduced dependency of results on mesh size. When the total element number is 3,354,000, GCI12 for mass flow rate and output power are below 1%. Hence, the fine mesh scheme (f1) is accurate to conduct the numerical simulation of all cases.

3.2. Validation of Fluid Property

For the working fluid air, the fixed composition mixture is set up in CFX 18.2 with the state equation of Peng Robinson. This option is commonly used in CFX to model the real gas properties for gas density, enthalpy, etc.
In the simulation of a SCO2 turbine, it is of great importance to precisely obtain the fluid property of SCO2. For the simulated condition, the state of working fluid lies in the supercritical region. To simulate the fluid property precisely, we use the real gas property (RGP) format table to implement the sharply variable density and specific heat capacity near the critical point. The tabulated pressure and temperature region are, respectively, 7 MPa to 16 MPa and 300 K to 600 K in order to simulate the fluctuated state parameter during the converging process.
The parameters for the RGP table are obtained from NIST REFPROP, which is widely referred to as a fluid property database [33]. MATLAB is used to generate the RGP format file with a predefined temperature and pressure range. Figure 7 gives the density variation with the temperature and pressure range for the SCO2 turbine.
As shown in Figure 7, the density of the working fluid changes sharply around the critical point. The CFX solver calculates the SCO2 property by bilinear interpolation between parameter points. Hence, we choose to densely generate the RGP table near the critical point for the balance of accuracy and computation time. The region is shown in the dashed box in Figure 7. For the temperature range, we adopt a gradient of 2 K for 300–350 K while for 350–600 K, we use a gradient of 5 K. For the pressure range, we utilize 0.1 MPa as a gradient between 7–8 MPa while 0.2 MPa as a gradient is employed between 8–16 MPa. Compared with 2 K for all temperature range and 0.1 MPa for all pressure range, the computation time is effectively reduced by 20.4%.
The accuracy of RGP format table using in ANSYS CFX has been validated by Odabaee et al. [34] and Ameli et al. [35]. We conduct a validation in the selected range of this research. Three points are chosen to validate the precision of RGP file, which are, respectively, the inlet, outlet and the interface between stator and rotor. We consider four parameters to test the relative error between CFX calculation and data from NIST, which are density, enthalpy, Cp and dynamic viscosity. As shown in Table 4, the maximum relative error is 0.009%. Hence, the RGP table is sufficiently accurate for the simulation of SCO2 working fluid.

4. Results and Discussion

After the automatic design calculation by batch modes in MATLAB, we obtain the aerodynamic performance of cases with different solidity structures and working fluid. In this chapter, we first present the flow parameters to understand the flow mechanism of different solidity structures and working fluid. Then the rotor blade load and aerodynamic force are compared and analyzed. Finally, the aerodynamic performance is presented to estimate the best solidity and the effectiveness of new splitter structures are tested for low solidity case.

4.1. Distributions of Flow Parameters

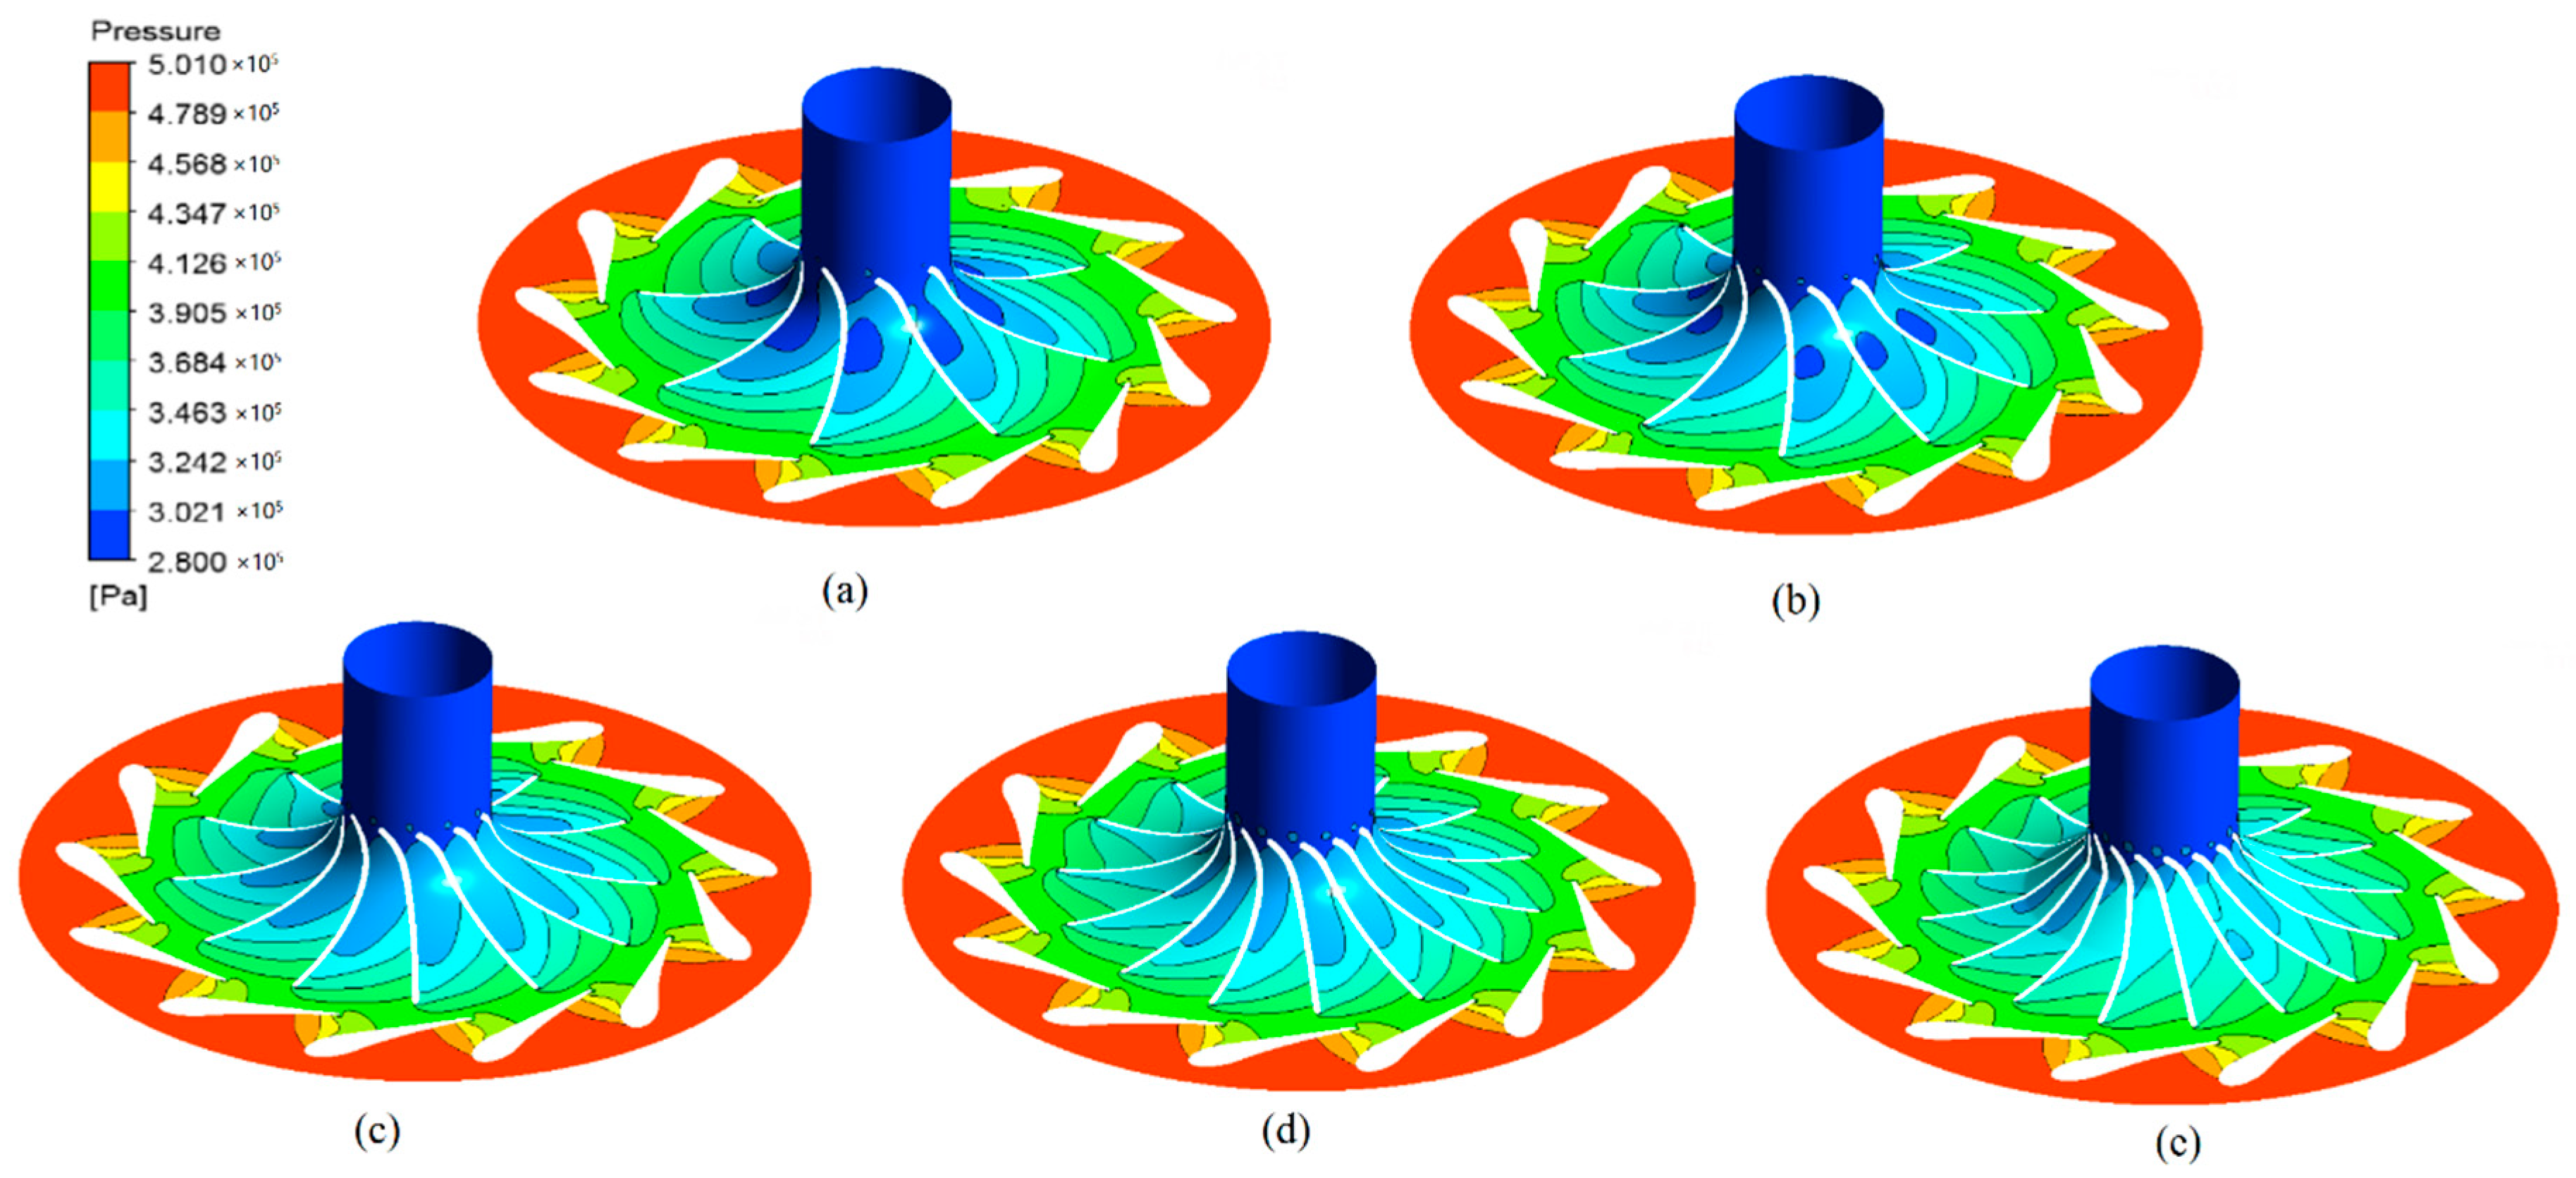
4.1.1. Pressure Distribution

The pressure distribution reveals the power capacity of the turbine. In this section, the pressure distribution of the SCO2 and air turbine are presented and compared. Figure 8 shows the pressure distribution at the mid-span of the SCO2 radial-inflow turbine. In a SCO2 radial-inflow turbine, the rotor solidity gradually increases along the flow direction as the pitch at leading edge is much wider than that of trailing edge. As shown in Figure 8, when the rotor solidity is the minimum, the suction side of the rotor blade exists an apparent low-pressure region and the pressure distribution is non-uniform. With the rotor solidity increasing, the low-pressure region tends to decrease and the working capacity for each blade decreases. The diminishing space of rotor flow passage restricts the flow of SCO2 fluid. Hence, the expansion of working fluid tends to be light in (d) and (e). Condition (c) has a most uniform pressure distribution and the working capacity of blades is satisfying. In condition (a) and (b), the large space at the inlet of the rotor causes the disorder of the pressure distribution.
As is known to all, when the temperature or pressure is around critical point, the physical property of SCO2 can be sharply variable, especially for density and specific heat capacity. In the turbomachinery with working fluid SCO2, it is a priority problem to minimize the region where SCO2 transforms from a supercritical state to a subcritical state to obtain stable operation. We term the transformation from the supercritical state to the subcritical state as a trans-critical phenomenon. Hence, Figure 9 presents the trans-critical phenomenon at the trailing edge. It is a vital position in radial-inflow turbine to analyze.
As Figure 9 presents, the trans-critical phenomenon is obvious at the trailing edge of the SCO2 radial-inflow turbine. In condition (a) and (b), the region area is rather small and it concentrates on the tip of the rotor blade. As the rotor solidity increases, the pitch at trailing edge decreases. Hence, the flow area of SCO2 reduces, which distinctly extends the area of trans-critical region. As we can see, in condition (c), the minimum pressure along the fluid domain is below 6.5 MPa. With the further decrease of flow area, trans-critical region also appears at the root of rotor blade. In (d) and (e), there exists a local constriction at the trailing edge of rotor blade, which causes an entire trans-critical region at the pressure side of trailing edge.
For comparison, Figure 10 shows the pressure distribution at the mid-span with air as working fluid. Likewise, when the rotor solidity is the minimum, the pressure gradient is not uniform in the middle of the flow passage. A low-pressure region presents at the suction side of rotor blade in Figure 10a,b. In (c) and (d), the pressure distribution is uniform while in (e), the pressure difference between suction side and pressure side of the blade decreases. It is worth mentioning that in an air turbine, the low-pressure region at the suction side of rotor trailing edge vanishes. There is no trans-critical phenomenon in the air turbine.
The averaged pressure along spanwise location at turbine outlet are presented in Figure 11, where (a) stands for SCO2 and (b) is air. When the value of spanwise location is 1, it corresponds to the shroud while value zero corresponds to the hub. As Figure 11a presents, the distribution of the averaged pressure along spanwise location at turbine outlet is quite different with the change of rotor solidity in a SCO2 turbine. Especially when the solidity is 15.92, the power capacity at the different cross-section of the blade varies a great deal. The local constriction at the hub results in more pressure loss and it corresponds to the lowest pressure. While at the shroud, the expansion of working fluid is incomplete, which results in the highest pressure. In general, the cross-section of the hub has the highest power ability. Comparing five kinds of solidity, the pressure along spanwise tends to be more uniform as the solidity decreases. This is because higher solidity greatly disturbs the flow between blades, which is not beneficial for the safe operation of the turbine. In Figure 11b, the tendency is similar in an air turbine except that the pressure along spanwise is less affected by solidity. The working fluid air has no sharp change of fluid property at the outlet when the solidity is high.

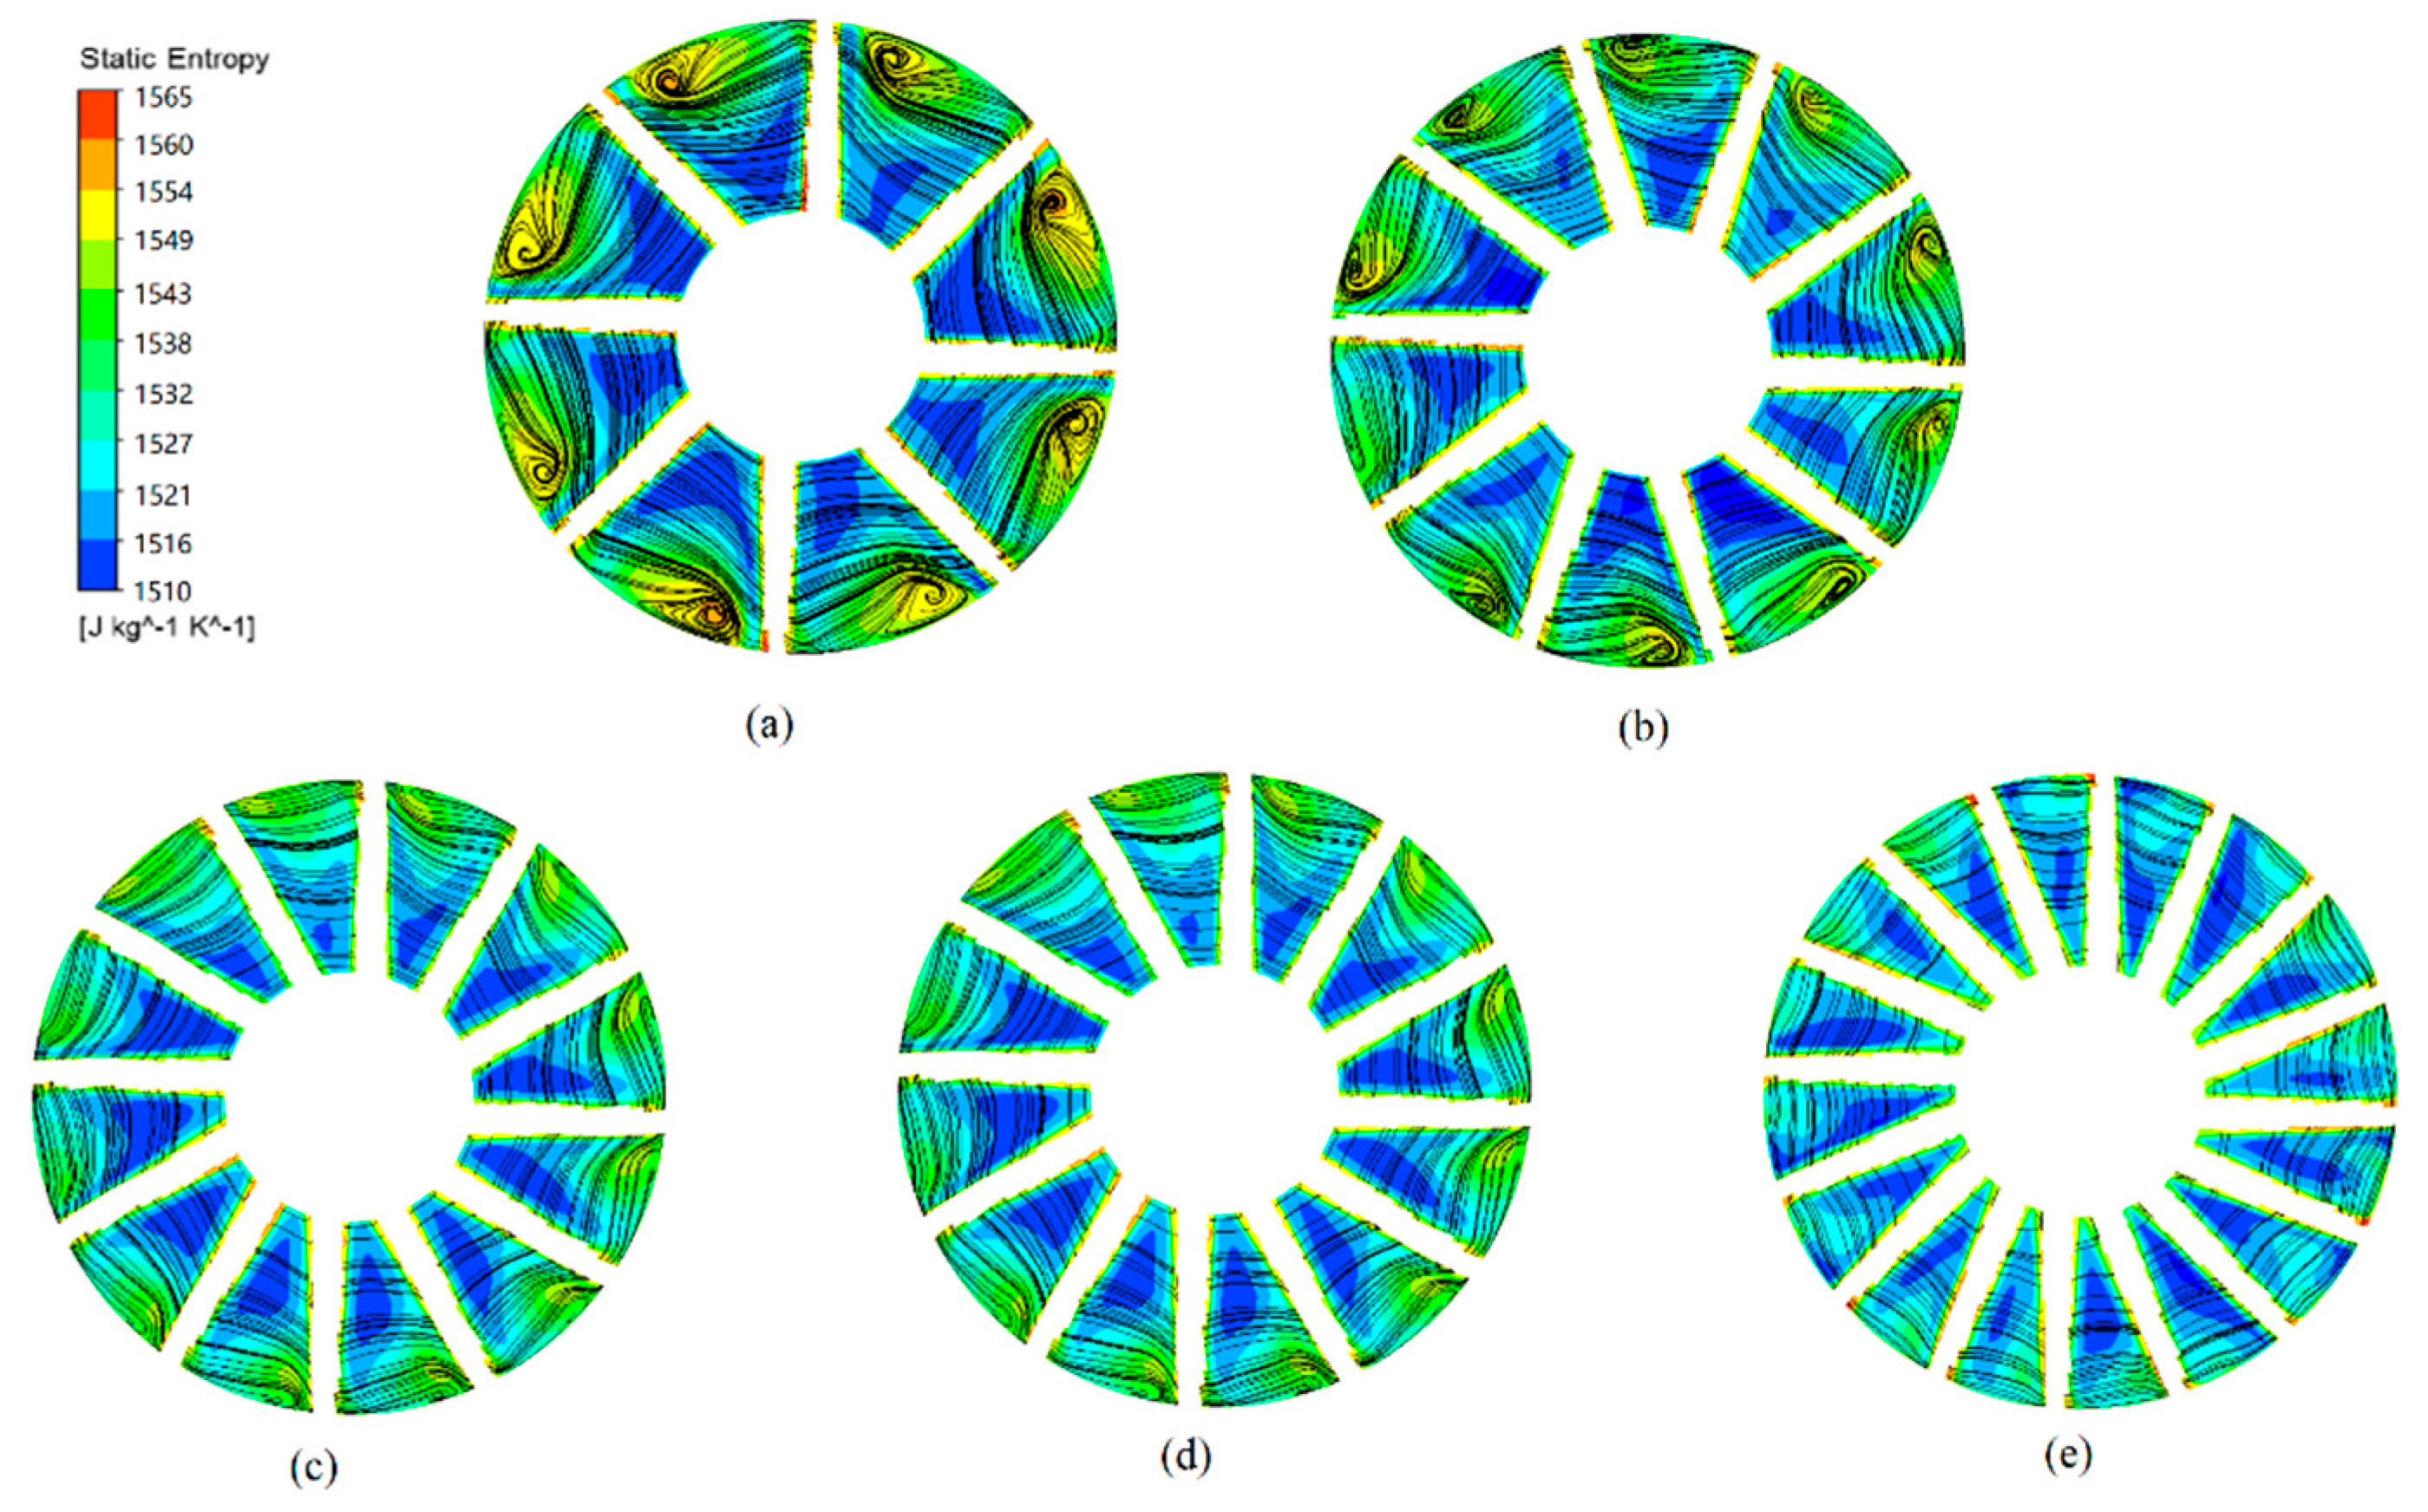
4.1.2. Entropy Distribution

The static entropy distribution can reflect the aerodynamic loss in the flow passage. For different rotor solidity, the difference of aerodynamic loss mainly concentrates on the outlet. In this section, the static entropy at the outlet of SCO2 and air are presented and compared.
The averaged static entropy along spanwise location at turbine outlet are presented in Figure 12. Spanwise location 1 and 0 correspond to the shroud and hub, respectively. The green plane is the contour location. It is acknowledged that higher entropy corresponds to higher aerodynamic loss. For both SCO2 and air, the aerodynamic loss mainly concentrates on the hub and shroud area due to the boundary layer effect of the impeller. The distribution is quite different with the change of rotor solidity. At the shroud, the highest static entropy appears due to the relatively vacant flow passage when solidity is 7.96 in the SCO2 turbine. For air, it locates at solidity 9.95, which means the decrease of solidity less affects the aerodynamic loss at the shroud. While at the hub, the highest static entropy presents when solidity is 15.92 on account of the limited flow area for both two working fluids.
Figure 13 shows the entropy distribution at outlet with surface streamlines of the SCO2 radial-inflow turbine. When the rotor solidity is the minimum, the local entropy production in the flow passage near the shroud is apparent. Due to the low solidity, the disordered flow near the shroud results in several vortexes, thus causing local entropy concentration. With the rotor solidity increases, the vortexes gradually disappear and the increase of local entropy near the shroud completely vanishes in condition (d), i.e., solidity 13.93. The location of entropy concentration changes to the flow passage near the hub. When rotor solidity is the minimum, the flow near the shroud is disordered while solidity is the highest, the diminishing space of the rotor flow passage restricts the flow of SCO2 fluid. These reasons cause the local enlargement of entropy as well as aerodynamic loss.
Comparing to Figure 13 and Figure 14 shows the entropy distribution at outlet with surface streamlines of the radial-inflow turbine working with air. The static entropy of the air turbine is apparently lower. In Figure 14a,b, the local vortex at the shroud causes local entropy production while in the SCO2 turbine, the vortex nearly disappears when solidity is 9.95. With the solidity further increasing, the entropy production still concentrates on the shroud side even when the solidity becomes the highest. Hence, in the air turbine, the diminishing space of rotor flow passage does not cause the local enlargement of aerodynamic loss at the hub.

4.2. Rotor Blade Load and Aerodynamic Force

The power capability of the radial-inflow turbine depends on rotor blade load and it can be further studied by rotor blade pressure distributions. Figure 15 presents the pressure distribution at the mid-span and its partially enlarged view, i.e., the rotor blade load along the streamwise location of different solidity and working fluid. As Figure 15a indicates, when solidity is higher than 11.94, the pressure below critical point appears. The trans-critical phenomenon arises at the trailing edge of the blade. In both Figure 15a,b, when solidity is 7.96, the pressure difference between suction side and pressure side is the largest. Hence, the blade can obtain the highest power capacity when the solidity is the lowest. Additionally, the capacity of the blade concentrates on the front and middle of the streamwise location, especially for solidity 15.92, which has little power output at the latter half of the blade. This phenomenon derives from the diminishing pitch of the blade along the flow direction. Moreover, for both SCO2 and air, the solidity mainly affects the pressure distribution on the suction side and the pressure on the pressure side is of minor variation.
The axial force of a single rotor blade with different solidity and working fluid are presented in Figure 16. The direction of the force is shown by the red arrow. The axial force of the rotor is not beneficial to the safe operation and requires high-level balance method of axial thrust as well as a reliable bearing. From Figure 16, we can conclude that with the solidity increasing, in a SCO2 radial-inflow turbine, the axial force of a single rotor blade increases. However, with the working fluid air, the axial force first increases and when the solidity is greater than 13.93, it slightly decreases. In general, the axial thrust of the rotor increases considering the rotor blade number. The effect of rotor solidity on axial force is greater for SCO2 turbine than it is for air turbine. The high density of SCO2 working fluid causes much higher axial thrust. With the augmented axial force, the safe operation of the turbine is affected and the load of the bearing enlarges.

4.3. Aerodynamic Performance

Output power, isentropic efficiency and mass flow rate are vital parameters in the assessment of the turbine aerodynamic performance. The isentropic efficiency discussed in this research is defined as Equation (8):
η is = 2 T Z × 2 π × r 60 × ( m i n ˙ + m o u t ˙ ) Δ h is
where T stands for torque, r represents the rotation speed, h is enthalpy and m ˙ is mass flow rate. As for the subscripts, is stands for isentropic, in and out represent the inlet and outlet of the turbine respectively, z corresponds to axial direction. The mass flow rate of inlet and outlet are slightly different due to the random error in the numerical simulation. To be precise, we adopt the average to calculate the efficiency.
High solidity usually results in large weight and axial thrust of the wheel. The working fluid SCO2 has more special application scenarios (such as aerospace and warships) than air due to its small size. In these cases, the weight of the wheel is limited. The problems of overlarge axial thrust and trans-critical phenomenon need to be solved. Hence, we concentrate on the improvement of SCO2 turbine. Three new splitters structures with and without offsetting are introduced. All solidity structures are calculated and compared in this section to test the effectiveness in the SCO2 radial-inflow turbine. Figure 17 gives the variation of output power and isentropic efficiency with different solidity.
For both SCO2 and air, the output power of the turbine first increases and then decreases with the augment of solidity. For SCO2, the maximum output power is 341.87 kW and it is realized when solidity is 11.94. While in Figure 17b, the maximum output power is 10.41 kW and it happens when solidity is 13.93 for the air turbine. Comparing (a) and (b), the radial-inflow turbine working with air has apparently lower power capacity, which results from a lower power density. With the augment of solidity, the output power descends more rapidly after the maximum in SCO2 turbine than that in air turbine. The decline of output power is owing to the blocking effect of turbine outlet when solidity reaches a certain extent. Obviously, it has a greater influence in a SCO2 turbine due to the fluid property similar to liquid.
As for the isentropic efficiency, the tendency is similar for SCO2 and air. In general, the isentropic efficiency first increases and then decreases with the augment of solidity and the efficiency of SCO2 turbine is higher in this power scale. In a SCO2 turbine, when solidity is 11.94, the isentropic efficiency reaches the maximum 90.54%. When solidity is 13.93, the efficiency is 90.52%. Although the highest solidity corresponds to the lowest output power, its efficiency is acceptable due to the lowest mass flow rate. The solidity 7.96 has the minimum efficiency owing to the unsatisfactory flow condition at the inlet of impeller, which is caused by the large pitch at leading edge. In the air turbine, the highest efficiency is 85.02% when solidity is 13.93. Likewise, the isentropic efficiency is the lowest 82.46% when solidity is 7.96. The efficiency declines slower than that in SCO2 turbine after the solidity reaches the maximum. The blocking effect is smaller and the large pitch at the leading edge affects the efficiency in a large scale.
The ss offset splitter can increase the output power and efficiency to the greatest extent. The power is increased to 347.22 kW, and the efficiency is increased to 90.18%. The normal splitter can improve the performance to a small extent while the ps offset splitter is ineffective. Overall, in the preliminary design of a SCO2 radial-inflow turbine, the best solidity is around 12 and for an air turbine, it is around 14. If the weight, axial thrust and trans-critical problem is concerned, arranging the ss offset splitter is a choice to improve the flow condition and the aerodynamic performance of the low solidity case.

5. Conclusions

In this research, an automatic design and simulation process of the radial-inflow turbine is established in MATLAB. The design reference of rotor solidity for both SCO2 and air are provided. A new splitter structure to improve the aerodynamic performance of low solidity case is proposed. Concretely:
  • For both SCO2 and air, with the increase of rotor solidity, the working capacity for each blade declines. The cross section of hub has the highest power ability. Comparing five kinds of solidity, the pressure along spanwise tends to be more uniform as the solidity decreases. Small rotor solidity can result in the chaotic flow at the inlet of impeller, which further leads to the nonuniform pressure distribution. Large solidity disturbs the flow at the outlet and the blocking flow increases the trans-critical area in SCO2 turbine. Comparing two working fluids, the air turbine has no trans-critical area and the low-pressure region at the suction side of the rotor blade trailing edge vanishes.
  • The aerodynamic loss of the SCO2 and air turbine mainly concentrates on the hub and shroud area due to the boundary layer effect of the impeller. For SCO2, when solidity is 7.96, the highest static entropy locates at the shroud due to the vacant flow passage. When solidity is 15.92, the highest static entropy locates at the hub on account of the limited flow area. For air, the increase of solidity less affects the aerodynamic loss and the entropy production mainly concentrates on the shroud.
  • For both SCO2 and air, the solidity mainly affects the pressure distribution on the suction side and the pressure on the pressure side is of minor variation. In the SCO2 turbine, large solidity corresponds to lower power capacity and greater trans-critical area of each blade. The high density of SCO2 working fluid causes much higher axial thrust than air.
  • For both SCO2 and air, the output power and isentropic efficiency of the turbine first increases and then decreases with the augment of solidity. In the SCO2 turbine, the isentropic efficiency reaches the maximum 90.54% and the maximum output power is 341.87 kW when solidity is 11.94. While in the air turbine, the maximum isentropic efficiency is 85.02% and the maximum output power is 10.41 kW when solidity is 13.93. In the preliminary design of a SCO2 radial-inflow turbine, the best solidity is around 12 and for an air turbine, it is around 14. Arranging the ss offset splitter can improve the flow condition and the aerodynamic performance of the low solidity case.

Author Contributions

Conceptualization: Y.W. and D.Z.; Methodology: D.Z.; Software: Y.X.; Validation: Y.W. and J.L.; Formal analysis: Y.W.; Investigation: Y.W. and J.L.; Resources: Y.X.; Data curation: D.Z.; Writing—original draft preparation: Y.W.; Writing—review and editing: J.L.; Visualization: J.L.; Supervision: D.Z.; Project administration: Y.X.; funding acquisition: Y.X. All authors have read and agreed to the published version of the manuscript.

Funding

This research was funded by 111 project, grant number B16038.

Conflicts of Interest

The authors declare no conflict of interest.

References

  1. Garg, P.; Kumar, P.; Srinivasan, K. Supercritical carbon dioxide Brayton cycle for concentrated solar power. J. Supercrit. Fluids 2013, 76, 54–60. [Google Scholar] [CrossRef]
  2. Chen, M.-F.; Yamaguchi, H.; Zhang, X.-W.; Niu, X.-D. Performance analyses of a particularly designed turbine for a supercritical CO2-based solar Rankine cycle system. Int. J. Energy Res. 2015, 39, 1819–1827. [Google Scholar] [CrossRef]
  3. Osorio, J.D.; Hovsapian, R.; Ordonez, J.C. Dynamic analysis of concentrated solar supercritical CO2-based power generation closed-loop cycle. Appl. Therm. Eng. 2016, 93, 920–934. [Google Scholar] [CrossRef]
  4. Chacartegui, R.; de Escalona, J.M.M.; Sanchez, D.; Monje, B.; Sanchez, T. Alternative cycles based on carbon dioxide for central receiver solar power plants. Appl. Therm. Eng. 2011, 31, 872–879. [Google Scholar] [CrossRef]
  5. Valdes, M.; Abbas, R.; Rovira, A.; Martin-Aragon, J. Thermal efficiency of direct, inverse and sCO2 gas turbine cycles intended for small power plants. Energy 2016, 100, 66–72. [Google Scholar] [CrossRef]
  6. Dostal, V.; Hejzlar, P.; Driscoll, M.J. High-performance supercritical carbon dioxide cycle for next-generation nuclear reactors. Nucl. Technol. 2006, 154, 265–282. [Google Scholar] [CrossRef]
  7. Ahn, Y.; Bae, S.J.; Kim, M.; Cho, S.K.; Baik, S.; Lee, J.I.; Cha, J.E. Review of supercritical CO2 power cycle technology and current status of research and development. Nucl. Eng. Technol. 2015, 47, 647–661. [Google Scholar] [CrossRef] [Green Version]
  8. Mecheri, M.; Le Moullec, Y. Supercritical CO2 Brayton cycles for coal-fired power plants. Energy 2016, 103, 758–771. [Google Scholar] [CrossRef]
  9. Monje, B.; Sanchez, D.; Savill, M.; Pilidis, P.; Sanchez, T.; ASME. A Design Strategy for Supercritical CO2 Compressors; America Society Mechanical Engineers: New York, NY, USA, 2014. [Google Scholar]
  10. Zhang, H.; Zhao, H.; Deng, Q.; Feng, Z. Aerothermodynamic Design and Numerical Investigation of Supercritical Carbon Dioxide Turbine; America Society Mechanical Engineers: New York, NY, USA, 2015. [Google Scholar]
  11. Zhang, D.; Wang, Y.; Xie, Y. Investigation into Off-Design Performance of a S-CO2 Turbine Based on Concentrated Solar Power. Energies 2018, 11, 3014. [Google Scholar] [CrossRef] [Green Version]
  12. Baltadjiev, N.D.; Lettieri, C.; Spakovszky, Z.S. An Investigation of Real Gas Effects in Supercritical CO2 Centrifugal Compressors. J. Turbomach. Trans. ASME 2015, 137. [Google Scholar] [CrossRef] [Green Version]
  13. Conboy, T.; Wright, S.; Pasch, J.; Fleming, D.; Rochau, G.; Fuller, R. Performance Characteristics of an operating Supercritical CO2 Brayton Cycle. J. Eng. Gas Turbines Power 2012, 134, 941–952. [Google Scholar] [CrossRef]
  14. Lettieri, C.; Baltadjiev, N.; Casey, M.; Spakovszky, Z. Low-Flow-Coefficient Centrifugal Compressor Design for Supercritical CO2. J. Turbomach. Trans. ASME 2014, 136. [Google Scholar] [CrossRef]
  15. Lopez, A.; Monje, B.; Sanchez, D.; Chacartegul, R.; Sanchez, T. Effect of Turbulence and Flow Distortion on the Performance of Conical Diffusers Operating on Supercritical Carbon Dioxide; America Society Mechanical Engineers: New York, NY, USA, 2013. [Google Scholar]
  16. Noughabi, A.K.; Sammak, S. Detailed Design and Aerodynamic Performance Analysis of a Radial-Inflow Turbine. Appl. Sci. 2018, 8, 2207. [Google Scholar] [CrossRef] [Green Version]
  17. Deng, Q.; Shao, S.; Fu, L.; Luan, H.; Feng, Z. An Integrated Design and Optimization Approach for Radial Inflow Turbines-Part II: Multidisciplinary Optimization Design. Appl. Sci. 2018, 8, 2030. [Google Scholar] [CrossRef] [Green Version]
  18. Zweifel, O. The Spacing of Turbo-Machine Blading, Especially with Large Angular Deflection. Brown Boveri Rev. 1945, 32, 436–444. [Google Scholar]
  19. Horlock, J.H. Axial Flow Turbines; Butterworth-Heinemann: Oxford, UK, 1966. [Google Scholar]
  20. Chen, T.Y.; Liao, Y.T.; Cheng, C.C. Development of small wind turbines for moving vehicles: Effects of flanged diffusers on rotor performance. Exp. Therm. Fluid Sci. 2012, 42, 136–142. [Google Scholar] [CrossRef]
  21. Mohamed, M.H. Impacts of solidity and hybrid system in small wind turbines performance. Energy 2013, 57, 495–504. [Google Scholar] [CrossRef]
  22. Eboibi, O.; Danao, L.A.M.; Howell, R.J. Experimental investigation of the influence of solidity on the performance and flow field aerodynamics of vertical axis wind turbines at low Reynolds numbers. Renew. Energy 2016, 92, 474–483. [Google Scholar] [CrossRef]
  23. Gao, K.; Xie, Y.; Zhang, D. Effects of rotor solidity and leakage flow on the unsteady flow in axial turbine. Appl. Therm. Eng. 2018, 128, 926–939. [Google Scholar] [CrossRef]
  24. Simpson, A.T.; Spence, S.W.T.; Watterson, J.K. Numerical and Experimental Study of the Performance Effects of Varying Vaneless Space and Vane Solidity in Radial Turbine Stators. J. Turbomach. Trans. ASME 2013, 135. [Google Scholar] [CrossRef]
  25. Pereiras, B.; Takao, M.; Garcia, F.; Castro, F. Influence of the Guide Vanes Solidity on the Performance of a Radial Impulse Turbine with Pitch-Controlled Guide Vanes; America Society Mechanical Engineers: New York, NY, USA, 2011. [Google Scholar]
  26. Dong, B.S.; Xu, G.Q.; Li, T.T.; Quan, Y.K.; Zhai, L.J.; Wen, J. Numerical prediction of velocity coefficient for a radial-inflow turbine stator using R123 as working fluid. Appl. Therm. Eng. 2018, 130, 1256–1265. [Google Scholar] [CrossRef]
  27. Ji, G.H. Turbo-Expander, 1st ed.; China Machine Press: Beijing, China, 1982. [Google Scholar]
  28. Brennen, C.E. Hydrodynamics of Pumps; Cambridge University Press: Cambridge, UK, 2011. [Google Scholar]
  29. Deng, Q.; Shao, S.; Fu, L.; Luan, H.; Feng, Z. An Integrated Design and Optimization Approach for Radial Inflow Turbines-Part I: Automated Preliminary Design. Appl. Sci. 2018, 8, 2038. [Google Scholar] [CrossRef] [Green Version]
  30. Menter, F.R. 2-Equation Eddy-Viscosity Turbulence Models for Engineering Applications. AIAA J. 1994, 32, 1598–1605. [Google Scholar] [CrossRef] [Green Version]
  31. Roache, P.J. Perspective—A Method for Uniform Reporting of Grid Refinement Studies. J. Fluids Eng. -Trans. ASME 1994, 116, 405–413. [Google Scholar] [CrossRef]
  32. Paudel, S.; Saenger, N. Grid refinement study for three dimensional CFD model involving incompressible free surface flow and rotating object. Comput. Fluids 2017, 143, 134–140. [Google Scholar] [CrossRef]
  33. Kim, S.G.; Lee, J.; Ahn, Y.; Lee, J.I.; Addad, Y.; Ko, B. CFD investigation of a centrifugal compressor derived from pump technology for supercritical carbon dioxide as a working fluid. J. Supercrit. Fluids 2014, 86, 160–171. [Google Scholar] [CrossRef]
  34. Odabaee, M.; Sauret, E.; Hooman, K. CFD Simulation of a Supercritical Carbon Dioxide Radial-Inflow Turbine, Comparing the Results of Using Real Gas Equation of Estate and Real Gas Property File. Appl. Mech. Mater. 2016, 846, 85–90. [Google Scholar] [CrossRef]
  35. Ameli, A.; Uusitalo, A.; Turunen-Saaresti, T.; Backman, J. Numerical Sensitivity Analysis for Supercritical CO2 Radial Turbine Performance and Flow Field. In Proceedings of the 4th International Seminar on Orc Power Systems, Milan, Italy, 13–15 September 2017; Volume 129, pp. 1117–1124. [Google Scholar]
Figure 1. Flow chart of design and simulation.
Applsci 10 02087 g001
Figure 2. Geometry model of nozzle.
Applsci 10 02087 g002
Figure 3. Geometry model of the impeller.
Applsci 10 02087 g003
Figure 4. Splitter structures for the lowest solidity case: (a) normal; (b) ps offset; (c) ss offset.
Applsci 10 02087 g004
Figure 5. Mesh of the computational field.
Applsci 10 02087 g005
Figure 6. Validation of different turbulence models.
Applsci 10 02087 g006
Figure 7. Density variation with temperature and pressure of SCO2.
Applsci 10 02087 g007
Figure 8. Pressure distribution at mid-span of SCO2: (a) solidity 7.96; (b) solidity 9.95; (c) solidity 11.94; (d) solidity 13.93; (e) solidity 15.92.
Applsci 10 02087 g008
Figure 9. Trans-critical phenomenon at the trailing edge: (a) solidity 7.96; (b) solidity 9.95; (c) solidity 11.94; (d) solidity 13.93; (e) solidity 15.92.
Applsci 10 02087 g009
Figure 10. Pressure distribution at mid-span of air: (a) solidity 7.96; (b) solidity 9.95; (c) solidity 11.94; (d) solidity 13.93; (e) solidity 15.92.
Applsci 10 02087 g010
Figure 11. Averaged pressure along spanwise location at turbine outlet: (a) SCO2; (b) air.
Applsci 10 02087 g011
Figure 12. Averaged static entropy along spanwise location at turbine outlet: (a) location of graphical results; (b) SCO2; (c) air.
Applsci 10 02087 g012
Figure 13. Entropy distribution at outlet with surface streamlines of SCO2: (a) solidity 7.96; (b) solidity 9.95; (c) solidity 11.94; (d) solidity 13.93; (e) solidity 15.92.
Applsci 10 02087 g013
Figure 14. Entropy distribution at outlet with surface streamlines of air: (a) solidity 7.96; (b) solidity 9.95; (c) solidity 11.94; (d) solidity 13.93; (e) solidity 15.92.
Applsci 10 02087 g014
Figure 15. Rotor blade load along streamwise location of different solidity: (a) SCO2; (b) air.
Applsci 10 02087 g015
Figure 16. Axial force of a single rotor blade with different solidity and working fluid.
Applsci 10 02087 g016
Figure 17. Output power and isentropic efficiency of different solidity and splitters: (a) SCO2; (b) air.
Applsci 10 02087 g017
Table 1. Geometric parameters of the impeller.
ParameterABCDE
Blade number810121416
Impeller diameter/mm92.2
External diameter of outlet/mm40.6
Axial length/mm20
Blade height of inlet/mm2.97
Blade height of outlet/mm24.6
Inlet geometry angle/°90
Outlet geometry angle/°27
Chord length (c)/mm50
Pitch at trailing edge (s)/mm6.285.034.193.593.14
Solidity (c/s)7.969.9511.9413.9315.92
Table 2. Boundary conditions of the calculated cases.
Working FluidTotal Pressure of Inlet/MPaTotal Temperature of Inlet/KStatic Pressure of Outlet/MPaRotation Speed/rpm
SCO215550850,000
Air0.55500.350,000
Table 3. Result of grid convergence index.
MeshTotal Element Number/104Mass Flow Rate/kg∙s−1GCI/%Output Power/kWGCI/%
Coarse(f3)113.26.581GCI23 = 1.02
GCI12 = 0.64
343.03GCI23 = 0.16
GCI12 = 0.05
Medium(f2)193.66.549342.16
Fine(f1)335.46.529341.87
Table 4. Validation of SCO2 fluid property.
ParameterDensity/kg∙m−3Enthalpy/kJ∙kg−1Cp/J∙kg−1∙K−1Dynamic Viscosity/Pa∙s
LocationInlet
CFX173.19648.101243.972.6859 × 10−5
NIST173.19648.101244.002.6859 × 10−5
Relative error/%000.0020
LocationInterface between stator and rotor
CFX144.15630.051211.872.5113 × 10−5
NIST144.14630.051211.802.5111 × 10−5
Relative error/%0.00600.0060.008
LocationOutlet
CFX106.35601.881159.112.2715 × 10−5
NIST106.35601.881159.102.2717 × 10−5
Relative error/%000.0010.009

