Abstract
Scene text detection is the task of detecting word boxes in given images. The accuracy of text detection has been greatly elevated using deep learning models, especially convolutional neural networks. Previous studies commonly aimed at developing more accurate models, but their models became computationally heavy and worse in efficiency. In this paper, we propose a new efficient model for text detection. The proposed model, namely Compact and Accurate Scene Text detector (CAST), consists of MobileNetV2 as a backbone and balanced decoder. Unlike previous studies that used standard convolutional layers as a decoder, we carefully design a balanced decoder. Through experiments with three well-known datasets, we then demonstrated that the balanced decoder and the proposed CAST are efficient and effective. The CAST was about 1.1x worse in terms of the F1 score, but 30∼115x better in terms of floating-point operations per second (FLOPS).
1. Introduction
Optical character recognition (OCR) is the task of finding and recognizing potential characters (or texts) from given optical signals or images. OCR has received attention from academic and industrial fields because as it can be used for various services (e.g., reading services for blind people, license plate recognition). OCR has two steps: detection and recognition. The detection step detects the region or boundaries of text characters, and the recognition step recognizes what the characters are. For example, given an advertising picture that contains the text ‘cola’, the detection step finds the boundary of the text from the scene, and the recognition step identifies that the found boundary consists of the sequence of ‘c’-‘o’-‘l’-‘a’. It is obvious that better text detection will contribute to better text recognition.
Scene text detection finds word boxes (or word regions) from scenes. There have been studies on scene text detection, which fall into two categories: (1) a segmentation-based approach, and (2) a regression-based approach. Studies on segmentation-based approaches mainly adopted fully convolutional network (FCN) [1], requiring further post-processing to transform the output in to the form of word boxes [2,3,4]. On the other hand, studies on regression-based approaches mainly used single shot detector (SSD) [5], faster region-based convolutional neural networks (Faster R-CNN) [6], or mask region-based convolutional neural networks (Mask R-CNN) [7]. These studies commonly adopted anchor boxes to capture the desired object with a particular aspect ratio [8,9,10]. Existing studies on both approaches sought better effectiveness by increasing the model complexity, and achieved about an 80∼90% F1 score for the text detection.
Effectiveness has traditionally been the main focus, and so improved efficiency has been neglected (e.g., memory usage, inference time). According to the recent report of Gartner [11], edge computing is one of the top 10 strategic technology trends. Edge computing places services closer to the information sources; for text detection, the scene data are collected from user devices (e.g., cellphones), so text detection services might be provided by these devices. For this, it is necessary to develop efficient models without degrading effectiveness.
There have only been a few studies aimed at developing efficient models for text detection; these efficient models are fast (less inference time), compact (small number of parameters), and cost-efficient (e.g., low floating-point operations per second (FLOPS)). In [12], efficient and accurate scene text detection (EAST) was introduced to perform scene text detection using Pvanet [13] as a backbone and standard convolution layers as a decoder. In [14], a similar approach to the above was included, but the backbone was Residual network (Resnet) [15], which is much larger than the Pvanet. In [10] visual geometry group network (VGGnet) was used [16], which is also a large backbone. Although these studies exhibited successful results, there are two goals that need to be considered: (1) improving the backbone model and (2) improving the decoder. EAST [12] has the smaller backbone (Pvanet) compared to the other studies, so its efficiency is the best among them. Therefore, it is worth investigating other potential backbone models such as MobileNet [17] and MobileNetV2 [18]. The decoder has a huge impact on the model effectiveness as well as the efficiency, so it is important to design the decoder carefully. However, the decoders in existing studies usually consist of traditional convolutional layers. In this paper, we carefully design a novel decoder, namely Balanced decoder, that achieves better effectiveness while maintaining good efficiency. We also investigate a better backbone model through experimental comparisons.
For efficient text detection, this paper proposes a new model, which Compact and Accurate Scene Text detector (CAST), that is a MobileNetV2-based network with the Balanced decoder. Our paper has three contributions as follows: (1) we design the balanced decoder using an inverted residual block (IRB) [18], (2) we find a reasonable backbone through experimental comparisons, and (3) we compare the proposed model with existing state-of-the-art models according to floating-point operations per second (FLOPS), inference time, and the number of parameters. Via these experimental results, we demonstrate that CAST achieves an 80∼81% F1 score with the most efficiency. For example, the CAST was one-eighth the size compared to the other models.
The rest of this paper is organized as follows. Section 2 reviews the existing work of scene text detection. Section 3 introduces the proposed structure and describes details of the balanced decoder. Section 4 shows the experimental results for three datasets (e.g., ICDAR 2013, ICDAR 2015 and ICDAR2017). Finally, Section 5 summarizes and concludes the paper.
2. Related Work
Scene text detection is basically object detection; it focuses on detecting a particular object type (e.g., text). The length of the text might vary, which makes the aspect ratio of the text dynamic. This can make the task of text detection difficult. There have been many studies on text detection using models originally designed for object detection such as SSD [5], Faster R-CNN [6], Mask R-CNN [7], and FCN [1]. The existing studies can be divided into two groups: segmentation-based approaches and regression-based approaches.
2.1. Segmentation-Based Approach
The segmentation-based approaches classify every pixel into one of two classes (e.g., text and not text). Such Methods mainly adopt FCN to obtain segmentation results and require post-processing that converts the results into word boxes. For example, in [3] the segmentation results are converted into word boxes using link prediction. In [2] a model was proposed, namely character region awareness for text detection (CRAFT), that represents inter-character relationships using a heat map and links the characters using a connected component labeling (CCL) algorithm. In [19] a progressive scale expansion algorithm was suggested that finds word boxes at various scales and merges nearby word boxes. As described above, the segmentation-based approaches indirectly infer word boxes via post-processing that converts the segmentation results into word boxes. Such an indirect mechanism may lead worse word boxes because it strongly relies on the results of the segmentation model.
2.2. Regression-Based Approach
Compared to segmentation-based approaches, a regression-based approach directly finds the word boxes. That is, it finds several points (e.g., top-left points and bottom-right points) of potential word boxes. The existing studies of this approach mainly focused on effectiveness, and thus adopted heavy backbone models (e.g., Resnet, VGGnet) to enhance accuracy. In [8,9] anchor boxes of various aspect ratios were utilized and achieved about a 77∼81% F1 score using VGGnet as a backbone. In [20] a way to use the mask branch of Mask R-CNN for character segmentation was proposed, and achieved an 86∼91% F1 score using the ResNet as a backbone. In [21] a text context module (TCM) to detect texts was proposed, and achieved an 87∼92% F1 score using ResNet as a backbone. The studies above commonly focused only on improving effectiveness (e.g., the F1 score) and thus increased model complexity without considering efficiency.
Regression-based approaches generates multiple candidates for word boxes, so it is necessary to filter inappropriate candidates out. There have been studies for effectively selecting such promising candidates. For example, [10] proposed a method of merging small word boxes to detect long shaped word boxes, and achieved a 75∼85% F1 score. In [4] the corner-based Region Proposal Network (CRPN) was proposed to divide each word box into smaller word boxes. An 82∼91% F1 score using line level detection and recalled non-maximum suppression was achieved in [22]. The studies above commonly focused only on improving effectiveness (e.g., the F1 score) by employing complex post-processing (e.g., filtering, merging, dividing).
There have been few studies aimed at efficient models for text detection. In [10] a single shot detector (SSD) was utilized and it was shown that their proposed model is efficient in terms of the inference time. In [12], a geometry map was proposed and Pvanet is adopted as a backbone. Their proposed model exhibited a comparable F1 score (e.g., 75% F1 score) and has much more compact structure than existing models. Such compact structure is mainly obtained by adopting Pvanet as a backbone, showing that it is important to carefully choose the backbone. In [14] the ResNet was adopted as a backbone to improve effectiveness without losing inference time. Using ResNet as a backbone led t a better F1 score, but it turned out that it causes efficiency degradation in terms of the number of parameters and FLOPS. Even though the above studies focused on developing efficient models, there are two considerable factors. First, there is still room for investigating better backbones for improved efficiency; for example, MobileNet and MobileNet2 are well-known methods that are efficient as well as effective. Second, the above studies did not carefully design the decoders even though the decoder strongly impacts the results; for example, the decoders of existing studies usually consist of traditional convolutional layers.
2.3. Efficient Models
In this paper, we consider three efficiency factors: inference time, FLOPS, and the number of parameters. Many previous studies using VGGnet or Resnet considered only part of these parameter, for example, only inference time was measured in [10,14]. Such studies are efficient in terms of the inference time, however they are not suitable for mobile environments that may have severely limited resources (e.g., computational power, memory). Moreover, such mobile environments may not provide a Graphical Processing Unit (GPU), which makes arithmetic operations with large quantities much faster. There have been several studies that proposed efficient structures. In [23] a dense convolutional network (DenseNet) was proposed by modifying the bottleneck structure of Resnet. As shown in [24], DenseNet has about 600 M FLOPS, 103 milliseconds (ms) per data, and achieved a 39.9% top-1 error on the ImageNet data (224 × 224 images). Further, [17] proposed MobileNet, which employs the separable convolution originally proposed in [25]. In [26], a channel shuffle operation was applied to separable convolution for better efficiency. In [18] MobileNetV2 was introduced, which is an improved version of MobileNet by employing an inverted residual block (IRB). The MobileNetV2 has about 3.4 M parameters, 600 M FLOPS, 110 ms per data, and achieved a 28.3% top-1 error on the ImageNet data. Previous studies for scene text detection have mainly adopted VGGnet or Resnet as a backbone, but it is necessary to consider other models such as MobileNet2.
The previous studies on scene text detection have a simple decoder such as standard convolutional layers. For example, in [10], the decoder simply consists of standard convolutional layers and pooling layers. In [12,14], 1 × 1 convolutions and 3 × 3 convolutions form decoders. The decoder has a huge impact on the performance in terms of the effectiveness and the efficiency. Therefore, it is necessary to investigate better designs for decoders.
3. Proposed Method
3.1. Architecture
We design a new model, namely Compact and Accurate Scene Text detector (CAST), for efficient scene text detection. It takes an input image of size and generates a set of potential word boxes as the output. The overall process is depicted in Figure 1: the input image on the left is injected in to our backbone model, followed by the balanced decoder. The result of the decoder is finally converted into a set of potential word boxes through post-processing. Although we aim to develop an efficient model for text detection, we do not simply ignore the effectiveness. If a model largely fails to predict word boxes, then it is useless even if it is the most efficient. Therefore, we adopt MobileNetV2 as the backbone because it is known to be both effective and efficient.
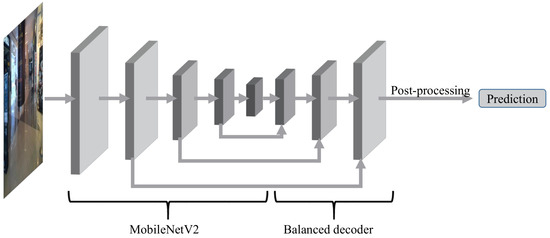
Figure 1.
Overall flow of prediction. Images are passed to both MobileNetV2 and the balanced decoder, and post-processing generates the predicted results.
MobileNetV2, our backbone model, generates arbitrary features of a compact dimension from a given image. As shown in the left of Figure 2, MobileNetV2 has one convolutional stage and four inverted residual block (IRB) stages. Through these four IRB stages, MobileNetV2 generates the matrix , conveying highly semantic patterns obtained from stage 5. For example, given an input image of size , MobileNetV2 generates a feature matrix , where and . The compact feature matrix maintains the latent patterns obtained from the stack of inverted residual blocks (IRBs). As shown in Figure 3, an IRB consists of three steps: expansion, depth-wise convolution, and projection. First, the IRB expands its input to a larger dimension, and finally projects it into a smaller dimension while the input is directly connected to its output. This approach can represent more complex functions with greater bottleneck expansion t, as described in [18], and we set t = 6. Together with , three more feature matrices (, , and ) at different scales are passed into the decoder in order to incorporate semantic patterns at different scales. Although Deeplab v3 [27] stated that the backbone using output stride (OS) up to 16 was better for effectiveness, we set OS up to 32 for better efficiency. This decoder generates a set of candidate word boxes based on the four feature matrices, and some inappropriate word boxes are filtered out during post-processing. The post-processing technique adopted in this paper is EAST [12]. This method merges adjacent word boxes according to the predicted scores, and then finds appropriate word boxes using non-maximum support (NMS).
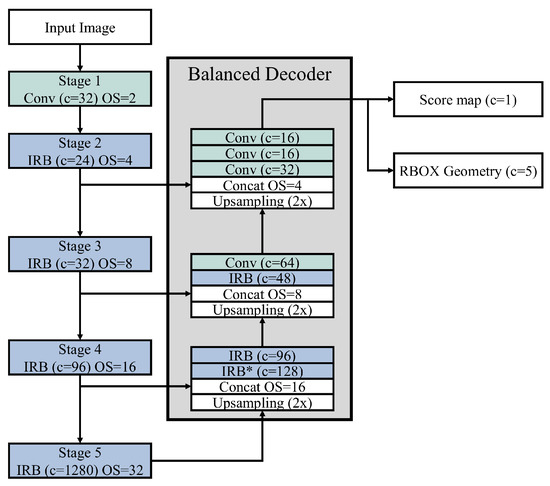
Figure 2.
Structure of the proposed CAST. The five stages on the left represent MobileNetV2, while the center box is the balanced decoder. With the inverted residual block (IRB), and IRB* is a special case without any expansion. Convolutions of kernel size 3x3 are denoted by Conv. Here c indicates the number of channels, and OS represents the output stride.
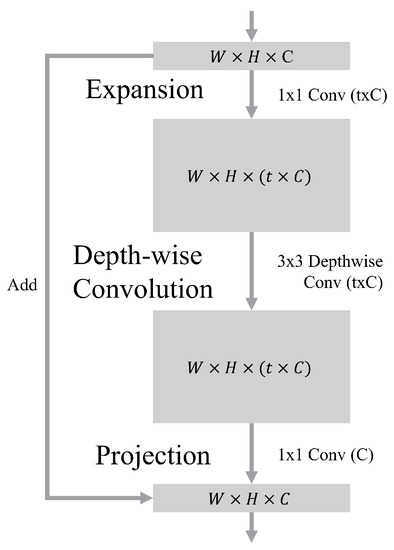
Figure 3.
Structure of an IRB, which consists of three steps: expansion, depth-wise resolution, and projection. Here t represents an expansion factor, and c indicates the number of channels. The W and H are the width and height of the feature map, respectively.
3.2. Balanced Decoder
The balanced decoder considers the four feature matrices (e.g., , , , and ) delivered from the backbone, as shown in Figure 2. The decoder has three stages and the four matrices are injected in to different stages of the decoder through skip connections; for example, and are passed to the first (bottom) stage while is injected in to the third stage (top) stage. Through the three stages, the four feature matrices are converted into a set of candidate word boxes with confidence scores, where the confidence score means how likely the corresponding area contains text. Each candidate word box is represented using a rotated box (RBOX) geometry that consists of four coordinates of a word box and a rotation angle; thus RBOX geometry is a five-dimensional vector (i.e., c = 5). Every candidate word box has a confidence score (Score map) that is represented by a scalar value (i.e., c = 1).
The four feature matrices are of different scales; for example, and are of the smallest dimension and the largest dimension, respectively. The three stages of the decoder are meant to deal with such different scales. In the first stage, due to the large number of channels (1280) of , IRB* does not have an expansion step. It delivers 128 channels to the next IRB, which finds patterns of the smallest dimension from and . Together with the patterns found during the first stage, a smaller feature matrix is injected in to the second stage. To modulate at a bigger scale compared to the first stage, the second stage consists of an IRB and a standard convolutional layer. Finally, the last stage generates candidate word boxes based on the smallest feature matrix and the found patterns. Note that an IRB is adopted only in the first and second stages. The reason is that the feature matrix is the largest among the four feature matrices, so adding on IRB to the last stage may result in a huge computational complexity (e.g., FLOPS). That is, adding the IRB to the last stage will make the last stage much more complex than the other stages, and such imbalance between stages may hinder finding appropriate candidates for word boxes. Because our goal is to achieve efficiency without loss of effectiveness, we do not use the IRB in the last stage so that the three stages are balanced in terms of computational complexity.
One may argue that using an IRB in the decoder may have a little impact. In Figure 4, two decoders (a) and (b) are used, EAST [12] and CRAFT [2], respectively. They both have a stack of standard convolutional layers without employing an IRB. These decoders may achieve sufficient effectiveness (e.g., F1 score), but will probably be less efficient. The IRB is known to be not only compact, but also as effective as standard convolutions, so we adopt the IRB for designing the balanced decoder. However, applying this approach everywhere will not always be appropriate. For example, the two decoders (c) and (d) in Figure 4 have similar structures to (a) and (b), respectively, but have the IRB in all stages. The IRB of stage 3 results in large computational complexity, so the other stages should be decreased in by regulating the number of channels and bottleneck expansion; for example, in (c) of Figure 4, the number of channels of the first and second stages are reduced, and the number of channels of IRB expansion step (i.e., bottleneck expansion) is 3 to keep the model not too complex. As a consequence, the two unbalanced decoders will likely have worse effectiveness. Our balanced decoder is carefully designed by employing the IRB at two stages, and we show that it achieves the best effectiveness among the decoders without losing efficiency in the next section.
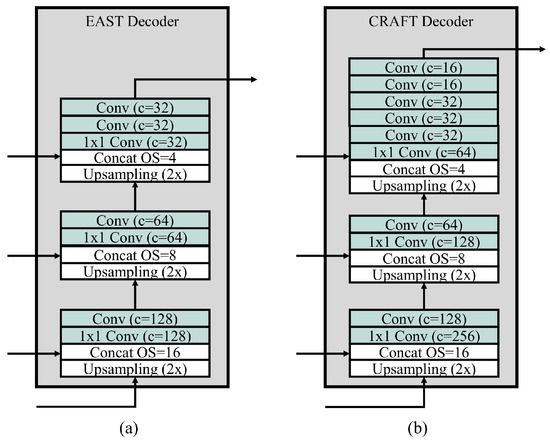
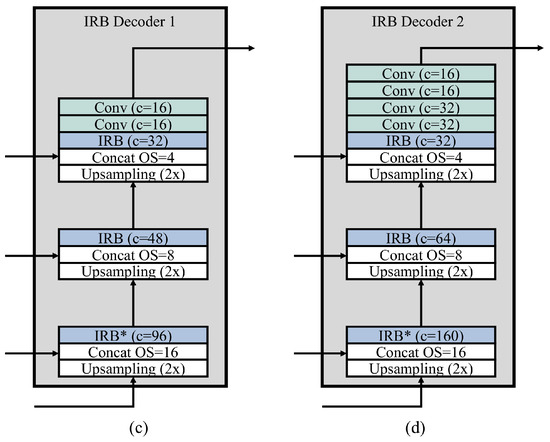
Figure 4.
Structures of four comparable decoders, where is the output stride, c is the number of channels, and convolutions of kernel size are denoted by Conv. (a) decoder of EAST, (b) decoder of CRAFT, (c) decoder using IRB for all stages, and (d) a different decoder using IRB for all stages. To ensure decoder (d) has a similar complexity, its expansion is set to be 3.
3.3. Loss Function
The total loss function L consists of two loss functions: and . is a loss for the score map, and is defined using the dice-coefficient loss function described in Equation (1). Throughout this paper, the notation means a predicted value for the corresponding variable X; for example, is a predicted score for the pixel p and is a ground truth score for the pixel. The is used to regularize the scale, which we set to 0.01 in this paper.
is a loss function for the geometry and is defined as follows. indicates the loss function for an axis-aligned bounding box (AABB); specifically it represents a loss for the coordinates of a word box. The is a loss function for a ration angle . In this paper, we set = 20, making the approach more sensitive to rotations of word boxes.
The definition of is as follows, where R is the size of a bounding box. Here and are the width and height intersected in ground truth word box between predicted word box for the corresponding pixel p, respectively. We define the four variables , , , and , which represent the distances from p to the top, right, bottom and left edges, respectively, as described in Equation (4). The and indicate the width and height of the overlapped area between the predicted region and the ground-truth region, respectively.
The definition of is as follows. ranges from 0 to 2, where greater a value implies a greater difference in the rotation angle.
Finally, the total loss is a weighted sum of the two loss functions, as described in Equation (6). ranges between 0 and 1, and can be used to adjust relative importance of . We set = 1 in this paper.
4. Experiment
Throughout this paper, for experiments, we use an Intel(R) Xeon(R) Central Processing Unit (CPU) E5-2630 v4 (2.20 GHz), 128 GB random access memory (RAM), and a single NVIDIA GeForce GTX 1080Ti. We compare models via precision, recall, F1 score, inference time, FLOPS, and the number of parameters. The experimental results are the averages of 10 independently conducted experiments. The inference time is the time needed in milliseconds (ms) for inference of an image.
4.1. Dataset
We use three datasets: ICDAR2013 dataset [28], ICDAR2015 dataset [29], and ICDAR2017 MLT [30]. The ICDAR2013 dataset consists of 229 images and 223 images for training and testing, respectively. It is annotated at the word level, and different images have different resolutions. Each word is represented by a rectangular box, so every word has the same horizontal orientation. The ICDAR2015 dataset consists of 1000 images and 500 images for training and testing, respectively. It is annotated at the word level, and the images are of the same resolution (e.g., 1280 × 720). To incorporate arbitrary-oriented text, each word is represented by a quadrilateral box. The ICDAR2017 MLT consists of 7200 images, 1800 images, and 9000 images for training, validation, and testing, respectively. It is annotated at the word level, and different images have different resolutions. Similar to the ICDAT2015 dataset, a bounding box is represented by a quadrilateral box. ICDAR2017 is consist of nine languages, whereas the ICDAR2013 and ICDAR2015 have only English words.
As the images of the three datasets have different resolutions, we make each dataset have a consistent image size. There are mainly two types of image resizing techniques: short-side based and long-side based resizing. For our model, we take the long-side based resizing. After resizing, the ICDAR2013, ICDAR2015, and ICDAR2017 datasets have 512, 1280, and 2400 long-side images, respectively. For each dataset, our model is trained using the training instances and is evaluated using the testing instances.
We prepared the ground truth as described in [12]. As shown in Figure 5, given a word box, the ground truth is generated by shrinking the word box to a compact area of the word. The resolution of the ground truth becomes four times smaller than the resolution of the input images. Each ground truth consists of an RBOX geometry and a score map. As depicted in (b) of Figure 5, the RBOX geometry consists of a rotation angle as well as distances from a given pixel to the four edges. The score map is a scalar value that represents whether the given pixel belongs to a word box or not, as shown in (a) of Figure 5.
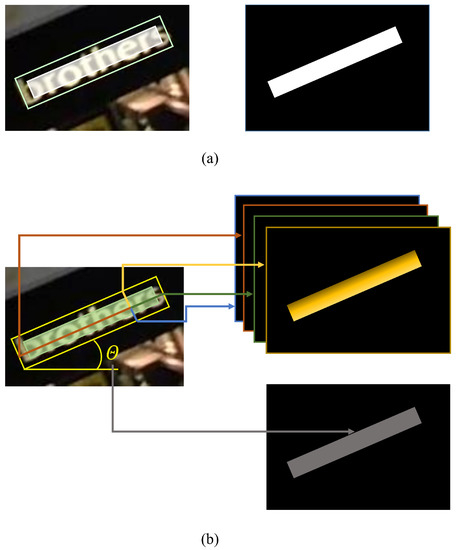
Figure 5.
The process of ground truth generation. (a) Score map generation by shrinking the word boxes. (b) RBOX generation based on the distance from the given pixel to the four edges.
4.2. Training Details
For training our proposed CAST model with each of the datasets, we commonly use MobileNetV2 (backbone) M pretrained with the ImageNet data. The CAST model (the pretrained backbone M + the balanced decoder B) is fine-tuned with the ICDAR2017 MLT dataset; we denote this model as . We also construct by fine-tuning with the ICDAR2015 dataset. As the size of ICDAR2013 dataset is small, is constructed by fine-tuning with the ICDAR2013 dataset. For fine-tuning and , we use the Adam optimizer [31] with an initial learning rate of .
The learning rate is decayed by 0.94 per 10,000 iterations. The two CAST models are trained for 100 K iterations. For fine-tuning , we use the Adam optimizer with an initial learning rate of and do not employ learning rate decay. This model is trained for 10 K iterations. To prevent overfitting of the three CAST models, we adopt L2 regularization with a weight decay of . They are commonly trained with a batch size of 16. The layer weights are initialized with a uniform distribution between −0.05 and 0.05, while the biases are initialized as 0. For efficient training, we employ batch normalization (BN) [32] with = 1 and = 0.
4.3. Results
We compared CAST with several state-of-the-art models through experiments with three datasets (ICDAR2013, ICDAR2015, and ICDAR2017 MLT). In Table 1, Table 2 and Table 3, the M + B denotes the CAST, where M and B indicate the MobileNetV2 as a backbone and the balanced decoder, respectively. It is obvious that the MobileNetV2-based models (M + E, M + C, and M + B) achieve better efficiency than the other models. Especially, by comparing M + E and P + E, we can see the advantages of using the MobileNetV2 as a backbone, where the P + E (EAST) is the Pvanet version, not the Pvanet(2x) version. This implies that the backbone has a tremendous impact on the efficiency, so it is necessary to choose the backbone carefully. Regarding the effectiveness, the CAST achieves about 80∼81% for the F1 score for ICDAR2013 and ICDAR2015, and 63% for the F1 score for ICDAR2017 MLT. For the ICDAR2013 dataset, Seglink has about a 5% greater F1 score than CAST, however Seglink has about a 6% smaller F1 score than CAST for the ICDAR2015. The reason is that Seglink is an SSD-based approach, so benefits from the relatively large word boxes of ICDAR2013. We compare CAST with the most accurate models for each dataset, as summarized in Table 4. Compared to CAST, the most accurate models achieved about a 1.1 times better F1 score, but have long inference times of about 7∼31 times and a larger FLOPS about 30∼115 times. Based on this, CAST can be seen as significantly more efficient than the other models without losing much effectiveness.

Table 1.
Results with the ICDAR2013 dataset, where R, P, and F represent the recall, precision, and F1 score, respectively. An asterisk(*) indicates that the corresponding result is obtained in our own experiments. M and P denote MobilNetV2 and Pvanet, respectively. E, C, and B are the EAST decoder, the CRAFTdecoder, and our proposed balanced decoder, respectively. The inference time represents the time needed for obtaining a result for an image, where italic values indicate that the values are borrowed from other studies.
Table 2.
Results with the ICDAR2015 dataset, where R, P, and F represent the recall, precision, and F1 score, respectively. M and P denote MobilNetV2 and Pvanet, respectively. E, C, and B are the EAST decoder, the CRAFT decoder, and our proposed balanced decoder, respectively. The inference time represents the time needed for obtaining a result for an image, where italic values indicate that the values are borrowed from other studies.
Table 3.
Results with ICDAR2017 MLT dataset, where R, P, and F represent the recall, precision, and F1 score, respectively. An asterisk(*) indicates that the corresponding result is obtained in our own experiment. M and P denote MobilNetV2 and Pvanet, respectively. E, C, and B are the EAST decoder, the CRAFT decoder, and our proposed balanced decoder, respectively. The inference time represents the time needed for obtaining a result for an image, where italic values indicate that the values are borrowed from other studies.
Table 4.
Comparison the CAST with the most accurate models for each dataset, where F indicates F1 score, and means that the corresponding model is relatively K times better or worse than the CAST.
The MobileNetV2-based models, denoted as M+ models (M + E, M + C, and M + B), generally achieved better efficiency, but exhibit different performances for different datasets. When we look at the inference time for the ICDAR2013 dataset, the M+ models are slightly under performing. The ICDAR2013 dataset has relatively larger word boxes than the other datasets, which result in a spends longer time for post-processing. We also see that with the ICDAR2015 and ICDAR2017 MLT datasets, the inference time of CAST (M + B) is worse than M + E and M + C. The reason might be that the depthwise convolution of the IRB is known to need fragmented memory access, as described in [33]. Such phenomenon does not seem severe with the ICDAR2013 dataset; this is because the resized images are of relatively smaller resolution, leading it to suffer less from fragment memory access.
The balanced decoder B is basically a stack of IRBs and standard convolutional layers. When we compare M + E and M + C, M + C has a better F1 score but worse FLOPS. On the other hand, M + B has not only a better F1 score but also a better FLOPS than the other M+ models. The balanced decoder together with MobileNetV2 as a backbone makes it more efficient without losing effectiveness. In Figure 6 and Figure 7, several true positive results and false positive results are shown. The false positive cases highlighted with red rectangles have somewhat similar appearances (e.g., arrows) to the words, so more complex models might be necessary to incorporate such ambiguous cases.
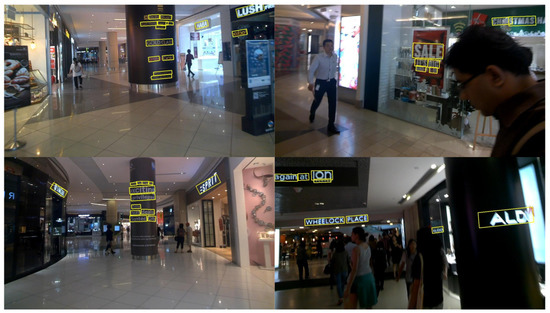
Figure 6.
Prediction results with the ICDAR2015 dataset.
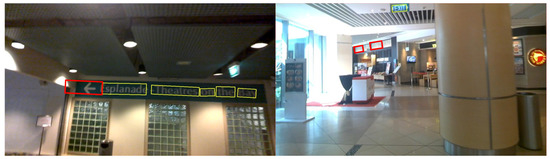
Figure 7.
False positive results with the ICDAR2015 dataset, where the red rectangles indicate the failed cases.
4.4. Discussion
By the experimental results of Table 1, Table 2 and Table 3, we demonstrated that the balanced decoder (B) is efficient and effective. The balanced decoder has an IRB in its two stages, so one may argue that it can achieve better performance if it has an IRB in all stages. We compared the B with several different decoders through experiments with the same backbone MobileNetV2, and the results are summarized in Table 5, where the structures of IRB decoder 1 and IRB decoder 2 can be found in Figure 4. The EAST decoder (E) is the most efficient but is the worst in terms of the F1 score. The CRAFT decoder (C) is the largest and good effective, but has the worst FLOPS. IRB decoder 1 and IRB decoder 2 are similar to E and C, respectively, but they have IRBs at all stages. They commonly have comparable F1 scores, but are not impressive in terms of the efficiency (e.g., FLOPS). The reason is that adding an IRB to the last stage makes it more complex than the other stages, and such an imbalance between stages hinders finding appropriate word box candidates. On the other hand, the B has a balanced complexity between stages, so it has a better F1 score and FLOPS as well; if we compare B with E, then there is an F1 score gap of 2.5% between them.
Table 5.
Comparison of several decoders with the ICDAR2015 dataset, where R, P, and F represent the recall, precision, and F1 score, respectively. The results are obtained using the same backbone MobileNetV2.
To determine if CAST works in light devices without a GPU, we performed additional experiments using only a CPU. The results are summarized in Table 6. Compared to CAST, the PixelLink and CRAFT are about 5∼120 times worse in terms of the inference time and 31∼49 times worse in terms of FLOPS. The CharNet is the most accurate but has an extremely poor efficiency; CharNet is a joint model of text detection and recognition, so detection results benefit from the recognition results but the model becomes extremely slow. Note that the inference time of CAST is at different unit; CAST is at the millisecond (ms) level, whereas the others are at the second (s) level. Such huge gaps in the inference time between CAST and the other models imply that the CAST has a relatively great potential for mobile environments.
Table 6.
Inference time comparison using a CPU with the ICDAR2015 dataset, where F represents the F1 score. Here ms and s represent milliseconds and seconds, respectively.
5. Conclusions
Previous studies for scene text detection mainly focused on more accurate models, but these models were computationally heavy and inefficient. We improved the efficiency in terms of the inference time, FLOPS, and the number of parameters, without heavily degrading much effectiveness. We design a new model, namely Compact and Accurate Scene Text detector (CAST), which has MobileNetV2 as a backbone and a balanced decoder. The balanced decoder is a stack of IRB and standard convolutional layers, but has an IRB at only two stages to balance the complexity between stages. According to the experimental results, we demonstrated that the balanced decoder outperforms other existing decoders and some unbalanced decoders using IRB. Using three datasets (e.g., ICDAR2013, ICDAR2015, and ICDAR2017 MLT), the CAST has demonstrated its superior efficiency (i.e., FLOPS) and comparable effectiveness (i.e., F1 score). Especially, when CAST is compared with the other models using only a CPU, there was a huge gap (e.g., 30∼115 times) in the FLOPS. We believe that CAST has great potential to be extended to mobile environments. For future work, we will conduct further experiments with mobile environments such as Android phones or a Raspberry pi. We also plan to apply the Balanced Decoder to other recent models (e.g., MobileNetV3 [35]) and keep developing better design of decoder
Author Contributions
Investigation, Methodology and Writing—original draft: M.J.; Conceptualization, Supvervision and Writing—review & editing: Y.-S.J. All authors have read and agreed to the published version of the manuscript.
Funding
This research was supported by the Soonchunhyang University Research Fund. This work was supported by the National Research Foundation of Korea(NRF) grant funded by the Korea government(MSIP; Ministry of Science, ICT & Future Planning) (No. 2019021348).
Conflicts of Interest
The authors declare no conflict of interest.
References
- Long, J.; Shelhamer, E.; Darrell, T. Fully convolutional networks for semantic segmentation. In Proceedings of the IEEE Conference on Computer Vision and Pattern Recognition (CVPR), Boston, MA, USA, 7–12 June 2015; pp. 3431–3440. [Google Scholar]
- Baek, Y.; Lee, B.; Han, D.; Yun, S.; Lee, H. Character Region Awareness for Text Detection. In Proceedings of the IEEE Conference on Computer Vision and Pattern Recognition (CVPR), Long Beach, CA, USA, 15–21 June 2019; pp. 9365–9374. [Google Scholar]
- Deng, D.; Liu, H.; Li, X.; Cai, D. Pixellink: Detecting scene text via instance segmentation. In Proceedings of the AAAI conference on Artificial Intelligence, New Orleans, LA, USA, 2–7 February 2018. [Google Scholar]
- Lyu, P.; Yao, C.; Wu, W.; Yan, S.; Bai, X. Multi-oriented scene text detection via corner localization and region segmentation. In Proceedings of the IEEE Conference on Computer Vision and Pattern Recognition (CVPR), Salt Lake, UT, USA, 18–22 June 2018; pp. 7553–7563. [Google Scholar]
- Liu, W.; Anguelov, D.; Erhan, D.; Szegedy, C.; Reed, S.; Fu, C.Y.; Berg, A.C. Ssd: Single shot multibox detector. In Proceedings of the The European Conference on Computer Vision (ECCV), Amsterdam, The Netherlands, 8–16 October 2016; Springer: Cham, Switzerland, 2016; pp. 21–37. [Google Scholar]
- Ren, S.; He, K.; Girshick, R.; Sun, J. Faster r-cnn: Towards real-time object detection with region proposal networks. In Proceedings of the Advances in Neural Information Processing Systems, Montreal, QC, USA, 7–12 December 2015; pp. 91–99. [Google Scholar]
- He, K.; Gkioxari, G.; Dollár, P.; Girshick, R. Mask r-cnn. In Proceedings of the IEEE International Conference on Computer Vision (ICCV), Venice, Italy, 22–29 October 2017; pp. 2961–2969. [Google Scholar]
- Liao, M.; Shi, B.; Bai, X. TextBoxes++: A Single-Shot Oriented Scene Text Detector. IEEE Trans. Image Process. 2018, 27, 3676–3690. [Google Scholar] [CrossRef]
- Ma, J.; Shao, W.; Ye, H.; Wang, L.; Wang, H.; Zheng, Y.; Xue, X. Arbitrary-Oriented Scene Text Detection via Rotation Proposals. IEEE Trans. Multimedia 2018, 20, 3111–3122. [Google Scholar] [CrossRef]
- Shi, B.; Bai, X.; Belongie, S. Detecting oriented text in natural images by linking segments. In Proceedings of the IEEE Conference on Computer Vision and Pattern Recognition (CVPR), Honolulu, HI, USA, 21–26 July 2017; pp. 2550–2558. [Google Scholar]
- Panetta, K. Gartner Top 10 Strategic Technology Trends for 2020. Available online: https://www.gartner.com/smarterwithgartner/gartner-top-10-strategic-technology-trends-for-2020/ (accessed on 16 February 2020).
- Zhou, X.; Yao, C.; Wen, H.; Wang, Y.; Zhou, S.; He, W.; Liang, J. EAST: An efficient and accurate scene text detector. In Proceedings of the IEEE Conference on Computer Vision and Pattern Recognition (CVPR), Honolulu, HI, USA, 21–26 July 2017; pp. 5551–5560. [Google Scholar]
- Kim, K.H.; Hong, S.; Roh, B.; Cheon, Y.; Park, M. Pvanet: Deep but lightweight neural networks for real-time object detection. arXiv 2016, arXiv:1608.08021. [Google Scholar]
- Ruan, S.; Lu, J.; Xie, F.; Jin, Z. A novel method for fast arbitrary-oriented scene text detection. In Proceedings of the 2018 Chinese Control And Decision Conference (CCDC), Shenyang, China, 9–11 June 2018; pp. 1652–1657. [Google Scholar] [CrossRef]
- He, K.; Zhang, X.; Ren, S.; Sun, J. Deep residual learning for image recognition. In Proceedings of the IEEE Conference on Computer Vision and Pattern Recognition (CVPR), Las Vegas, NV, USA, 27–30 June 2016; pp. 770–778. [Google Scholar]
- Simonyan, K.; Zisserman, A. Very deep convolutional networks for large-scale image recognition. arXiv 2014, arXiv:1409.1556. [Google Scholar]
- Howard, A.G.; Zhu, M.; Chen, B.; Kalenichenko, D.; Wang, W.; Weyand, T.; Andreetto, M.; Adam, H. Mobilenets: Efficient convolutional neural networks for mobile vision applications. arXiv 2017, arXiv:1704.04861. [Google Scholar]
- Sandler, M.; Howard, A.; Zhu, M.; Zhmoginov, A.; Chen, L.C. Mobilenetv2: Inverted residuals and linear bottlenecks. In Proceedings of the IEEE Conference on Computer Vision and Pattern Recognition (CVPR), Salt Lake, UT, USA, 18–22 June 2018; pp. 4510–4520. [Google Scholar]
- Wang, W.; Xie, E.; Li, X.; Hou, W.; Lu, T.; Yu, G.; Shao, S. Shape Robust Text Detection with Progressive Scale Expansion Network. arXiv 2019, arXiv:1903.12473. [Google Scholar]
- Lyu, P.; Liao, M.; Yao, C.; Wu, W.; Bai, X. Mask textspotter: An end-to-end trainable neural network for spotting text with arbitrary shapes. In Proceedings of the The European Conference on Computer Vision (ECCV), Munich, Germany, 8–14 September 2018; pp. 67–83. [Google Scholar]
- Xie, E.; Zang, Y.; Shao, S.; Yu, G.; Yao, C.; Li, G. Scene text detection with supervised pyramid context network. In Proceedings of the AAAI Conference on Artificial Intelligence, Honolulu, HI, USA, 27 January–1 February 2019; Volume 33, pp. 9038–9045. [Google Scholar]
- He, W.; Zhang, X.; Yin, F.; Liu, C. Multi-Oriented and Multi-Lingual Scene Text Detection With Direct Regression. IEEE Trans. Image Process. 2018, 27, 5406–5419. [Google Scholar] [CrossRef] [PubMed]
- Huang, G.; Liu, Z.; Van Der Maaten, L.; Weinberger, K.Q. Densely connected convolutional networks. In Proceedings of the IEEE Conference on Computer Vision and Pattern Recognition (CVPR), Honolulu, HI, USA, 21–26 July 2017; pp. 4700–4708. [Google Scholar]
- Ma, N.; Zhang, X.; Zheng, H.T.; Sun, J. Shufflenet v2: Practical guidelines for efficient cnn architecture design. In Proceedings of the The European Conference on Computer Vision (ECCV), Munich, Germany, 8–14 September 2018; pp. 116–131. [Google Scholar]
- Chollet, F. Xception: Deep learning with depthwise separable convolutions. In Proceedings of the IEEE Conference on Computer Vision and Pattern Recognition (CVPR), Honolulu, HI, USA, 21–26 July 2017; pp. 1251–1258. [Google Scholar]
- Zhang, X.; Zhou, X.; Lin, M.; Sun, J. Shufflenet: An extremely efficient convolutional neural network for mobile devices. In Proceedings of the IEEE Conference on Computer Vision and Pattern Recognition (CVPR), Salt Lake, UT, USA, 18–22 June 2018; pp. 6848–6856. [Google Scholar]
- Chen, L.C.; Zhu, Y.; Papandreou, G.; Schroff, F.; Adam, H. Encoder-decoder with atrous separable convolution for semantic image segmentation. In Proceedings of the The European Conference on Computer Vision (ECCV), Munich, Germany, 8–14 September 2018; pp. 801–818. [Google Scholar]
- Karatzas, D.; Shafait, F.; Uchida, S.; Iwamura, M.; i Bigorda, L.G.; Mestre, S.R.; Mas, J.; Mota, D.F.; Almazan, J.A.; De Las Heras, L.P. ICDAR 2013 robust reading competition. In Proceedings of the 12th IAPR International Conference on Document Analysis and Recognition (ICDAR), Washington, DC, USA, 25–28 August 2013; pp. 1484–1493. [Google Scholar]
- Karatzas, D.; Gomez-Bigorda, L.; Nicolaou, A.; Ghosh, S.; Bagdanov, A.; Iwamura, M.; Matas, J.; Neumann, L.; Chandrasekhar, V.R.; Lu, S.; et al. ICDAR 2015 competition on robust reading. In Proceedings of the 13th IAPR International Conference on Document Analysis and Recognition (ICDAR), Tunis, Tunisia, 23–26 August 2015; pp. 1156–1160. [Google Scholar]
- Nayef, N.; Yin, F.; Bizid, I.; Choi, H.; Feng, Y.; Karatzas, D.; Luo, Z.; Pal, U.; Rigaud, C.; Chazalon, J.; et al. Icdar2017 robust reading challenge on multi-lingual scene text detection and script identification-rrc-mlt. In Proceedings of the 14th IAPR International Conference on Document Analysis and Recognition (ICDAR), Kyoto, Japan, 9–15 November 2017; Volume 1, pp. 1454–1459. [Google Scholar]
- Kingma, D.P.; Ba, J. Adam: A method for stochastic optimization. arXiv 2014, arXiv:1412.6980. [Google Scholar]
- Ioffe, S.; Szegedy, C. Batch normalization: Accelerating deep network training by reducing internal covariate shift. arXiv 2015, arXiv:1502.03167. [Google Scholar]
- Jeon, Y.; Kim, J. Constructing Fast Network through Deconstruction of Convolution. In Advances in Neural Information Processing Systems 31; Bengio, S., Wallach, H., Larochelle, H., Grauman, K., Cesa-Bianchi, N., Garnett, R., Eds.; Curran Associates, Inc.: Red Hook, NY, USA, 2018; pp. 5951–5961. [Google Scholar]
- Xing, L.; Tian, Z.; Huang, W.; Scott, M.R. Convolutional Character Networks. In Proceedings of the IEEE International Conference on Computer Vision (ICCV), Seoul, Korea, 27 October–3 November 2019; pp. 9126–9136. [Google Scholar]
- Howard, A.; Sandler, M.; Chu, G.; Chen, L.C.; Chen, B.; Tan, M.; Wang, W.; Zhu, Y.; Pang, R.; Vasudevan, V.; et al. Searching for MobileNetV3. In Proceedings of the IEEE International Conference on Computer Vision (ICCV), Seoul, Korea, 27 October–3 November 2019. [Google Scholar]


© 2020 by the authors. Licensee MDPI, Basel, Switzerland. This article is an open access article distributed under the terms and conditions of the Creative Commons Attribution (CC BY) license (http://creativecommons.org/licenses/by/4.0/).