Article

Dynamics of the Global Stock Market Networks Generated by DCCA Methodology

1
Department of Physics, Pukyong National University, Busan 48513, Korea
2
Department of Natural Science, Korea Naval Academy, Changwon 51704, Korea
*
Author to whom correspondence should be addressed.
Appl. Sci. 2020, 10(6), 2171; https://doi.org/10.3390/app10062171
Submission received: 23 February 2020 / Revised: 17 March 2020 / Accepted: 18 March 2020 / Published: 23 March 2020
(This article belongs to the Section Applied Physics General)

Abstract

:

Featured Application

Authors are encouraged to provide a concise description of the specific application or a potential application of the work. This section is not mandatory.

Abstract

A group of stock markets can be treated as a complex system. We tried to find the financial market crisis by constructing a global 24 stock market network while using detrended cross-correlation analysis. The community structures by the Girvan-Newman method are observed and other network properties, such as the average degree, clustering coefficient, efficiency, and modularity, are quantified. The criterion of correlation between any two markets on the detrended cross-correlation analysis was considered to be 0.7. We used the return (rt) and volatility (|rt|) time series for the periods of 1, 4, 10, and 20-year of composite stock price indices during 1997–2016. Europe (France, Germany, Netherland, UK), USA (USA1, USA2, USA3, USA4) and Oceania (Australia1, Australia2) have been confirmed to make a solid community. This approach also detected the signal of financial crisis, such as Asian liquidity crisis in 1997, world-wide dot-com bubble collapse in 2001, the global financial crisis triggered by the USA in 2008, European sovereign debt crisis in 2010, and the Chinese stock price plunge in 2015 by capturing the local maxima of average degree and efficiency.

1. Introduction

Time series analysis and complex networks in the field of statistical physics are the main research areas for decades. In particular, non-stationary time series has been considered as a difficult field to work with and various methods have been developed in an effort to analyze these time series. R/S analysis, detrended fluctuation analysis (DFA) [1,2], and detrended cross correlation analysis (DCCA) [3] have been known to detect long-range correlation of time series by applying them to non-stationary time series. In addition, the complex network enables a new perspective analysis by expressing a system as nodes and edges. These two analytical methods have been applied in a variety of fields, such as physics [4], economics [5], biology [6,7], physiology [8], climate science [9], brain sciences [10], and so on.
Zebende [11] proposed the new correlation coefficient, which is the DCCA correlation coefficient that quantifies non-stationary time series using the DFA and DCCA methods. Piao and Fu [12] compared the correlation coefficients of DCCA and Pearson methods. They used temperature and relative humidity data from stations in Beijing, Jinan, Shijiazhuang, and Zhengzhou to show that the correlation coefficient of DCCA was more accurate than Pearson in the annual time series.
Newman and Girvan [13] calculated modularity to determine community structures in the network: modularity is a quantitative measurement of the network’s optimal community structure. They calculated the betweenness centrality of an edge of the network to remove the edge with the highest centrality value and calculate the modularity again. Subsequently, the structure of the network with the highest modularity value represents the best separation of groups within the network. Despalatovich et al. [14] developed the Girvan and Newman’s methods as multiple edges.
In addition, Wu et al. [15] analyzed the network community structure of a stock market using the Girvan-Newman method for 180-index data registered in the SSE (Shanghai Stock Exchange). They used Pearson correlation coefficients to build the network by varing the thresholds. They found that the network with a threshold 0.7 was a proper structure than the others. By detecting a community structure of the network, they found that corporations in the same industry belong to the same community. Silva et al. [16] built a network using the Pearson correlation coefficient for 348 stocks in the New York Stock Exchange. They created a network that reflected time evolution, and analyzed the network structure before, after, and during the Black Monday crisis. They found that, during the crisis, the modularity values were lower than other network structures. Yan et al. [17] conducted a network analysis of 710 stocks of the Shanghai Stock Exchange (SSE). They calculated the global efficiency on a yearly basis for 2005–2011, it was confirmed that the global efficiency sharply decreased when the subprime crisis occurred. Pereira et al. [18] performed a network analysis of the pre-subprime crisis period and post-subprime crisis period using the stock market indices of 20 countries for the period 2001–2017. They used the DCCA method and created a weighted network by connecting stock markets with a DCCA factor of 0.66 or more. They applied the Louvain method to detect the community structure. The network created three groups of (Europe), (America), and (Asia, Australia) during the pre-subprime crisis, and two groups of (Europe, America) and (Asia, Australia) during post-subprime crisis. There are other previous studies that performed network analysis on the stock market [19,20]. Financial markets are treated as complex systems, so network analysis is an important tool for dealing with them [21].
The stock market can be seen as an area with both time series and network features. Changes in stock prices can be characterized by time series, and the network structure is defined by connecting the correlated stock markets [22].
In this paper, we studied the DCCA method, traditional complex network analysis [5,23], and Girvan-Newman method to detect the optimal community of global 24 stock markets. We set 24 markets as nodes, and generated an edge between two markets if the DCCA coefficient between the two markets is significantly high. We divide the total 20 years data for 1997–2016 into data sets of 1, 4, 10, and 20-year periods and conducted DCCA and network analysis to examine their network structure.
In Section 2, the types and characteristics of stock market data are introduced. Additionally, a detailed description of DCCA and network analysis, especially the Girvan-Newman method is explained in Section 3. Numerical analysis and visualization of community structure and dynamics of several network properties were performed in Section 4. Finally, a semantic consideration and the meaning of the research are described and the future research directions are proposed in Section 5.

2. Data

We use closing price of stock market index from July 2, 1997 to December 30, 2016. In this paper, we used a set of time series that reconstructed the entire 20 years data into periods of 1, 4, 10, and 20-year. In economic cycle, 3–7 year is Kitchen cycle, 7–11 year is Juglar cycle, and 15–25 is called the Kuznets cycle [24]. Accordingly, we chose 4, 10, and 20-year in the economic cycle. In addition, the global efficiency was calculated from Yan et al. [17] on a one-year cycle, so we selected a period of 1, 4, 10, and 20-years in this paper. That is, 20 sets of one-year (1997, 1998,…, 2016), five sets of four-year (1997–2000, 2001–2004, 2005–2008, 2009–2012, and 2013-2016), two sets of 10-year (1997–2006, 2007–2016), and one set of 20-year time series. We generated two types of data, return (rt) and volatility (|rt|), as following [25]. The difference of logarithms for consecutive closing indices is almost identical to the return. Additionally, the absolute value is approximately same as the volatility.
r t = log ( P t + 1 ) log ( P t ) | r t | = | log ( P t + 1 ) log ( P t ) |
P t is a stock price index at time t and P t + 1 is one at time t + 1 .
Table 1 lists the names of surveyed stock markets. There are 24 markets of world-wide 19 countries. More specifically, 11 in Asia (eight countries), five in Europe (five countries), five in North America (two countries), three in South America (three countries), and two in Oceania (one country) were surveyed.
Figure 1 shows the time series of stock price indices in 24 stock markets. There are markets that rise significantly overall, whereas there are markets that repeat rising and falling. It is common that the index plunged at the midpoint of the period (the 2008 global financial crisis). However, intuitively, it is hard to understand the correlations between these market indices. In general, the Pearson correlation coefficient is used to analyze the correlation between the two time series. However, the Pearson correlation coefficient was extraordinary high for the stock price index between countries, the temperature distribution between neighboring regions, and so on. Thus, the two time series appear to be self-evidently correlated.
Thus, we will analyze the correlation between stock markets while using the detrended cross correlation analysis (DCCA) method to more strictly judge the correlation. The derived correlation is used to determine whether to connect the links between two nodes in network analysis.

3. Methodology

3.1. Detrended cross Correlation Analysis (DCCA)

The detrended cross correlation analysis (DCCA) is a method for finding long range cross correlation properties in the non-stationary time series that were proposed by Podobnik [3]. In fact, Pearson correlation coefficient is a sum of product that removes 0th order global trend (i.e., average) for the whole box size. On the other hand, DCCA is a sum of product that removes each local trend (usually 1st order) for given sized boxes. Therefore, DCCA has advantages that it can analyze the noise effect by removing various types of trend for various box sizes when compared to Pearson method [12,26]. Here, we used MATLAB as a simulation tool to apply the DCCA method, and R for network analysis and visualization.
The first step in the DCCA is to accumulate two different time series { x i } and { y i } of equal lengths N .
X k = i = 1 k x i ,   Y k = i = 1 k y i ( k = 1 ,   2 ,   ,   N )
Next, the local fluctuations are calculated, as follows.
f D F A 2 ( n , i ) = 1 n 1 k = i i + n 1 ( X k X ˜ k , i   ) 2   and f D C C A 2 ( n , i ) = 1 n 1 k = i i + n 1 ( X k X ˜ k , i   ) ( Y k Y ˜ k , i   )
Equation (3) refers to the following process. We divide total time series by a specific box-length n to create N n + 1 overlapping boxes and the limit size of the box-lengths is set to 1 / 5 of the total time series [27]. Here, X ˜ k , i and Y ˜ k , i are linear least squares in the i -th box and they are called ‘local trends’. Subtracting ’local trends’ X ˜ k , i from the accumulated data X k and averaging the sum of squares make the local fluctuation f D F A 2 ( n , i ) of i -th box with box-length n + 1 . If we want to see the cross fluctuation of the two time series, we can calculate f D C C A 2 ( n , i ) by replacing it with the mutual product for X k and Y k instead of the square for X k .
Averaging all of the local fluctuations for N n overlapping boxes, the fluctuations F D F A 2 ( n ) and F D C C A 2 ( n ) are induced as in Equation (4).
F D F A 2 ( n ) = 1 N n + 1 i = 1 N n + 1 f D F A 2 ( n , i )   and F D C C A 2 ( n ) = 1 N n + 1 i = 1 N n + 1 f D C C A 2 ( n , i )
Equation (4) is, in fact, an extended version of variance and co-variance. ’local trend’ can be any functions as well as a linear function. If the ’local trend’ is a 0-th order monomial of length n = N , the trend becomes the average value of time series, and F D F A 2 ( n ) and F D C C A 2 ( n ) are exactly same as variance and co-variance of time series. Therefore, the correlation coefficient ρ D C C A ( n ) of box-length n can be made as Equation (5). Unlike the Pearson correlation coefficient, ρ D C C A ( n ) can be obtained several values with varying box-length n .
ρ D C C A ( n ) = F D C C A 2 ( n ) F D F A 2 ( n ) F D F A 2 ( n )
The correlation coefficient has a value of 1 ρ D C C A ( n ) 1 . If ρ D C C A ( n ) is close to 1, two time series are strongly correlated. Conversely, if the value is close to -1, they are strongly anti-correlated. In both cases, we can easily infer information regarding another time series from one. If ρ D C C A ( n ) is close to 0, there is no correlation between the two time series.

3.2. Complex Network Analysis and Girvan-Newman Method

We will figure out the network properties of 24 stock markets while using the analytical methodology of complex networks. The network consists of nodes and edges: nodes are the stock markets that we want to analyze, and the edges will be connected if the correlation coefficient of Equation (5) is significantly high. That is, ρ D C C A ( n ) of the time series is higher than that of shuffled time series for all box-length n . We analyzed 24 global stock markets networks by obtaining values, such as degree, characteristic path length, efficiency, clustering coefficient, betweenness centrality [23,28], and modularity [13].

3.2.1. Degree

Consider an adjacency matrix A of a network. A component a i j = 1 if two nodes i and j are connected. Otherwise, a i = 0 . In this paper, a i j = 1 if two markets are correlated. Subsequently, the degree k i of node i is sum of a i j ’s.
k i = j i a i j

3.2.2. Characteristic Path Length

Define d i j be the shortest path length from node i to node j . Then, the characteristic path length L is defined as the average value of the shortest path length for all node pairs ( i , j ) .
L = 2 N ( N 1 ) i = 1 N j = 1 i 1 d i j

3.2.3. Efficiency

The efficiency of a network represents a measure of information exchange in the network. Efficiency uses the inverse of the shortest path. That is, shortening the path length increases the efficiency. There are two types of network efficiency: global efficiency and local efficiency. The global efficiency is the efficiency of the entire network.
E global = 2 N ( N 1 ) i = 1 N j = 1 i 1 1 d i j
E local = 1 N i = 1 N E i global
E i global is the global efficiency of the subgraph of nodes that are directly connected to node i and E local is the average of them.

3.2.4. Clustering Coefficient

Clustering is a measure of how well a network is aggregated. The clustering coefficient is calculated while using the local clustering coefficient of the specific node i . The local clustering coefficient is a measure of how well the neighboring nodes are clustered around the specific node i .
C i = number   of   triangle number   of   triplet = Δ i k i ( k i 1 ) / 2
where Δ i is the number of triangles for the sub-network of node i and its neighborhood and k i is the number of neighboring nodes. C i denotes the local clustering coefficient of node i , and their average value is the clustering coefficient of the network.
C = 1 N i = 1 N C i

3.2.5. Betweenness Centrality

The betweenness centrality of a node indicates how much the node is playing a role as an intermediate bridge in the network.
c k between = 2 ( N 1 ) ( N 2 ) i = 1 N j = 1 i 1 n i k j n i j
n i j is the number of shortest paths from node i to j and n i k j is the number of shortest paths from node i to j through node k . Thus, the betweenness centrality c k between of a node k means the average of ratio n i k j / n i j for all node pairs ( i , j ) .

3.2.6. Modularity

Modularity can be considered to be one of the ways to identify community structures in a network. Suppose that a network is divided into two groups; the nodes in the group are fully connected and those of intergroup are not connected at all. Subsequently, it is obvious to separate the network into two groups, and modularity should have the maximum value. Otherwise, if all of the node pairs are randomly connected of a given probability, it would be difficult to separate the network into sub-groups. In this case, the modularity should have a minimum value. The modularity Q is defined, as following.
Q = u = 1 N C ( e u u a u 2 ) = t r ( e ) e 2
where N C is the number of communities, e u v is the fraction of edges with one node is in community u and the other in community v , and a u is the fraction of edges that are attached to the vertices in community u .

3.2.7. Girvan-Newman Method

The Girvan-Newman method uses betweenness centrality, which is defined in Section 3.2.5. The algorithm first calculates the betweenness centrality for the all edges. Then, remove an edge with the highest betweenness centrality value and calculate the modularity Q about the new network. Repeatedly perform this process in descending order of betweenness centrality. The structure of the network with the highest modularity Q means the most divided network.

3.2.8. Create Network Structure

The correlation coefficient varies between -1 and 1, according to correlation strength between two time series. Generally, the criteria of strong correlation are known to be greater than 0.6 and very strong correlation is greater than 0.8. The threshold of a correlation coefficient for constructing a network was set to 0.7 by Wu et al. [15] and 0.66 by Pereira et al. [18]. In our results, a fully connected network was appeared at a threshold of 0.6 and a sparse network at 0.8. Therefore, we set the threshold 0.7, which is the median value of strong and very strong criteria.

4. Numerical Analysis

The detrended cross correlation analysis (DCCA) was conducted in world-wide 24 stock markets to obtain correlation coefficients between stock markets. When DCCA was applied, the box-length was shifted by 10 days. When we formed each network, we obtained θ (threshold) for the stock market by performing DCCA. The network was defined by connecting the markets where the average of the ρ D C C A for the two stock markets was 0.6 (strong) and 0.8 (very strong), which is over θ = 0.7. Subsequently, network properties, such as average degree k , characteristic path length L , global efficiency E global , local efficiency E local , clustering coefficient C , betweenness centrality c k between , and modularity Q , were calculated.
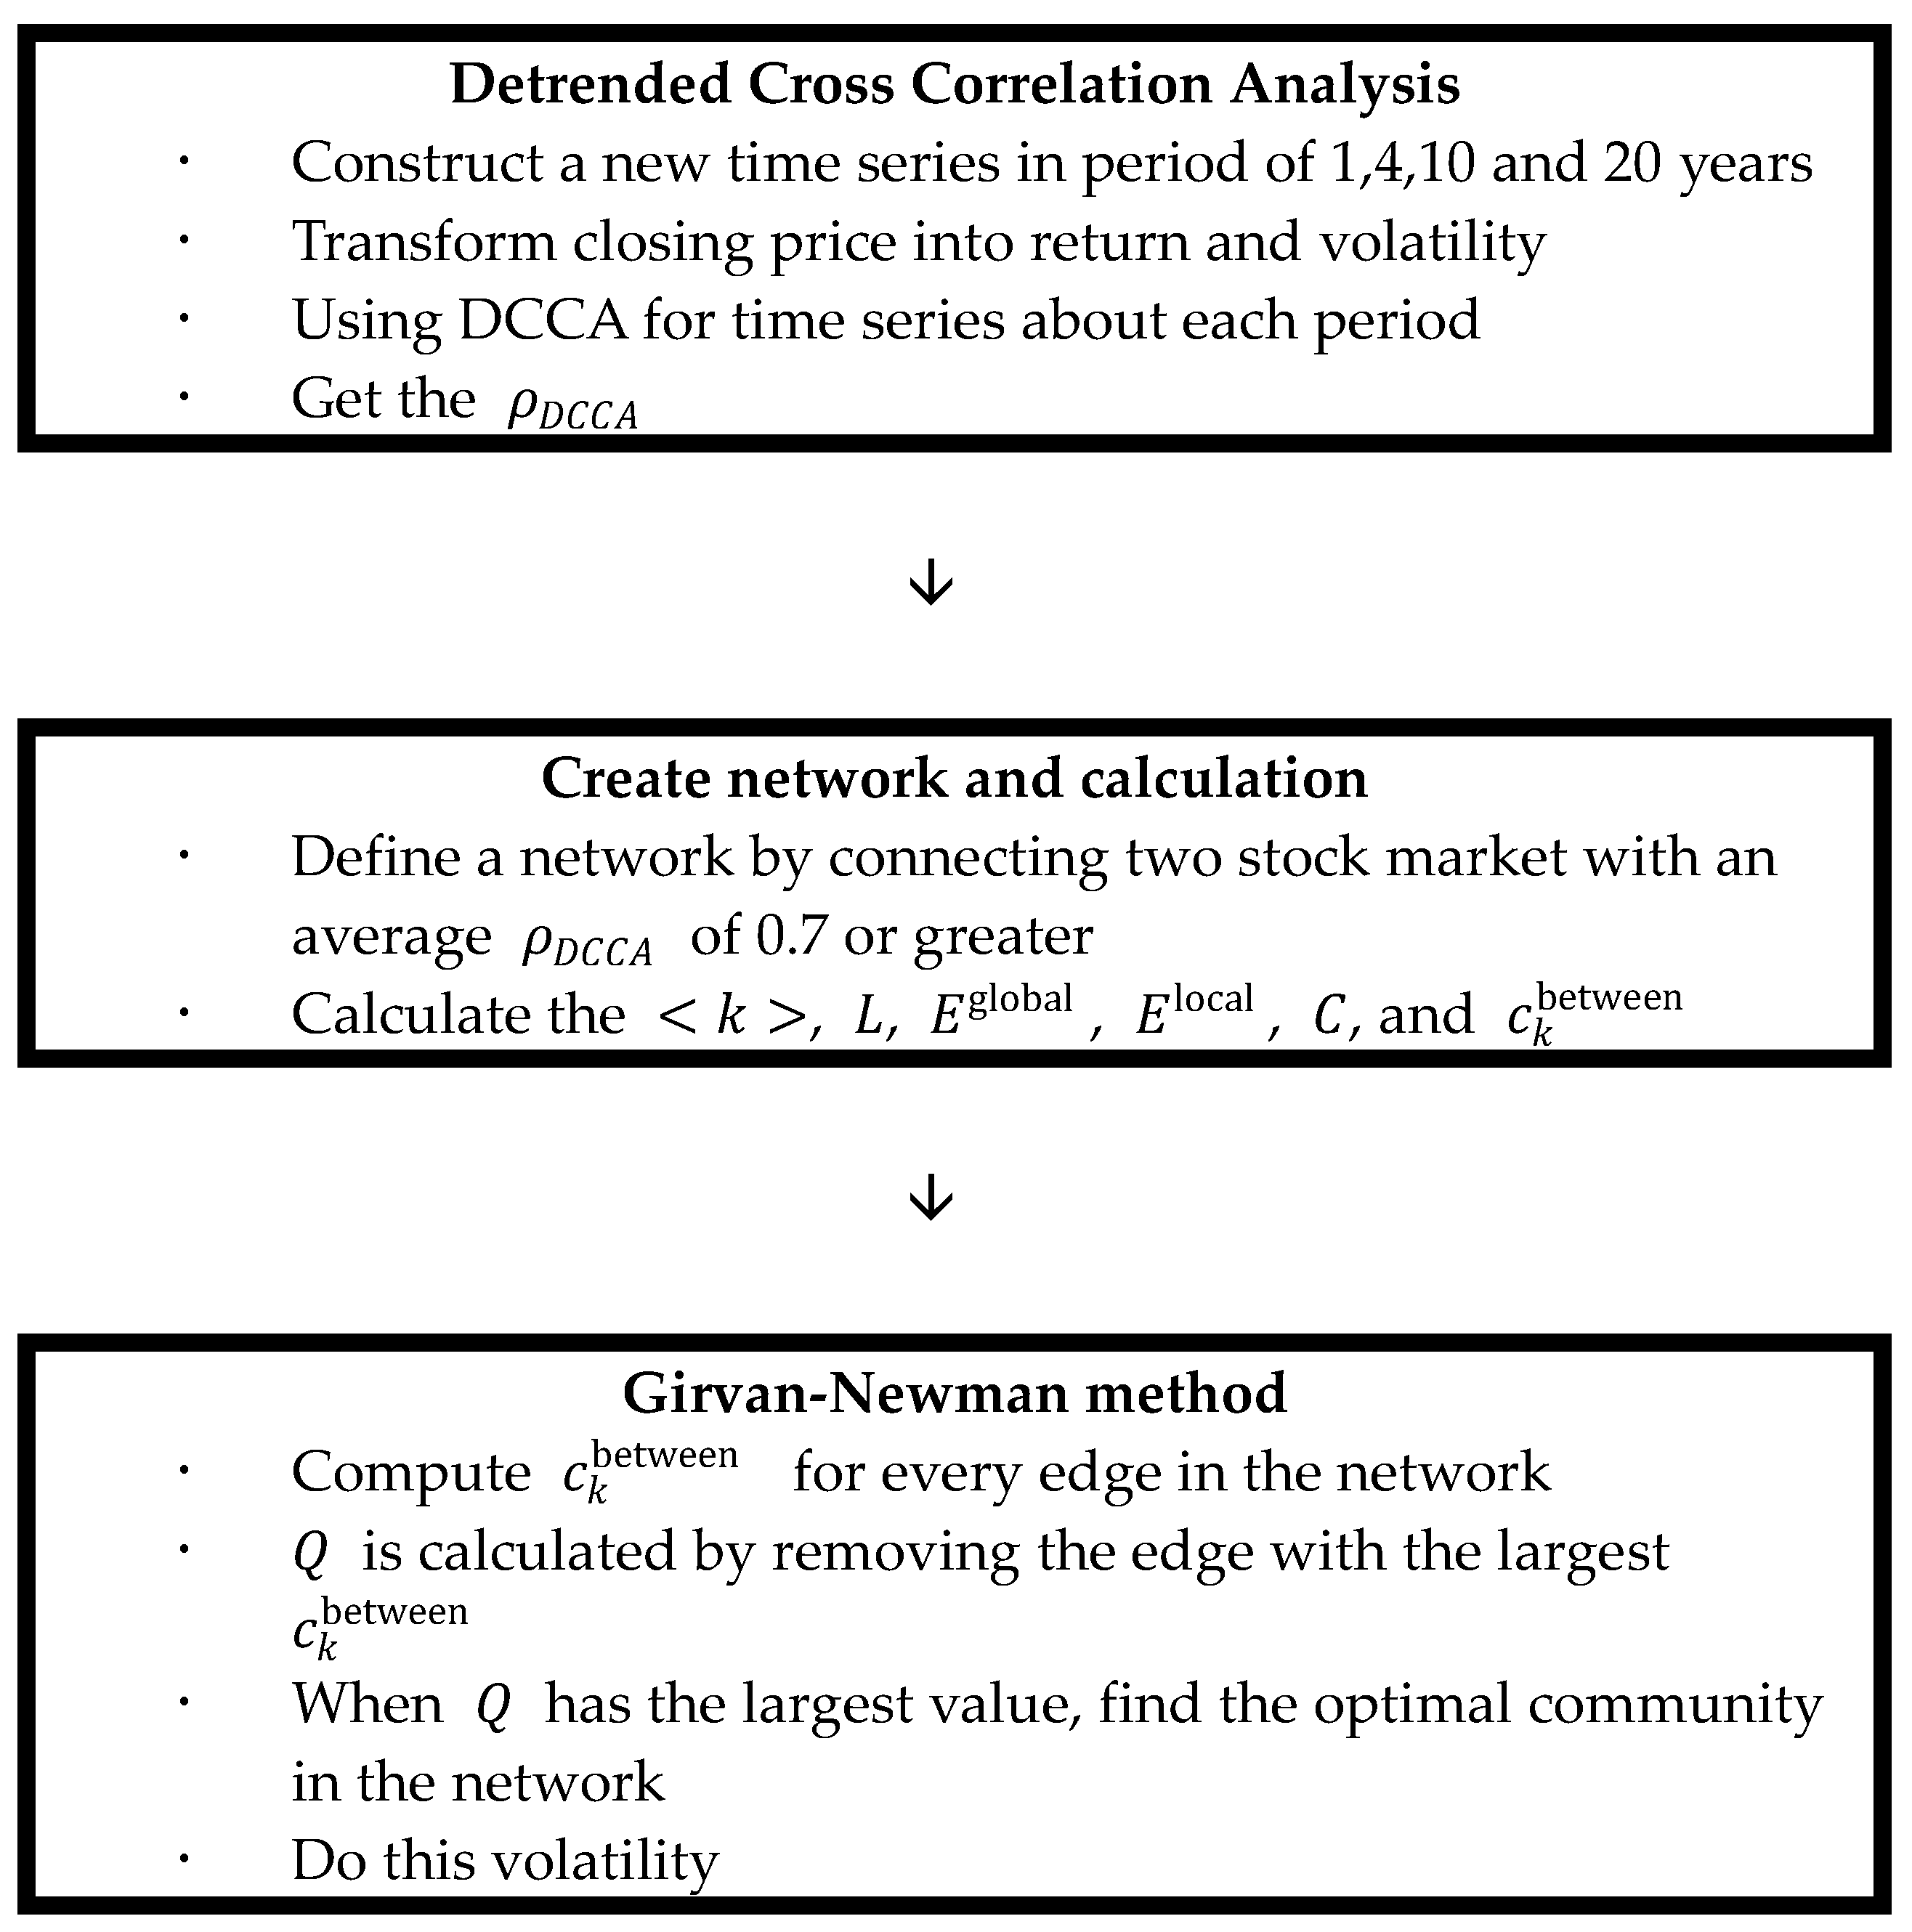
We used the newly constructed time series to see how the network changes over time. Figure 2 shows the algorithm of detrended cross correlation analysis and network analysis of this research.
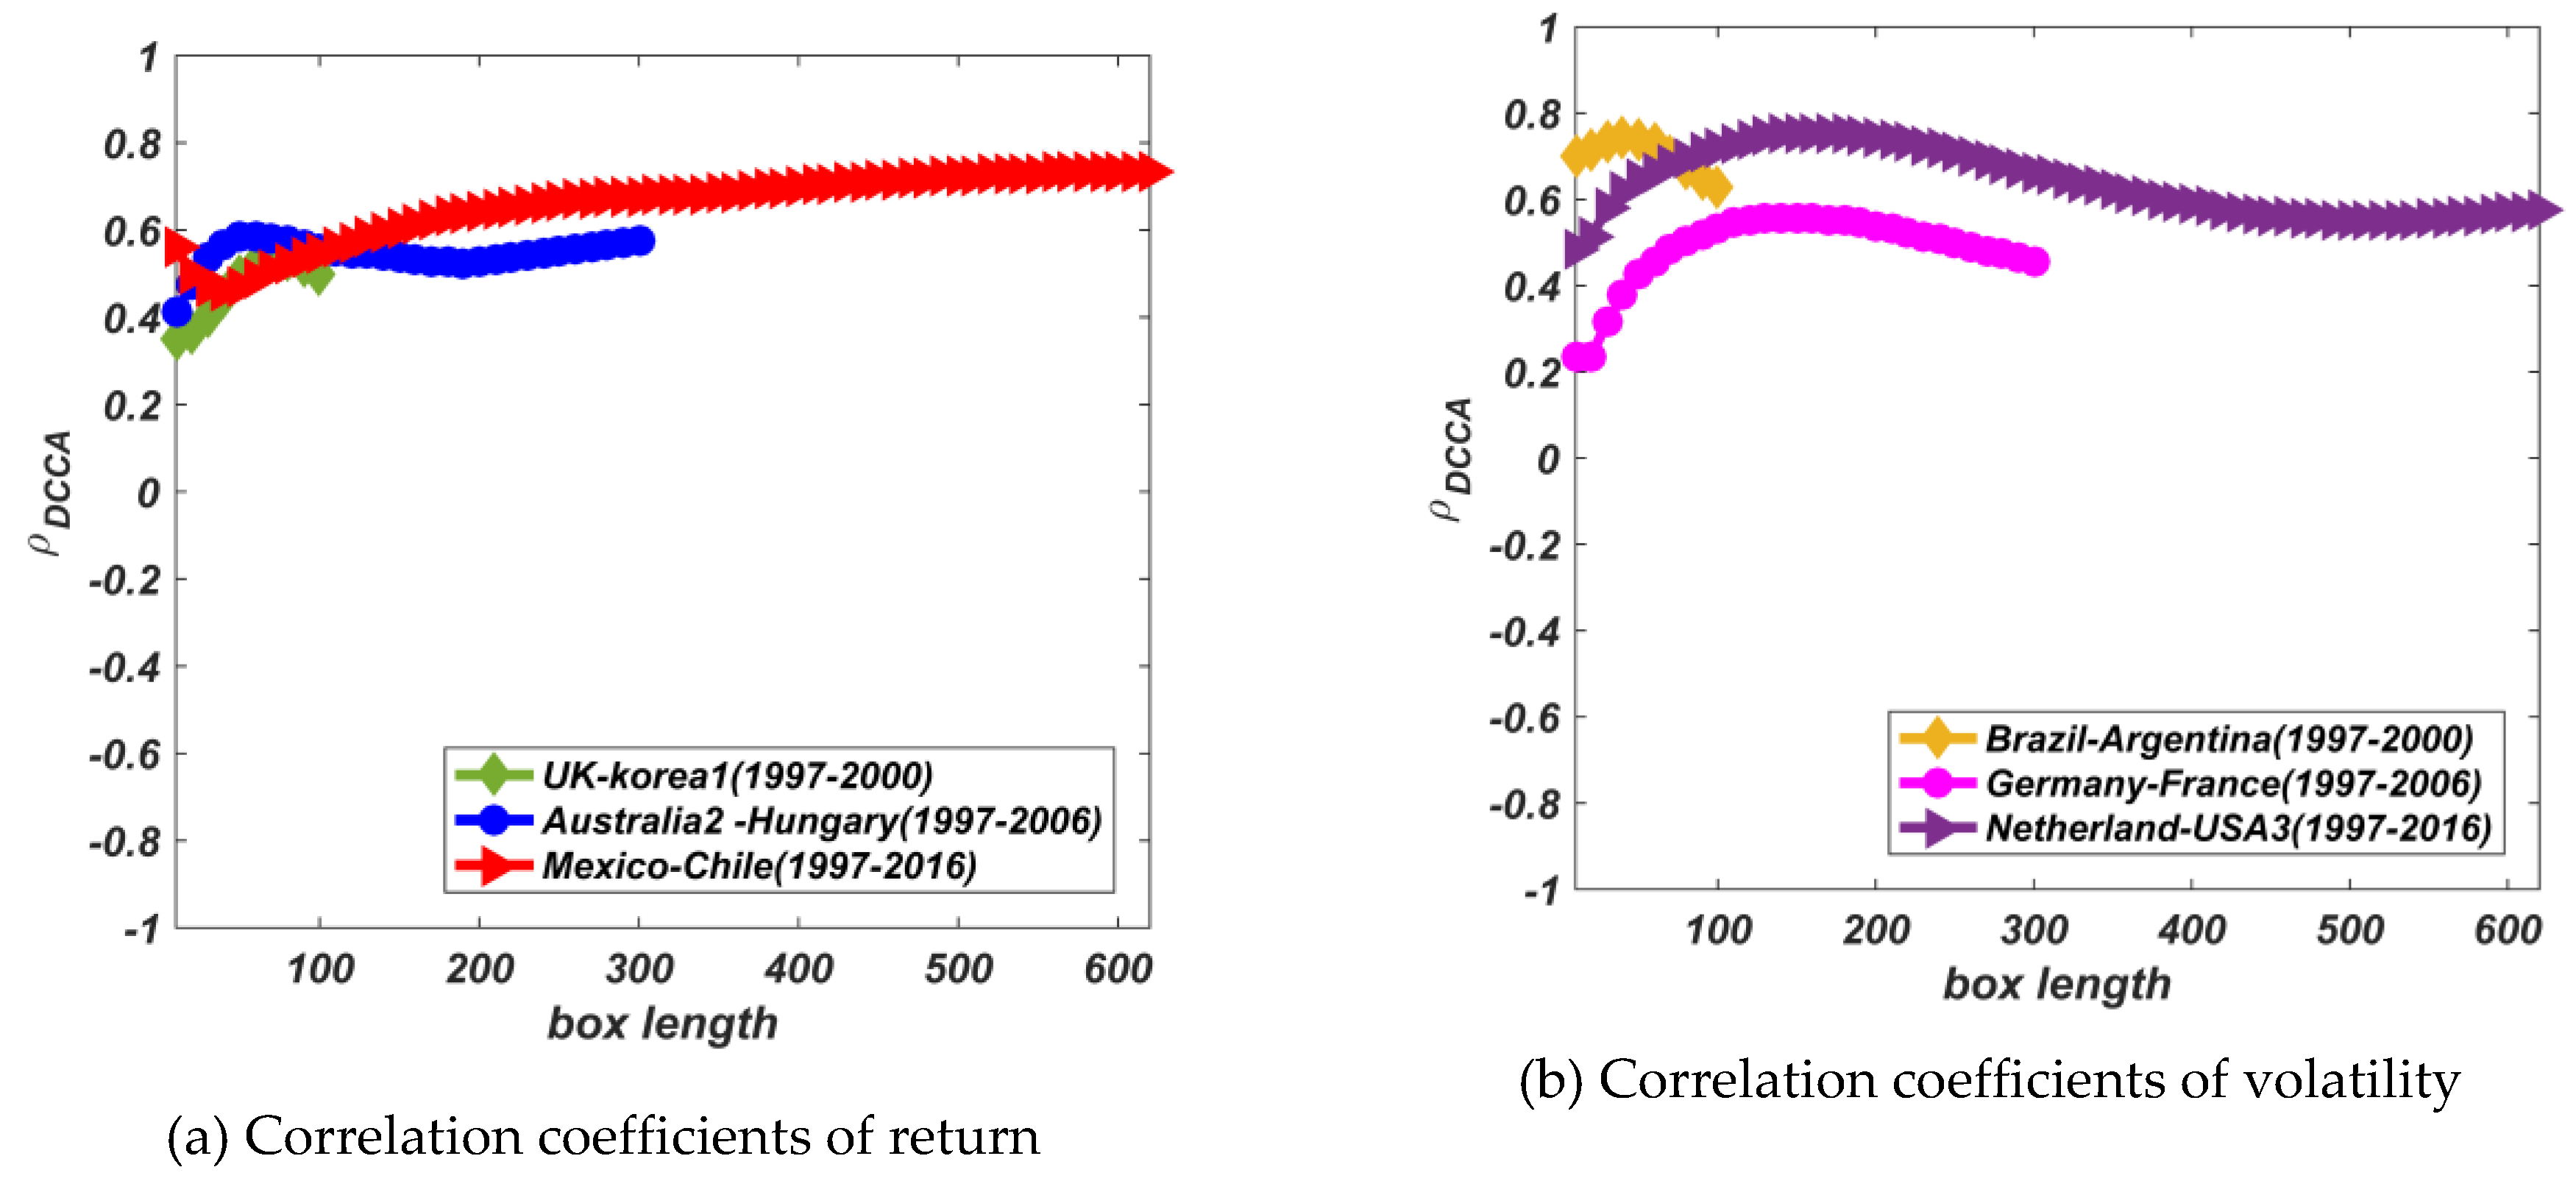
Figure 3 shows the results of DCCA on time series reconstructed into four, 10, and 20 year periods. (a) return and (b) volatility in Figure 3 are all examples of stock markets that have strongly correlated. This means that the trends of the two stock markets are almost coupled. If the average of ρ D C C A in both markets is greater than 0.7, they are connected in the network analysis, as mentioned above. In this way, the network properties for the 24 nodes were calculated for one, four, 10 and 20-year periods.
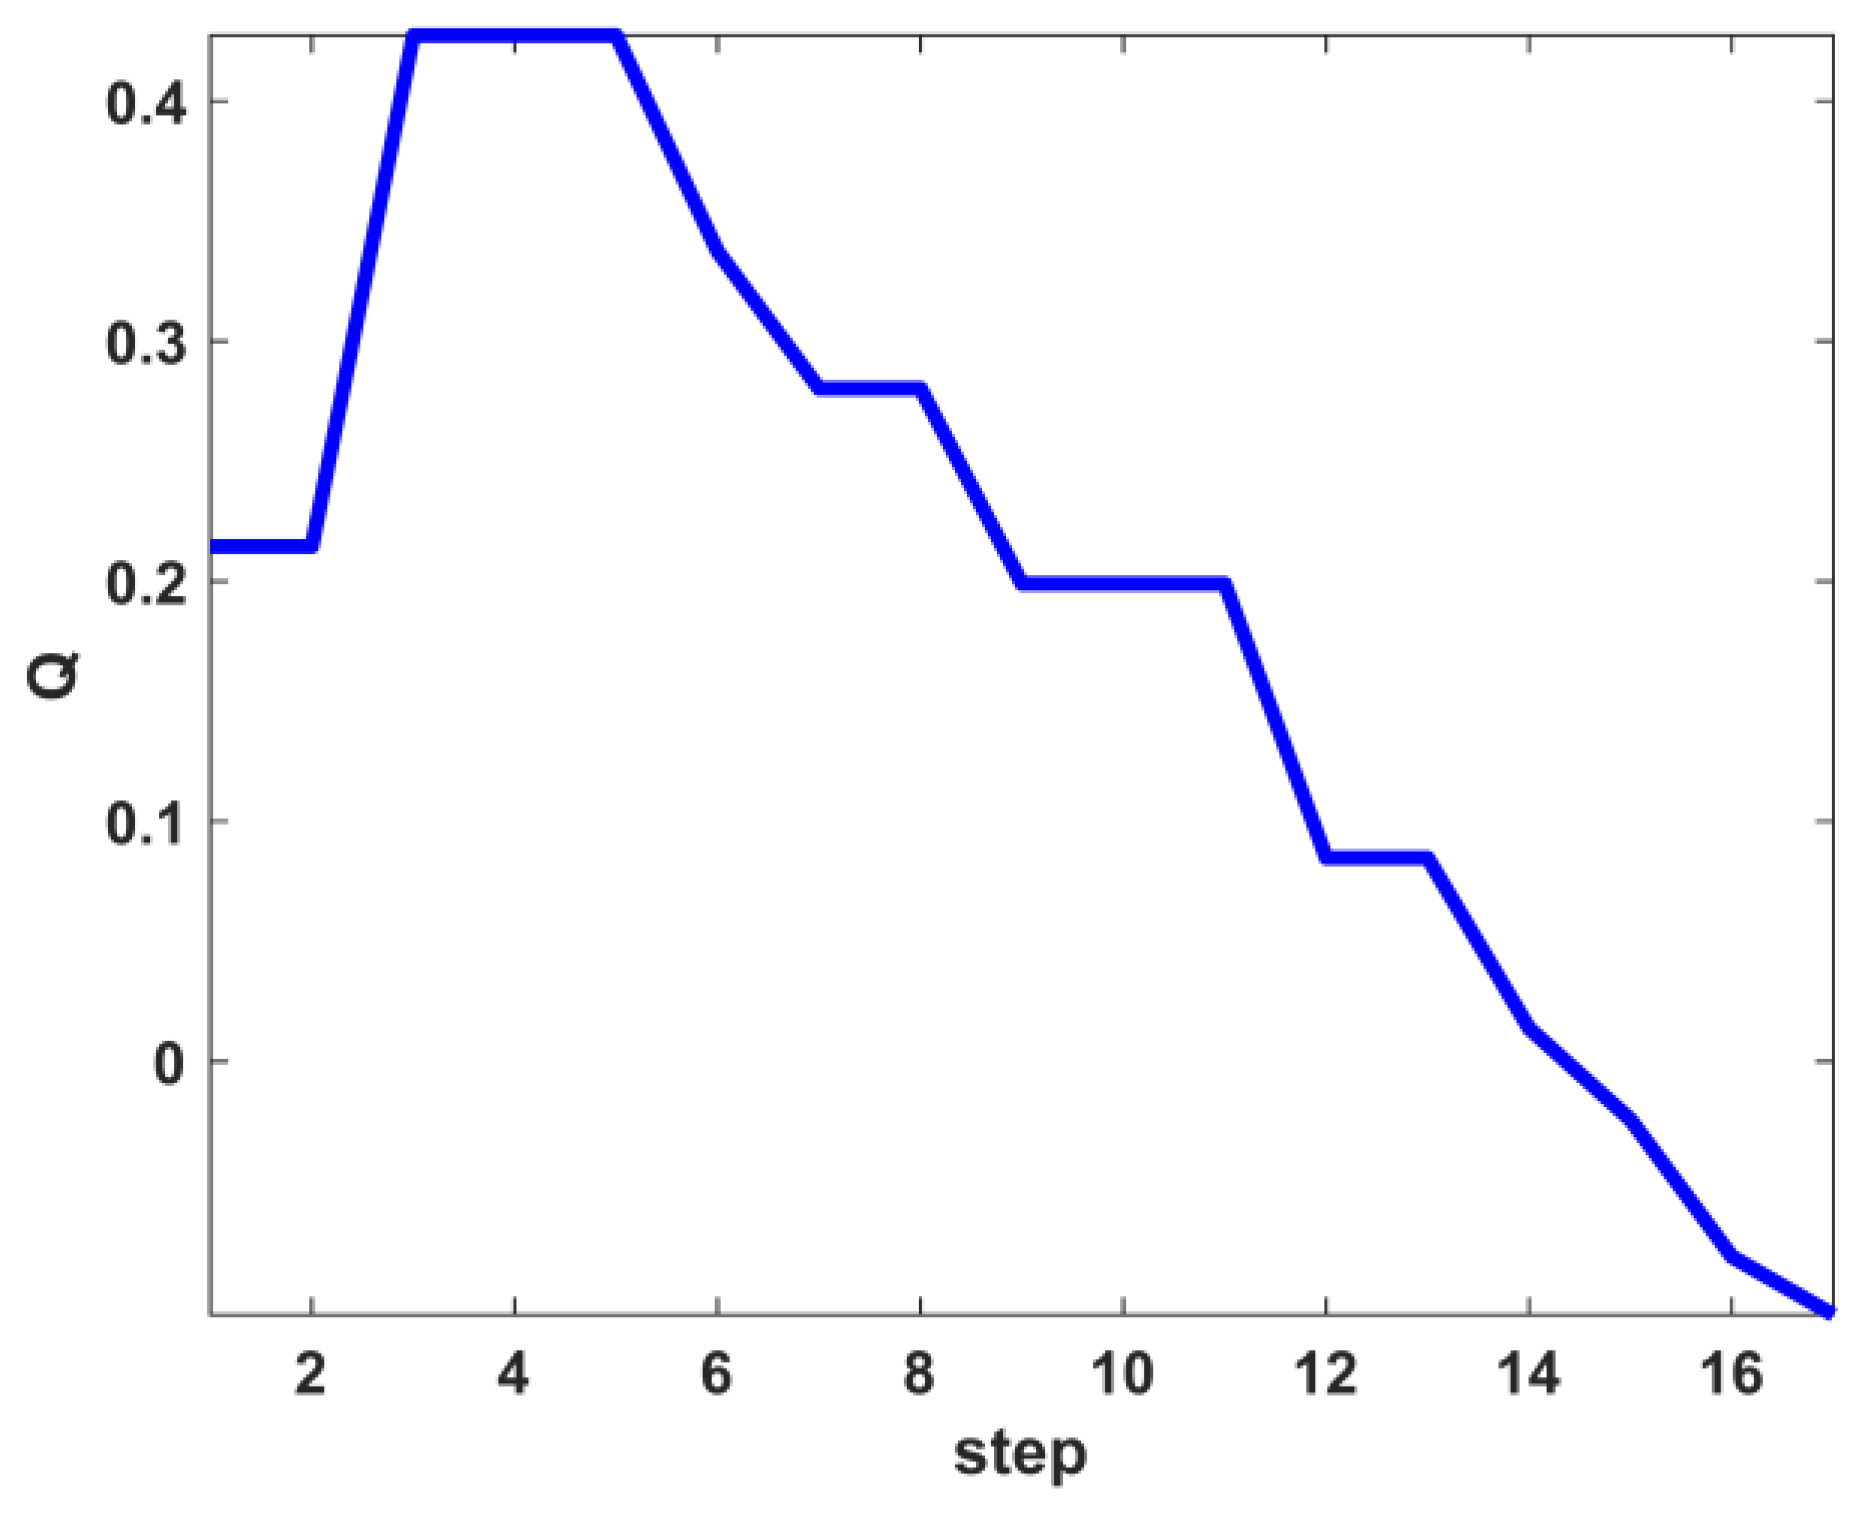
We apply the Girvan-Newman method to find the optimal community in the network. Figure 4 shows the network analysis of return for 2013–2016, which shows that the network was divided in step 3 to find the best community. Here, decreasing Q value gradually after step 3 means that the network is not divided into communities. We followed the process, as shown in Figure 4, to find the best community. Figure 5, Figure 6 and Figure 7 show the dynamics of community structures for global 24 stock market networks of return and volatility generated by DCCA partitioned by four, 10, and 20 years, respectively. We have colored nodes to identify communities, and our results show that some stock markets are scattered in small communities, or they form one large community. The left figures are the community structures for return and the rights are for volatility. As can be easily compared, the community structures are similarly formed both return and volatility. The community structure analysis using DCCA and the Girvan-Newman method showed that more than one huge community was not formed.
Figure 5 shows the dynamics of community structures from 1997 to 2016 partitioned by four years. Here, we can find three interesting properties: First, the community structure of return and volatility is similarly formed at each period. In other words, the size of community is similar, and the countries that make up the community are nearly common. Second, the size of community grows and becomes smaller during the five periods. Third, community is formed the most in the period around 2008 when the global financial crisis was triggered. Therefore, we can infer that the global stock market cooperates in the event of a financial crisis and it forms a huge community according to the Girvan-Newman method.
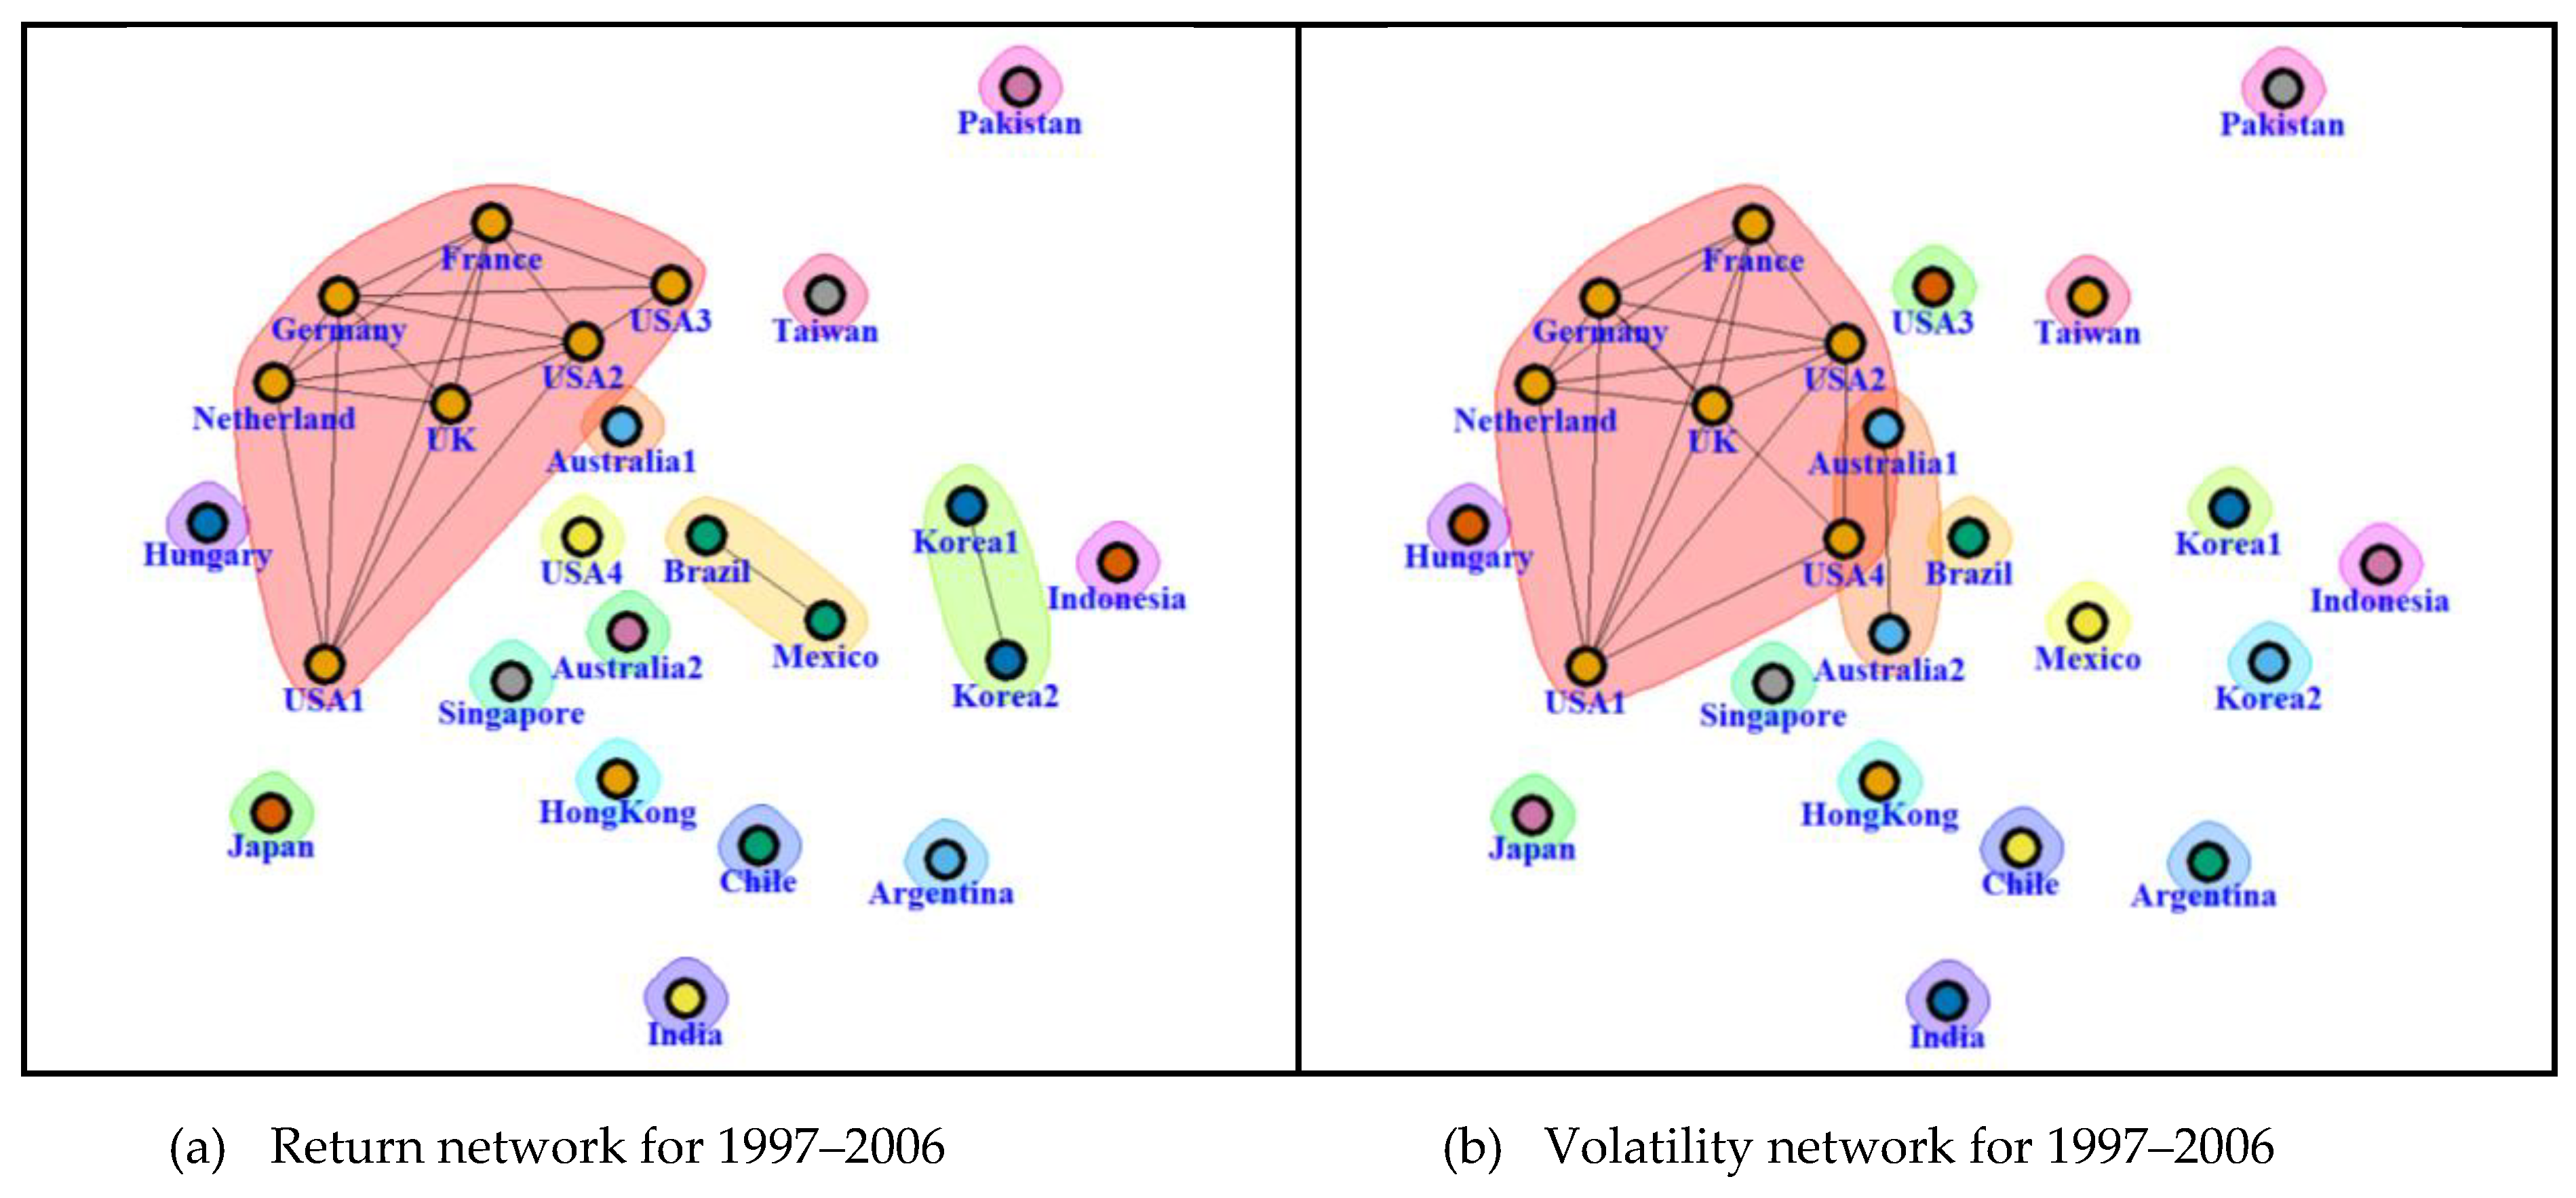
Figure 6 shows the dynamics of community structures from 1997 to 2016 that were partitioned by 10 years. The context does not change in Figure 6. It is clear that the communities are enlarged for the post decade (2007–2016) when compared to the prior decade (1997–2006). However, unlike Figure 5 and Figure 7, it can be confirmed that the volatility forms a larger community than return for 10-year time series. Except for Pakistan and Singapore, all stock markets formed a huge community in volatility network for 2007–2016.
Figure 7 shows the community structures for 20-year time series, the whole period of this study. The results of analyzing the time series for the whole period show that the similarity between return and volatility is the highest as compared to Figure 5 and Figure 6. Only developed countries, such as Europe, the United States, and Australia, form a community, and the rest of the countries are shown to maintain independence. To make it more specific in Figure 5, Figure 6, Figure 7, the community structures are listed in Table 2.
Figure 8 describes macroscopic network properties, i.e., (a) average degree k , (b) characteristic path length L , (c) global efficiency E global , (d) local efficiency E local , (e) clustering coefficient C , (f) modularity Q for return ( r t ), and volatility ( | r t | ) of global 24 stock market networks. The time series are partitioned by one-year length. Table A1 of Appendix A shows the specific values.
Except for modularity Q that is shown in Figure 8f, the remaining five properties have similar values of return and volatility. In fact, modularity Q is important for macroscopic values, but it is also important to see the mesoscopic community structures, as mentioned in Figure 5, Figure 6 and Figure 7 in detail. As mentioned earlier, community structures showed similarities in return and volatility. Thus, the network properties of global stock markets have little difference between return and volatility when we put together Figure 5, Figure 6, Figure 7 and Figure 8. Therefore, it can be inferred that the results will not change much, even if we analyze with any terms of return and volatility. However, the network properties were slightly larger in the return ( r t ), dealing with the magnitude and direction than the volatility ( | r t | ) only dealing with the magnitude.
Looking more closely at each graph, we can see that Figure 8a,c,d have very similar shapes. There are five local maxima (1997, 2001, 2008, 2010, and 2015) and one global maximum (2008) in common years. The network properties ( k , E global ,   E local ) in 2008 are (8.583, 0.590, 0.768) for return and (7.500, 0.547, 0.759) for volatility. That is the year of the global financial crisis that was triggered by the subprime mortgage crisis from the United States. This suggests that the global stock markets are more closely aligned with each other in crisis situations. In addition, there was an Asian liquidity crisis in 1997, the dot-com bubble collapse in 2001, European sovereign debt crisis in 2010, and Chinese stock price plunge in 2015. Thus, in our results, average degree k , global efficiency E global   , and local efficiency E local are seen as important indicators for analyzing or forecasting major events in the stock market.
Looking at Figure 8b as an auxiliary indicator, it can be confirmed that characteristic path length L also makes local maxima in 1997, 2000~2001, 2007, 2010~2011, and 2015~2016. On the other hand, Figure 8e is fluctuating without prominent maxima. Notable is that, since the 2000s, the values have oscillated between 0.6 and 1.0. These are very large clustering coefficients when compared to general networks, which can be inferred that the global stock market network has small-worldness. Lastly, Figure 8f shows a major difference between return and volatility, as mentioned above. In terms of return, local maxima occur in 1998, 2005, and 2013, and local minima occur in 2001, 2010 and 2014. This is similar to the reversed shapes of (a), (c), and (d).
Table 3 shows average degree k , characteristic path length L , global efficiency E global , local efficiency E local , clustering coefficient C , betweenness centrality c k between for return (rt), and volatility ( | r t | ) of global 24 stock networks. The unit lengths of the time series are four, 10, and 20 years. As the results of the one-year length analysis in Figure 8 showed that k , E global , and E local cooperate in return and volatility for four-year length time series. However, there is a difference in the maximum periods, 2005–2008 in return and 2009–2012 in volatility. This is due to the boundary of two periods, 2008–2009 is also the critical period between the US subprime mortgage crisis and the European fiscal crisis. The maximum properties ( k , E global , E local ) of four-year length time series are (6.750, 0.473, 0.620) for return in 2005–2008 and (11.083, 0.619, 0.814) for volatility in 2009–2012.

5. Conclusions

In this study, we looked for community structures and other network properties of return and volatility of global 24 stock market networks. First, we performing the detrended cross-correlation analysis (DCCA) for the return and volatility of the global 24 stock market composite price index time series for 1997–2016. We analyzed the time series divided into one year, four years, 10 years, and 20 years to see the dynamics of the network. Second, two markets are linked by considering that there is a strong correlation if the correlation coefficient of any two markets through DCCA exceeds the threshold value 0.7. Here, the threshold value 0.7 is the median of the general classification principle, strong correlation (0.6), and very strong correlation (0.8), which illustrates our analysis results well. Third, we applied the Girvan-Newman method in the stock market networks to detect the community structure. Finally, we calculated macroscopic network properties and inferred the association with international economic events.
Figure 5, Figure 6 and Figure 7 show the dynamics of optimal community structures for the global 24 stock market networks using the Girvan-Newman method for four-year, 10-year, and 20-year length time series. We can find important properties here. The community structure of return and volatility is similarly formed at each period, and the size of community grows to 2008–2012 (right after the global financial crisis triggered by USA and European fiscal crisis) and becomes smaller during the five periods. Therefore, we can infer that the global stock market cooperates in the event of a financial crisis and forms a huge community according to the Girvan-Newman method. The structures of the return and volatility are similarly formed. The stock market networks have a huge community that consists of Europe (France, Germany, Netherland, UK), USA (USA1, USA2, USA3, USA4), and Oceania (Australia1, Australia2) for 2001–2004, 2005–2008, and 2009–2012 for four-year length time series (Figure 5c–h). Additionally, several small communities were found in 1997-2000 and 2013-2016 (Figure 5a,b,i,h). The dynamics of community structures from 1997 to 2016 partitioned by 10 years does not change the characteristics. The communities are enlarged for the post decade (2007–2016) compared to the prior decade (1997–2006) and the size of communities of volatility is larger than that of return (Figure 6).
Pereira et al. [18] analyzed 20 stock markets for subprime crisis. In these results, three groups were found: (Europe), (America), and (Asia, Australia) in the pre-subprime crisis period. In the post-subprime crisis period, two groups of (Europe, America) and (Asia, Australia) are detected.
They found the characteristics of the formation of large-scaled intercontinental solidarity after the financial crisis. We found a similar property in this study. Figure 6 shows the solidarities of pre-subprime crisis. Figure 6a shows three groups: (Europe, America), (South America), and (Asia), In Figure 6b, two groups are detected: (Europe, USA) and (Australia). On the other hand, during the post-subprime crisis period, most of the stock markets formed a huge network. We analyzed 24 stock markets instead of 20 in Pereira et al. [18].
Comparing and analyzing the global stock market structure from the community perspective with their research, we can see the similar result that the structure is different before the financial crisis, but it has a huge community after the financial crisis. On the other hand, in the 20-year length time series, the community structure for the whole period can be seen as one picture, it is commonly making a community that consists of Europe, USA, and Oceania in return and volatility (Figure 7). Table 2 shows the detailed list of community.
Additionally, we inferred macroscopic properties of the global stock market networks by calculating average degree k , characteristic path length L , global efficiency E global , local efficiency E local , clustering coefficient C , and modularity Q in Equations (6)–(13) (Figure 8). The remaining five properties have similar values of return and volatility, except for modularity Q . In conclusion, we found that there was no superiority between return and volatility in network analysis. We were able to catch the events that Asian liquidity crisis in 1997, world-wide dot-com bubble collapse in 2001, global financial crisis triggered by USA in 2008, European sovereign debt crisis in 2010, and Chinese stock price plunge in 2015. Silva et al. [16] confirmed that the modularity value temporarily plummeted during the black Monday crisis. On the other hand, Yan et al. [17] showed that the E global value increased before the subprime crisis and rapidly decreased during the crisis in the SSE (Shanghai Stock Exchange) network. Both studies show that the network property value increases or decreases rapidly and sensitively responds to the financial crisis. In this paper, we confirmed that k , E global and E local are related to the financial crisis. Thus, the network properties are candidate indicators for predicting global financial market trends. However, such singularities have not been obtained for other network properties. In addition, no scientific reason has been found as to whether the three properties k , E global , and E local are related to the financial crisis.
In future studies, stock market data from a wider variety of countries will be needed to derive results that reflect reality. Moreover, we would like to construct a weighted network according to the magnitude of correlation coefficient of DCCA. Additionally, one can use another method, e.g., the Louvain algorithm, instead of Girvan-Newman method to detect optimal community in the network. Also, it is necessary to prove scientific evidence by rigorous statistical test that these network properties, such as k , E global , and E local are crucial indicators of financial crisis.

Author Contributions

Conceptualization, G.L. and S.M.; Methodology, G.L., K.-H.S. and S.M.; Modeling, K.-H.S.; Validation S.M.; Writing—original draft preparation, K.-H.S.; Writing—Review and Editing, S.M.; Funding Acquisition, S.M. All authors have read and agreed to the published version of the manuscript.

Funding

This work was supported by the National Research Foundation of Korea (NRF) in a grant funded by the Korean government (MSIT) (No. 2017R1C1B5017491). Also, this work was supported by the Korea Naval Academy Maritime Institute in 2020.

Conflicts of Interest

The authors declare no conflicts of interest.

Appendix A

Table A1. Network properties of global 24 stock markets generated by DCCA methodology partitioned with 1-year length.
DataYear k L E g l o b a l E l o c a l C Node   of   max   c k b e t w e e n with   its   value
Return19973.3331.9040.2460.5570.790USA10.109
19981.5831.8250.0990.4510.880USA20.067
19990.7502.1720.0610.0900.433USA20.055
20001.0832.6960.1020.0930.290Netherland0.121
20014.5831.4450.2630.4880.819USA40.050
20023.0001.0520.1340.3660.952Netherland0.001
20031.6661.4000.0890.3040.825USA10.016
20041.8331.5380.1080.2980.636USA20.022
20051.2501.1660.0590.3120.937Netherland0.012
20062.4161.8210.1750.3200.559USA20.090
20077.0001.7660.4370.7260.836Netherland0.109
20088.5831.6580.5900.7680.766Japan0.128
20096.3331.7900.4610.6130.893Hong Kong0.356
20106.7502.0120.5190.6620.708Korea10.192
20115.1662.3840.3950.5570.678UK0.149
20122.8331.4180.1600.4070.804USA20.060
20131.5001.5300.0880.2970.766UK0.047
20142.0831.3240.1120.3570.904USA10.024
20152.6661.6570.1790.3960.706USA30.057
20161.3332.5000.1090.2600.667Netherland0.095
Volatility19975.7501.6330.3270.6050.859France0.103
19980.6661.3840.0380.0970.583USA20.012
19990.1661.0000.0070.0000.000--
20000.3331.2000.0160.0000.000Netherland0.004
20012.0002.6200.1520.3530.663USA10.174
20021.2501.1660.0590.3470.851USA10.004
20030.6671.2000.0320.2220.888France0.008
20040.7501.3570.0410.0970.583USA20.012
20050.7501.1000.0340.2770.904Netherland0.002
20060.8331.0000.0360.2911.000--
20072.1673.4410.1820.4570.617Argentina0.217
20087.5001.8740.5470.7590.770Indonesia0.177
20091.1671.3330.0630.2430.687USA20.020
20103.0831.9900.2380.4810.711UK0.162
20112.4161.4690.1390.3630.749USA20.033
20120.8331.0000.0360.2911.000--
20130.6671.3840.0380.0970.583USA20.012
20141.0831.0000.0470.3331.000--
20153.3332.2190.2330.4540.676Korea20.095
20161.0831.8620.0700.2810.812USA20.049

References

  1. Peng, C.-K.; Buldyrev, S.V.; Havlin, S.; Simons, M.; Stanley, H.E.; Goldberger, A.L. Mosaic organization of DNA nucleotides. Phys. Rev. E 1994, 49, 1685–1689. [Google Scholar] [CrossRef] [Green Version]
  2. Hu, K.; Ivanov, P.; Chen, Z.; Carpena, P.; Stanley, H.E. Effect of trends on detrended fluctuation analysis. Phys. Rev. E 2001, 64, 011114. [Google Scholar] [CrossRef] [Green Version]
  3. Podobnik, B.; Stanley, H.E. Detrended Cross-Correlation Analysis: A New Method for Analyzing Two Non-stationary Time Series. Phys. Rev. Lett. 2008, 100, 084102. [Google Scholar] [CrossRef] [Green Version]
  4. Albert, R.; Barabási, A.L. Statistical mechanics of complex networks. Rev. Mod. Phys. 2002, 74, 47–97. [Google Scholar] [CrossRef] [Green Version]
  5. Souma, W.; Fujiwara, Y.; Aoyama, H. Complex networks and economics. Physica A 2003, 324, 396–401. [Google Scholar] [CrossRef]
  6. Mason, O.; Verwoerd, M. Graph theory and networks in biology. IET Syst. Biol. 2007, 1, 89–119. [Google Scholar] [CrossRef] [PubMed] [Green Version]
  7. de Silva, E.; Stumpf, M.P. Complex networks and simple models in biology. J. R. Soc. Interface 2005, 2, 419–430. [Google Scholar] [CrossRef] [Green Version]
  8. McNally, R.J. Can network analysis transform psychopathology? Behav. Res. Ther. 2016, 86, 95–104. [Google Scholar] [CrossRef]
  9. Steinhaeuser, K.; Chawla, N.V.; Ganguly, A.R. Complex Networks in Climate Science: Progress, Opportunities and Challenges. In Proceedings of the 2011 Conference on Intelligent Data Understanding (CIDU 2011), Mountain View, CA, USA, 19–21 October 2011; pp. 16–26. [Google Scholar]
  10. Liu, J.; Li, M.; Pan, Y.; Lan, W.; Zheng, R.; Wu, F.-X.; Wang, J. Complex brain network analysis and its applications to brain disorders: A survey. Complexity 2017, 2017, 1–27. [Google Scholar] [CrossRef]
  11. Zebende, G.F. DCCA cross-correlation coefficient: Quantifying level of cross-correlation. Phys. A 2011, 390, 614–618. [Google Scholar] [CrossRef]
  12. Piao, L.; Fu, Z. Quantifying distinct associations on different temporal scales: Comparison of DCCA and Pearson methods. Sci. Rep. 2016, 6, 36759. [Google Scholar] [CrossRef] [PubMed] [Green Version]
  13. Newman, M.E.J.; Girvan, M. Finding and evaluating community structure in networks. Phys. Rev. E 2004, 69, 026113. [Google Scholar] [CrossRef] [PubMed] [Green Version]
  14. Despalatovic, L.; Vojkovic, T.; Vukicevic, D. Community structure in networks: Improving the Girvan-Newman algorithm. In Proceedings of the 2014 37th International Convention on Information and Communication Technology, Electronics and Microelectronics (MIPRO 2014), Opatija, Croatia, 26–30 May 2014. [Google Scholar]
  15. Wu, S.; Tuo, M.; Xiong, D. Network Structure Detection and Analysis of Shanghai Stock Market. JIEMS J. Ind. Eng. Manag. 2015, 8, 383–398. [Google Scholar] [CrossRef] [Green Version]
  16. Silva, F.N.; Comin, C.H.; Peron, T.K.; Rodrigues, F.A.; Ye, C.; Wilson, R.C.; Hancock, E.; da F. Costa, L. Modular Dynamics of Financial Market Networks. arXiv 2015, arXiv:1501.05040. [Google Scholar]
  17. Yan, X.G.; Xie, C.; Wang, G.J. The stability of financial market networks. EPL Eur. Lett. 2014, 107, 48002. [Google Scholar] [CrossRef]
  18. Pereira, E.J.A.L.; Ferreira, P.J.S.; da Silva, M.F.; Miranda, J.G.V.; Pereira, H.B.B. Multiscale network for 20 stock markets using DCCA. Phys. A 2019, 529, 121542. [Google Scholar] [CrossRef]
  19. Piccardi, C.; Calatroni, L.; Bertoni, F. Clustering financial time series by network community analysis. Int. J. Mod. Phys. C 2011, 22, 35–50. [Google Scholar] [CrossRef]
  20. Tang, Y.; Xiong, J.J.; Jia, Z.-Y.; Zhang, Y.-C. Complexities in Financial Network Topological Dynamics: Modeling of Emerging and Developed Stock Markets. Complexity 2018, 2018, 31. [Google Scholar] [CrossRef] [Green Version]
  21. You, T.; Fiedor, P.; Hołda, A. Network Analysis of the Shanghai Stock Exchange Based on Partial Mutual Information. J. Risk Financ. Manag. 2015, 8, 266–284. [Google Scholar] [CrossRef] [Green Version]
  22. Xu, L.; Xu, H.; Yu, J.; Wang, L. Linkage Effects Mining in Stock Market Based on Multi-Resolution Time Series Network. Information 2018, 9, 276. [Google Scholar] [CrossRef] [Green Version]
  23. Boccaletti, S.; Latora, V.; Moreno, Y.; Chavez, M.; Hwang, D.-U. Complex networks: Structure and dynamics. Phys. Rep. 2006, 424, 175–308. [Google Scholar] [CrossRef]
  24. Ledenyov, D.O.; Ledenyov, V.O. On the accurate characterization of business cycles in nonlinear dynamic financial and economic systems. arXiv 2013, arXiv:1304.4807. [Google Scholar]
  25. Rak, R.; Drod, S.; Kwapie, J.; Owiȩcimka, P. Detrended cross-correlations between returns, volatility, trading activity, and volume traded for the stock market companies. Phys. Rev. E 2015, 112, 48001. [Google Scholar] [CrossRef] [Green Version]
  26. Horvatic, D.; Stanley, H.E.; Podobnik, B. Detrended cross-correlation analysis for non-stationary time series with periodic trends. EPL Eur. Lett. 2011, 94, 18007. [Google Scholar] [CrossRef] [Green Version]
  27. Kristoufek, L. Fractal approach towards power-law coherency to measure cross-correlations between time series. Commun. Nonlinear Sci. 2017, 50, 193–200. [Google Scholar] [CrossRef] [Green Version]
  28. Latora, V.; Marchiori, M. Efficient behavior of small-world networks. Phys. Rev. Lett. 2001, 87, 198701. [Google Scholar] [CrossRef] [Green Version]
Figure 1. Time series of stock 24 price indices of all surveyed stock markets.
Applsci 10 02171 g001
Figure 2. Schematic diagram of detrended cross correlation analysis and network analysis.
Applsci 10 02171 g002
Figure 3. Examples of pairs with strong correlation as a result of detrended cross-correlation analysis (DCCA): we construct a network by linking two stock markets where the average ρ D C C A is above 0.7 (intermediate value of strong correlation and very strong correlation).
Applsci 10 02171 g003
Figure 4. Modularity Q according to step number using the Girvan-Newman method. At first, calculate the Newman modularity Q and c k between for all edges of the initial network. Subsequently, remove the edge having largest c k between and the procedure is iterated. If Q reaches the maximum value, then the network becomes the optimal community structure. In this example, the optimal community was divided in three steps.
Applsci 10 02171 g004
Figure 5. Community structures of return and volatility for global 24 stock markets of four-year length time series. The networks are formed by DCCA and the community structure and the communities are structured by the Girvan-Newman method. The communities are gradually larger to 2005–2008, and then they are divided into small communities.
Applsci 10 02171 g005aApplsci 10 02171 g005b
Figure 6. Community structures of return and volatility for global 24 stock markets of 10-year length time series. It has a huge community compared to four-year and 20-year time series. Additionally, the larger communities are formed in the volatility than the return, and in the second half rather than the first half.
Applsci 10 02171 g006aApplsci 10 02171 g006b
Figure 7. Community structures of return and volatility for global 24 stock markets of 20-year length time series. The structures of return and volatility are almost identical. The western developed countries such that European, North American and Oceanian countries mainly form a community.
Applsci 10 02171 g007
Figure 8. Network properties of return and volatility for global 24 stock markets of 1997–2016. See Table A1 for detailed values.
Applsci 10 02171 g008
Table 1. Surveyed global 24 stock market lists.
NoNationStock MarketNoNationStock Market
1ArgentinaMERVALS13Korea1KOSPI
2Australia1AORD14Korea2KOSDAQ
3Australia2S&P ASX20015MexicoIPC
4BrazilIBOVESPA16NetherlandAEX
5ChileIGPA17PakistanKSE100
6FranceCAC4018SingaporeSTI
7GermanyDAX19TaiwanTAIMEX
8Hong KongHANGSENG20USA1DOW
9HungaryBUX21USA2S&P500
10IndiaBSE SENSEX22USA3NASDAQ
11IndonesiaIDX23USA4DOW TRANS
12JapanNIKKEI22524UKFTSE100
Table 2. Community list of global 24 stock markets of return and volatility
Figure No.CommunityStock Market
Figure 5a
Return Network
(1997–2000)
(G1) EuropeFrance, Germany, Netherland, UK
(G2) USAUSA1, USA2, USA3, USA4
(G3) OceaniaAustralia1, Australia2
(G4) C./S. AmericaArgentina, Brazil, Mexico
Figure 5b
Volatility Network
(1997–2000)
(G1) EuropeFrance, Germany, Netherland
(G2) USAUSA1, USA2, USA4
(G3) OceaniaAustralia1, Australia2
(G4) C./S. AmericaArgentina, Brazil, Mexico
Figure 5c
Return Network
(2001–2004)
(G1) EuropeFrance, Germany, Netherland, UK
  USAUSA1, USA2, USA3, USA4
  OceaniaAustralia1, Australia2
(G2) AsiaKorea1, Korea2, Taiwan
Figure 5d
(G1) EuropeFrance, Germany, Netherland, UK
Volatility Network
  USAUSA1, USA2, USA3, USA4
(2001-2004)(G2) OceaniaAustralia1, Australia2
Figure 5e
Return Network
(2005–2008)
(G1) EuropeFrance, Germany, Netherland, UK
  USAUSA1, USA2, USA3
  OceaniaAustralia1, Australia2
  C./S. AmericaBrazil, Mexico
  AsiaHong Kong, India, Japan
Figure 5f
Volatility Network
(2005–2008)
(G1) EuropeFrance, Germany, Hungary, UK
  USAUSA1, USA2, USA3
  C./S. AmericaArgentina, Brazil, Mexico
  AsiaHong Kong, Korea1
Figure 5g
Return Network
(2009–2012)
(G1) EuropeFrance, Germany, Netherland, UK
  USAUSA1, USA2, USA3, USA4
  OceaniaAustralia1, Australia2
  C./S. AmericaBrazil, Mexico
  AsiaKorea1
Figure 5h
Volatility Network
(2009–2012)
(G1) EuropeFrance, Germany, Netherland, UK
  USAUSA1, USA2, USA3, USA4
  C./S. AmericaBrazil, Mexico
(G2) AsiaHong Kong, Indonesia, Taiwan
Figure 5i
Return Network
(2013–2016)
(G1) EuropeFrance, Germany, Netherland, UK
(G2) USAUSA1, USA2, USA3, USA4
(G3) OceaniaAustralia1, Australia2
(G4) AsiaHong Kong, Korea1
Figure 5j
Volatility Network
(2013–2016)
(G1) EuropeFrance, Germany, Netherland, UK
(G2) USAUSA1, USA2, USA3, USA4
(G3) OceaniaAustralia1, Australia2
(G4) AsiaKorea1, Taiwan
Figure 6a
Return Network
(1997–2006)
(G1) EuropeFrance, Germany, Netherland, UK
  USAUSA1, USA2, USA3
(G2) C./S. AmericaBrazil, Mexico
(G3) AsiaKorea1, Korea2
Figure 6b
(G1) EuropeFrance, Germany, Netherland, UK
Volatility Network
  USAUSA1, USA2, USA4
(1997–2006)(G2) OceaniaAustralia1, Australia2
Figure 6c
Return Network
(2007–2016)
(G1) EuropeFrance, Germany, Hungary, Netherland, UK
  USAUSA1, USA2, USA3, USA4
  OceaniaAustralia1, Australia2
  C. AmericaMexico
  AsiaHong Kong, Japan, Korea1, Taiwan
Figure 6d
Volatility Network
(2007–2016)
(G1) EuropeFrance, Germany, Hungary, Netherland, UK
  USAUSA1, USA2, USA3, USA4
  Oceania Australia1, Australia2
  C./S. AmericaArgentina, Brazil, Chile, Mexico
  AsiaHong Kong, India, Indonesia, Japan, Korea1, Korea2, Taiwan
Figure 7a
Return Network
(1997–2016)
(G1) EuropeFrance, Germany, Netherland, UK
  USAUSA1, USA2, USA3
  OceaniaAustralia1, Australia2
  (G2) AsiaKorea1, Korea2
Figure 7b
(G1) EuropeFrance, Germany, Netherland, UK
Volatility Network
  USAUSA1, USA2, USA4
(1997–2016)  OceaniaAustralia1, Australia2
Table 3. Network properties of global 24 stock markets generated by DCCA methodology
DataPeriodYear k L E global E local C Node   of   max   c k b e t w e e n with   its   value
return4 years1997-20001.2501.8120.0790.3610.866USA20.055
2001-20043.4161.3270.1780.3850.794USA30.036
2005-20085.9161.8880.4110.5580.728Korea10.130
2009-20126.7501.7260.4730.6200.787Hong Kong0.157
2013-20161.4161.5660.0820.2950.791Netherland0.024
10 years1997-20062.0831.5530.1280.3270.791UK0.035
2007-201610.5001.4470.6020.8050.842Korea10.069
20 years1997-20164.8331.7370.3410.5080.785Hong Kong0.123
volatility4 years1997-20000.8331.2300.0410.2220.761France0.008
2001-20041.5831.3790.0860.3000.808USA10.013
2005-200811.0831.3800.6190.8140.862Netherland0.063
2009-20125.0001.9210.3600.5410.698Korea10.165
2013-20161.8331.5780.1050.3410.822USA10.024
10 years1997-20061.6671.3100.0880.2680.881USA20.028
2007-201617.0831.1120.7890.8800.921Netherland0.008
20 years1997-20166.8331.8180.5420.6610.752Hong Kong0.260