Article

Automatic Language Identification Using Speech Rhythm Features for Multi-Lingual Speech Recognition

1
Department of English Linguistics, Hankuk University of Foreign Studies, Seoul 02450, Korea
2
Department of English Linguistics and Language Technology, Hankuk University of Foreign Studies, Seoul 02450, Korea
*
Author to whom correspondence should be addressed.
Appl. Sci. 2020, 10(7), 2225; https://doi.org/10.3390/app10072225
Submission received: 21 February 2020 / Revised: 14 March 2020 / Accepted: 20 March 2020 / Published: 25 March 2020
(This article belongs to the Section Computing and Artificial Intelligence)

Abstract

:

Featured Application

This research can be applied for a multi-lingual automatic speech recognition system that handles input speech with two or more languages. Such a system requires the rapid identification of a language from input speech to transmit the speech to a recognition server targeting the language.

Abstract

The conventional speech recognition systems can handle the input speech of a specific single language. To realize multi-lingual speech recognition, a language should be firstly identified from input speech. This study proposes an efficient Language IDentification (LID) approach for the multi-lingual system. The standard LID tasks depend on common acoustic features used in speech recognition. However, the features may convey insufficient language-specific information, as they aim to discriminate the general tendency of phonemic information. This study investigates another type of feature characterizing language-specific properties, considering computation complexity. We focus on speech rhythm features providing the prosodic characteristics of speech signals. The rhythm features represent the tendency of consonants and vowels of languages, and therefore, classifying them from speech signals is necessary. For the rapid classification, we employ Gaussian Mixture Model (GMM)-based learning in which two GMMs corresponding to consonants and vowels are firstly trained and used for classifying them. By using the classification results, we estimate the tendency of two phonemic groups such as the duration of consonantal and vocalic intervals and calculate rhythm metrics called R-vector. In experiments on several speech corpora, the automatically extracted R-vector provided similar language tendencies to the conventional studies on linguistics. In addition, the proposed R-vector-based LID approach demonstrated superior or comparable LID performance to the conventional approaches in spite of low computation complexity.

Graphical Abstract

1. Introduction

Standard Automatic Speech Recognition (ASR) systems are constructed for a specific language [1]. Hence, a system receiving speech data of a different language from the target language may operate incorrectly. In fact, ideal ASR systems should be capable of recognizing speech data regardless of languages. The Language IDentification (LID) identifying a language from given input speech can be a highly reliable pre-processing of the multi-lingual ASR systems.
The LID module generally implements two consecutive procedures: feature extraction and classification [2]. Feature extraction aims to obtain useful LID features from input speech. Then, the classification procedure identifies a language type from the features using pattern recognition approaches. Many types of features have been applied for LID [3,4], ranging from simple features such as pitch, speed, and energy to acoustic features such as Mel Frequency Cepstral Coefficient (MFCC). For classification, pattern recognition methods such as Support Vector Machine (SVM) and Linear Discriminant Analysis (LDA) have been generally used [5]. Recently, deep learning approaches were applied for LID [6].
Among various features, acoustic ones such as MFCC efficiently represent discriminative phonemic properties of speech signals—and have thus been used as fundamental features for LID and speech recognition. However, these features may insufficiently convey language-specific information as they aim to discriminate the general tendency of phonemic information. Some attempts based on i-vector and Deep Neural Network (DNN) were introduced for the purpose of deriving further language-specific information from the acoustic features [7,8]. Although the approaches provided superior LID performance compared to a standard MFCC-based approach, an additional training procedure is required to obtain optimal i-vector sets and DNN parameters, thus increasing the computation time and hardware capacity. This study aims to investigate another type of feature characterizing language-specific properties, considering computation complexity.
In previous linguistics studies, some prosodic characteristics were introduced as good measures discriminating language properties [9,10]. Several studies reported that speech rhythm efficiently represents the prosodic characteristics of speech signals [11,12,13,14]. The rhythm metrics, a representative way measuring speech rhythm, are calculated from consonantal and vocalic intervals, and they characterize the fluctuation of vocalic and consonantal intervals. The studies reported that the features provide different outputs according to languages.
In consideration of the properties of rhythm metrics, this study proposes an LID approach using the speech rhythm as a feature. For this purpose, the way to automatically extract correct rhythm metrics from speech signals should be considered first, followed by the investigation of a pattern recognition approach that is suitable for rhythm metrics.
This paper is organized as follows. In Section 2, the conventional LID approaches and their limitations are introduced. In Section 3, rhythm metrics and their usability for LID tasks are addressed. In addition, the proposed approach regarding the automatic extraction of rhythm metrics and overall LID procedure using the features are explained. In Section 4, several experiments conducted on several corpora and their results are reported. Section 5 concludes this paper.

2. The Conventional Language Identification Approaches

In this section, several conventional LID approaches are introduced, concentrating on two fundamental procedures of LID: feature extraction and classification.

2.1. Feature Extraction Approaches for LID

The conventional feature extraction approaches have concentrated on the search for useful features in LID. Various types of features from one-dimensional and simple ones (including pitch, speed, and energy) to acoustic features such as MFCC and shifted delta cepstral coefficients have been applied for LID [3,4,15]. Among them, the MFCC has been used as a fundamental feature for LID as in speech recognition. However, the MFCC may insufficiently convey language-specific information as they aim to discriminate the general tendency of phonemic information.
To derive further language-specific information from the acoustic features, additional approaches were introduced [7,8]. The representative approach is to apply the i-vector for LID [7]. The i-vector was firstly introduced for speaker recognition [16]. The i-vector-based LID approach mainly employs Joint Factor Analysis (JFA), in which respective feature vectors are regarded as a linear combination with language-independent and language-dependent features [17]. The language-independent features are modeled in the form of a Gaussian Mixture Model (GMM)-based Universal Background Model (UBM), and a GMM supervector is obtained. Next, language-dependent features are configured as two measurements (an eigenmatrix and an eigenvector). The eigenmatrix is generally regarded as a Total-Variability Matrix (TV-Matrix). The i-vector-based approach is summarized as:
M = m + Tw
where M is regarded as a combination of language-independent features described as a GMM- supervector m and language-dependent features deriving a TV-matrix T and i-vector w. The main procedure is to estimate i-vector using both a GMM-supervector and a TV-matrix.
Another attempt for deriving more reliable LID features is based on DNN. A representative feature is the DNN-Bottle Neck (BN), which is an intermediate result of feedforward neural network used in conventional DNN-based speech recognition approaches [18,19]. The DNN-BN feature was applied to the LID task in the expectation that the feature is pertinent to language-discriminative information. Another DNN-based approach employs the Convolutional Neural Network (CNN) [2,20]. The CNN-based speech recognition generates outputs called ‘senone’. Some studies have reported that the senone represents language-based information and therefore can be used as a LID feature.

2.2. Classification Approaches for Language Identification

In addition to feature extraction approaches, there have been significant efforts in terms of pattern classification. Various pattern classification approaches such as SVM and LDA have been employed for LID. The SVM is a representative supervised learning method that has been used for classification, regression, and outlier detection [21]. It aims to derive a kernel function from a set of training data for the purpose of setting a criterion for classification. The LDA regards the distribution of feature vectors as multivariate normal distribution [22,23]. The main objective of LDA is to find an optimal linear decision boundary that furthers the distance of mean values of each data group while making the covariance of data belonging to each group smaller.
In recent years, deep learning-based classification approaches have been investigated for LID. The Recurrent Neural Network (RNN)-based modeling approach, which widely uses the Long Short-Term Memory (LSTM) as an architecture, is representative as it is very pertinent to time-series data. A more sophisticated LSTM called the bidirectional LSTM was applied for CNN-based LID [24].

2.3. Drawbacks of the Conventional Language Identification Approaches

Although the conventional approaches have been successfully applied to LID tasks, they have limitations in multi-lingual ASR systems in which the LID module needs to be directly conducted on a user device. First, in the i-vector-based approach, GMM supervector, and TV-Matrix should be trained with hyperparameters according to the number of GMM mixtures and a dimension of the i-vector, as demonstrated in Equation (1). For example, if the dimension of the i-vector is defined by D and the dimension of the mean supervector from UBM refers to M, the size of the TV-Matrix should be M X D. As the number of languages increases, a higher dimension of i-vector is required, thus increasing the computation time.
Next, in the DNN-based approaches, the feedforward neural network generally uses a number of hidden layers for reliable training, and thus estimation of the DNN feature requires a large amount of processing time and hardware resources. In consideration of computation complexity, both the i-vector and DNN approaches may not be suitable for LID modules employed in user devices with low hardware capacity.
Another drawback of the conventional approaches is considered in terms of language-discriminative features. The approaches have a strong expectation that features derived from i-vector or DNN-BN convey language-discriminative information. However, the approaches initially process language-independent acoustic features such as MFCC or Short-Time Fourier Transform (STFT) to derive the feature. Hence, the output of i-vector or DNN-BN may have insufficient language information.
To overcome the limitations of the conventional approaches, this study proposes a new LID approach based on language-discriminative features called rhythm metrics that were originally introduced in linguistics studies.

3. Automatic Language Identification Using Speech Rhythm Features

In this section, the fundamental characteristics of speech rhythm features called rhythm metrics and their usability for LID tasks are addressed. Then, an approach for the automatic extraction of rhythm metrics and the overall LID procedure using the features are explained.

3.1. Rhythm Metrics

Previous studies on linguistics and phonetics reported that speech rhythm effectively represents the prosodic characteristics of speech signals. Speech rhythm was firstly introduced with the concept of isochrony [25,26], which insisted that languages are classified into stress-timed languages and syllable-timed languages. According to the studies, each of the two groups of languages has identical time intervals in stressed units and the syllable units, respectively. After some research studies advanced the concepts of speech rhythm [27,28], studies quantifying them were conducted from the 1990s onward. A representative measurement of speech rhythm is known as rhythm metrics [11,12,13,14]. Rhythm metrics concentrate on differences of languages in terms of the duration of consonantal and vocalic intervals. Ramus et al. [11] introduced some rhythm metrics including %V, ΔC, and ΔV. %V denotes the proportion of vocalic intervals within one utterance, and ΔC and ΔV refer to standard deviation values of vocalic and consonantal intervals, respectively, reflecting the fluctuation of intervals. In [13] and [14], other rhythm features were proposed: Varco-C and Varco-V. They reduce the effect of the speech rate by normalizing ΔC and ΔV, respectively, with mean values. The Raw Pairwise Variability Index (rPVI) for consonantal intervals and normalized PVI (nPVI) for vocalic intervals were additionally introduced in [12] to identify differences in consecutive intervals.

3.2. Usability of Rhythm Metrics in Language Identification

Several studies on linguistics reported some tendencies of rhythm metrics for certain languages [11,12]. In general, English showed the lowest value for %V. ΔV provided little differences between languages, whereas significant differences in ΔC were observed, indicating an adverse tendency to %V. Grabe et al. [12] investigated nPVI and rPVI for 18 languages. According to the study, the nPVI value of English was significantly different from values of French, Spanish, Singapore, and Mandarin, while rPVI resulted in hardly any difference. In [14], four languages (English, Spanish, Dutch, and French) were investigated with regard to seven different metrics (%V, ΔV, ΔC, Varco-V, Varco-C, nPVI-V, and rPVI-C).
Some studies have investigated rhythmic characteristics for Asian languages. The Korean language was examined by [29], in which the characteristics of Korean were found to be similar to those of Japanese; both belong to mora-timed languages—that is, they are located between syllable-timed languages and stress-timed languages. In the results of rhythm metrics evaluation, Korean showed characteristics of intermediate languages of syllable-timed languages and stress-timed languages, except for ΔV and nPVI-V [30]. Chinese showed low ΔC and rPVI-C compared to English and Japanese [11,12]. However, its nPVI value was higher than that of Japanese and its %V value was even higher than that of English.
According to the studies, the rhythm metrics are meaningful to represent language-specific prosodic properties such as accentual lengthening, word-initial lengthening, and phase-final lengthening [14]. Although some metrics such as ΔV and nPVI-V did not show a consistent tendency, rhythm metrics provided evident properties for discriminating different languages [11,31]. Thus, it imparts a strong expectation that rhythm metrics provide sufficient language information as language-discriminative features in LID tasks. In particular, the features are simply estimated and require lower computation time and hardware capacity compared to the conventional feature extraction approaches such as i-vector and DNN-BN, thus supporting a device-driven LID module.

3.3. Automatic Extraction of Rhythm Metrics

Properties of rhythm metrics have been investigated in a non-automatic way with a limited amount of language data. There are very few attempts to extract rhythm metrics automatically. In this study, we propose an approach for the automatic extraction of rhythm metrics. Figure 1 describes the overall procedure of the automatic extraction of rhythm metrics that are called R-vectors herein. The procedure mainly consists of two steps: the detection of consonantal and vocalic intervals and the estimation of rhythm metrics.

3.3.1. Detection of Consonantal and Vocalic Intervals

The interval detection involves the detection of silence intervals, as silences preceding and following an utterance should not be included in calculating rhythm metrics. The silence intervals are detected by Voice Activity Detection (VAD). Among features of speech signals, the sum of the signal energy in a frame is widely used as a criterion for VAD. We estimate the energy for every frame of 20 ms and determine whether each frame is silence or not by comparing it with a pre-defined threshold. When a frame is detected as silence, it does not participate in the following procedure: the detection of consonantal or vocalic intervals. For the interval detection, two GMMs for consonants and vowels are used to detect consonantal and vocalic intervals.
To construct these GMMs, a phonemically demarcated speech corpus is required. For this work, we used a database (called ‘PRAWN_DB’) provided in [32] that contains phonemically demarcated read speech data with 20 native English speakers. It could be awkward to use only English data as a training set for interval detection. Since a study argued rhythmic continuum [28], English has been an extremely stress-based language showing high fluctuations of vocalic and consonantal intervals (as aforementioned in Section 3.2). As English retains extreme values in speech rhythm metrics, the difference of languages from English could provide a good criterion of language discrimination.
The process of model construction begins with extracting MFCCs from speech signals. Speech samples are segmented to a specific size (20 ms) with overlapped samples (10 ms). Then, a window function (Hamming) is used to highlight the intermediate portion of samples. Segmented samples are converted into a frequency-domain using STFT. Finally, coefficients are obtained from the results by discrete cosine transform. Although dynamic features of delta or accelerated coefficients are used in standard speech recognition, only 12 coefficients and one normalized energy value in log-scale are used to reduce the dimension of each GMM.
The complete procedure for constructing models for interval detection is shown in Figure 2. First, the respective non-silence regions of each speech file of PRAWN_DB is segmented into one of 44 English phonemes with phoneme-based demarcation. Then, each segment is labeled CON (consonant) or VOW (vowel), and MFCCs are extracted. Next, two GMMs are trained with 80% of the data, reserving 20% of the data for the validation set. In the recognition test for the initial GMMs, the accuracy was about 70%. We found that the low performance is caused by vowel-like consonants. Specific groups of consonants, such as liquids (/l, r/), glides (/w, y/), and nasals (/m, n/) preserve vocalic characteristics and tend to be recognized as vowels. Therefore, we included the consonant groups in the vowel model and achieved 90% correctness. Figure 3 represents a sample result of interval detection conducted for unknown speech data. The consonant and vowel detection approach proposed herein requires no transcriptions and speech segment information. The approach automatically detects and identifies consonantal and vocalic regions, only depending on pre-trained GMMs, without knowledge of the language data such as language types or contents of speech, thus allowing extracting speech rhythm features from unknown language data.

3.3.2. Estimation of Rhythm Metrics

After the intervals are detected, seven rhythm metrics (%V, ΔV, ΔC, Varco-V, Varco-C, nPVI-V, and rPVI-C) which are called R-vector in this study, are automatically estimated according to the formulas described in Table 1. In the formulas, mc and mv denote the number of vocalic intervals and the number of consonantal intervals within an utterance, respectively. dv,k and dc,k refer to a duration of the k’th vocalic interval and that of the k’th consonantal interval, respectively. All metrics are directly estimated, once the interval information is given. An unintended case occurs when there are no vocalic or consonantal intervals detected within an utterance, making μ v (a mean value of vocalic intervals) or μ c (a mean value of consonantal intervals) to be zero. As this case does not allow calculating Varco-V or nPVI-V, we substitute the mean value with an arbitrary small number using the epsilon number such as (1–6e).

3.4. Automatic Language Identification Using Rhythm Metrics

The final step is to identify a language with the R-vector estimated from the given input speech. The general pattern classification techniques mentioned in Section 2 can be used for this step. However, the proposed R-vector-based LID approach has a different condition from the conventional approaches in terms of amount of features. The conventional approaches directly employing general acoustic features such as MFCCs accept features extracted from small-sized frame units, whereas the R-vector is estimated from an utterance or a sentence level. Hence, the amount of feature data in R-vector may be insufficient to train a complex model such as DNN. Instead, other methods using less training data, such as SVM and LDA, can be useful for R-vector-based LID. Among the two techniques, LDA requiring normally distributed data may lead to misclassification, as elements of R-vector are not correlated, thus making it very difficult to find an optimal linear decision boundary. For this reason, we employ the SVM technique for R-vector-based LID. In addition, we carefully propose another approach using a combination of R-vector and i-vector as LID features.

3.4.1. R-Vector-Based LID with SVM

The SVM aims to find support vectors in the decision boundary. These vectors are modeled with different types of kernel functions, such as a linear kernel and a Gaussian kernel. The function is dependent on a domain and the dimension of features. As R-vector is a multi-dimensional feature, a Gaussian kernel, namely, the radial basis kernel, is used. Using the R-vector, the support vectors in the kernel function are trained. After the training session, the distance between the support vectors of each language and input data to be classified are calculated with a Gaussian kernel. A language indicating the least distance values is determined as a result. An advantage of the proposed approach employing SVM is its scalability. Specifically, once an interval detection module is prepared, it is relatively easy to identify an open-set language, extending various types of languages. On the other hand, the conventional methods such as i-vector or CNN should firstly train the corresponding language model for feature extraction to identify an open-set language.

3.4.2. R-Vector-Based LID with i-Vector

As the i-vector-based classification also requires an amount of training data, using only speech rhythm features may be insufficient for i-vector training. However, we attempted to combine R-vector with the i-vector obtained from the GMM-UBM and TV-matrix, considering that the two types of vectors have a strong similarity in terms of language-discriminative features. Figure 4 describes the proposed way of combining i-vector-based classification with R-vector.
As input features for i-vector training, 13 dimensional MFCCs are used with the same configuration of inputs for the detection of consonantal and vocalic intervals. The results of VAD are also incorporated to exclude silence frames while training GMM-UBM. After training GMM-UBM, a TV-Matrix is trained as a hyperparameter. Once the i-vector is extracted from the GMM-UBM and TV-Matrix, the R-vector obtained from the interval detection results is concatenated with the i-vector, generating an (i+R)-vector. Finally, a cosine similarity is used to determine a language.
To quantify the cosine similarity, a mean vector should be firstly calculated for each language from the i-vectors and R-vectors estimated from training data. In a determination process, a cosine similarity value between the (i+R)-vector extracted from test data and a mean vector of each language are calculated as follows:
C o s i n e    S i m i l a r i t y ( X , Y i ) = X · Y i | | X | | 2 · | | Y | | 2
where X denotes the (i+R)-vector of a given piece of test data and Yi refers to a mean vector of the i-th language. A language i providing the highest cosine similarity is determined as the result of LID.

4. Experimental Results and Analysis

4.1. Speech Corpora for Experiments

To verify the efficiency of the R-vector and the R-vector-based LID approach, we conducted several experiments using several speech corpora consisting of multiple languages. The type of languages used for evaluation was firstly considered. We preferentially selected four target languages including English, Korean, Chinese, and Spanish, considering the language distribution property introduced in a well-known linguistics study [28]. As described in Figure 5, English is known as a prototypical stress-timed language, whereas Spanish is a representative syllable-timed language. On the other hand, Korean and Chinese belong to intermediate languages between stress-timed and syllable-timed languages, but Chinese has language properties that are highly pertinent to stress-timed languages.
Unfortunately, there are no individual speech corpora containing these four types of languages. Hence, we conducted experiments separately on two corpora published by different organizations, as presented in Table 2. The first corpus released by the Speech information TEchnology & industry promotion Center (SiTEC) contains English and Korean language data. Another corpus called Common Voice contains open source speech data and was released by Mozilla in 2019. Two corpora have different recording environments. The SiTEC corpus consists of read speech data recorded in the silent studio, whereas the Mozilla corpus retains speech data of natural and dialogic voice recorded in real-life environments. For this reason, experiments using all the data of two corpora may not provide a fair evaluation. Thus, we firstly performed evaluation for English and Korean using the SiTEC corpus and then investigated the performance for English, Chinese, and Spanish on the Mozilla corpus.

4.2. Verification for Automatic R-Vector Extraction

First, we verified the efficiency of automatically extracted R-vector comprising seven rhythm metrics (%V, ΔV, ΔC, Varco-V, Varco-C, nPVI-V, and rPVI-C). To investigate the efficiency of each element of R-vector, we employed the Linear Mixed Effects (LME) model approach that is useful for analyzing data that are non-independent, multilevel, or correlated. As the speech files of each language corpus are recorded repeatedly by speakers, extracted R-vectors may contain variations of individual speakers. The LME considers this as a random effect and concentrates on checking the discriminability of each metric without the random effect by estimating a random effect via a maximum likelihood technique. Each metric is fit to the LME using the ’nlme’ provided as an R package [33]. In this process, each metric is set as a predictor variable, and a language code is set to a response variable. Then, the speaker information is established to a random effect. The following equation is an example code for fitting %V in the LME model.
Model = lme(%V~LANG, random = ~1|SPK, data = DB, method = “ML”)
The results of verification based on the LME for each corpus are presented as a table and a boxplot. Tables provide the level of significance according to the number of asterisk marks along with a code of a language giving the higher value than its counterpart. The overall tendency of distribution of each metric value can be observed in the boxplot figures, in which the x-axis and y-axis denote the languages and the values of each metric. Each boxplot gives five components: the 1st, 2nd, 3rd, 4th quantile, and a median value as a middle line. In addition, dots outside the box are outliers.
First, we examined the efficiency of R-vector for English and Korean using the SiTEC corpus. As indicated in Table 3, all metrics are capable of discriminating Korean from English significantly, mostly giving three asterisk marks. In most metrics, a language indicating the higher value than the other language showed a similar rhythmic direction introduced in previous linguistics studies such as [12] and [30], excluding Varco-V and nPVI-V, in which Korean was selected as a language giving the higher values. In fact, the two metrics convey insufficient language property, as they indicated relatively low significance levels.
Figure 6 describes the results of distribution of rhythm metrics for English and Korean. Although there exist overlapped quantiles for two languages, most metrics indicated a significant distance for median values between the languages, giving characteristics discriminating languages. It is interesting to observe that two metrics (Varco-V and nPVI-V) that indicated different tendencies from previous linguistics studies in the significance results (Table 3) showed highly overlapped quantiles and similar median values. The metrics also exhibited significant outliers compared to other metrics, thus giving few discriminative characteristics.
The results of experiments on the SiTEC corpus explain that the rhythm metric values extracted automatically by our proposed approach pursue a general tendency of two languages (English and Korean) reported on linguistics, providing a great expectation that the metrics convey language-discriminative information for automatic language identification.
Next, in experiments on the Mozilla corpus, we investigated the properties of extracted rhythm metrics for other languages including Chinese, Spanish, and English. As shown in Table 4, Chinese–Spanish and Chinese–English pairs demonstrated significant properties of language discrimination of respective rhythm metrics, giving high significance levels. These two language pairs showed similar properties of rhythm metrics. Chinese represented higher values in %V and ΔV than other languages, but which provided higher values in other metrics. In other words, Chinese is of considerable significance in discriminating vowel metrics, but its effect is moderated in normalized metrics. This result explains that the automatically extracted metrics provide relevant characteristics as language-discriminative features.
On the other hand, the English–Spanish pair indicated lower significance levels except for nPVI-V. The unexpected results are caused by the phonemic models used for the detection of consonantal and vocalic intervals. Although the models trained with English data operated well for Korean (in Table 3) and Chinese (in Table 4), they might induce interval detection errors for Spanish, which has an opposite sound system to English. One possible solution is to construct phonemic models covering conflicting languages such as English and Spanish.
Figure 7 summarizes the results of distribution of rhythm metrics evaluated with the Mozilla corpus. These results show similar tendencies to the significant results addressed in Table 4. Although overlapped quantiles are observed from three languages, most metrics indicated a distance between Chinese and other languages for median values. In comparison with vowel metrics, consonant metrics including ΔC, Varco-C, and nPVI-C showed significant differences over languages, providing sufficient capability as language-discriminative features. Two metrics, Varco-V and nPVI-V, indicated highly overlapped quantiles and similar median values on three languages, similarly to results analyzed for English and Korean.

4.3. Verification for Automatic Language Identification Using R-Vector

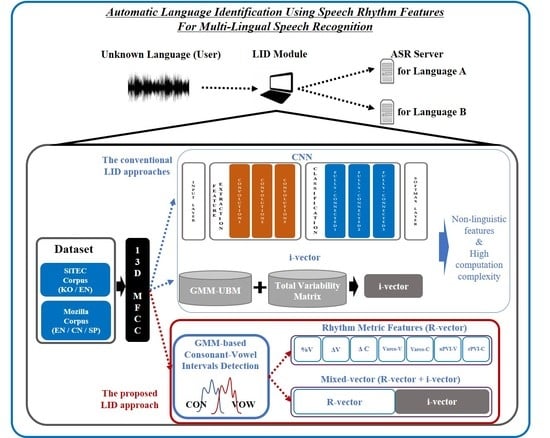
In experiments on language corpora, it was successfully verified that the automatically extracted rhythm metrics preserve language-discriminative information. Next, we attempted to verify whether the metrics play a role in automatic language identification. For this work, we developed two types of the conventional LID approaches including i-vector-based LID and CNN-based LID, and then we compared them with our proposed approach in terms of LID performance and computation complexity.
The first baseline based on i-vector was constructed in accordance with the description mentioned in Section 2.1. Figure 8 demonstrates the standard procedure of the i-vector-based LID approach.
The second baseline is an up-to-date LID approach employing CNN. As this approach uses two different DNN structures to operate consecutive procedures (feature extraction and classification), it can be regarded as an end-to-end LID approach. Figure 9 shows the configuration of layers for this operation. A total of 64 packs of 13-dimensional MFCCs extracted from each speech frame enter into an input layer as initial data, consisting of a (64 × 13)-matrix. Then, the input data pass through three convolutional and max pooling layers sequentially. The results of each convolution operation are multiplied by the weights of the corresponding convolution filter. Then, the dimension of the weighted values is reduced by a pooling layer. Among representative pooling ways including max pooling and average pooling, we use the max pooling approach to reflect only the highly highlighted value. After passing the pooling layer, dropout is subsequently performed to exclude some data for reducing overfitting. While selecting hyperparameters, we empirically set the optimal filter size as (2 × 2) and changed the number of filters from 64 to 256, maintaining the dropout rate to 0.5.
Next, outputs of the convolutional layers enter into a fully connected layer that connects every node in one layer to all nodes in another layer. Three fully connected layers are followed by a final layer called ‘softmax’ in which a language is determined as an LID result by normalizing the final output values based on a softmax function. While learning CNN-based LID models, we empirically set other hyperparameters: the batch size of input features as 700, learning rate as 0.001, and the number of epochs as 400. The entire learning process was executed under the Pytorch framework [34].

4.3.1. Evaluation and Analysis of Automatic LID

Using the two corpora mentioned in 
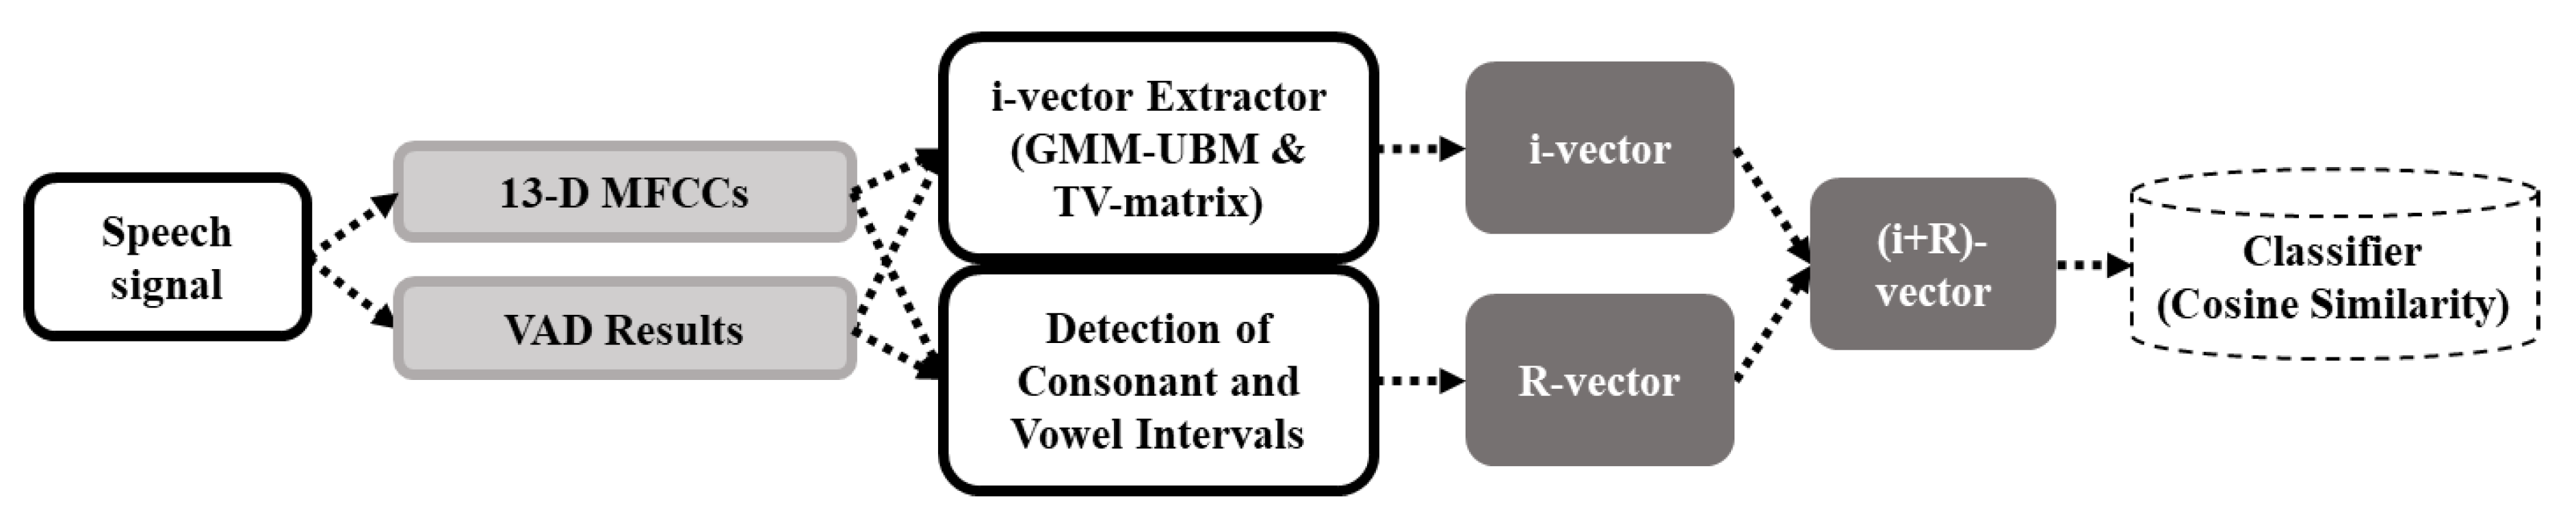
Section 4.1, we investigated the performance of automatic LID for four types of LID approaches including conventional approaches based on i-vector and CNN and proposed approaches based on R-vector with SVM (addressed in Section 3.4.1) and R-vector with i-vector (addressed in Section 3.4.2). For a fair evaluation, we partitioned the data in each corpus into five equal sized subsets and performed five-fold cross-validation, sequentially using the respective subsets for testing and the remaining four subsets for training. We investigated the performance using a recognition error rate (%) for each subset and averaged five experimental results.
Table 5 describes the recognition results of two-class (English versus Korean) LID experiments performed on the SiTEC corpus. Most approaches showed outstanding recognition accuracy, achieving more than 95%. Although the conventional CNN-based LID outperformed the other approaches, the proposed R-vector employing SVM achieved notable performance compared to the CNN-based approach. On the other hand, i-vector-based approaches demonstrated relatively lower performance.
The Mozilla corpus provided slightly different aspects of LID performance from the SiTEC corpus, decreasing the overall LID accuracy. The degradation is caused by the differences in speaking styles and recording quality between two corpora. As mentioned in Section 4.1, the Mozilla corpus retains speech data of natural and dialogic voice recorded in real-life environments, whereas the SiTEC corpus consists of read speech data recorded in a silent studio.
First, we investigated the performance of two-class LID experiments in the same way as the SiTEC experiments, making a pair from three different languages (English, Spanish, and Chinese). Table 6 summarizes the results of three pairs of languages. The proposed approach employing R-vector with SVM that showed comparable performance to the CNN-based approach in Table 5 represented the worst accuracy. We consider that the R-vector extracted from the Mozilla data may have an incorrect value, as it was estimated upon an acoustic model constructed from the PRAWN corpus addressed in Section 3.3.1, which retains phonemically demarcated read speech data differently from the Mozilla data. Although the sole use of R-vector provided poor accuracy, the R-vector showed outstanding performance when combined with the i-vector approach. As shown in Table 6, the combination of R-vector and i-vector increased the performance of the conventional i-vector, and it even reduced the performance gap from the CNN-based approach.
When analyzing the results in terms of a language pair, the EN–SP set represented the worst performance among three language pairs. The similar result was already found in Section 4.2, in which the English–Spanish pair showed a lower significance level and more largely overlapped quantiles compared to other two pairs, thus providing an incorrect R-vector. This tendency was also demonstrated in LID experiments. In particular, two conventional approaches also revealed difficulties in discriminating English and Spanish. It is also a unique observation that in the LID experiments targeting Chinese and Spanish, the i-vector approach outperformed the CNN. It is quite a different result from that of other language pairs. We analyzed that the i-vector retains more reliable features discriminating Chinese and Spanish in a comparison of the features that the CNN extracted.
Next, we investigated the performance of three-class LID discriminating English, Spanish, and Chinese. As shown in Table 7, the accuracy was significantly degraded in comparison with two-class LID. However, the experiment derived a common tendency between LID approaches that was observed in Table 6. A notable result is that the R-vector employing i-vector achieved the same performance as the CNN-based approach, making the best accuracy.
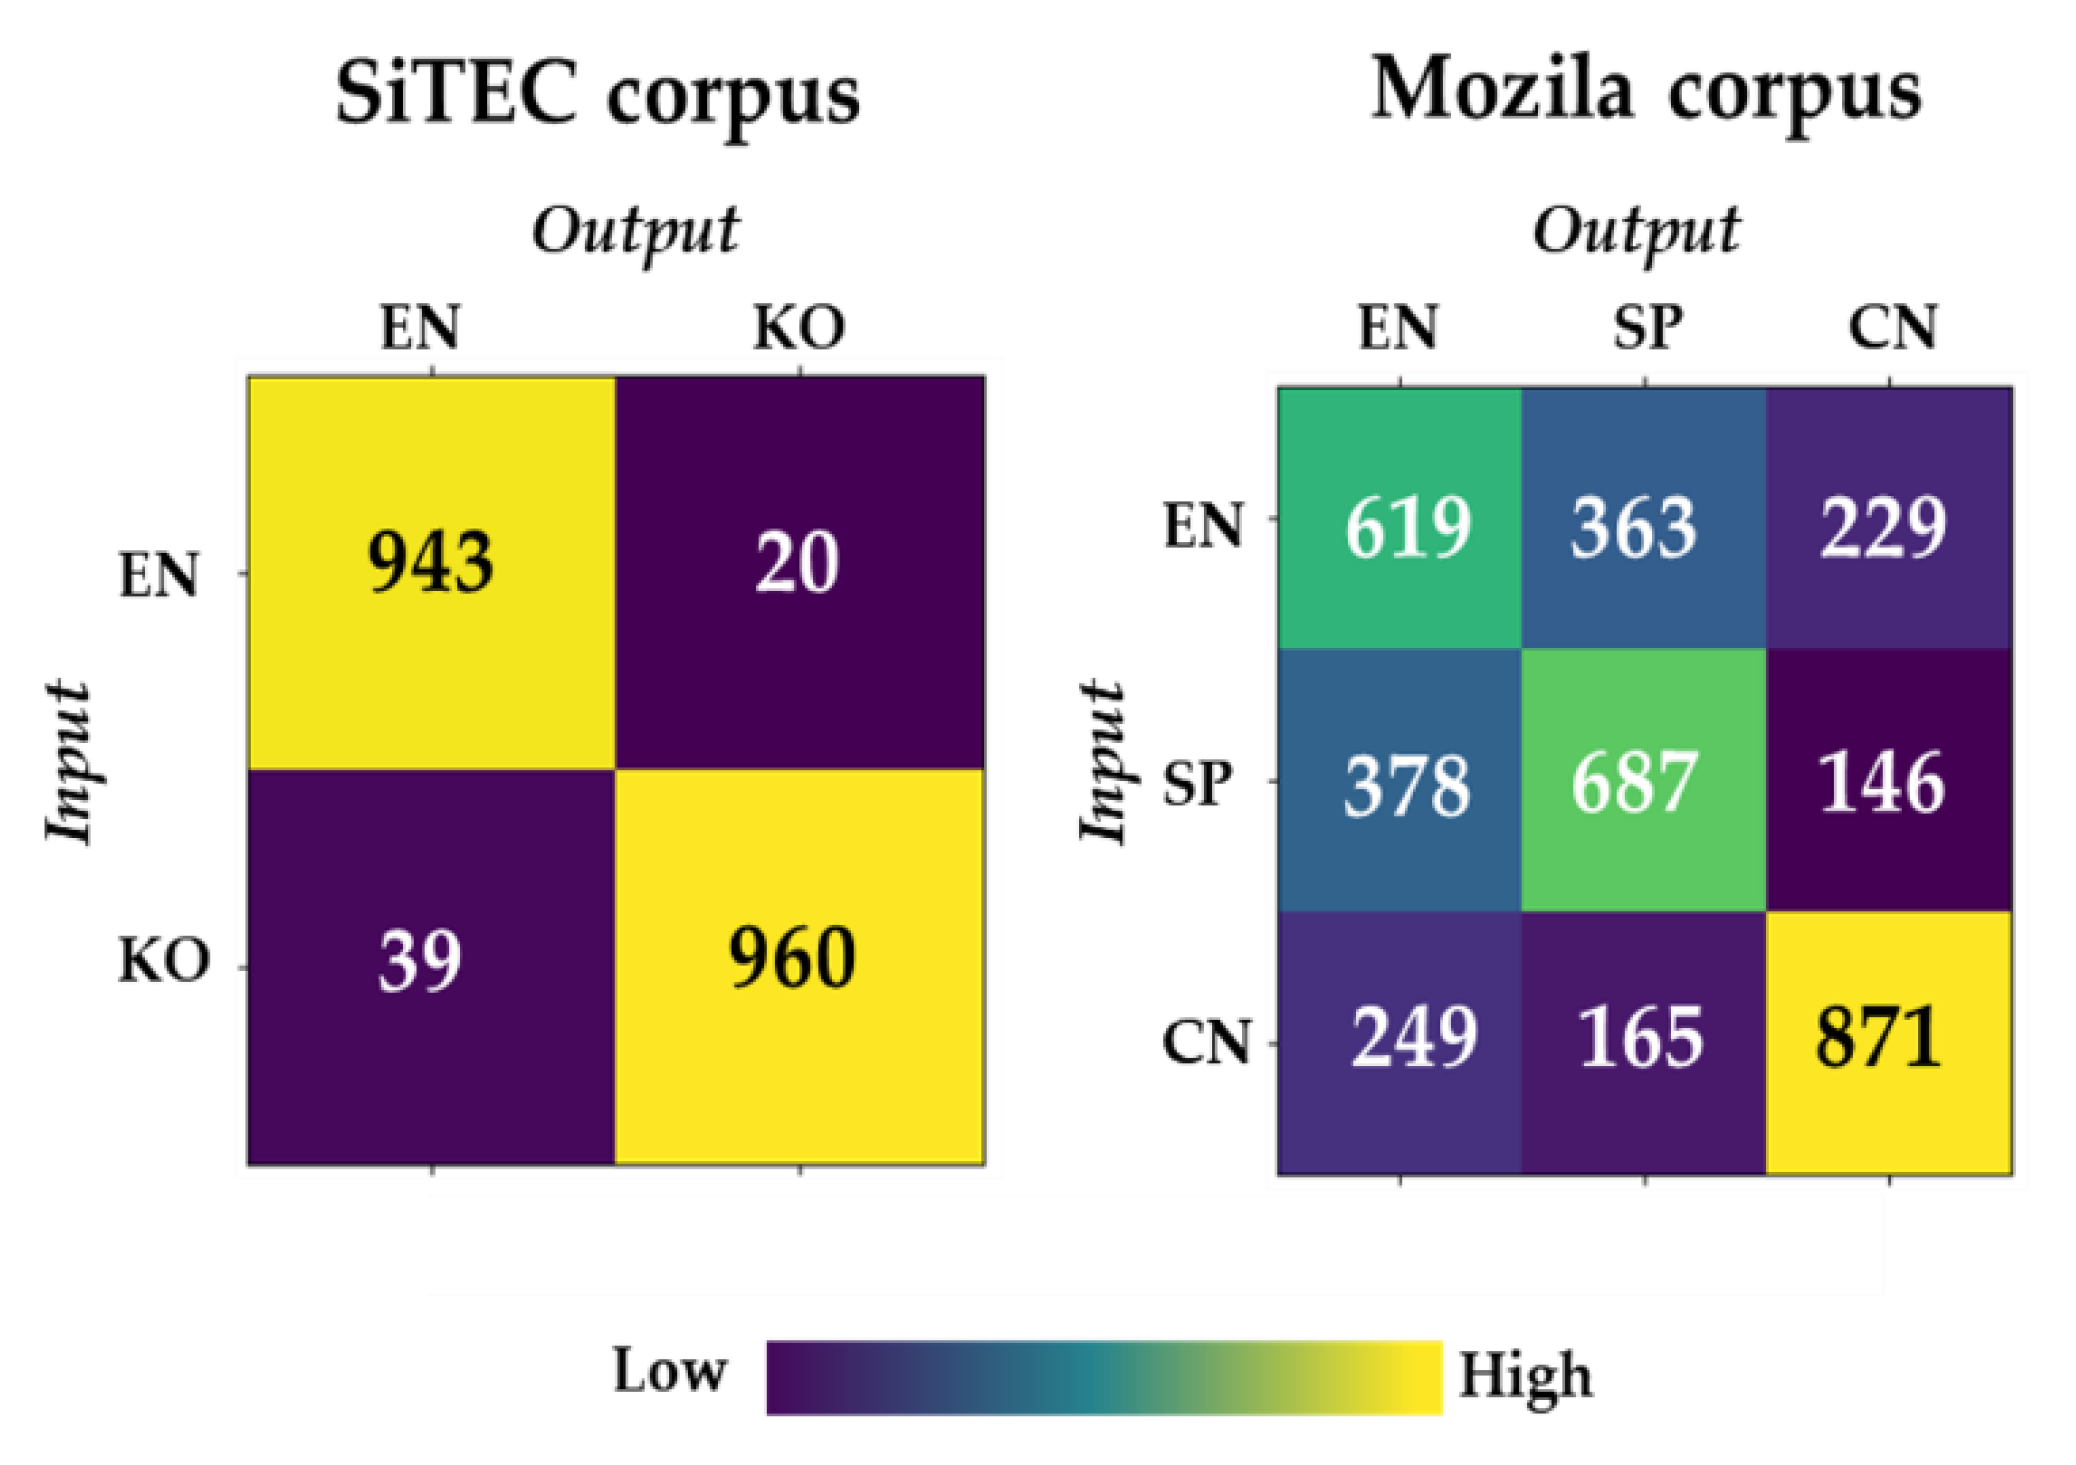
In order to observe the efficiency of the proposed R-vector-based approach in a more sophisticated manner, we analyzed the results of the confusion matrix shown in Figure 10. Among the matrices, the experiment on the SiTEC corpus provided more notable LID accuracy compared to that on the Mozilla corpus, showing stable LID performance in both English and Korean. In a three-class LID experiment, our system identified China better than other languages, achieving about 68% accuracy. Meanwhile, English and Spanish indicated similar recognition results.
Finally, we attempted to investigate the efficiency of the proposed approach on an evaluation dataset specialized for the LID task. We selected the ‘2011 National Institute of Standards and Technology (NIST) Language Recognition Evaluation (LRE) Test Set’ published by the Linguistic Data Consortium (LDC), as LRE datasets are known as representative evaluation data for language identification. The dataset is characterized as conversational telephone speech recorded in real-life environments, which is similar to the Mozilla corpus. For this reason, we used classification models trained with the Mozilla data to evaluate the LRE test set in consideration of cross-corpus evaluation. To compare with the Mozilla results, we conducted two-class and three-class LID experiments using English, Spanish, and Chinese.
Table 8 and Table 9 demonstrate the results. Due to the difference between the training data and test data, the LRE dataset provided lower accuracy compared to the Mozilla results, while showing a similar performance tendency to the Mozilla data. In two-class experiments, the EN–SP pair also represented the worst performance among the three language pairs. Another similar tendency was shown in the CN–SP pair, in which the i-vector approach provided higher performance than that of the CNN. Outstanding results were observed in the performance of the proposed R-vector. Although the proposed R-vector-based approaches indicated the worst performance in the Mozilla results, the approaches demonstrated better or similar accuracy in comparison with the conventional approaches in the LRE evaluation. Next, in three-class experiments, the proposed approaches employing R-vector demonstrated an LID performance comparable to the conventional approaches, while the R-vector-based SVM approach showed significantly poor accuracy in the Mozilla result.
In several LID experiments, the proposed R-vector-based approaches demonstrated slightly different performance according to speech corpora. For read speech recorded in clean environments, the R-vector showed superior performance comparable to CNN when it employs SVM, whereas for dialogic speech data recorded in real environments, the R-vector-based approaches provided better or similar accuracy compared to the conventional LID approaches. The results explain that the R-vector conveys reliable and language-discriminative information as a useful LID feature. In particular, the R-vector-based approach requires much less computation complexity than the conventional techniques.

4.3.2. Analysis of Computation Complexity

As mentioned in Section 3.2, we expect the proposed R-vector-based approach allows LID operating directly on user devices that have limited hardware resources. For this reason, we compared our approach with the conventional approaches in terms of computation complexity. We used two measures for the comparison: the number of parameters required in a training phase and computational intensity regarding a testing phase. Table 10 summarizes the results analyzed on the basis of a two-class LID task.
As known commonly, the CNN-based approach requires the highest number of parameters and computational intensity. As addressed in Figure 9, the CNN-based LID processes seven layers including three layers for feature extraction, three layers for classification, and one layer for softmax. The overall number of parameters to be estimated is calculated as 198,912, comprising 1792 parameters in feature extraction layers (64 × 4 + 128 × 4 + 256 × 4), 196,608 parameters in classification layers (256 × 256 × 3), and 512 parameters in softmax layers (256 × 2). The more that the size of convolution filters or the number of layers increases, the more the number of parameters. In terms of computational intensity, the CNN-based LID requires about 500,000 computations which are obtained by considering the filter size, the number of input channels, and the input size. Feature extraction layers need 315,392 computations (64 × 13 × 64 + 128 × 64 × 16 + 256 × 128 × 4), and classification layers and a softmax layer conduct 197,120 computations (256 × 256 × 3 + 256 × 2).
In the i-vector-based approach, the number of parameters depends on the number of UBM mixtures, the dimension of the input feature, and the i-vector dimension. When using 128 mixtures, 13-dimensional MFCCs, and 10-dimensional i-vectors, the total number of parameters is calculated as 39,936 = 128 × 13 + 128 × 169 + 128 × 13 × 10. During recognition, 19,968 computations are required: 3328 for UBM processing and 16,640 for i-vector processing.
Finally, the R-vector-based approach has the lowest computation complexity. A dominant processing of this approach is to construct GMMs used for consonantal and vocalic intervals. In this study, 13-dimensional GMM mixtures were optimally defined. Thus, the number of parameters is only 2366 = 13 × 13 + 13 × 169, and the computational intensity is regarded as 345 computations consisting of 338 = 13 × 13 × 2 for interval detection and 7 for R-vector estimation.

5. Conclusions

This study proposed an LID approach using speech rhythm as a feature for multi-lingual ASR. Most conventional LID approaches depend on common acoustic features used in speech recognition, thus employing insufficient language information. In addition, the approaches require a certain amount of parameters in training, making it difficult to directly operate on user devices. In this study, we attempted to find an LID approach having low computational intensity based on a language-specific feature called rhythm metrics. For this work, we proposed a way for the automatic extraction of rhythm metrics. Then, LID approaches based on SVM and i-vector were proposed for efficient use of the feature. Based on several speech corpora, we verified the efficiency of the automatically extracted rhythm metrics and the proposed LID approaches. The feature was successfully proved to convey language-discriminative information, showing language tendencies similar to the conventional studies on linguistics. In addition, the proposed LID approaches demonstrated superior or comparable LID performance to the conventional approaches in spite of low computation complexity.
In future research, we will investigate ways of improving the correctness of rhythm metrics with further sophisticated model training. In addition, another linguistic features applicable to LID will be examined.

Author Contributions

Conceptualization, H.K. and J.-S.P.; methodology, H.K. and J.-S.P.; software, H.K.; validation, H.K. and J.-S.P.; formal analysis, H.K. and J.-S.P.; writing—original draft preparation, H.K.; writing—review and editing, J.-S.P.; supervision, J.-S.P.; project administration, J.-S.P.; funding acquisition, J.-S.P. All authors have read and agreed to the published version of the manuscript.

Funding

This research was supported by Hankuk University of Foreign Studies Research Fund, the National Research Foundation of Korea (NRF) grant funded by the Korea government (MSIT) (No. 2020R1A2C1013162, NRF-2017R1D1A1A09000903), the MSIT (Ministry of Science and ICT), Korea, under the ITRC (Information Technology Research Center) support program (IITP-2019-2016-0-00313) supervised by the IITP (Institute for Information & communications Technology Planning & evaluation).

Conflicts of Interest

The authors declare no conflict of interest.

References

  1. Ali, M.; Hameed, I.A.; Muslim, S.S.; Hassan, K.S.; Zafar, I.; Bin, A.S.; Shuja, J. Regularized urdu speech recognition with semi-supervised deep learning. Appl. Sci. 2019, 9, 1956. [Google Scholar]
  2. Jin, M.; Song, Y.; McLoughlin, I.; Dai, L.R. LID-senones and their statistics for language identification. IEEE/ACM Trans. Audio Speech Lang. Process. 2018, 26, 171–183. [Google Scholar] [CrossRef]
  3. Koolagudi, S.G.; Rastogi, D.; Rao, K.S. Identification of language using mel-frequency cepstral coefficients. Procedia Eng. 2012, 38, 3391–3398. [Google Scholar] [CrossRef] [Green Version]
  4. Sarmah, K.; Bhattacharjee, U. GMM based language identification using MFCC and SDC features. IJCA 2014, 85, 36–42. [Google Scholar] [CrossRef]
  5. Anjana, J.S.; Poorna, S.S. Language identification from speech features using SVM and LDA. In Proceedings of the 2018 International Conference on Wireless Communications, Signal Processing and Networking (WiSPNET), Chennai, India, 22–24 March 2018; pp. 1–4. [Google Scholar]
  6. Gonzalez-Dominguez, J.; Lopez-Moreno, I.; Sak, H.; Gonzalez-Rodriguez, J.; Moreno, P.J. Automatic language identification using long short-term memory recurrent neural networks. In Proceedings of the INTERSPEECH 2014, Singapore, 14–18 September 2014; pp. 2155–2159. [Google Scholar]
  7. Dehak, N.; Torres-Carrasquillo, P.A.; Reynolds, D.; Dehak, R. Language recognition via i-vectors and dimensionality reduction. In Proceedings of the INTERSPEECH 2011, Florence, Italy, 27–31 August 2011; pp. 857–860. [Google Scholar]
  8. Montavon, G. Deep learning for spoken language identification. In Proceedings of the NIPS Workshop on Deep Learning for Speech Recognition and Related Applications, Vancouver, BC, Canada, 11–12 December 2009; pp. 1–4. [Google Scholar]
  9. Nespor, M. On the rhythm parameter in phonology. In Logical Issues in Language Acquisition; Foris Publications Holland: Dordrecht, The Netherlands, 1990; pp. 157–175. [Google Scholar]
  10. Barry, W.J.; Andreeva, B.; Russo, M.; Dimitrova, S.; Kostadinova, T. Do rhythm measures tell us anything about language type. In Proceedings of the 15th ICPhS, Barcelona, Spain, 3–9 August 2003; pp. 2693–2696. [Google Scholar]
  11. Ramus, F.; Nespor, M.; Mehler, J. Correlates of linguistic rhythm in the speech signal. Cognition 1999, 73, 265–292. [Google Scholar] [CrossRef] [Green Version]
  12. Grabe, E.; Low, E.L. Durational variability in speech and the rhythm class hypothesis. Pap. Lab. Phonol. 2002, 7, 515–546. [Google Scholar]
  13. Dellwo, V. Rhythm and speech rate: A variation coefficient for delta C. In Language and Language Processing: Proceedings of the 38th Linguistic Colloquium; Karnowski, P., Szigeti, I., Eds.; Peter Lang: Frankfurt, Germany, 2006; pp. 231–241. [Google Scholar]
  14. White, L.; Mattys, S.L. Calibrating rhythm: First language and second language studies. J. Phon. 2007, 35, 501–522. [Google Scholar] [CrossRef]
  15. Allen, F.; Ambikairajah, E.; Epps, J. Language identification using warping and the shifted delta cepstrum. In Proceedings of the 2005 IEEE 7th Workshop on Multimedia Signal Processing, Shanghai, China, 30 October–2 November 2005; pp. 1–4. [Google Scholar]
  16. Dehak, N.; Kenny, P.J.; Dehak, R.; Dumouchel, P.; Ouellet, P. Front-end factor analysis for speaker verification. IEEE Trans. Audio Speech Lang. Process. 2010, 19, 788–798. [Google Scholar] [CrossRef]
  17. Kenny, P. A small footprint i-vector extractor. In Proceedings of the Odyssey 2012—The Speaker and Language Recognition Workshop, Singapore, 25–28 June 2012; pp. 1–6. [Google Scholar]
  18. Hinton, G.; Deng, L.; Yu, D.; Dahl, G.; Mohamed, A.; Jaitly, N.; Senior, A.; Vanhoucke, V.; Nguyen, P.; Sainath, T.; et al. Deep neural networks for acoustic modeling in speech recognition. IEEE Signal Process. 2012, 29, 82–97. [Google Scholar] [CrossRef]
  19. Richardson, F.; Reynolds, D.; Dehak, N. Deep neural network approaches to speaker and language recognition. IEEE Signal Process. Lett. 2015, 22, 1671–1675. [Google Scholar] [CrossRef]
  20. Lozano-Diez, A.; Zazo-Candil, R.; Gonzalez-Dominguez, J.; Toledano, D.T.; Gonzalez-Rodriguez, J. An end-to-end approach to language identification in short utterances using convolutional neural networks. In Proceedings of the 16th Annual Conference of the International Speech Communication Association, Dresden, Germany, 6–10 September 2015; pp. 403–407. [Google Scholar]
  21. Cortes, C.; Vapnik, V. Support-vector networks. Mach. Learn. 1995, 20, 273–297. [Google Scholar] [CrossRef]
  22. Fisher, R.A. The use of multiple measurements in taxonomic problems. Ann. Eugen. 1936, 7, 179–188. [Google Scholar] [CrossRef]
  23. McLachlan, G.J. Discriminant Analysis and Statistical Pattern Recognition; John Wiley & Sons: Hoboken, NJ, USA, 2004; ISBN 978-0-471-69115-0. [Google Scholar]
  24. Cai, W.; Cai, D.; Huang, S.; Li, M. Utterance-level end-to-end language identification using attention-based CNN-BLSTM. In Proceedings of the ICASSP 2019, Brighton, UK, 12–17 May 2019; pp. 5991–5995. [Google Scholar]
  25. Pike, K.L. The Intonation of American English; University of Michigan Press: Ann Arbor, MI, USA, 1945; ISBN 978-0-472-08731-0. [Google Scholar]
  26. Abercrombie, D. Elements of General Phonetics; Edinburgh University Press: Edinburgh, Scotland, 1980; ISBN 978-0-852-24451-7. [Google Scholar]
  27. Roach, P. On the distinction between ‘stress-timed’ and ‘syllable-timed’ languages. Linguist. Controv. 1982, 73, 79. [Google Scholar]
  28. Dauer, R.M. Stress-timing and syllable-timing reanalyzed. J. Phon. 1983, 11, 51–62. [Google Scholar] [CrossRef]
  29. Cho, M. Rhythm typology of Korean speech. Cogn. Process. 2004, 5, 249–253. [Google Scholar]
  30. Jang, T.Y. Rhythm metrics of spoken korean. Lang. Linguist. 2009, 46, 169–186. [Google Scholar]
  31. Lin, H.; Wang, Q. Mandarin rhythm: An acoustic study. J. Chin. Lang. Comput. 2007, 17, 127–140. [Google Scholar]
  32. Chung, H.; Jang, T.Y.; Yun, W.; Yun, I.; Sa, J. A study on automatic measurement of pronunciation accuracy of English speech produced by Korean learners of English. Lang. Linguist. 2008, 42, 165–196. [Google Scholar]
  33. nlme: Linear and Nonlinear Mixed Effects Models. Available online: http://cran.r-project.org/package=nlme (accessed on 3 March 2019).
  34. Paszke, A.; Gross, S.; Chintala, S.; Chanan, G.; Yang, E.; DeVito, Z.; Lin, Z.; Desmaison, A.; Antiga, L.; Lerer, A. Automatic differentiation in PyTorch. In Proceedings of the 31st Conference on Neural Information Processing Systems (NIPS), Long Beach, CA, USA, 4–9 December 2017. [Google Scholar]
Figure 1. Overall procedure of the automatic extraction of rhythm metrics.
Applsci 10 02225 g001
Figure 2. The procedure for constructing two Gaussian Mixture Models (GMMs) (for consonants and vowels) for interval detection.
Applsci 10 02225 g002
Figure 3. A sample result of the consonantal and vocalic interval detection.
Applsci 10 02225 g003
Figure 4. Procedure of Language IDentification (LID) based on a combination of i-vector and R-vector.
Applsci 10 02225 g004
Figure 5. Language distribution property.
Applsci 10 02225 g005
Figure 6. Tendency of distribution of rhythm metric values for English and Korean.
Applsci 10 02225 g006
Figure 7. Tendency of distribution of rhythm metric values for Chinese, Spanish, and English.
Applsci 10 02225 g007
Figure 8. Procedure of the conventional i-vector-based LID approach.
Applsci 10 02225 g008
Figure 9. Layer configuration for the Convolutional Neural Network (CNN)-based LID.
Applsci 10 02225 g009
Figure 10. LID performance of the proposed R-vector-based approach in terms of confusion matrix.
Applsci 10 02225 g010
Table 1. Formulas of rhythm metrics. nPVI: normalized Pairwise Variability Index, rPVI-C: Raw Pairwise Variability Index.
Rhythm MetricsFormula
%V k = 1 m v d v , k / ( k = 1 m v d v , k + k = 1 m c d c , k )
ΔV k = 1 m v ( d v , k μ v ) 2 ( μ v = k = 1 m v d v , k / m v )
ΔC k = 1 m c ( d c , k μ c ) 2 ( μ c = k = 1 m c d c , k / m c )
Varco-V Δ V / μ v
Varco-C Δ C / μ c
nPVI-V ( k = 1 m v | d v , k d v , k + 1 ( d v , k + d v , k + 1 ) / 2 | ) / ( m v 1 )
rPVI-C ( k = 1 m c | d c , k d c , k + 1 | ) / ( m c 1 )
Table 2. Description of speech corpora used for evaluation. SiTEC: Speech information TEchnology & industry promotion Center.
SiTEC CorpusMozilla Corpus
LANGUAGEEnglishKoreanChineseSpanishEnglish
CODEENKOCNSPEN
Number of UTTERANCES49024906623462256226
Table 3. Significance results with Linear Mixed Effects (LME) for English and Korean.
%VΔVΔCVarco-VVarco-CnPVI-VrPVI-C
> 1KOKOENKOENKOEN
Sig. 2*******************
1 A language with the higher value than the other. 2 Significance levels: <0.001 ‘***’, <0.01 ‘**’, <0.05 ‘*’.
Table 4. Significance results with LME for Chinese, Spanish, and English.
%VΔVΔCVarco-VVarco-CnPVI-VrPVI-C
CN—SP> 1CNCNSPSPSPSPSP
Sig. 2********************
CN—EN> CNCNENENENENEN
Sig.********************
EN—SP> EN-SP-ENSPSP
Sig.*-*-*****
1 A language with the higher value than the other; 2 Significance level: < 0.001 ‘***’, < 0.01 ‘**’, < 0.05 ‘*’.
Table 5. Performance (Error Rate (ER)) of two-class LID experiments on SiTEC corpus. SVM: Support Vector Machine.
Baseline ApproachesER (%)Proposed ApproachesER (%)
CNN2.13R-vector with SVM2.26
i-vector4.75R-vector with i-vector4.73
Table 6. Performance (Error Rate (ER)) of two-class LID experiments on Mozilla corpus. CN: Chinese, EN: English, SP: Spanish.
Baseline ApproachesER (%)Proposed ApproachesER (%)
CN vs. ENCNN31.14R-vector with SVM36.05
i-vector32.26R-vector with i-vector31.78
CN vs. SPCNN30.19R-vector with SVM32.62
i-vector23.71R-vector with i-vector23.50
EN vs. SPCNN37.08R-vector with SVM43.88
i-vector38.58R-vector with i-vector38.32
Table 7. Performance (Error Rate (ER)) of three-class LID experiments on Mozilla corpus.
Baseline ApproachesER (%)Proposed ApproachesER (%)
CNN47.38R-vector with SVM53.27
i-vector48.59R-vector with i-vector47.38
Table 8. Performance (Error Rate (ER)) of two-class LID experiments on the 2011 National Institute of Standards and Technology (NIST) Language Recognition Evaluation (LRE) test set.
Baseline ApproachesER (%)Proposed ApproachesER (%)
CN vs. ENCNN49.34R-vector with SVM47.50
i-vector50.21R-vector with i-vector49.79
CN vs. SPCNN47.58R-vector with SVM48.33
i-vector43.12R-vector with i-vector43.50
EN vs. SPCNN50.59R-vector with SVM49.58
i-vector48.95R-vector with i-vector49.99
Table 9. Performance (Error Rate (ER)) of three-class LID experiments on the 2011 NIST LRE test set.
Baseline ApproachesER (%)Proposed ApproachesER (%)
CNN65.16R-vector with SVM66.80
i-vector65.41R-vector with i-vector65.66
Table 10. Computation complexity of LID approaches for a two-class LID task.
Number of ParametersComputational Intensity
CNN198,912512,512
i-vector39,93619,968
R-vector2366345

