Article

Water-Covered Roof Versus Inverted Flat Roof on the Mediterranean Coast: A Comparative Study of Thermal and Energy Behavior

by
Almudena Espinosa-Fernández
1,
Víctor Echarri-Iribarren
2,* and
Claudio A. Sáez
3,4
1
Architecture Department, University of Zaragoza, Calle María de Luna, 3, 50018 Zaragoza, Spain
2
Department of Architectural Constructions, University of Alicante, Carretera San Vicente del Raspeig, s/n, 03690 San Vicente del Raspeig, Spain
3
Laboratory of Aquatic Environmental Research. University of Playa Ancha, Calle Traslaviña 450, Viña del Mar, Chile
4
HUB Ambiental UPLA, Vicerrectoría de Investigación Postgrado e Innovación, Avenida Carvallo 270, Valparaíso, Chile
*
Author to whom correspondence should be addressed.
Appl. Sci. 2020, 10(7), 2288; https://doi.org/10.3390/app10072288
Submission received: 29 February 2020 / Revised: 24 March 2020 / Accepted: 25 March 2020 / Published: 27 March 2020
(This article belongs to the Special Issue Efficiency and Optimization of Buildings Energy Consumption)

Abstract

:

Featured Application

Water-covered roofs provide significant reductions of annual energy demands compared with inverted flat roof in residential buildings and are therefore a constructive solution of interest. High roof thermal inertia value provides a high level of thermal comfort.

Abstract

Reservoir, or water-collecting roofs present greater thermal inertia than inverted flat roofs due to the mass of water they contain. This feature gives them better thermal performance and leads to greater stability in the indoor air temperature Ti and the wall surface temperatures. In the summer, they can dampen the effect of solar radiation and regulate external thermal loads thanks to their greater effusivity and thermal capacity. This research compares the thermal behavior of the roofs of two buildings located in Alicante on the Spanish Mediterranean coast: a loft flat in the city center and a water-covered roof in the Museum of the University of Alicante (MUA). Values for effusivity, diffusivity, thermal capacity, decrement factor, time lag and internal, as well as external thermal admittance were obtained. After monitoring both roofs during 2014, behavior simulations were performed in Design Builder using 6 different scenarios reflecting different combinations in both buildings of water-covered, inverted and conventional roofs and marble or terrazzo paving. The water-covered roof led to a higher decrement factor and time lag, as well as to a reduction of annual energy demands between 8.86% and 9.03%.

1. Introduction

Population growth and technological advances have generated new comfort needs in populations, resulting in increases in energy demands. Recent studies and approximations, such as the conclusions of the Rio de Janeiro Summit, the Kyoto Protocol or the Johannesburg Summit (goal 20/20/20), have recognized the need to reduce energy consumption and gas emissions in the environment. This requirement is particularly clear in the construction industry, which is responsible for 17% of the energy consumed in cities [1]. The economic crisis that began in 2007 led to seeking solutions to reduce costs in various domains, including the field of energy associated with building usage. The Institute for Diversification and Energy Saving (IDAE) quantified the consumption of the residential/homes sector [2], concluding that heating and refrigeration accounted for 45% of the energy consumed in a home. Consequently, disciplines such as architecture must focus on solutions to improve the energy performance of buildings.
Traditional construction systems guarantee a building’s comfort conditions, but often at the cost of excessive energy consumption for heating and/or cooling—to the detriment of the environmental aspects promoted by the European Energy Efficiency Directives [3]. It is therefore essential to analyze and use new construction systems in buildings—mainly in their enclosures—that favor energy savings. In this regard, renewed attention should be given to the important role of enclosures’ thermal inertia [4]. When energy flow passes through a construction element, that element’s mass has a meaningful influence on the regulation of that flow and on the temperature of the indoor air and walls making up the space, as highlighted by Nicolo, Angelotti and Buzzetti in their study [5]. The energy-saving potential associated with the use of adequate thermal inertia can exceed 80%. Furthermore, the impacts of a construction section’s thermal inertia [6] is twofold: first, it accumulates heat in the interior space, and second, it alters the heat exchanges between the interior space and the outside.

1.1. Dynamic Behavior Versus Static Behavior

Historical developments and regulatory changes since the 1972 oil crisis have led to changes in the way thermal envelopes—mainly façades and roofs—are constructed. From massive and supporting systems, they have evolved towards elements composed of overlapping layers, without any supporting function and with the thermal mass of the enclosures significantly reduced. Consequently, thermal capacity (k), that allows dampening of outside thermal variations in the delimited interior space has also substantially diminished [7]. This reality has not been sufficiently reflected in regulations. The static thermal transmittance (U) calculation system [8] does not consider the mass of the materials that form the construction systems. The parameter is therefore inaccurate; its inaccuracy becomes greater as the enclosure mass increases [9]. The greater the mass of an enclosure, the further its dynamic behavior moves away from a static calculation. The parameter "static thermal transmittance" therefore has limitations when defining an enclosure’s characteristics. Considering that the new CTE_DB_HE (2013) [10] does not contemplate the static thermal transmittance value as mandatory and that most calculations performed are based on a dynamic regime, it is necessary to incorporate reference values in the document that take these dynamic behavior variables into account [11].
According to Dominguez and Santamaría [12], the thermal inertia of building enclosures is part of the concept of "thermal impedance", a magnitude that allows to quantify and interpret the elements’ thermal behavior when subjected to periodic thermal waves. Any incorporation of material in a building’s construction solution entails possible heat accumulation, as well as a regulation of temperature fluctuations over time. In the case of buildings with high thermal mass, the envelope’s walls reinforce the feeling of comfort through the exchange of radiant energy with the user, providing a natural balance with the ambient air temperature. According to Turégano, Hernández and García [13] this balance results from the absence of heat or radiation inputs. As Caro and Sendra found, heritage buildings with thermal inertia regulate wall temperatures in their daily evolution, resulting, in the absence of other internal energy inputs, in an almost constant interior temperature, equal to or below the average of the outdoor air temperature [14].
It is not sufficient, however, for a body to have a large thermal mass for that quality to intervene in the premises’ thermal stability. Not all material bodies have the same capacity to accumulate energy. In addition, only a minor part of a construction element’s theoretical accumulation capacity is used in practice. Kaska and Yumrutas compared experimental and theoretical results regarding transient temperature variation in the different layers of materials that make up some building sections [15]. They concluded that materials such as autoclaved aerated concrete or wood were more suitable than ceramic plating and brick.

1.2. Roofing in Construction Envelopes

A building’s thermal envelope is defined as the series of enclosures—façade, roofs, floors—marking the limit between living spaces and the outdoor environment or the terrain. Conceptually, roofs are barriers that separate two distinct environments. However, what generally stand out are their regulating functions with respect to external agents, such as visible radiation, the action of wind or rain while other agents are overlooked, such as heat flow, air infiltration or water vapor flow. The barrier function of roofs should be considered in both directions, thus not only should the effects of mass or incoming energy be considered, but also inner-outer oriented flows and the role played by thermal inertia and the thermal parameters that shape them.
Moreover, roofs also interact with the environment, not only permitting energy flow or dampening it, but also influencing themselves the qualities of the environment [16]. When concentrating on the thermal behavior of buildings, roofs play a major role regarding interior environmental conditions but are also able to accumulate thermal energy. They thus regulate the energy gains and losses that pass through them; this effect can be decisive on a building’s living conditions. In their study, Ben-Nakhi et al. [17] demonstrated the potential impact of subtle variations in conventional roof design on energy savings.

1.3. Reservoir Roofs and Water-Covered Roofs

The literature on the thermal and energy behavior of water-collecting rooftops is scarce [18]. Such roofs are rarely used in architecture due to the technical complexity of building them, the need for more costly and attentive maintenance [19], the risk of interior moisture, etc. A reservoir roof stores rainwater to use as an irrigation system and is usually covered by a floating pavement that reduces water evaporation [20,21]. One advantage, among others, is the possibility of evaporative cooling inside [22]. A water-covered roof, such as that of the MUA Museum in Alicante, is designed to leave the sheet of water in contact with outside air and solar radiation, producing high evaporation rates, which vastly reduces thermal loads by solar radiation [23,24].
Thermal inertia improvements using water mass has sometimes been achieved via less complex solutions, such as landscaped roofs [25]. Various solutions and typologies [26] have been studied which improve indoor thermal behavior and lead to energy savings [27,28]. Water-covered roofs are highly suitable for a Mediterranean climate and lead to substantial reductions in annual energy demands [29,30]. They also present advantages regarding a complete building life cycle analysis [31]. Integrated HVAC systems have sometimes been proposed with landscaped roofs, producing excellent results [32].
The present study is necessary in this sense as it explores the pros and cons of these architectural solutions adopting the perspective of thermal and energy behavior. Water-covered roofs can also have an interesting environmental value for our cities’ urban and landscape environment, providing evaporative cooling [33] in climates such as that of the Spanish Mediterranean coast.

1.4. Objectives

The objective of the present study was to compare the functional contributions of the thermal inertia of a water-covered roof with that of an inverted roof, as well as to examine improvements in comfort levels of the interior environment and the impact on the energy demand of the areas adjacent to the roof. First, two roofs of two buildings located in Alicante [4,34] and San Vicente del Raspeig (Spain) were monitored during the full cycle of 2014. Surface temperature sensors were placed in all the material layers of both enclosures [35]. In the case of the inverted roof, the sensors were installed when the roof was under construction. In the case of the water-covered roof, the sensors were incorporated using a non-destructive system which avoided damage to the waterproof layers. It was therefore possible to graph curves of temperature gradients, relative humidity, solar radiation, etc., at each time of the year, as well as the variations in dynamic regime. Based on previous parameters obtained from diverse sources and laboratory tests on the building materials used in both architectural works, we proceeded to calculate the thermal parameters in dynamic regime that affected the fluctuations of the indoor air temperature Ti and their impact on annual energy demand.
Subsequently, an energy simulation [36] was performed in the Design Builder tool, which uses the EnergyPlus calculation engine, after the prior calibration of the model. Some modifications were designed in the roofs’ construction sections. The inverted walkable flat roof was modified and turned into a water-covered roof. In addition, the position of the insulation was reversed and transformed into a conventional roof. The water-covered roof first became an inverted flat roof and was then turned into a conventional flat roof. This is how 6 scenarios were comparatively analyzed. By simulating the possible combinations of roof sections for each space, we could thus obtain various conclusions regarding the comfort of the indoor environment and annual energy demand, based on the hypothesis of the benefits of the water-covered roof. The following objectives were pursued:
  • Analyze whether incorporating materials in the construction section implies a possible accumulation of heat and regulation over time of indoor air temperature variations.
  • Confirm whether water-covered roofs, which present greater thermal inertia than inverted flat roofs, improve thermal behavior.
  • Quantify the values of thermal loads and energy demand for heating and cooling, in order to approximate the feasibility of this type of roofing in climates such as that of the Spanish Mediterranean coast in subsequent studies.

2. Description of the Two Case Studies: The Inverted Roof and Water-Covered Roof

The two existing roofs studied were located in two buildings in Alicante province: a walkable inverted flat roof in a housing block and the water-covered roof of a museum exhibition hall.

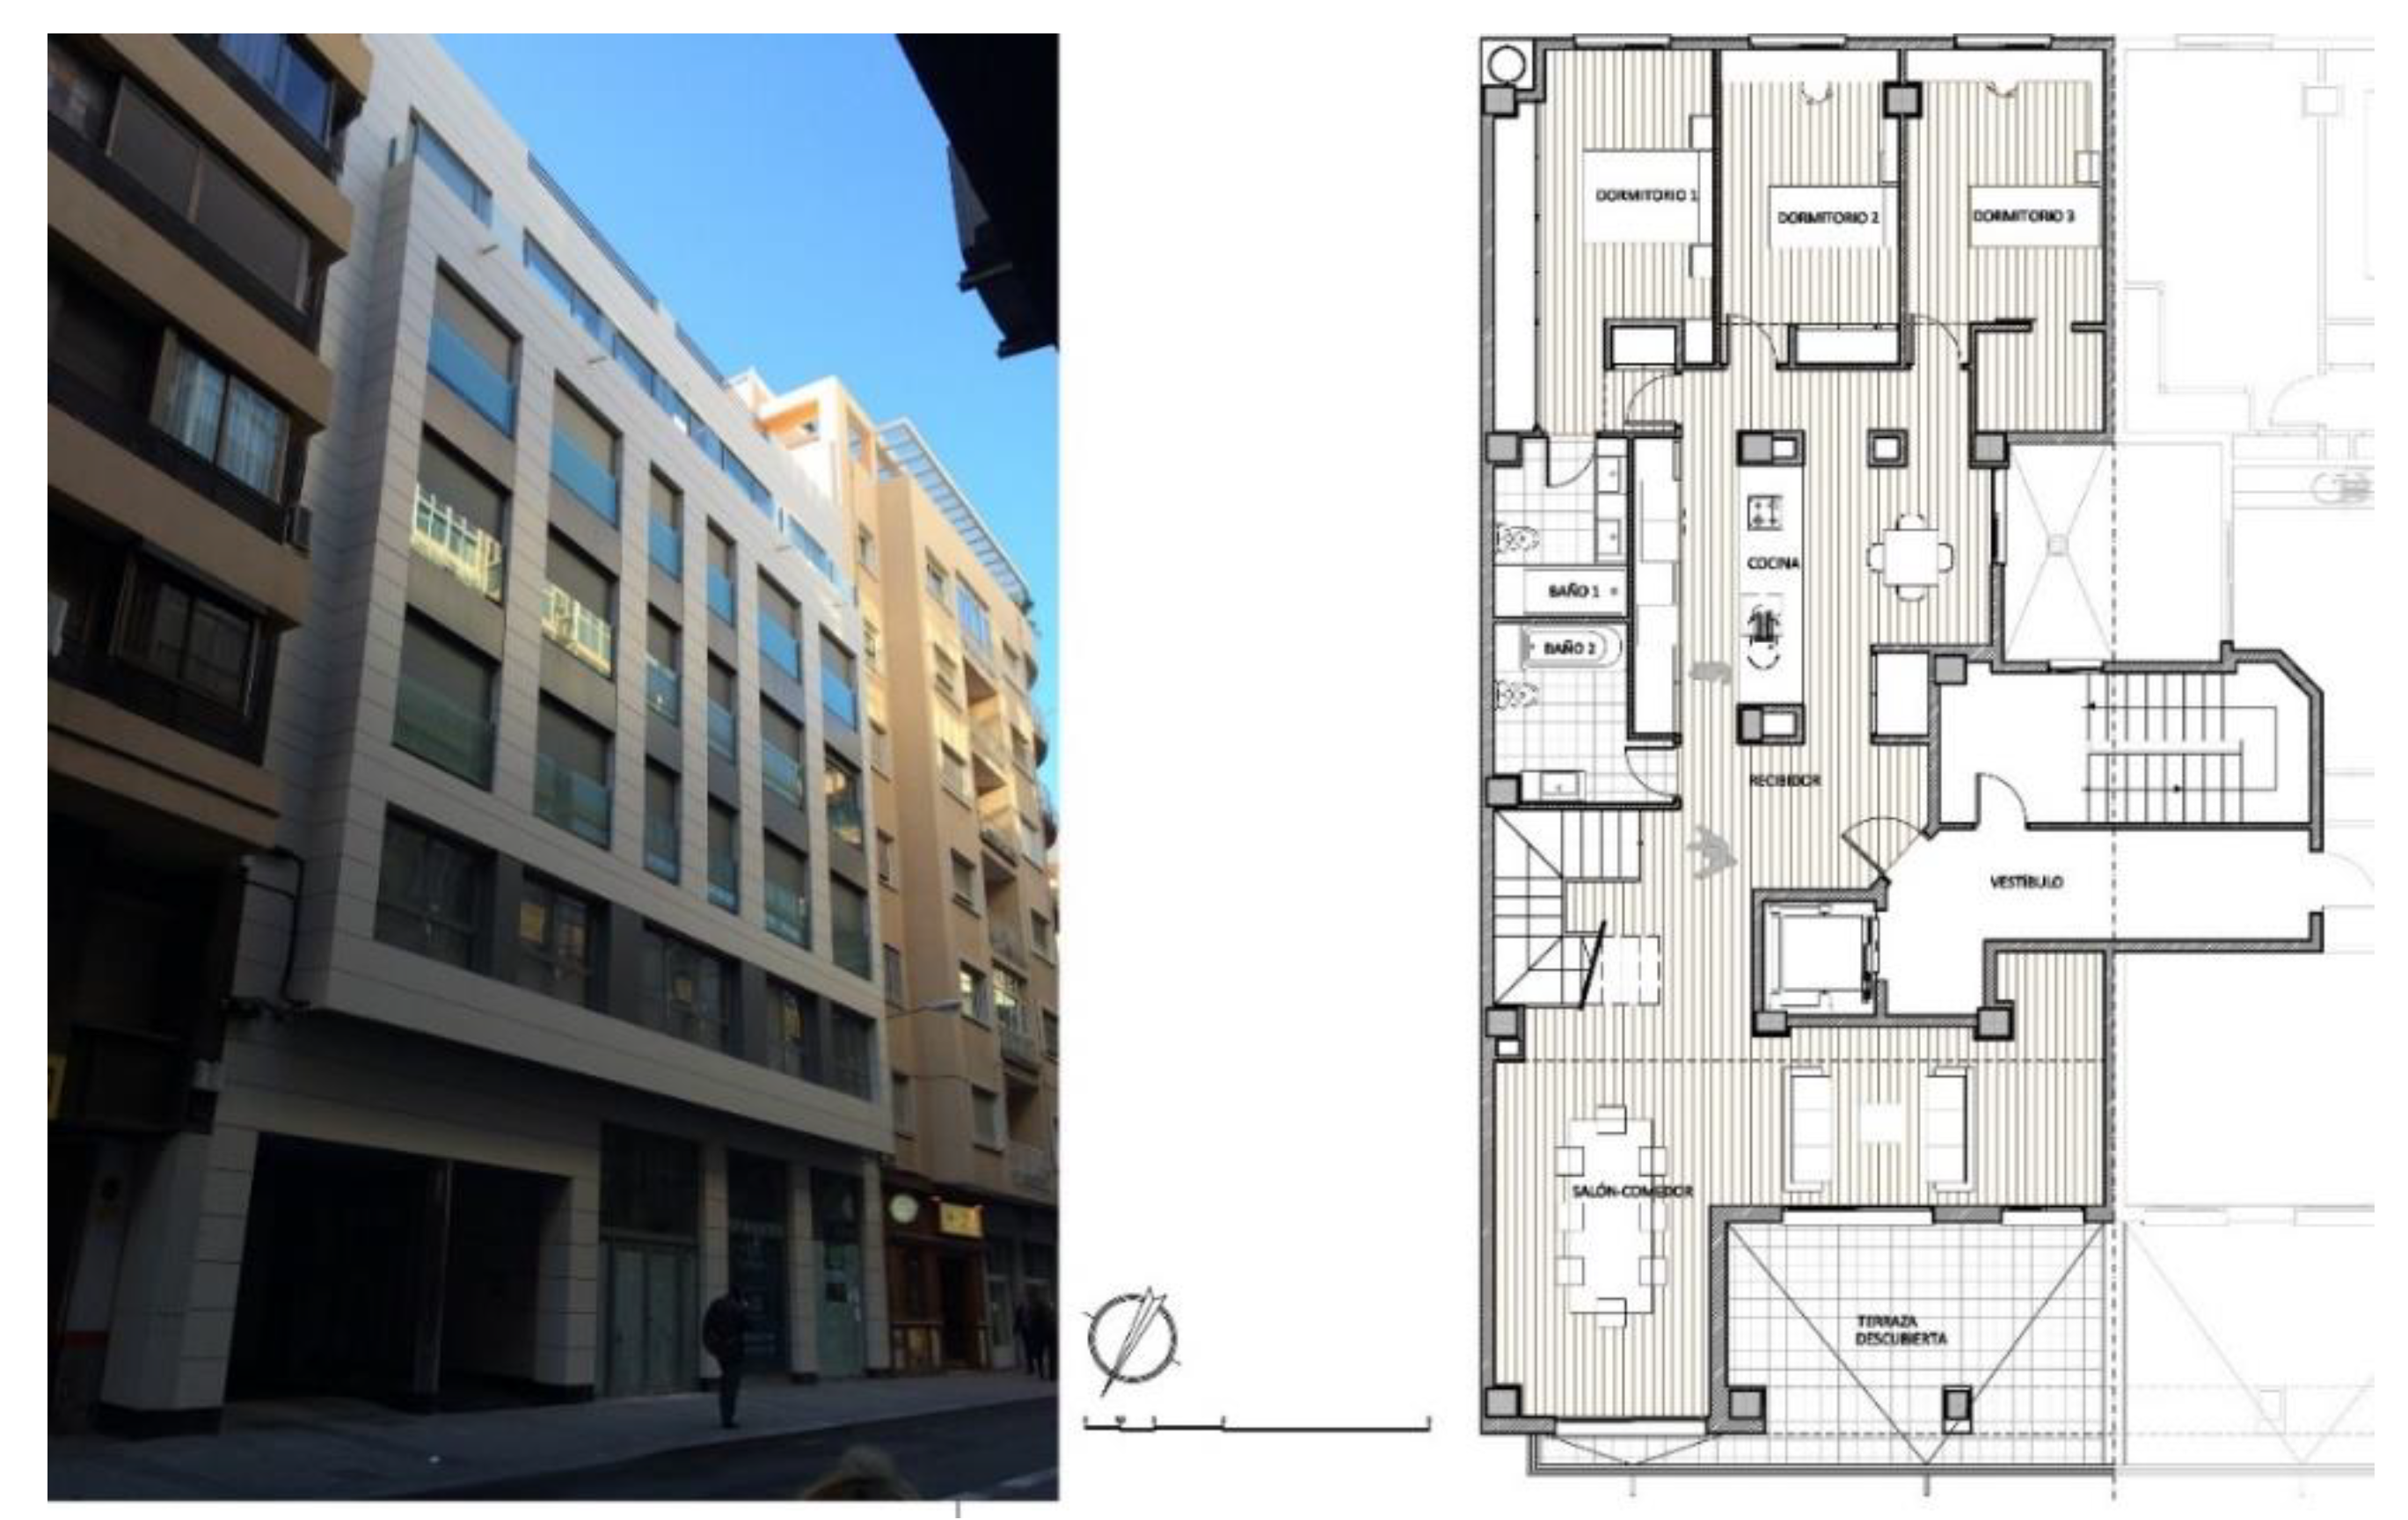
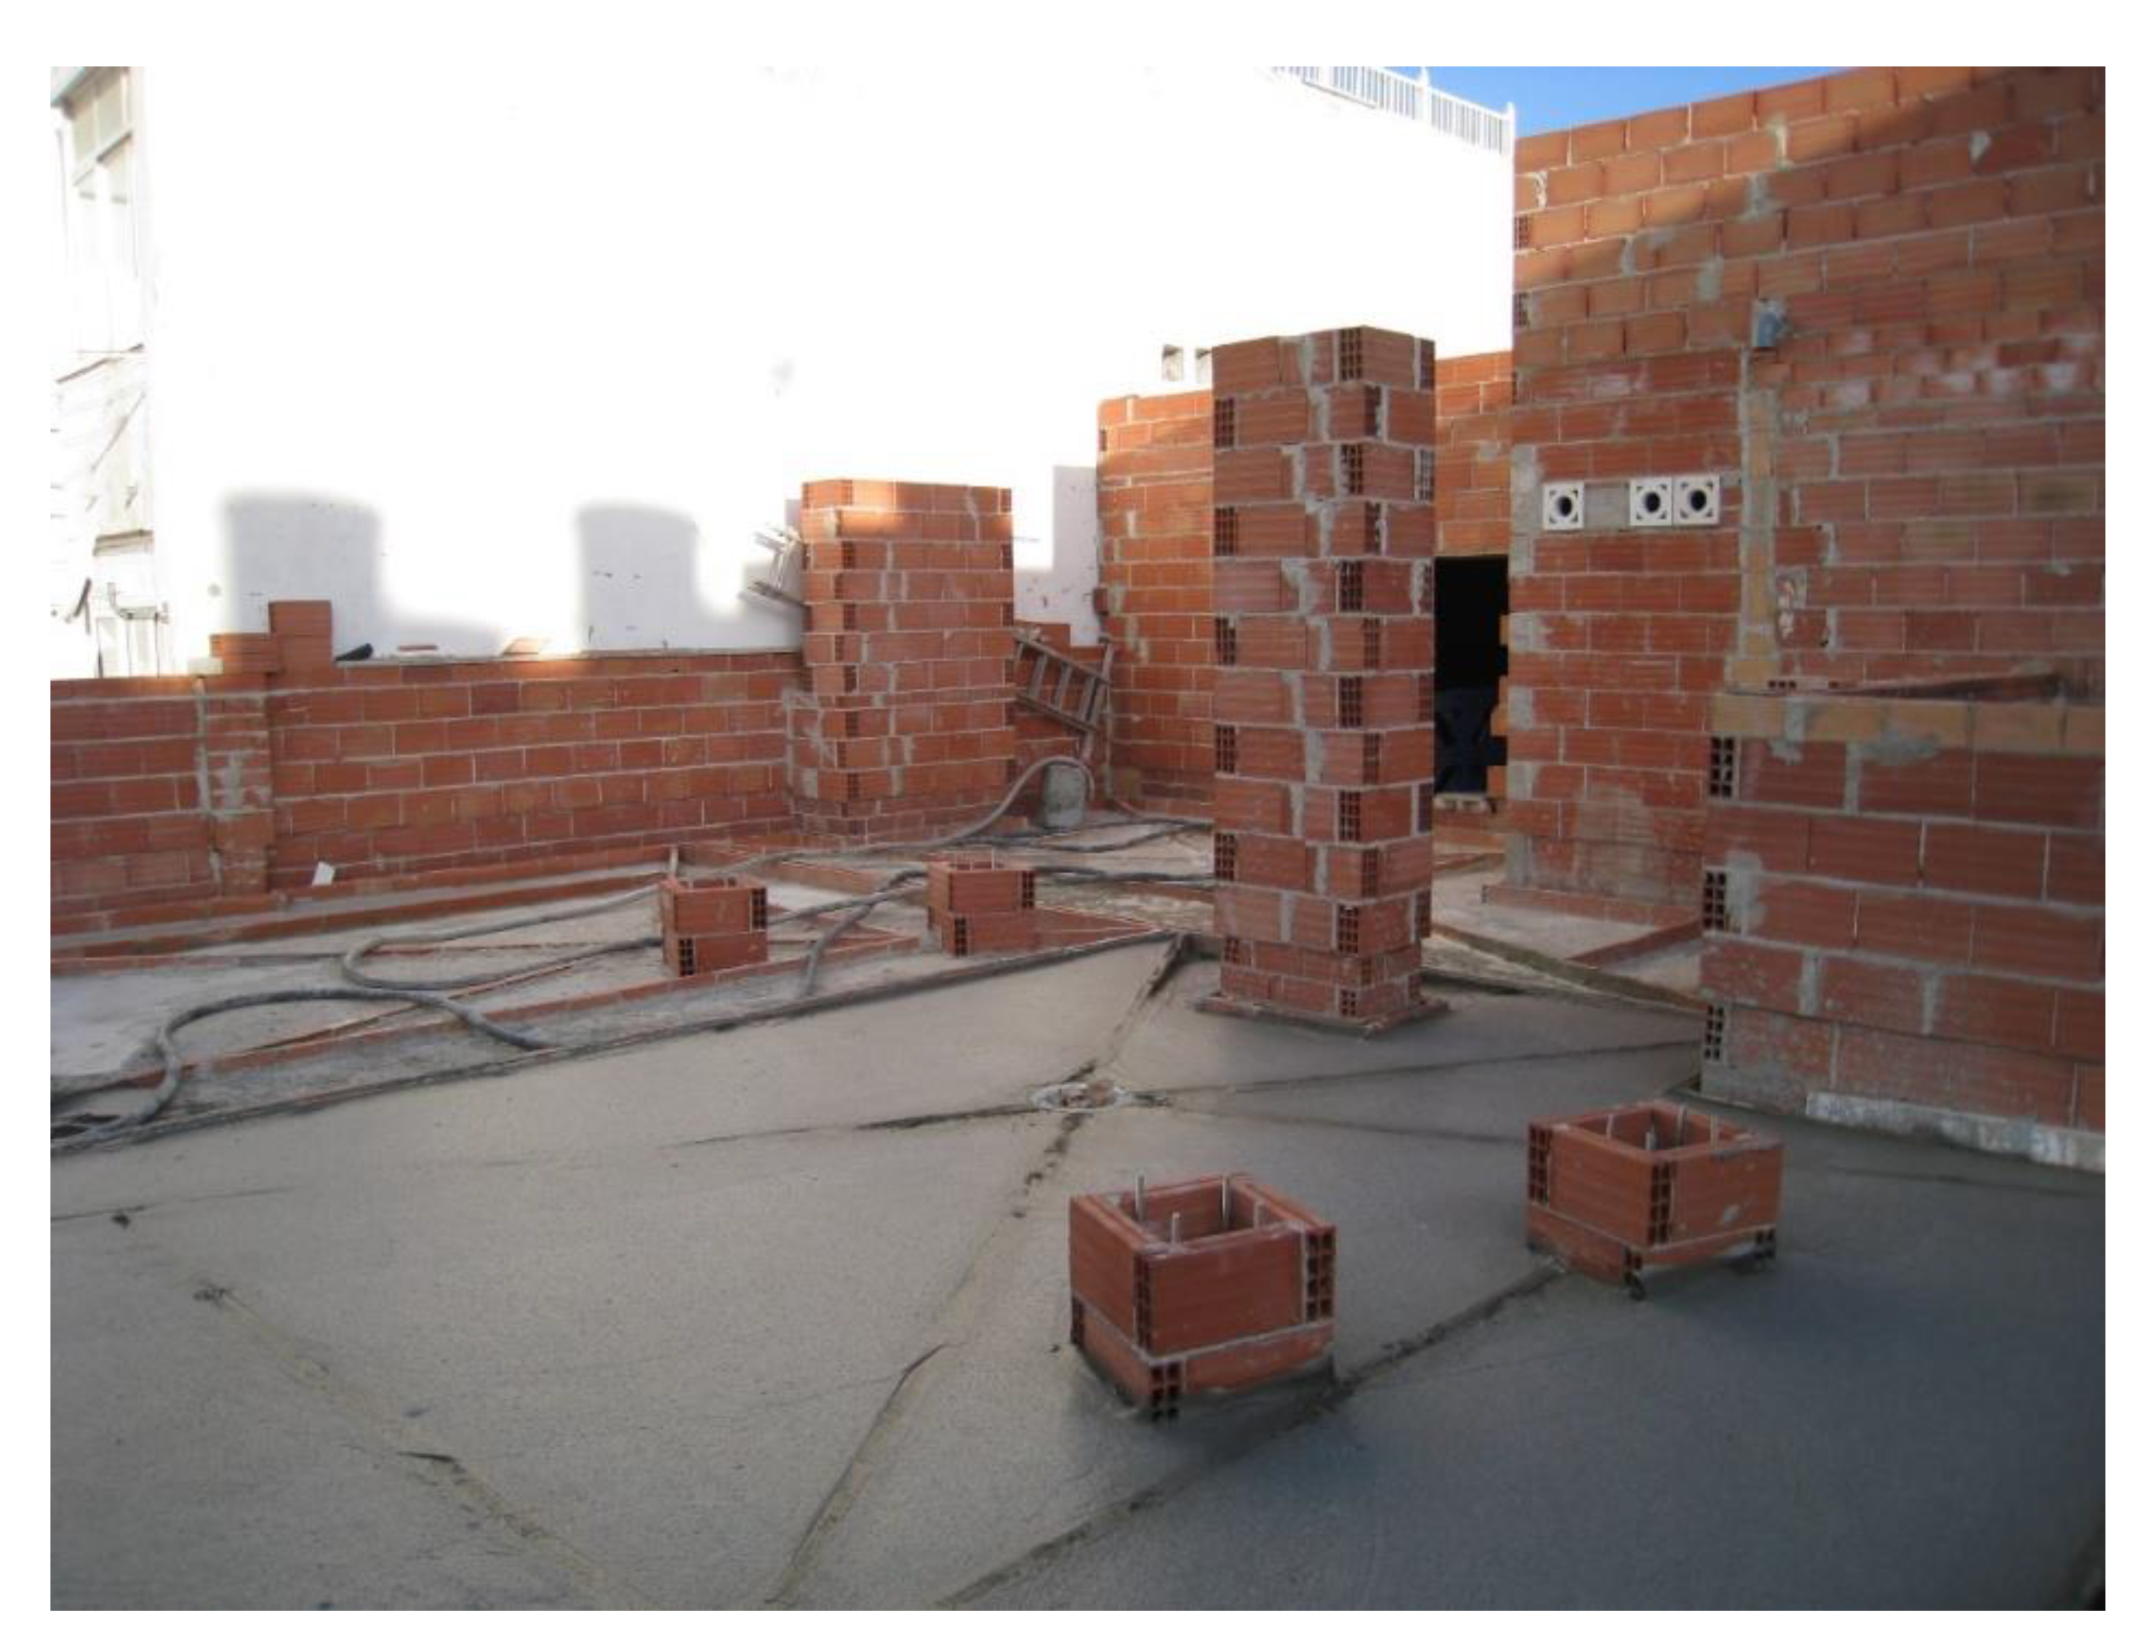
2.1. Walkable Inverted Flat Roof of a Housing Block

The inverted walkable flat roof is part of the thermal envelope of a housing block located in Alicante’s city center (Figure 1). The building is between party walls, its main façade facing Reyes Católicos street. The block is made up of a basement, ground floor, mezzanine, three floors and a loft and a communicating core. The building houses a total of 8 three-bedroom apartments and three two-bedroom apartments, offices, parking spaces and commercial premises. The flat under study corresponded to the attic of the building. It consists of 2 bathrooms, three bedrooms (giving onto the block’s inner courtyard) and a living room-kitchen oriented towards the main façade (Figure 1). One boundary of the flat corresponds to the party wall and the other to a vertical separation with another flat in the same building. The total useful floor area is 124 m2.
The construction section of the walkable inverted flat roof consists of the following layers (Table 1, Figure 2):
The flat’s air conditioning [37] consists of a VRV split inverter air conditioning system, the condensing machine being located on the roof of the building and a 5200 W evaporator located in the false ceiling of the main bathroom. Conditioned air is distributed via rectangular fiberglass ducts covered in aluminum foil, which run down the passage areas and kitchen and propel the flow of air through double deflection ventilation grilles, based on a flow-regulating device. Flow rate propulsion is regulated specifically for each room; the valve has a start–stop mechanism based on the room’s thermostat.

2.2. Water-Covered Flat Roof, MUA Building: Museum of the University of Alicante

The water-covered roof is part of the thermal envelope of one of the exhibition halls of the University Museum of the University of Alicante (MUA), in the municipality of San Vicente del Raspeig near Alicante, Spain (Figure 3). The site is a building complex within the university campus and is composed of multipurpose exhibition halls, an open-air auditorium, the Eusebio Sempere Exhibition Hall and the "Caja" (box) building. The whole complex is underground, delimited by a water-covered roof and interrupted by a courtyard in which the "wooden box" is erected as one of the exhibition spaces. The space under study is the Sempere Hall, with a useful surface area of 366 m2. It is distributed in an exhibition area, an office area and warehouses. The hall has two entrances. The main entrance gives on to the central courtyard of the museum complex. The second access point, a side entrance, is used only for maintenance tasks. The main façade of the hall, which the main entrance, Exhibition Hall and warehouse give onto, is oriented 110° East with respect to the South. As the construction is a buried building, the two façades that close the room are enclosures in contact with the terrain (Figure 3 and Figure 4).
The construction section of the water-covered roof consists of the following layers (Table 2):
The room's air conditioning system consists of an all-air HVAC system with flow regulation. The conditioned air is produced in the facility room which is separate from the building and situated alongside the parking. It consists of two Air Conditioning Units with a 77,000 m3/h flow and a maximum power of 200,000 W each, Daikin VRV AHU model. Conditioned air is distributed via rectangular fiberglass ducts covered in aluminum foil, which run down the hall’s false ceiling and propel the flow of air through double deflection ventilation grilles and circular aluminum diffusers.
Throughout the annual period under study, the thickness of the water sheet of the hall’s water-covered roof varied between 10 to 20 cm. This was due to the loss and gain of water by evaporation and rain. The roof does not have a self-filling system that maintains a constant level of water. An average value of 15 cm was considered for this study.

3. Methods

3.1. Monitoring Both Roofs

Both roofs were monitored during the full 2014 cycle to understand the actual behavior [38] of the two roofs and other enclosures, and thus, be able to then calibrate energy simulations. Thus, once the energy simulation data obtained from the sections measured in situ were corrected, we could simulate other alternative construction solutions with a reduced margin of error [39]. The result is an analysis that is more in line with the two buildings’ actual behavior. The monitoring [40] consisted in collecting climatic data (outdoor environment), internal environmental data and characteristic data of the two construction sections, in both cases every thirty minutes. To validate the climate data obtained from the monitoring, the data were contrasted with the weather data from the State Meteorological Agency, the AEMET. The installed equipment [41] consisted of indoor and outdoor air temperature sensors, HR relative humidity, the surface temperatures of some layers of the roofs and other surfaces and solar radiation (Table 3 and Table 4). Temperature sensors were installed in each layer of the roof enclosure to measure the temperature variation in each of them. A moisture detection sensor was designed for the enclosure layers where interstitial condensation could originate. Sensors were installed to measure indoor and outdoor ambient temperature and to collect outdoor and indoor humidity data. Sensors were also installed to gather solar radiation data on both roofs. The data collected by the probes was sent to a datalogger, which stored the information. Data obtained on a laptop was downloaded periodically using computer-specific software for each datalogger.
The following sensors and data loggers [42] were used: datalogger with built-in sensor for measuring and collecting ambient temperature and relative humidity data (Sensor Chip: SHT21 4C chip CMOSens); surface type K (temperature) thermocouple sensor formed by a 13 mm × 25 mm metal surface and a stainless steel braided cable; type K thermocouple sensor (temperature) consisting of a 100-mm stainless steel probe and a braided fiberglass cable; sensor, pyranometer model CMP3, to measure global solar radiation. In the case of the flat (Figure 5), the sensor installation was coordinated with the building of the roof. In the case of the MUA (Figure 6), only the layers that did not require any intervention could be accessed, and these, only superficially.

3.2. Description of the Calibration Process

The first step in the calibration process [43,44] corresponded to the model made in Design Builder, based on the characteristics of the two buildings as they were built. This 3D model version was based on the available data of the building once executed: plans, details, component lists of the different installation systems, visits to the building under study, analysis of the building’s energy management, etc. It also involved collecting data on site using measuring equipment. The ranges of accuracy, i.e., of error in this case, depended on the accuracy of the sensors and loggers. This process corresponded to experimental analysis, on-site data collection and monitoring of both roofs. With these data, a location-specific climate file was drawn up and entered as data in the Design Builder program. Measurements of surface and layer temperatures, indoor and outdoor air temperatures, relative humidity, etc. were obtained by simulating thermal behavior. They were compared with the actual data obtained in situ and the necessary parameters were adjusted so that simulation and actual behaviors were as close as possible. The second and final step was adjusting the values of ventilation or renewal of the interior air and infiltrations. Different simulations were performed varying the values of interior air renewal and infiltration, until the annual energy demand coincided with the results of actual energy consumption obtained from the meter.
The only way to validate the results was the calibration process and its comparison with real experience. The introduction in the 3D model of new construction solutions—and their simulation after a calibration process—made the comparison with the actual constructive solution more reliable. In the case of the housing block’s walkable inverted flat roof, the deviation between the simulated behavior and the actual behavior obtained during the monitored annual period was 5%. The deviation in the case of the water-covered roof of the MUA’s Sempere Hall was 3%.

3.3. Description of the Roofs Analyzed According to Modifications to Existing Roofs

Based on the construction section of the two existing roofs, QR_1 Inverted flat roof and QM_1 Water-covered roof, we proposed to modify the location of the waterproof layer and the finishing layer in both sections [45,46]. Table 5 and Table 6 describe the different scenarios proposed, with a water sheet thickness of 15 cm.
The R_1 and M_1 groups of roofs include only the original roofs, to which the modifications were proposed. The groups of roofs R_2 and M_2 present conventional roofs (with thermal insulation and a waterproof sheet on the upper side of the insulation) with two different types of finish: terrazzo or marble (Group R) or a sheet of water (Group M). The thermal properties of the materials that make up all the roof sections are summarized in Table 7.

3.4. Calculation of Thermal Parameters in Dynamic Regime

The dynamic thermal characteristics of a building’s component [47] describe its thermal behavior when subjected to changing environmental conditions over time, such as heat flow or temperature on its faces. The UNE EN ISO 13786:2011 norm explains how to evaluate the contribution of building elements to energy savings and building consumption [48]. The properties to be considered in this work are the thermal admittance and dynamic heat transmission properties, relative to the periodic variations described above.

3.4.1. Static and Dynamic Thermal Transmittance

An enclosure’s static thermal transmittance U , ( W / m 2 K ) corresponds to its capacity of resistance to heat flow, but not to its thermal inertia properties. In a static regime, the thermal transmittance, which is the inverse of the total thermal resistance (RT), is given by the following expression [49,50]:
U = 1 R T
R T = R s i + R 1 + R 2 + + R n + R s e
R = e λ
Periodic or dynamic thermal transmittance Y m n , ( W / m 2 K ) [51] represents the reduction of a space’s indoor air temperature fluctuations Ti, depending on variations of incoming thermal flow ( q ^ m ) through its enclosures [52]. It quantifies a construction element’s ability to control and reduce external thermal loads. This concept is represented mathematically by the expression:
Y m n = q ^ m θ ^ n

3.4.2. Thermal Capacity in Dynamic Regime

In dynamic mode, the thermal capacity κ , ( K J / m 2 · K ) represents the amount of heat an enclosure can store and restore to the adjacent environment [53]. It distinguishes between an internal thermal capacity, which quantifies the construction element's ability to control and store internal thermal loads and an external thermal capacity, in the case of external thermal loads. The heat accumulation capacity in dynamic regime not only depends on density (ρ), thickness and specific heat capacity (cp) of the materials making up the section, but it also involves periodic thermal conductance values (temperature and heat flow amplitudes), angular frequency of the calculation period and element surface area. Computer tools are used to perform the calculation. In this research, the computer tool developed by Josep Solé Bonet, "Calculation of the thermal characteristics of building elements in dynamic regime" [54] was used.

3.4.3. Effusivity and Decrement Factor

The heat flow density (q) that penetrates a material is proportional to its thermal effusivity ( ε ) , ( s 1 / 2 W / m 2 ° C ) , which is calculated via the mathematical expression:
ε = λ · ρ · c p
When analyzing the capacity of a heterogeneous construction section to attenuate thermal amplitudes, the decrement factor ( f ) [55] is used. This value relates the thermal amplitudes of the interior and exterior space [56] and its value depends on the thickness and effusivity of each material in the section. It is obtained via the relation between the thermal flow absorbed by a building element and the emitted thermal flow:
f = | Y m n | U
The decrement of a construction section does not imply a cumulative decrement of each material layer. A layer’s decrement capacity is applied to the energy that was able to pass through the previous layer of material. The lower the temperature fluctuation produced in the indoor air Ti as a result of the heat flow; the lower the enclosure’s thermal transmittance value U, the higher the decrement factor.

3.4.4. Diffusivity and Time Lag

The phase or time lag d f ( h ) represents the amount of time running between the maximum amplitude of a cause and the maximum amplitude of its effect. It thus defines the time elapsed between a thermal variation in a medium and its manifestation on the opposite side of a construction component subject to a transient heat calculation regime. When analyzing the capacity of a heterogeneous construction section to attenuate thermal amplitudes, time lag [57,58] is used. The thermal diffusivity α , ( m 2 / s ) is obtained by the expression:
α = λ ρ · c e

3.4.5. Thermal Admittance

The thermal admittance Y m m , Y 11 , Y 12 , ( W / m 2 K ) , [59] of an enclosure in dynamic regime [60] is the relationship between the oscillation of the heat flow that passes through a side of the enclosure and the temperature oscillation Ti that it causes in the air of the adjacent space. This characteristic belongs to an element’s surface, which depends, in turn, on the construction layers that configure it [61,62]. Admittance values are obtained for the interior and exterior surface of the roofs by means of the matrix norm calculation, according to the standard UNE EN ISO 13,786 [63].

3.5. Energy Demand Value Obtained by Simulation

To assess the energy performance of buildings in terms of heating, cooling and annual energy demand, [64] and the value of thermal loads based on the different roofing construction solutions analyzed, the loft flat and the Exhibition Hall were simulated using the Design Builder software [65]. In the case of Alicante’s city center and San Vicente del Raspeig, the climate archive of the existing template in the Design Builder database was modified by updating it according to the actual conditions of the monitoring period, so the simulated conditions coincided with the real ones. The winter period from 1 December to 30 April was defined for Alicante province and the summer period between 1 May and 30 November, as justified in previous studies [4,34].

3.5.1. Loft Flat in the City Centre of ALICANTE

To evaluate the loft flat’s loads and demands (Figure 7) we had to determine the flat’s scope of activity and occupancy. The residential usage profile was defined based on the activity of a home’s users: occupancy corresponding to 0.03 people/m2 and a programming that varies the density of occupancy depending on the time of day and day of the week. Both during working, Saturday and public period, from 08:00 to 23:00 a lighting load of 1.32 W/m2, at 00:00 of 2.2 W/m2 and 01:00–07:00 of 0.44 W/m2 was quantified. The equipment load is the same in time, value and distribution. To ensure the existence of a required minimum ventilation flow, according to CTE DB HS3 [66], a calculated minimum ventilation flow of 0.77 air changes per hour (acH) was defined. The infiltration of air through both enclosures was moderate thanks to the quality of the joineries. As we will see later, the calibration process was estimated at 0.23 acH, coinciding with values previously obtained from the blower door test [67]. Indoor air set temperatures Ti were 21 °C in winter and 24 °C in summer.

3.5.2. Sempere Exhibition Hall at the MUA

In this case, the Sempere Exhibition Hall, with a useful surface area of 366 m2, was simulated. The space consists of two exposed façades and two enclosures in contact with the terrain (Figure 8). During the monitoring data collection period in 2014, the Exhibition Hall’s occupancy corresponded to its normal activity. The "non-residential" usage profile was defined using the values defined in Spain’s technical building code [68] and its actual usual activity. An occupancy of 0.3 people/m2 was established, due to the requirements of fire safety regulations, with a resulting total of 110 people. The occupancy density was programmed to vary according to the time of day and day of the week based on this latter occupancy density. Both during working hours 07:00–20:00 and Saturday 07:00–14:00 the lighting load was 1.32 W/m2, at 00:00 of 2.8 kWh/m2 and equipment load was 4.5 W/m2.
In a first stage the air renewal or minimum ventilation flow was obtained according to CTE DB HS3 [66], with an occupancy of 110 people, a minimum of 12.5 l/s per person and a hall volume of 1647 m3. As the result was too high—and therefore not in line with reality and what was projected into the building at the time of its construction—the actual value of the air renewal was taken on site according to the actual technical characteristics of the fans of the HVAC system. As far as the infiltration air through the building envelope is concerned, the actual value is difficult to determine due to the variations in outside air pressure. It was adjusted according to the calibration method. The infiltration of air through both enclosures was moderate thanks to the quality of the joineries. To evaluate the Exhibition Hall’s thermal behavior, it was simulated under the actual conditions of the space. As seen in Section 2.2, an all-air cooling and heating system was defined. The data obtained from the set temperature and operating periods of the air conditioning system were provided by the Technical Office of the University of Alicante:
  • Heating period: from November to April.
  • Cooling period: from May to October.
  • Pre-set temperatures: 23 °C in summer and 21 °C in winter.
  • During periods of low activity at Christmas, Easter and in August, the machines were stopped.
The calibration method consisted of a first phase in which the climate data obtained by monitoring was adjusted and introduced into the Design Builder tool. Subsequently, the air renewal and infiltration flows were adjusted according to actual occupancy—not the regulation standard—according to data provided by MUA management. These parameters were varied until the annual energy demand results were in line with the actual consumptions obtained from the meter. To make Design Builder take into account the effect of thermal bridges on the thermal characteristics of the enclosures [69], the thermal bridge values were calculated using the AnTherm program [70].

4. Results

The results of the analysis of the 6 roofs will be presented comparatively below. Roofs QR_1 and QM_1 correspond to those existing in their current state. QR_2 and QM_2 are existing roofs transformed into conventional, with waterproofing above thermal insulation and without water sheet. The QR 2.1_0.15 and QM 2.1_0.15 roofs are a variant of the conventional ones, to which a 15 cm water sheet has been added.

4.1. Static and Dynamic Thermal Transmittance

The values of both thermal transmittances for each group of analyzed roofs, obtained according to expressions (1) and (4), were then obtained and compared. Table 8 shows that the values of thermal transmittances, under transient behavioral conditions, were below the values of thermal transmittances under static conditions.
The roofs with the lowest static thermal transmittance values were QR_2 and QM_2. In both cases the roofs were conventional walkable type flat roofs. The proposed roof for the QR_2 housing block was 10.12% less resistant to heat transfer than the QM_2 roof. In this case, the unventilated air chamber in section QM_2 favored resistance to heat passage. Water-covered roofs are characterized by higher static thermal transmittance than similar roofs finished with marble or terrazzo. In particular, the U value increases by 21.42% to 18.7% for conventional water-covered flat roofs (QR_2.1_0.15, QM _2.1_0.15) compared to conventional flat roofs (QR_2, QM_2).
In the case of periodic thermal transmittance values, the values of the roofs covered with sheets of water were generally lower than the values of the roofs finished with terrazzo or marble. In both cases under analysis, it was approximately 75% lower than for conventional roofs. As noted, this change in behavior in the periodic transmittance values compared to the static regime is due to the fact that the periodic value takes into account the materials’ characteristic thermal inertia, i.e., the thermal capacity parameters, effusivity and decrement factor. The use of water sheets on the roofs substantially increases the thermal inertia of the construction section.

4.2. Thermal Capacity in Dynamic Regime

High thermal capacity values mean that a construction element has a great capacity to store internal or external thermal loads and limit temperature variations on its inner and outer sides. This can improve the environment’s comfort level. Table 9 compares the transient thermal capacity values of the roofs analyzed, both inside and outside, according to the values obtained based on the UNE EN ISO 13,786 standard.
Table 9 allows concluding that the internal thermal capacity κ1 of the roof sections remains virtually constant, regardless of whether a water sheet is present. In the case of external thermal capacities κ2, roof sections finished with a sheet of water—QR_2.1_0.15 and QM _2.1_0.15—presented the highest value, between 144% and 215% higher than the terrazzo or marble roofs. They therefore have a greater ability to store heat from external loads.

4.3. Effusivity and Decrement Factor

The analysis consisted in calculating the effusivity and decrement values of the different materials used to build the proposed roofs. Subsequently, the decrement factor for each proposed roof was obtained through expression (5). Table 10 illustrates the effusivity of the materials and the decrement of the thermal wave characteristic of each of them.
Worthy of note, not all materials with high effusivity have a high decrement factor. This is the case of terrazzo paving and mortars. Materials with high effusivity—and more thermal inertia—are reinforced concrete, the slab steel sheeting and water, followed by mortars and terrazzo paving. We can observe that these are the materials with the highest percentage of decrement factor, between 76.61% and 90.88%. Thermal effusivity allows attenuating thermal amplitudes—the difference between maximum and minimum Ti air temperatures—in a space. That is why materials with high effusivity should be located on the inner side of the section.
The decrement factor of the water-sheet roofs was between 8.3% to 9.8% higher than the solid paved roof sections (Table 11).

4.4. Time Lag and Diffusivity

The analysis consisted of calculating the diffusivity and lag values of the different materials used to build the proposed roofs. Table 12 shows the thermal diffusivity values of the materials and the time lag of the thermal characteristic of each of them.
In the case of the materials that constitute the proposed roofs, the material with the highest diffusivity corresponds to the highest conductivity material, the reticular ironwork. In contrast, the material with the lowest diffusivity corresponds to the material whose specific heat product and density is higher, i.e., water. Its low diffusivity is due to the high value of the specific heat capacity. Materials with high diffusivity are observed to have low times lags, while low-diffusivity materials have high times lags.
To achieve reductions in thermal amplitudes, enclosures must have low diffusivity. In the case of enclosures composed of several layers, the low-diffusivity materials must be located on the outer side of the enclosure. Table 13 details the time lag value at the construction section level of the roofs under study (see Figure 9 and Figure 10).
The time lag values of the water-covered roofs are on average between 31% and 34% higher than the values obtained for roofs made of terrazzo paving and marble. The times lags of the QR_1, 2 and QM_1, 2 are very similar. This is because the roofs are very similar in terms of mass value. The difference between them lies in the relative position of thermal insulation, a material whose mass is negligible with respect to the enclosure as a whole.

4.5. Thermal Admittance

Applying a matrix norm calculation, in accordance with UNE EN ISO 13,786 [48], the thermal admittance values were obtained for the interior and exterior side of each roof. Table 14 details the data obtained from internal and external thermal admittance. Data relating to the original roofs are also included.
The thermal admittance behavior pattern is very similar to that of the internal and external thermal capacity. Internal thermal admittance remains constant for all roofs. In the case of external thermal admittance, the roofs with a water sheet as an outer finish are the sections with the highest external thermal admittance, between 35% and 40% higher than those finished in marble or terrazzo. Water roofs will take longer to increase their surface temperature in contact with the adjoining layer than the paving-finished roofs. During the day, they reduce excessive increases in indoor air temperature due to the effect of solar gains. At night, the flow of heat from radiation and convection to the outside of a large mass of water, which has accumulated a lot of energy, prevents the temperature of the indoor air from significantly decreasing.

4.6. Energy Demand According to the Energy Simulation

To obtain the results of annual energy demands for all 6 scenarios and establish a comparative analysis between them, the methodology set out in Section 3.5 was followed, using the Design Builder tool. The model was first calibrated according to the climate data obtained in situ. Internal boundary conditions can be defined in three ways in DesignBuilder CFD. In this paper, surface temperatures are being defined for all zone surfaces. Temperature sensors were installed in each layer of the roof enclosure to measure the temperature variation in each of them. The way to accurately include the effect of radiation heat transfer in CFD calculations is to run an EnergyPlus simulation first, to compare with real monitoring data obtained and then import surface temperatures from the EnergyPlus simulation results as CFD boundary conditions. Figure 11 shows the monitoring data obtained for the flat.
The second and final step was adjusting the values of ventilation or the interior air renewal and air infiltrations throughout the building envelope [71]. This was made possible using the data obtained from the meter on monthly energy consumption throughout 2014. In the case of the MUA Sempere Hall, annual consumption w 63.100 MWh/year, which—given that the useful area surface was 366 m2 and deducting the lighting values of 2.8 kWh/m2year—accounted for an energy demand of 117.760 kWh/m2year. Although the value of the renewal air flow for 110 people according to the CTE is 3 acH, the actual flow through the HVAC system measured in situ is 3130–3625 m3/h, so it varies between 1.90 and 2.20 acH, depending on the external climatic conditions. The installation was designed with air renewal values lower than those required in CTE DB HS3, since the real average occupation of the Sempere Room is much lower than 0.3 people per m2. Thus, a value within this interval was applied in this simulation according to the calibration method. It was adjusted to the value of annual energy demand, to match actual consumption per meter, obtaining a renewal air value of 1.95 acH and infiltration air of 0.45 acH. In the flat, meter consumption accounted for 7.447 MWh/year, with an annual energy demand of 60.06 kWh/m2year; air renewal values of 0.77 acH and air infiltration through the envelope amounted to 0.23 acH. In this way, the model was calibrated, adjusted to the annual energy demands obtained from the meter. Figure 12 and Figure 13 show computational fluid dynamics (CFD) results for the summer conditions of both simulated models.
Based on the conditions set out in Section 3.5 to perform the simulations, we obtained for the flat—in particular for the main bedroom, and for the MUA, in the Sempere Exhibition Hall—cooling and heating energy demand; overall thermal load values of each building; and the specific thermal loads of each simulated roof. Table 15 lists these values.
We can first observe that the energy demands of the Sempere Hall are almost double those of the apartment. This is mainly due to five factors: the glazing of the south and west façades is 100%; the ventilation or renewal air flow is much higher, i.e., 1.95 acH instead of 0.77 acH; the infiltration air ratio value is double; the set temperature degree in summer for the Sempere Hall is lower; high occupancy of the hall, with high internal loads. When calculating the annual-total of thermal loads, loss or gain of heat through the roof is high. It represents a load percentage between 12% and 19% of the total for the loft flat bedroom and between 18% and 19% for the MUA’s Sempere Exhibition Hall, with the greatest thermal loads corresponding to the water-covered roofs. The highest percentages of thermal loads relative to the roof, with respect to the total thermal loads, correspond to the paved walkable roofs, QR_1, QR_2 and QM_2. The latter were 18.98%, 19.01% and 18.52%, respectively. The table also shows that based on the particular conditions of use defined, activity deployed, location, climate data and associated thermal loads, the cooling energy demand is between 68% to 81% greater than heating demand. This coincides with similar previous research [34].
With regard to the value of annual energy demand, the conclusions we can draw are significant. In the case of the building block roof, the action of the 15-cm-thick water sheet visibly generates substantial energy savings. Energy demand is reduced from a value of 60.06 kWh/m2year to 54.213 kWh/m2year, or 9%. This reduction is lower than that obtained in other studies that take advantage of the accumulation of solar energy in water tanks on the façade, with values ranging from 14% to 32% [72]. In these systems, water is stored in tanks. Its energy model is like a Trombe wall and cannot transfer heat by evaporation to the outdoor environment. Furthermore, convection heat transfer in sunspace is much lower than the water-covered roof with outside air. So, water heat build-up capacity increases and it uses to heat night-time states.
In the case of the roof of the MUA Sempere Hall, with a useful surface area of 366 m2, the consumption came down from 117,760 to 104,335 kWh/m2year, i.e., a reduction of 8.9%. These are significant values that, in the case of the MUA, could lead to substantial energy savings due to the building’s high level of consumption. Annual consumption values drop by approximately 4914 kWh, equating to an annual energy bill reduction of around 700 euros, with an energy cost of 0.142 € per kWh of electricity given by IDAE [1]. In the case of the flat, annual consumption was reduced by 725 kWh, corresponding to a reduction in the annual energy bill by 103 euros. This means that if an inverted flat roof had been set up on the MUA, instead of the adopted water-covered roof solution, in the 20 years of the building's existence, an additional 14,000 euros would have had to have been paid. If we extrapolate this to the entire surface of the MUA that is currently under the water sheet, i.e., 746 m2, a total of 28,500 euros would have been saved.
Future studies will examine whether investments made with the construction of the water-covered roof could or not be paid back within a reasonable period of time. We must remember that the costs of water supply due to high evaporation rates, of roof maintenance work—which is highly demanding and complex—the cleaning and disinfection of water, as well as the repairs of the waterproofing sheet must be added to the cost of the investments in the material execution of these roofs, due to the need to have greater sections of reinforced concrete slabs. Also worthy of note, after 10 years this was replaced by a new waterproofing sheet; after another 10 years of service, water leaks have been reoccurring inside the Sempere Hall.

5. Conclusions

Water-covered roofs substantially improve the thermal behavior of the spaces they shape when used in buildings on the Mediterranean coast. The increase in thermal inertia added to the roof enclosure—despite convection currents affecting internal heat transmission from the water mass— significantly reduced the effect of solar radiation on the parameters that define interior space comfort: indoor air temperature and surface temperature of the wall surfaces that configure it, especially the ceiling. The present study compared the thermal and energy behavior of a water-covered roof and an inverted roof, both located in Alicante (Spain). It was shown that if we compare the water-covered roofs with a water thickness of 15 cm with Alicante’s widespread inverted roofs:
  • Internal thermal capacities were similar, with a minimum variation of 5.7%.
  • The outer thermal capacity of the water-covered roofs was 45% higher than the roofs with a stone or terrazzo finish.
  • Decrement factor increased by about 9%.
  • Time lag was reduced by 31%–34%.
  • The internal thermal admittance value was virtually homogeneous in all sections. It only varied for values close to 0.05 W/m2K, so it was not a significant value.
  • External thermal admittance was 35%–42% higher.
Compared to conventional roofs, where the waterproofing sheet is placed on the upper part of the insulation, the results obtained bring about some improvements compared to the previous ones. This ability of water-covered roofs to dampen the thermal wave in the interior space leads to a substantial reduction in indoor air temperature variations Ti throughout the one-day cycle. This is much more stable, meaning HVAC systems have to counteract the effect of a lower value of associated thermal loads and heat flows through the roof and other surfaces are greatly reduced.
To evaluate the improvement of thermal and energy behavior, the Design Builder tool was used. Its model was calibrated thanks to the monitoring during the entire 2014 cycle of the two buildings under study, as well as the energy consumption values per meter. Ti set temperatures of 21 °C in winter and 23 °C in summer for the Sempere Hall; a temperature of 24 °C in summer for the house was maintained. The results regarding annual energy demands are significant. Water-covered roofs have lower annual energy demands, with energy saving values representing 8.86% to 9.03%. This could translate to an annual reduction in the MUA's energy bill of 1422.37 euros; in the case of the flat, of 102.95 euros. Since the simulations were carried out for two buildings of different uses—residential housing and a museum—we can estimate that findings would be similar in other case studies.
Further construction water-covered roof alternatives will be evaluated in future studies. A full LCA life cycle assessment of the building and the impact of the water-covered roof will be carried out, quantifying the reduction of environmental impacts and the investment payback period. We will also try to adjust the ideal thickness of the water sheet to maximize the building’s sustainability value.

Author Contributions

Article conceptualization, A.E.-F. and V.E.-I.; methodology, A.E.-F., C.A.S. and V.E.-I.; software, A.E.-F.; validation, C.A.S., A.E.-F. and V.E.-I.; writing, C.A.S., A.E.-F. and V.E.-I.; project administration and funding acquisition, V.E.-I. All authors have read and agreed to the published version of the manuscript.

Funding

This research was funded by the Vice-rectorate of Campus and Technology of the University of Alicante, in grants awarded by the Own Programme in 2014.

Acknowledgments

We would like to thank the management team of the University of Alicante for their support in making this research possible, especially Rafael Muñoz Guillena.

Conflicts of Interest

The authors declare no conflict of interest. The funders had no role in the design of the study; in the collection, analyses or interpretation of data; in the writing of the manuscript or in the decision to publish the results.

Nomenclature

Q R Roof Values (Residential Q ) (R)
Q M Roof Values (Museum Q ) (M)
λ Thermal conductivity, ( W / m K )
ρ Density, ( K g / m 3 )
c p Specific heat capacity, ( J / K g K )
U Static thermal transmittance, ( W / m 2 K )
Y m n Dynamic thermal transmittance, ( W / m 2 K )
R T Total thermal resistance, ( m 2 · K / W )
R 1 , R 2 R n Thermal resistances for each material layer defined, ( m 2 · K / W )
R s i , R s e Surface thermal resistances corresponding to indoor and outdoor air, ( m 2 · K / W )
e Material layer thickness, ( m )
q Heat flow density, ( W / m 2 )
q ^ m Incoming thermal flow, ( W / m 2 )
θ Temperature ( ° C )
κ Thermal capacity per surface unit, ( K J / m 2 · K )
f Decrement factor, ( % )
ε Thermal effusivity, ( s 1 / 2 W / m 2 ° C )
d f Time lag, (h)
α Thermal diffusivity α , ( m 2 / s )
Y m m Thermal admittance, (W/(m2K)
acHAir changes per hour, ( )

References

  1. IDAE. Ministerio para la Transición Ecológica. Consumos Energéticos por Ramas del Sector Servicios y Fuentes Energéticas Expresados en Unidades Energéticas. Available online: https://www.idae.es/sites/default/files/estudios_informes_y_estadisticas/cons_servic_2017_info_supl_web_ok.xls (accessed on 12 March 2019).
  2. IDAE. Ministerio para la Transición Ecológica. Consumo para usos y energías del sector residencial (2010–2015). Available online: https://www.idae.es/sites/default/files/estudios_informes_y_estadisticas/cons_usos_resid_eurostat_web_2010-17_ok.xlsx (accessed on 12 March 2019).
  3. European Commission. Directive 2010/31/EU of European Parliament and of the Council of 19 May 2010 on the Energy Performance of Buildings (recast). Off. J. Eur. Union 2010, 18, 2010. [Google Scholar]
  4. Echarri, V.; Espinosa, A.; Rizo, C. Thermal Transmission through Existing Building Enclosures: Destructive Monitoring in Intermediate Layers versus Non-Destructive Monitoring with Sensors on Surfaces. Sensors 2017, 17, 2848. [Google Scholar] [CrossRef] [PubMed] [Green Version]
  5. Aste, N.; Angelotti, A.; Buzzetti, M. The influence of the external walls thermal inertia on the energy performance of well insulated buildings. Energy Build. 2009, 41, 1181–1187. [Google Scholar] [CrossRef]
  6. Verbeke, S.; Audenaert, A. Thermal inertia in buildings: A review of impacts across climate and building use. Renew. Sustain. Energy Rev. 2018, 82, 2300–2318. [Google Scholar] [CrossRef]
  7. Aznar, F.; Echarri, V.; Rizo, C.; Rizo, R. Modelling the thermal behaviour of a building facade using deep learning. PLoS ONE 2018, 13, e0207616. [Google Scholar] [CrossRef] [Green Version]
  8. Serra, J.; Tenorio, J. Experiencia española de transición: Desde la dispersa normativa de la edificación prescriptiva hacia el nuevo Código Técnico de la Edificación 2006, una norma moderna y unificada, enfocada hacia las prestaciones. Rev. Ing. 2015, 38, 42–47. [Google Scholar] [CrossRef] [Green Version]
  9. Bienvenido-Huertas, D.; Rubio-Bellido, C.; Pérez-Ordóñez, J.L.; Oliveira, M.J. Automation and optimization of in-situ assessment of wall thermal transmittance using a Random Forest algorithm. Build. Environ. 2020, 168, 106479. [Google Scholar] [CrossRef]
  10. Orden FOM/588/2017 del 15 de junio, por la que se actualiza el Documento Básico de Ahorro de Energía DB-HE (Publicado en: «BOE» núm. 149, de 23 de junio de 2017); Spanish Ministry of Public Works and Transport: Madrid, Spain, 2017.
  11. Bienvenido-Huertas, D.; Moyano, J.; Rodriguez-Jimenez, C.E.; Marin, D. Applying an artificial neural network to assess thermal transmittance in walls by means of the thermometric method. Appl. Energy 2019, 233, 1–14. [Google Scholar] [CrossRef]
  12. Domínguez, M.; Santamaría, S. Importancia de la inercia térmica de los cerramientos. ConArquitectura 2001, 3, 49–56. [Google Scholar]
  13. Turégano, J.A.; Hernández, M.A.; Garcia, F. La inercia de los edificio y su incidencia en las condiciones de confort como refuerzo de los aportes de carácter pasiva. Conarquitectura 2003, 08, 65–80. [Google Scholar]
  14. Caro, R.; Sendra, J.J. Evaluation of indoor environment and energy performance of dwellings in heritage buildings. The case of hot summers in historic cities in Mediterranean Europe. Sustain. Cities Soc. 2020, 52, 101798. [Google Scholar] [CrossRef]
  15. Kaska, O.; Yumrutas, R. Comparison of experimental and theoretical results for the transient heat flow through multilayer walls and flat roofs. Energy 2008, 33, 1816–1823. [Google Scholar] [CrossRef]
  16. Al-Sanea, S.A. Thermal performance of building roof elements. Build. Environ. 2002, 37, 665–675. [Google Scholar] [CrossRef]
  17. Ben-Nakhi, A.; Mahmoud, A.M.; Mahmoud, M.A.; Al Dashti, A. Improving thermal performance of the roof enclosure of heavy construction buildings. Appl. Energy 2008, 85, 911–930. [Google Scholar] [CrossRef]
  18. Sharifi, A.; Yamagata, Y. Roof ponds as passive heating and cooling systems: A systematic review. Appl. Energy 2015, 160, 336–357. [Google Scholar] [CrossRef]
  19. Naticchia, B.; Fernandez-Gonzalez, A.; Carbonari, A. Bayesian Network model for the design of roofpond equipped buildings. Energy Build. 2007, 39, 258–272. [Google Scholar] [CrossRef]
  20. Neila, F.J.; Bedoya, C.; Acha, C.; Olivieri, F.; Barbero, M. Las cubiertas ecológicas de tercera generación: Un nuevo material constructive. Inf. Constr. 2008, 60, 15–24. [Google Scholar]
  21. Kruger, E.; Fernandes, L.; Lange, S. Thermal performance of different configurations of a roof pond-based system for subtropical conditions. Build. Environ. 2016, 107, 90–98. [Google Scholar] [CrossRef]
  22. Kuehni, S.M.S.; Bou-Zeid, E.; Webb, C.; Shokri, N. Roof cooling by direct evaporation from a porous layer. Energy Build. 2016, 127, 521–528. [Google Scholar] [CrossRef] [Green Version]
  23. Pearlmutter, D.; Berliner, P. Experiments with a ‘psychrometric’ roof pond system for passive cooling in hot-arid regions. Energy Build. 2017, 144, 295–302. [Google Scholar] [CrossRef]
  24. Sabzi, D.; Haseli, P.; Jafarian, M.; Karimi, G.; Taheri, M. Investigation of cooling load reduction in buildings by passive cooling options applied on roof. Energy Build. 2015, 109, 135–142. [Google Scholar] [CrossRef]
  25. Tan, C.L.; Tan, P.Y.; Wong, N.H.; Takasuna, H.; Kudo, T.; Takemasa, Y.; Lim, C.V.J.; Chua, H.X.V. Impact of soil and water retention characteristics on green roof thermal performance. Energy Build. 2017, 152, 830–842. [Google Scholar] [CrossRef]
  26. Scharf, B.; Zluwa, I. Case study investigation of the building physical properties of seven different green roof systems. Energy Build. 2017, 151, 564–573. [Google Scholar] [CrossRef]
  27. Tian, Y.; Bai, X.; Qi, B.; Sun, L. Study on heat fluxes of green roofs based on an improved heat and mass transfer model. Energy Build. 2017, 152, 175–184. [Google Scholar] [CrossRef]
  28. Morakinyo, T.E.; Dahanayake, K.W.D.; Kalani, C.; Ng, E.; Chow, C.L. Temperature and cooling demand reduction by green-roof types in different climates and urban densities: A co-simulation parametric study. Energy Build. 2017, 145, 226–237. [Google Scholar] [CrossRef]
  29. Schweitzer, O.; Erell, E. Evaluation of the energy performance and irrigation requirements of extensive green roofs in a water-scarce Mediterranean climate. Energy Build. 2014, 68, 25–32. [Google Scholar] [CrossRef]
  30. Silva, C.M.; Gloria Gomes, M.; Silva, M. Green roofs energy performance in Mediterranean climate. Energy Build. 2016, 116, 318–325. [Google Scholar] [CrossRef]
  31. Hong, T.; Kim, J.; Koo, C. LCC and LCCO2 analysis of green roofs in elementary schools with energy saving measures. Energy Build. 2012, 45, 229–239. [Google Scholar] [CrossRef]
  32. Zhao, D.; Aili, A.; Yin, X.; Tan, G.; Yang, R. Roof-integrated radiative air-cooling system to achieve cooler attic for building energy saving. Energy Build. 2019, 203, 109453. [Google Scholar] [CrossRef]
  33. Berardi, U.; La Roche, P.; Almodóvar, J.M. Water-to-air-heat exchanger and indirect evaporative cooling in buildings with green roofs. Energy Build. 2017, 151, 406–417. [Google Scholar] [CrossRef]
  34. Echarri Iribarren, V.; Espinosa Fernández, A.; Galiano Garrigós, A. Energy efficiency on flooded roofs: The University of Alicante Museum. WIT Trans. Eng. Sci. 2016, 106, 163. [Google Scholar]
  35. Leon, A.L.; Munoz, S.; Leon, J.; Bustamante, P. Monitoring environmental and energy variables in the construction of subsidised housing: Cros-Pirotecnia building in Sevilla. Inf. Constr. 2010, 62, 67–82. [Google Scholar] [CrossRef] [Green Version]
  36. Coakley, D.; Raftery, P.; Keane, M. A review of methods to match building energy simulation models to measured data. Renew. Sustain. Energy Rev. 2014, 37, 123–141. [Google Scholar] [CrossRef] [Green Version]
  37. Barrios, G.; Huelsz, G.; Rojas, J. Thermal performance of envelope wall/roofs of intermittent air-conditioned rooms. Appl. Ther. Eng. 2012, 40, 1–7. [Google Scholar] [CrossRef]
  38. Moujalled, B.; Oumeziane, Y.A.; Moissette, S.; Bart, M.; Lanos, C.; Samri, D. Experimental and numerical evaluation of the hygrothermal performance of a hemp lime concrete building: A long term case study. Build. Environ. 2018, 136, 11–27. [Google Scholar] [CrossRef]
  39. Aste, N.; Leonforte, F.; Manfren, M.; Mazzon, M. Thermal inertia and energy efficiency—Parametric simulation assessment on a calibrated case study. Appl. Energy 2015, 145, 111–123. [Google Scholar] [CrossRef]
  40. Pisello, A.L.; Cotana, F. The thermal effect of an innovative cool roof on residential buildings in Italy: Results from two years of continuous monitoring. Energy Build. 2014, 69, 154–164. [Google Scholar] [CrossRef]
  41. Ahmad, A.; Maslehuddin, M.; Al-Hadhrami, L.M. In situ measurement of thermal transmittance and thermal resistance of hollow reinforced precast concrete walls. Energy Build. 2014, 84, 132–141. [Google Scholar] [CrossRef]
  42. El Bachawati, M.; Manneh, R.; Belarbi, R.; El Zakhem, H. Real-time temperature monitoring for Traditional gravel ballasted and Extensive green roofs: A Lebanese case study. Energy Build. 2016, 133, 197–205. [Google Scholar] [CrossRef]
  43. Heo, Y.; Choudhary, R.; Augenbroe, G.A. Calibration of building energy models for retrofit analysis under uncertainty. Energy Build. 2012, 47, 550–560. [Google Scholar] [CrossRef]
  44. Stavrakakis, G.M.; Androutsopoulos, A.V.; Vyorykka, J. Experimental and numerical assessment of cool-roof impact on thermal and energy performance of a school building in Greece. Energy Build. 2016, 130, 64–84. [Google Scholar] [CrossRef]
  45. Kontoleon, K.J.; Theodosiou, T.G.; Tsikaloudaki, K.G. The influence of concrete density and conductivity on walls’ thermal inertia parameters under a variety of masonry and insulation placements. Appl. Energy 2013, 112, 325–337. [Google Scholar] [CrossRef]
  46. Ozel, M. Effect of insulation location on dynamic heat-transfer characteristics of building external walls and optimization of insulation thickness. Energy Build. 2014, 72, 288–295. [Google Scholar] [CrossRef]
  47. Marietta, L.; Evola, G.; Giuga, M. Using the dynamic thermal properties to assess the internal temperature swings in free running buildings. A general model and its validation according to ISO 13792. Energy Build. 2015, 87, 57–65. [Google Scholar] [CrossRef]
  48. Thermal Performance of Buildings Components—Dynamic Thermal Characteristics—Calculation Methods; ISO 13786:2017; International Organization for Standardization: Geneva, Switzerland, 2017.
  49. Nowoswiat, A.; Skrzypczyk, J.; Krause, P.; Steidl, T.; Winkler-Skalna, A. Estimation of thermal transmittance based on temperature measurements with the application of perturbation numbers. Heat Mass Transf. 2018, 54, 1477–1489. [Google Scholar] [CrossRef] [Green Version]
  50. Documento de Apoyo al Documento Básico Ahorro de energía, DA DB-HE/1, Cálculo de Parámetros Característicos de la Envolvente (2015). Available online: https://www.codigotecnico.org/images/stories/pdf/ahorroEnergia/DA-DB-HE-1-Calculo_de_parametros_caracteristicos.pdf (accessed on 16 January 2019).
  51. Kotsiris, G.; Androutsopoulos, A.; Polychroni, E.; Nektarios, P.A. Dynamic U-value estimation and energy simulation for green roofs. Energy Build. 2012, 45, 240–249. [Google Scholar] [CrossRef]
  52. Gasparella, A.; Pernigotto, G.; Baratieri, M.; Baggio, P. Thermal dynamic transfer properties of the opaque envelope: Analytical and numerical tools for the assessment of the response to summer outdoor conditions. Energy Build. 2011, 43, 2509–2517. [Google Scholar] [CrossRef]
  53. Rossi, M.; Rocco, V.M. External walls design: The role of periodic thermal transmittance and internal areal heat capacity. Energy Build. 2014, 68, 732–740. [Google Scholar] [CrossRef]
  54. Solé Bonet, J. Cálculos de las Características Térmicas de Elementos Constructivos en Régimen Dinámico. Herramienta Informática: Hoja de Cálculo Excel, Ursa Cálculo Térmico EN 6946 y EN 12354.xls., Barcelona. 2011. Available online: http://aipex.es/descargas.php?s=7&id=151 (accessed on 18 September 2018).
  55. Fathipour, R.; Hadidi, A. Analytical solution for the study of time lag and decrement factor for building walls in climate of Iran. Energy 2017, 134, 167–180. [Google Scholar] [CrossRef]
  56. Mazzeo, D.; Oliveti, G.; Arcuri, N. Influence of internal and external boundary conditions on the decrement factor and time lag heat flux of building walls in steady periodic regime. Appl. Energy 2016, 164, 509–531. [Google Scholar] [CrossRef]
  57. Ruivo, C.R.; Ferreira, P.M.; Vaz, D.C. On the error of calculation of heat gains through walls by methods using constant decrement factor and time lag values. Energy Build. 2013, 60, 252–261. [Google Scholar] [CrossRef]
  58. Sun, C.; Shu, S.; Ding, G.; Zhang, X.; Hu, X. Investigation of time lags and decrement factors for different building outside temperatures. Energy Build. 2013, 61, 1–7. [Google Scholar] [CrossRef]
  59. Alarcon, M.; Alhama, F.; Gonzalez-Fernandez, C.F. Transient conduction in a fin-wall assembly with harmonic excitationNetwork thermal admittance. Heat Transf. Eng. 2002, 23, 31–43. [Google Scholar] [CrossRef]
  60. Shaik, S.; Gorantla, K. Setty, Ashok Babu Talanki Puttaranga Investigation of Building Walls Exposed to Periodic Heat Transfer Conditions for Green and Energy Efficient Building Construction. In Proceedings of the 3rd International Conference on Innovations in Automation and Mechatronics Engineering 2016, Iciame 2016, Vallabh Vidhyanagar, India, 5–6 February 2016; pp. 496–503. [Google Scholar]
  61. Saboor, S.; Babu, A.T.P. Effect of Air Space Thickness within the External Walls on the Dynamic Thermal Behaviour of Building Envelopes for Energy Efficient Building Construction. In Proceedings of the International Conference on Alternative Energy in Developing Countries and Emerging Economies, Bangkok, Thailand, 28–29 May 2015; pp. 766–771. [Google Scholar]
  62. Najim, K.B. External load-bearing walls configuration of residential buildings in Iraq and their thermal performance and dynamic thermal behaviour. Energy Build. 2014, 84, 169–181. [Google Scholar] [CrossRef]
  63. Evangelisti, L.; Guattari, C.; Asdrubali, F. Influence of heating systems on thermal transmittance evaluations: Simulations, experimental measurements and data post-processing. Energy Build. 2018, 168, 180–190. [Google Scholar] [CrossRef]
  64. Crawley, D.B.; Hand, J.W.; Kurnmert, M.; Griffith, B.T. Contrasting the capabilities of building energy performance simulation programs. Build. Environ. 2008, 43, 661–673. [Google Scholar] [CrossRef] [Green Version]
  65. Design Builder Software. Design Builder EnergyPlus Simulation Documentation for Design Builder V. 4.5.; Design Builder Sortware Ltd.: Stroud, UK, 2015. [Google Scholar]
  66. Orden FOM/588/2017, de 15 de Junio, por la que se Actualiza el Documento Básico DB-HS Salubridad, Sección HS 3, Calidad del aire Interior, del Código Técnico de la Edificación, Aprobado por Real Decreto 314/2006, de 17 de Marzo. (Publicado en: «BOE» núm. 149, de 2 de Junio de 2017) Madrid, Spanish Ministry of Public Works and Transport. 2017. Available online: https://www.codigotecnico.org/images/stories/pdf/salubridad/DccHS.pdf (accessed on 4 December 2018).
  67. Feijo-Munoz, J.; Pardal, C.; Echarri, V.; Fernandez-Aguera, J.; Assiego de Larriva, R.; Montesdeoca Calderin, M.; Poza-Casado, I.; Angel Padilla-Marcos, M.; Meiss, A. Energy impact of the air infiltration in residential buildings in the Mediterranean area of Spain and the Canary islands. Energy Build. 2019, 188, 226–238. [Google Scholar] [CrossRef]
  68. Real Decreto 314/2006 de 17 de Marzo por el que se Aprueba el Código Técnico de la Edificación, CTE. (Publicado en: «BOE» núm. 74, de 28 de Marzo de 2006, pp. 11816–11831). Madrid, Spanish Ministry of Housing. 2006. Available online: http://www.codigotecnico.org/images/stories/pdf/realDecreto/RD3142006.pdf (accessed on 16 April 2019).
  69. Bienvenido-Huertas, D.; Fernandez Quinones, J.A.; Moyano, J.; Rodriguez-Jimenez, C.E. Patents Analysis of Thermal Bridges in Slab Fronts and Their Effect on Energy Demand. Energies 2018, 11, 2222. [Google Scholar] [CrossRef] [Green Version]
  70. AnTherm—Analysis of Thermal Behaviour of Building Constructions with Heat and Vapour Bridges. Program for Energy Simulation by Kornicki Dienstleistungen in EDV & IT, Vienna. 2016. Available online: http://www.antherm.at/antherm/EN/ (accessed on 18 September 2018).
  71. Echarri-Iribarren, V.; Sotos-Solano, C.; Espinosa-Fernandez, A.; Prado-Govea, R. The Passivhaus Standard in the Spanish Mediterranean: Evaluation of a House’s Thermal Behaviour of Enclosures and Airtightness. Sustainability 2019, 11, 3732. [Google Scholar] [CrossRef] [Green Version]
  72. Sanchez-Ostiz, A.; Monge-Barrio, A.; Domingo-Irigoyen, S.; Gonzalez-Martinez, P. Design and experimental study of an industrialized sunspace with solar heat storage. Energy Build. 2014, 80, 231–246. [Google Scholar] [CrossRef]
Figure 1. Image of the main façade of the housing block and floor plan.
Applsci 10 02288 g001
Figure 2. Image of the construction of walkable inverted flat roof of a housing block.
Applsci 10 02288 g002
Figure 3. Image of the Museum of the University of Alicante (MUA). The Sempere Hall is below the water-covered roof, on the left.
Applsci 10 02288 g003
Figure 4. Image of the façade of the Sempere Hall from the inner courtyard. The roof of the Sempere Hall is in red. On the right, the floor plan.
Applsci 10 02288 g004
Figure 5. Installation of surface Type K thermocouple sensors on the apartment’s inverted flat roof.
Applsci 10 02288 g005
Figure 6. Installation of the pyranometer and sensors on the water-covered roof of the MUA.
Applsci 10 02288 g006
Figure 7. Model of the loft flat in the Design Builder program.
Applsci 10 02288 g007
Figure 8. Model of the MUA in the Design Builder program and the hall under the water-covered roof.
Applsci 10 02288 g008
Figure 9. Relationship between outside and indoor ambient temperatures, time lag and decrement factor of the different roof types for the flat.
Applsci 10 02288 g009
Figure 10. Relationship between outside and indoor ambient temperatures, time lag and decrement factor of the different roof types for the Sempere Hall at the MUA.
Applsci 10 02288 g010
Figure 11. Loft flat. QR_1. Temperature data obtained by monitoring, 1–7 August 2014.
Applsci 10 02288 g011
Figure 12. Loft flat. QR_2.1_0.15. Longitudinal section. CFD using Design Builder, 1 August 2014 3 p.m.
Applsci 10 02288 g012
Figure 13. MUA Sempere Hall. QM_2.1_0.15. CFD using Design Builder, 1 August 2014 3 p.m.
Applsci 10 02288 g013
Table 1. Construction features of the flat’s/housing block’s roof.
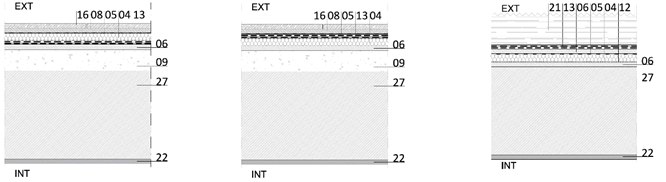
QR_1_ Inverted flat roofs _Total thickness = 0.467 m
Horizontal Construction and Upward FlowThickness (m) Applsci 10 02288 i001
Outside environment
16Paving file0.015
08Mortar bed0.015
05Membrane: Non-woven geotextile Thermosol0.001
04Thermal insulation: XPS [0.032 W/[mK]]0.030
13Water proofing membrane: LBM-30-FV, LBM-40-FP0.006
06Mortar bed0.015
09Aerated concrete0.070
27Reinforced concrete0.300
22Trim and plaster0.015
Inside environment
Table 2. Construction features of the roof of the MUA.
QM_1_ Roofs Flooded with Water _Total thickness = 0.724 m
Horizontal Construction and upward FlowThickness (m) Applsci 10 02288 i002
Outside environment
21Water0.100
13Water proofing membrane: LBM-30-FV, LBM-40-FP0.006
05Membrane: Non-woven geotextile Thermosol0.001
42Reinforced concrete0.100
43Galvanized steel sheet0.002
25Air gaps. No ventilated R=0.280.500
23Plasterboard0.015
Inside environment
Table 3. Location and description of sensors located on the inverted flat roof of the flat.
Applsci 10 02288 i003Nomenclature, QR: Roof (Q), Residential (R)
Interior environment, (INT):
QR,INT. Indoor ambient temperature sensor, (°C). Nº of sensors installed: 1.
Constructive section:
QR,0,1,2,3,4,5,6,7. Surface temperature sensor, (°C). Nº of sensors installed: 8.
Outdoor environment (EXT):
QR,EXT. Exterior ambient temperature sensor, (°C) and relative humidity (%). Number of sensors installed: 1.
QR,SOLAR. Solar radiation sensor, (W/m2). Number of sensors installed: 1.
Table 4. Location and description of sensors located on the water-covered roof of the MUA.
Applsci 10 02288 i004Nomenclature, QM: Roof (Q), Museum (M)
Interior environment, (INT):
QM,INT. Indoor ambient temperature sensor, (°C ). Nº of sensors installed: 1.
Constructive section:
QM,1,2,3. Surface temperature sensor, (°C). Number of sensors installed: 3.
Outdoor environment (EXT):
QM,EXT,MUA. Exterior ambient temperature sensor, (°C) and relative humidity (%). Number of sensors installed: 1.
QM,SOLAR. Solar radiation sensor, (W/m2). Number of sensors installed: 1.
Table 5. Construction section of the apartment’s inverted flat roof and its derivatives.
Roof of Loft Flat. Housing Block
Original RoofProposed Roofs
QR_1QR_2QR_2.1_0.15
Inverted walkable flat roof Walkable conventional flat roofConventional water-covered roof, water sheet 15 cm thick
Applsci 10 02288 i005
Table 6. Construction section of the MUA’s water-covered roof and its derivations.
Exhibition Hall roof. University Museum of Alicante
Original roofProposed roofs
QM_1QM_2QM_2.1_0.15
Water-covered roofWalkable conventional flat roofConventional water-covered roof, water sheet 15 cm thick
Applsci 10 02288 i006
Table 7. Thermal properties of the materials that the roofs are built with thermal conductivity (λ), density (ρ) and specific heat capacity (cp).
Material λ (W/m K) ρ (W/m K3) c p ( J / Kg   K )
04Thermal insulation: XPS [0.032 W/[mK]]0.03237.51450
05, 12Membrane: Non-woven geotextile Thermosol0.051201300
06, 08Mortar bed0.8821001050
09Aerated concrete0.12400896
13Water proofing membrane: LBM-30-FV, LBM-40-FP0.2311001800
16Paving file1.31700800
18Marble3.52700858
21Water0.610004190
22Trim and plaster0.5701150830
23Plasterboard0.250825790
25Air gaps. No ventilated R = 0.28 W/[mK]178511001010
27Reinforced concrete type 1222851000
42Reinforced concrete type 22.324001150
43Galvanized steel sheet507800450
Table 8. Static and dynamic thermal transmittance values.
Loft Flat Roofs. Housing BlockExhibition Hall Roofs. MUA
Static Thermal Transmittance U and Dynamic Thermal Transmittance Yie
SectionsStatic U, W/m2KDynamic Yie, W/m2KSectionsStatic U, W/m2KDynamic Yie, W/m2K
QR_10.5180.058QM_10.4700.040
QR_20.5180.063QM_20.4700.043
QR_2.1_0.150.6290.016QM_2.1_0.150.5580.011
Table 9. Internal and external thermal capacity values κ1, κ2.
Loft Flat Roofs. Housing BlockExhibition Hall Roofs. MUA
Thermal Capacity in Transient State κ1, κ2
SectionsPer outside surface unit, κ2, KJ/m2KPer indoor surface unit, κ1, KJ/m2KSectionsPer outside surface unit, κ2, KJ/m2KPer indoor surface unit, κ1, KJ/m2K
QR_154.46180.004QM_182.05034.226
QR_259.84080.074QM_289.08932.803
QR_2.1_0.15129.00178.983QM_2.1_0.15129.10532.222
Table 10. Effusivity and decrement factor of the materials involved in the roof sections.
MaterialEffusivity, s1/2W/m2°CDecrement Factor %
04Thermal insulation: XPS [0.032W/[mK]]34.64117.82
05,12Membrane: Non-woven geotextile Thermosol88.3181.06
06,08Mortar bed1286.78212.41
08
09Aerated concrete219.08953.80
13Water proofing membrane: LBM-30-FV, LBM-40-FP502.9917.62
16Paving file1486.6079.85
18Marble3074.08512.42
21Water1585.56090.88
22Trim and plaster809.63012.08
23Plasterboard454.14815.18
25Air gaps. No ventilated R=0.285.006.93
27Reinforced concrete (reticular)1603.12276.61
42Reinforced concrete2349.46846.05
43Galvanized steel sheet13,247.6410.32
Table 11. Decrement factor values of the roof sections under study.
Loft Flat Roofs. Housing BlockExhibition Hall Roofs. MUA
Decrement Factor, %
Sections Sections
QR_188.82%QM_192.14%
QR_287.89%QM_289.66%
QR_2.1_0.1597.45%QM_2.1_0.1597.77%
Table 12. Thermal diffusivity and time lag of the materials composing the roof sections under study.
MaterialDiffusivity, m2/s Time   Lag ,   h
04Thermal insulation: XPS [0.032W/[mK]]8.53 × 10−70.75
05,12Membrane: Non-woven geotextile Thermosol3.21 × 10−70.04
06,08Mortar bed4.68 × 10−70.51
09Aerated concrete3.00 × 10−72.95
13Water proofing membrane: LBM-30-FV, LBM-40-FP2.09 × 10−70.30
16Paving file7.64 × 10−70.40
18Marble1.30 × 10−60.51
21Water2.09 × 10−79.15
22Trim and plaster4.95 × 10−70.49
23Plasterboard3.03 × 10−70.63
25Air gaps. No ventilated R = 0.282.48 × 10−56.93
27Reinforced concrete (reticular)1.55 × 10−65.55
42Reinforced concrete9.58 × 10−72.36
43Galvanized steel sheet1.42 × 10−50.32
Table 13. Time lag values.
Loft Flat Roofs. Housing BlockExhibition Hall Roofs. MUA
Time Lag, h
Sections Sections
QR_111.456QM_111.252
QR_211.492QM_211.341
QR_2.1_0.1517.345QM_2.1_0.1516.265
Table 14. Internal and external thermal admittance values.
Loft Flat Roofs. Housing BlockExhibition Hall Roofs. MUA
Thermal Admittance Y11, Y12
SectionsExternal Y 22 , ( W / m 2 K ) Internal Y 11 , ( W / m 2 K ) SectionsExternal Y 22 , ( W / m 2 K ) Internal Y 11 , ( W / m 2 K )
QR_13.9475.766QM_19.4712.282
QR_24.3355.766QM_26.4542.342
QR_2.1_0.159.3925.751QM_2.1_0.159.3922.344
Table 15. Summary of thermal loads, loss or heat gain of the loft flat and the MUA Sempere Hall. Annual energy demand by simulation for the whole 2014 cycle.
Thermal Loads kWh/yearAnnual Energy Demand kWh/m2 year
HeatingCoolingTotal loadsHeatingCoolingTotal
TotalTransmission on roof
QR_12829.54617.97447.41414.923.42436.63660.060
QR_22842.64706.17548.71435.123.70538.14861.853
QR_2.1_0.152548.54228.26776.71287.020.22233.99154.213
QM_114,560.323,741.838,301.87278.242.39475.366117.760
QM_215,256.424,681.739,938.17398.343.44978.726122.175
QM_2.1_0.1512,795.521,785.434,580.96621.438.70865.627104.335

