Article

Effect of Plate Curvature on Heat Source Distribution in Induction Line Heating for Plate Forming

1
School of Naval Architecture and Ocean Engineering, Huazhong University of Sciences and Technology, Wuhan 430074, China
2
Collaborative Innovation Center for Advanced Ship and Deep-Sea Exploration (CISSE), Shanghai 200240, China
3
Hubei Key Laboratory of Naval Architecture and Ocean Engineering Hydrodynamics (HUST), Wuhan 430074, China
4
Shanghai Waigaoqiao Shipbuilding Co., Ltd., Shanghai 200137, China
*
Author to whom correspondence should be addressed.
Appl. Sci. 2020, 10(7), 2304; https://doi.org/10.3390/app10072304
Submission received: 4 February 2020 / Revised: 19 March 2020 / Accepted: 20 March 2020 / Published: 27 March 2020

Abstract

:
Line heating is an essential process in the formation of ship hull plates with a complex curvature. Electromagnetic induction heating is widely used in the line heating process. In electromagnetic induction heating, the shape of the coil and the air gap between the inductor and workpiece could influence the heat source distribution. Moreover, in the line heating process, the change of curvature of the plate will cause a change of the air gap of the inductor. Magnetic thermal coupling calculation is an effective method for simulating induction heating. This paper used the finite element method to calculate the distribution of heat sources in different initial plate curvatures and coil widths. The changes in heat source distribution and its laws were investigated. The results show that when the coil width is less than 100 mm, the effect of plate curvature on heat source distribution and strain distribution is not apparent; when the coil width is greater than 100 mm, the plate curvature has a visible effect on the heat generation distribution. In the case of a curvature increasing from 0 to 1 and a coil width equal to 220 mm, the Joule heat generation in the center of the heating area is reduced by up to 21%.

1. Introduction

The outer plate of a ship’s hull is mostly made up of curved plates. Due to the characteristics according to which the thickness and area of the outer plate with a complex curvature are quite large, the plates with a complex curvature are challenging to form. Line heating is an essential process in the formation of ship hull plates [1]. Line heating heat sources are usually used in the form of an oxyacetylene flame, laser, and electromagnetic induction. As electromagnetic induction heating is easy to control, more environmentally friendly, and economical, electromagnetic induction heating is widely used in the line heating process. We chose induction heating as the heat source during the automatic processing of the curve plate. The finite element method (FEM) numerical calculation is an effective method to study induction heating.
Several papers about line heating have been published. Ueda [2,3] investigated ship hull plates formed by line heating, using the inherent strain method to calculate the deformation of line heating, and proposed the heat line planning principle. Vega [4,5] investigated the multi-heating lines effect and the overlapping effect on inherent strain and established the database of inherent strain under different conditions of a multi-heating line, which is used for deformation predictions. These works were the foundation for the development of automated line heating forming equipment for ship hull plates [6]. In order to get better control of the power and heat input, the induction heat source is gradually replacing the oxyacetylene flame heat source [7]. Zhu [8] used a fully coupled analysis to simulate the processing of induction line heating, but this analysis required a vast number of calculations and amount of computational time. Yun [9] used the magnetic thermal coupled finite element method to simulate the high-frequency induction line heating process, considering the influence of temperature changes on the magnetic field distribution. This method ignored the influence of plate deformation on the heat generation. Lee [10] investigated the deformation behavior of induction line heating, and the fixed air gap was considered. Dong [11,12] investigated the effect of the coil width on the processing efficiency and indicated that the processing efficiency increases along with the coil width. Moreover, Dong proposed a simplified heat source model for induction heating, which is verified when the plate is without curvature. The influence of plate curvature on the simplified heat source model was not considered. Zhang [13] preformed the inductor on a rolled plane and analyzed the deformation, using magnetic thermal coupled FEM. The initial curvature was considered; however, he did not mention the influence of the initial curvature on the heat source. Zhu [14] compared the heat sources in the initial position and the moved position, and indicated that the influence of the temperature distribution on the heat source is very small when the inductor is moving; Zhu also proposed a simplified calculation method. However, his works mainly focus on the simple circular coil. In order to investigate the more complicated induction heating process, Chang [15] gave the calculation strategy and methods to solve the complex induction heating process. However, they did not give a detailed description of the calculation model, and an experimental verification and complete quantitative conclusion were not provided.
Induction heating heats the steel plate by generating an induced eddy current on the steel plate surface, generating Joule heat on the surface of the steel plate. In electromagnetic induction heating, the shape of the coil and the air gap between the inductor and workpiece could influence the heat source distribution. In the actual process of plate forming, while the shape of the workpiece is deforming it is hard to control the air gap precisely. During the whole process, the deformation of the plate affects the heat generation distribution of the inductor. In previous studies, the electromagnetic calculation and simplified calculation of line heating were verified, but the influence of plate curvature on heat source distribution was rarely mentioned.

2. Model and Method

In order to investigate the influence of plate curvature, curved plates were modeled to simulate the deformed plate. We used the FEM to calculate the entire processing of line heating. The authors divided the induction heating process, which is a complex multi-physical problem, into three parts: electromagnetic calculation, thermal calculation, and mechanical calculation. The three calculations were coupled in sequence. The result of the previous calculation is the input of the latter (see Figure 1).
We used electromagnetic FEM to obtain the Joule heat produced by the inductor on the plate with different initial curvatures. We used the commercial software ANSYS 15.0 to perform the electromagnetic calculation, as the ANSYS Parametric Design Language (APDL) can effectively modify the model and perform the batch calculation. We compared the results of the heat distribution with different initial curvatures. The heat distribution obtained was used as a surface heat source to perform the heat transfer calculation of the line heating. The result of the temperature field is the input for the mechanical analysis. Then, the elastic-plastic mechanical analysis was performed to get the plastic strain and displacement. We used the commercial software ABAQUS 6.14 to perform the thermal and mechanical calculations. In the ABAQUS, the subroutine can easily apply surface heat source, and the temperature field can transfer from the thermal calculation to the mechanical calculation.

2.1. Electromagnetic

In the induction heating process, the alternating current in the coil generates an alternating magnetic field. The alternating magnetic field generates an induced electromotive force in the workpiece and then generates an induced eddy current. When the induced eddy current flows in the workpiece, it heats up due to overcoming the internal resistance of the conductor itself, to achieve the purpose of heating the workpiece. We obtained the eddy current distribution by solving the Maxwell equations [16], see Equations (1)–(4):
Δ × H = J + D t
Δ × E = B t
Δ B = 0
Δ D = ρ v
where H is the magnetic field strength (Wb), J is the conduction current density ( A / m 2 ), D t is the displacement current density, t represents time (s), E is the electric field (V/m), B is the magnetic field (T), D is the electric flux density ( C / m 2 ), and ρ v is the electric charge density.
We calculated heat generation using Joule’s Law, Equation (5):
q = | J | 2 γ
where q is the Joule heat generation density ( J / m 3 ), J is the current density ( A / m 2 ), and γ refers to the electric conductivity ( S m ).
Due to the skin effect in the process of induction heating, the induced eddy current and Joule heat generated on the workpiece usually concentrates on the workpiece surface [17], so the heat source model can be simplified as the surface heat source, and the simplified model was verified [12,14]. The skin effect depth can be described in Equation (6):
δ = 503 1 f μ r γ
where δ is the skin effect depth (mm), f is the current frequency (Hz), and μ r is the relative magnetic permeability.
We obtained the surface heat source by calculating the integral of the Joule heat generation in the thickness direction, Equation (7):
q s u r f = z q d z
where q s u r f is the surface heat source distribution ( J / m 2 ).
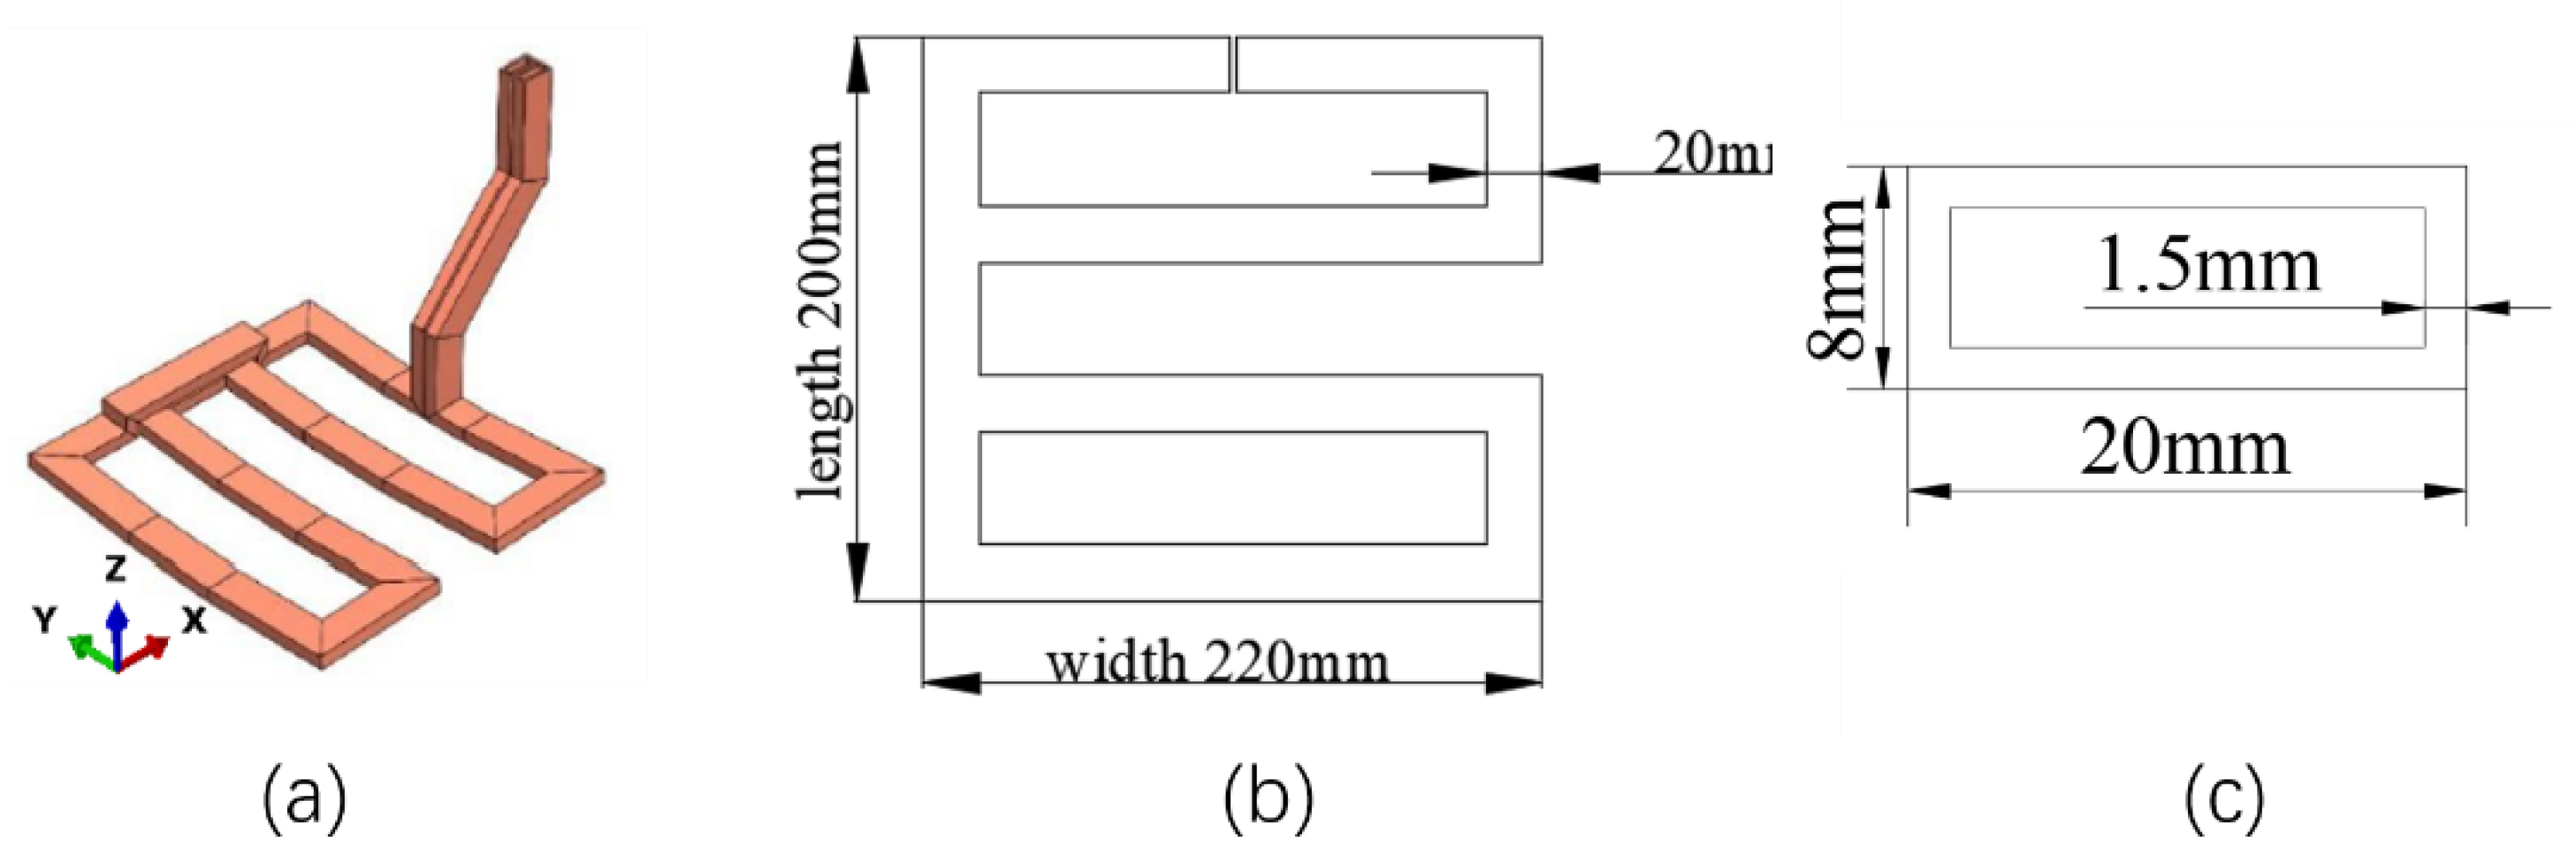
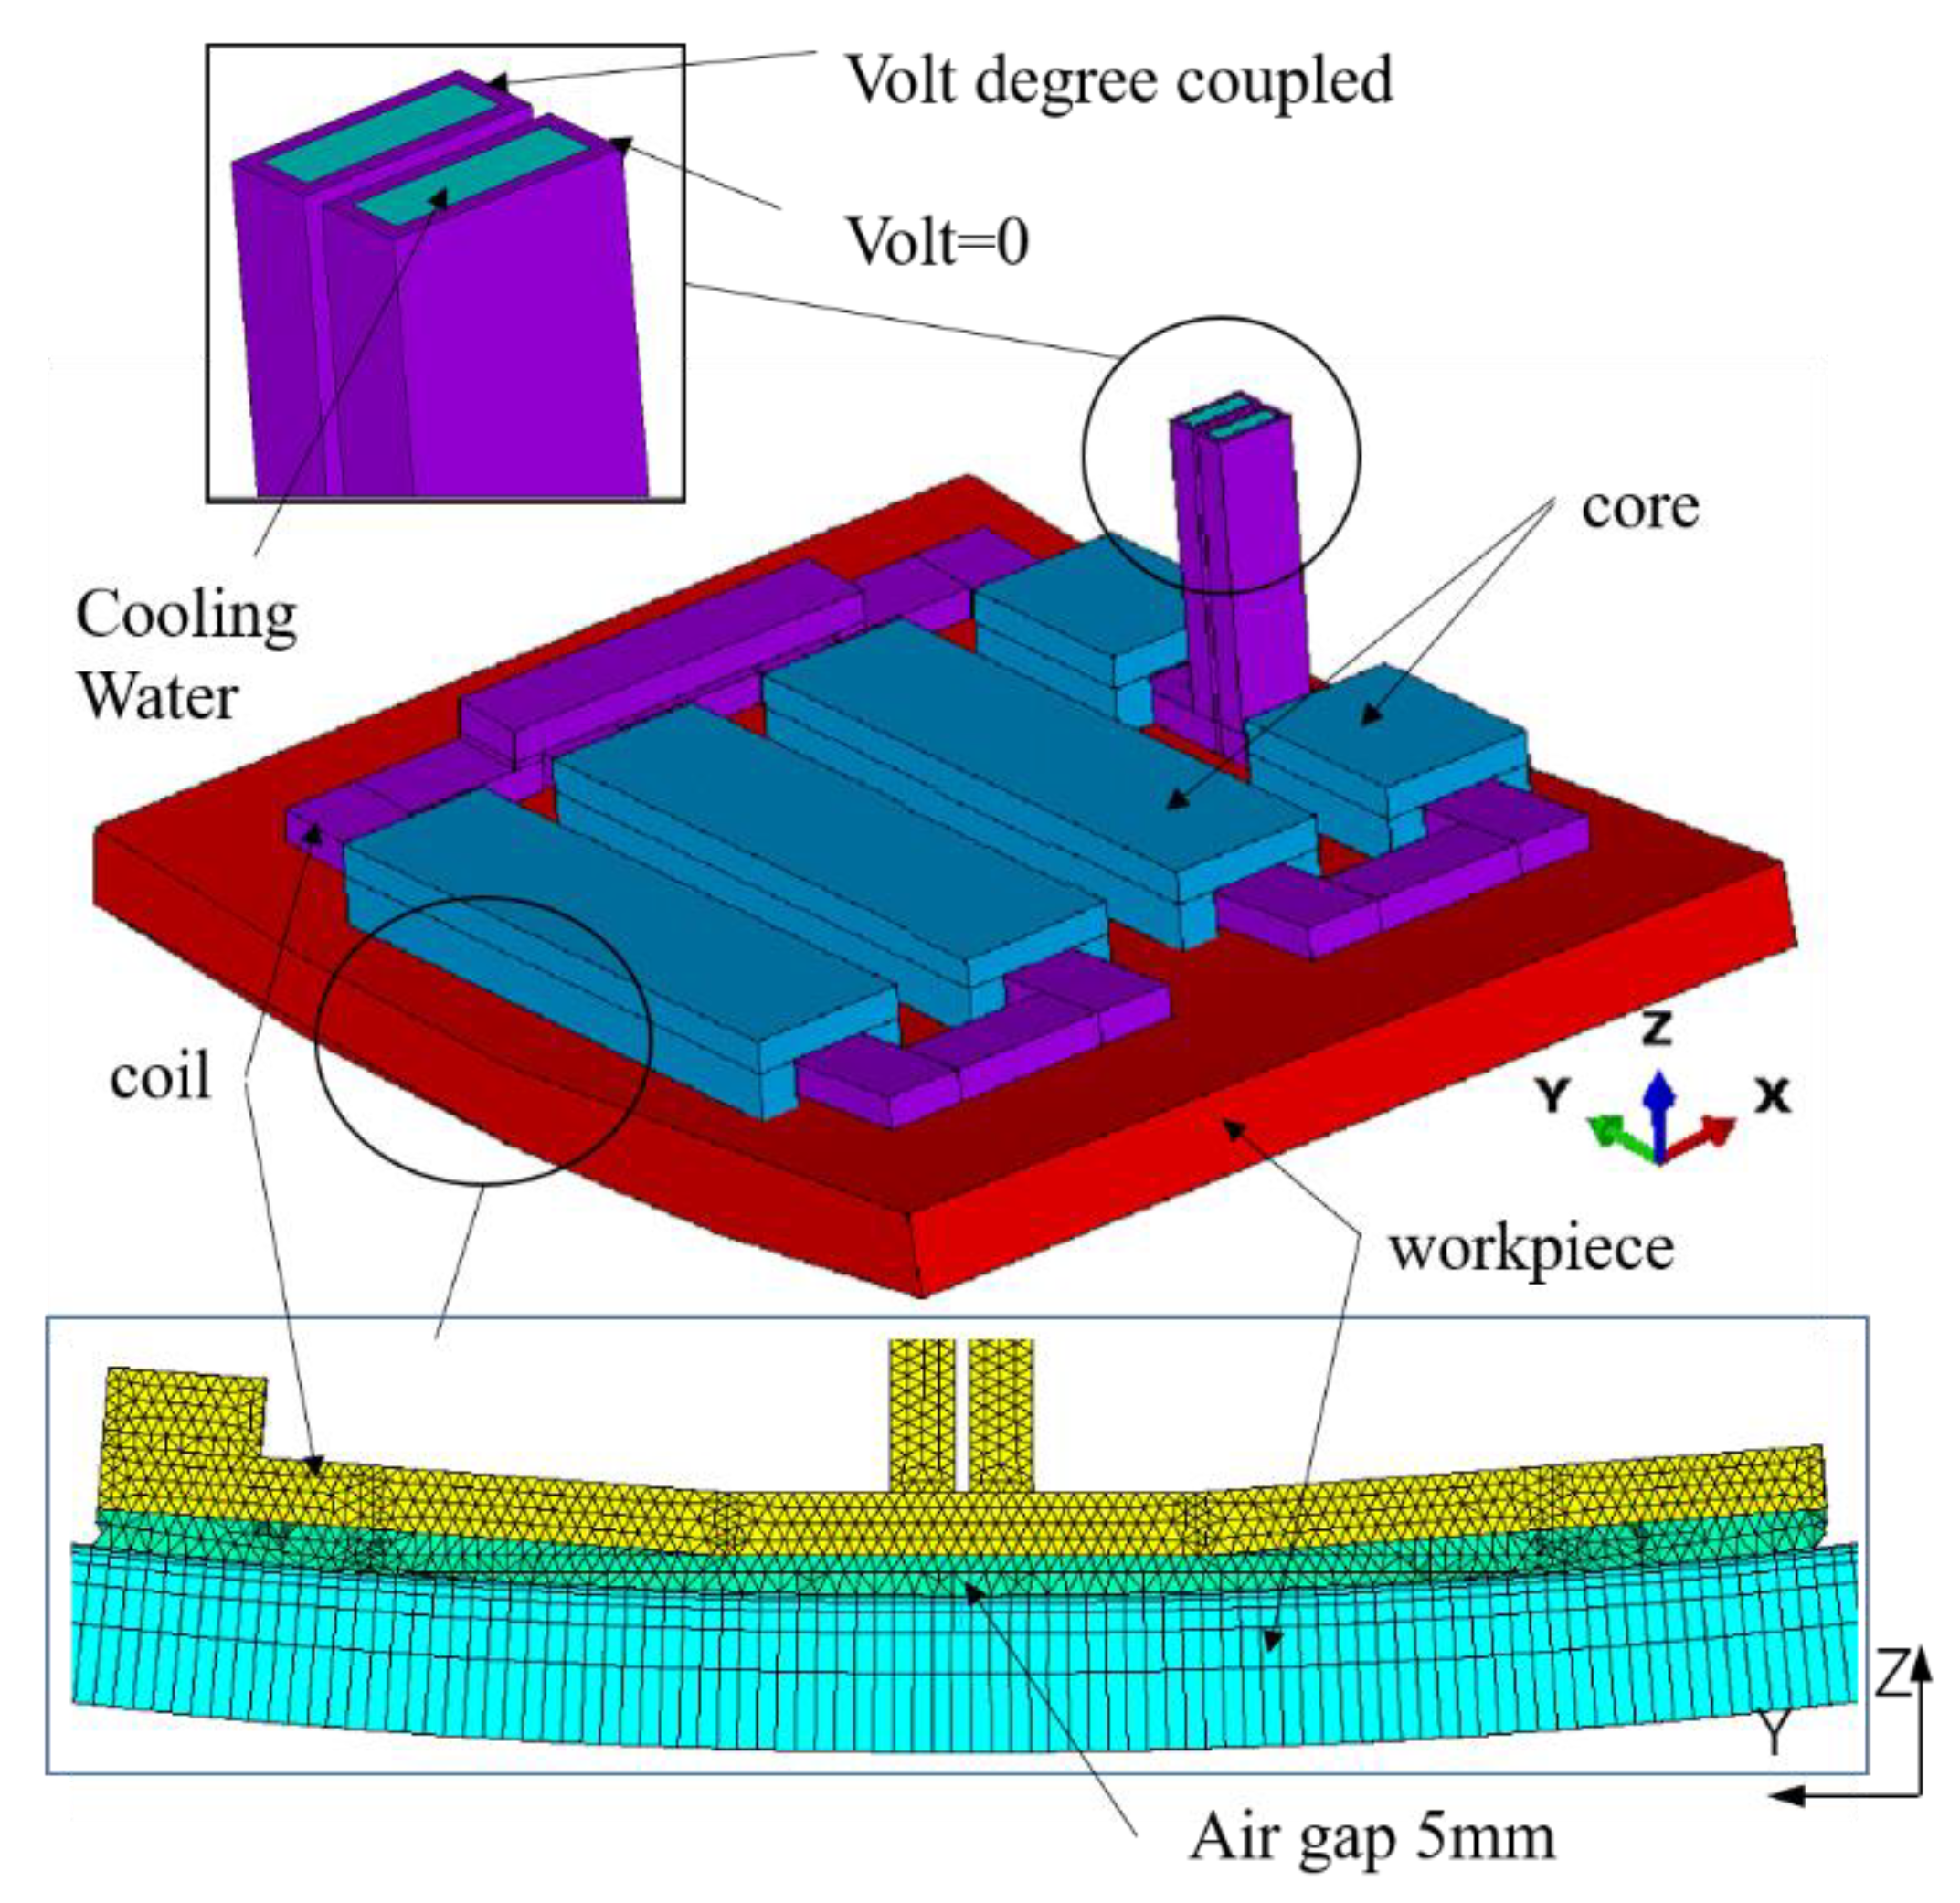
We used the commercial software ANSYS 15.0 [18] to perform the electromagnetic calculation. Figure 2 shows the main dimensions of the inductor coil and the cross section. Figure 2a shows the shape of the coil, of which the width is 220 mm, and the length is 200 mm. The cross section of the coil is 8 mm × 20 mm rectangle. The workpiece, cooling water, coil, core, and air field were modeled. In this paper, it was considered that the workpiece was made of carbon steel, the coil was made of copper, and the material of the core was ferrite. The material properties refer to Dong’s [11] data. The whole model, loads, and mesh division are shown in Figure 3 (the air field is excluded). The 3-D 20-Node electromagnetic solid element (SOLID236) was used for the whole model. The mesh on the workpiece and cooling water were generated with brick shape elements. Meshes on the other parts were generated with the tetrahedral-shaped elements, and the pyramid-shaped elements were used for transition. The whole model had 1,380,763 elements and 2,142,703 nodes in total. Due to the skin effect in induction heating, fined elements were used in the top surface of the workpiece. The frequency of the inductor was 12.7 kHz.

2.2. Heat Transfer and Mechanical Analysis

In the heat transfer calculation, the heat generation distribution is the input. Solving the temperature field change follows the heat conduction equation for solids, Equation (8):
ρ c T t = x ( λ T x ) + y ( λ T y ) + z ( λ T z ) + q s u r f
where ρ is the density ( kg / m 3 ), c is the specific heat ( J / ( kg ° C ) ), T represents the temperature ( ° C ), and λ represents the thermal conductivity ( W / ( m ° C ) ).
The convection boundary condition can be described in Equation (9):
λ T n = h ( T T e n v )
where h refers to the convective heat transfer coefficient ( W / ( m 2 ° C ) ), n is the external normal direction of the steel plate surface, and T e n v refers to the ambient temperature ( ° C ).
In the mechanical analysis, the basic equations are Equations (10) and (11):
σ i j , j + F b i = 0
where σ i j refers to the stress tensor and F b i refers to the body force.
The stress–strain relationship can be expressed as:
{ d σ } = [ D ] { d ϵ } { C } d T
where { d σ } refers to the stress increment, [ D ] is the elastoplastic matrix, { d ϵ } is the strain increment, { C } is the thermal stiffness matrix, and d T is the temperature increment.
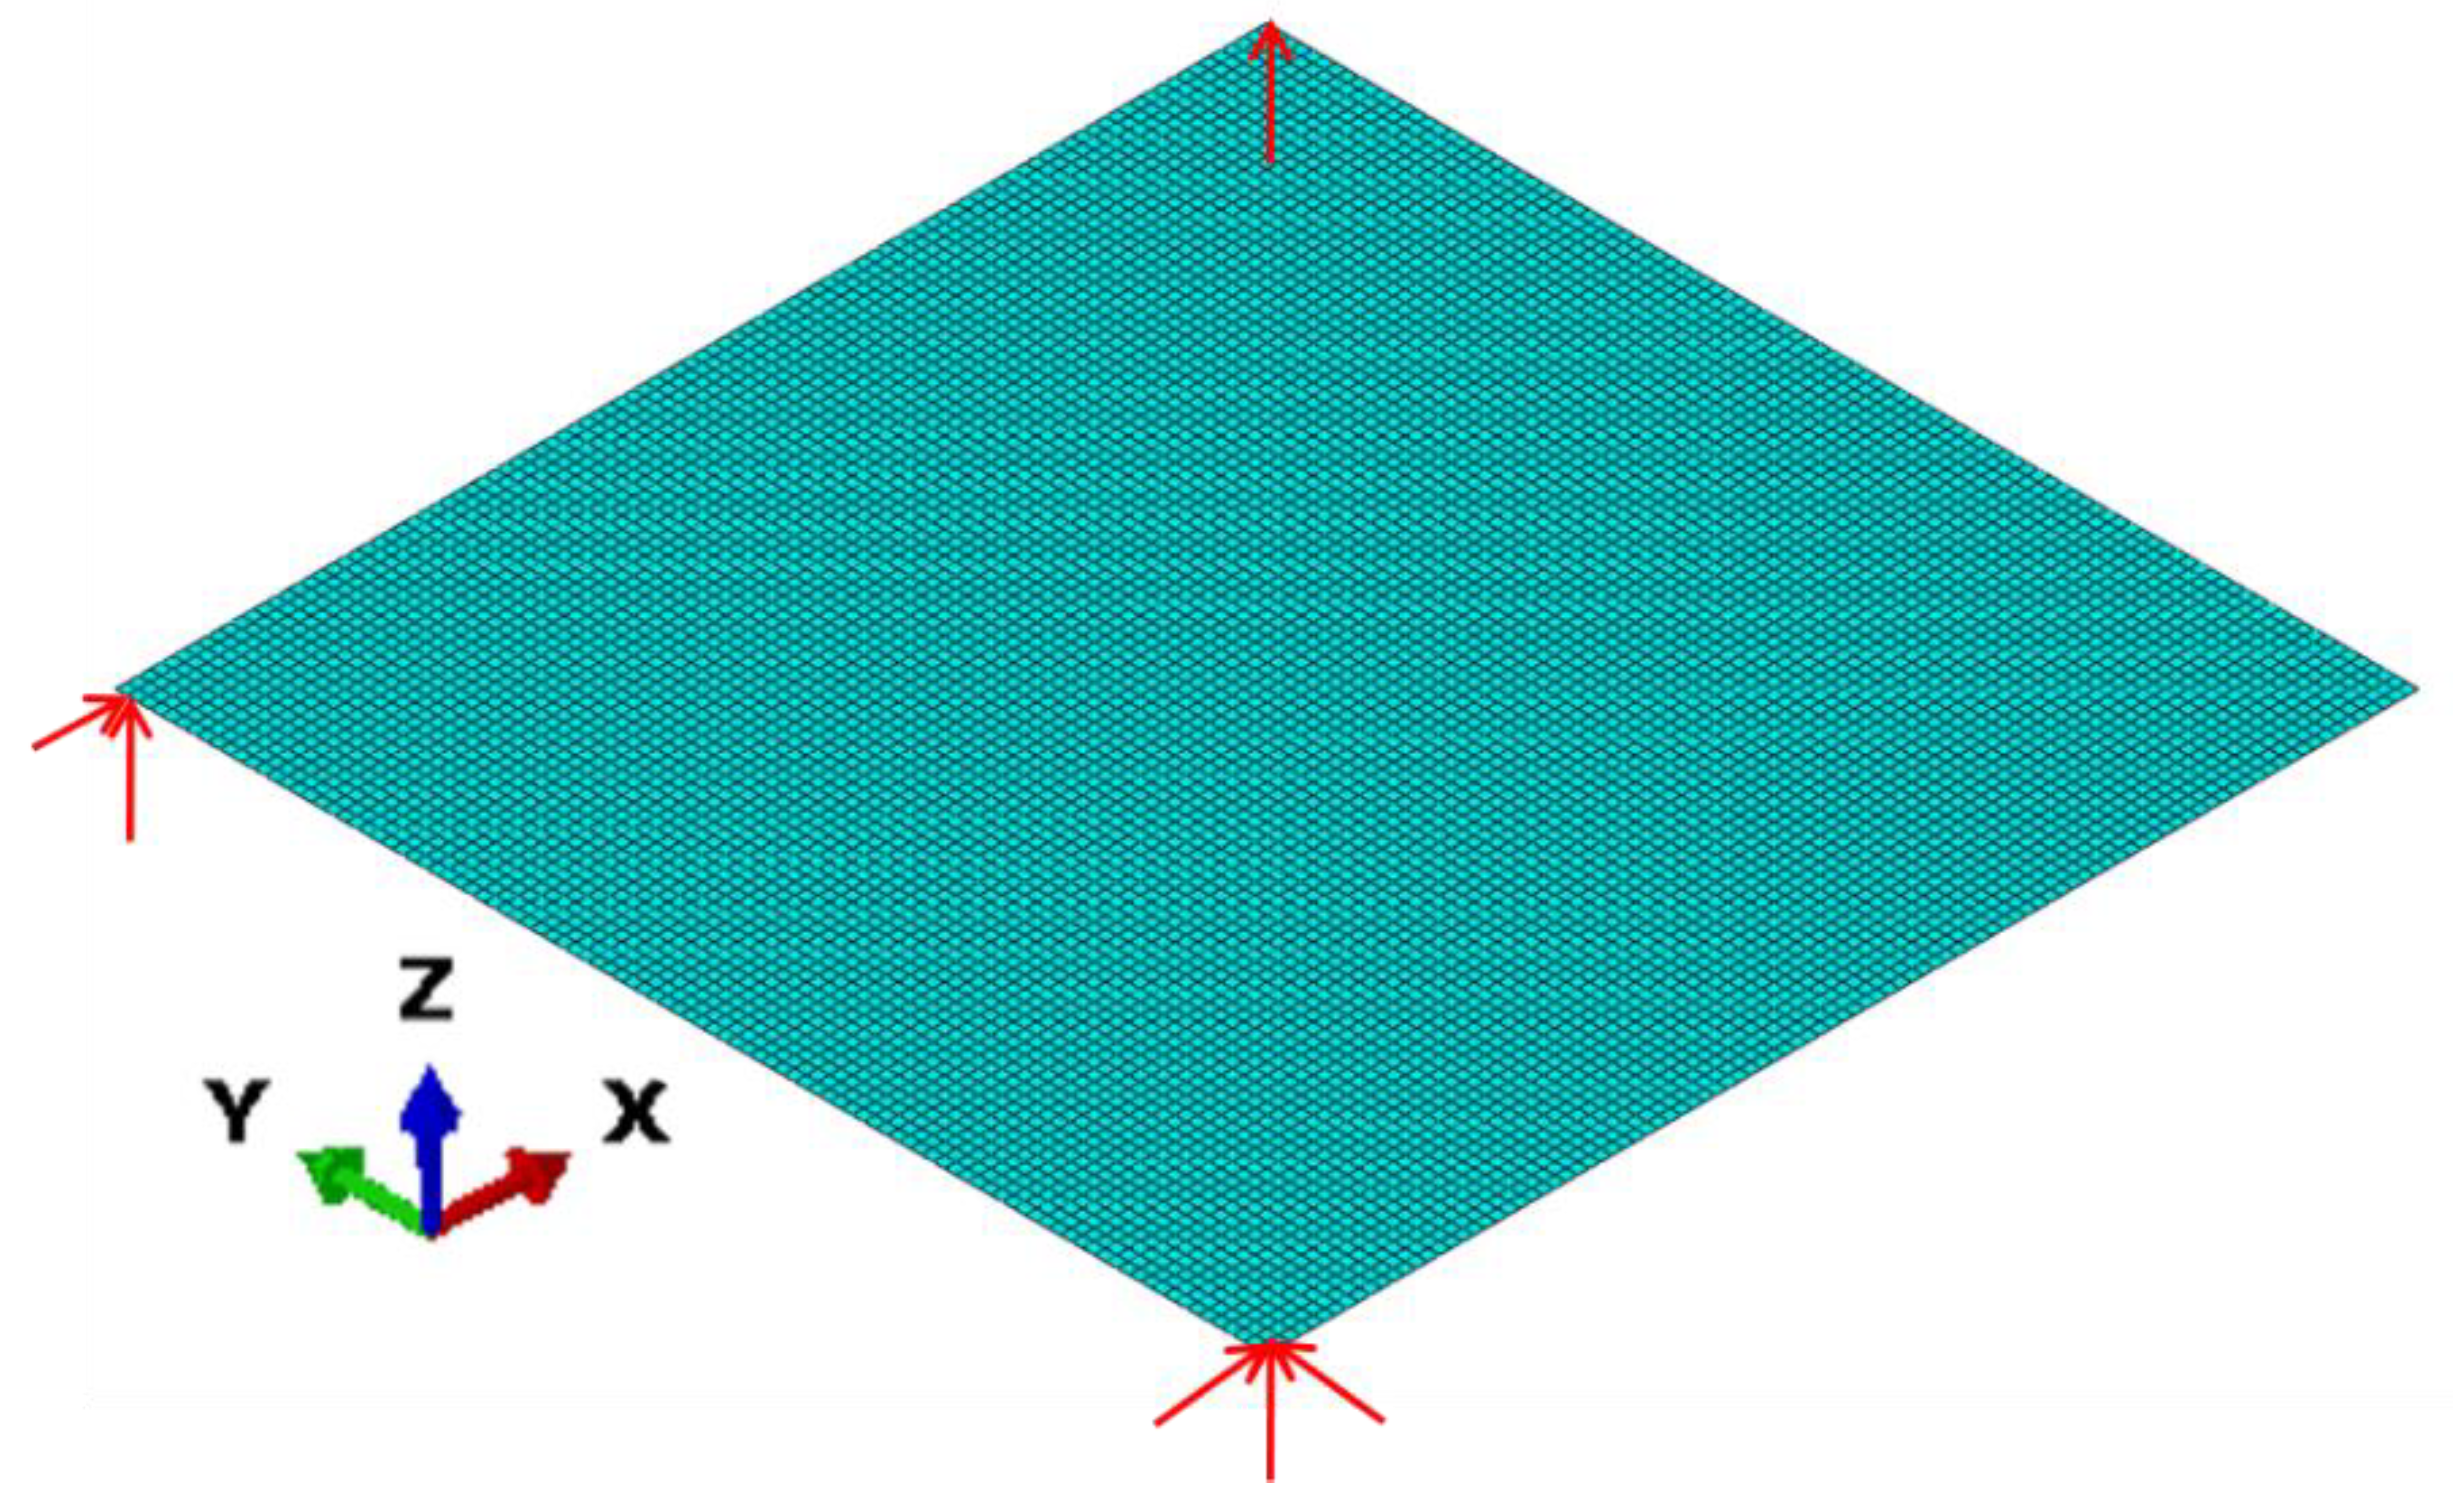
With regards to setting the boundary conditions of simple support on three corners, see Figure 4. The deformation and strain distribution of the plate can be obtained by solving the equations. Furthermore, the plastic strain can be decomposed into two parts—in-plane strain and out-of-plane strain, according to Equations (12) and (13):
ε i n _ p l a n e = 1 t p l a t e z ε d z
ε o u t _ o f _ p l a n e = ε ε i n _ p l a n e
where t p l a t e refers to the plate thickness, ε i n _ p l a n e refers to the in-plane strain, and ε o u t _ o f _ p l a n e refers to the out-of-plane strain.
We performed the heat transfer calculation and mechanical analysis using commercial software ABAQUS/standard 6.14. Only a 1 m × 1 m square plate was modeled in this calculation (see Figure 4). The mesh of the plate was a 10 mm × 10 mm rectangular shape element using the 4-node heat transfer shell element (DS4 element) in the heat transfer calculation and the 4-node stress/displacement shell element with reduced integration (S4R element) in the mechanical analysis, with five integration points in thickness. There were 10,000 elements and 10,201 nodes in total. In the heat transfer calculation, the heating generation was applied as a surface heat flux density by defining a Fortran subroutine (DFLUX), in which the distribution of the heat source along the surface is defined. The boundary condition of natural convection heat dissipation was set on the surface of the plate, and the convective heat transfer coefficient was 15 W / ( m 2 ° C ) . In the mechanical analysis, we read the temperature distribution result obtained in the heat transfer calculation. The material of the plate was carbon steel, and the material properties refer to Dong’s [11] data and are shown in Table 1. The hardening criteria for the material used a linear hardening model; a bilinear curve represents the strain–stress properties.

3. Experimental Test

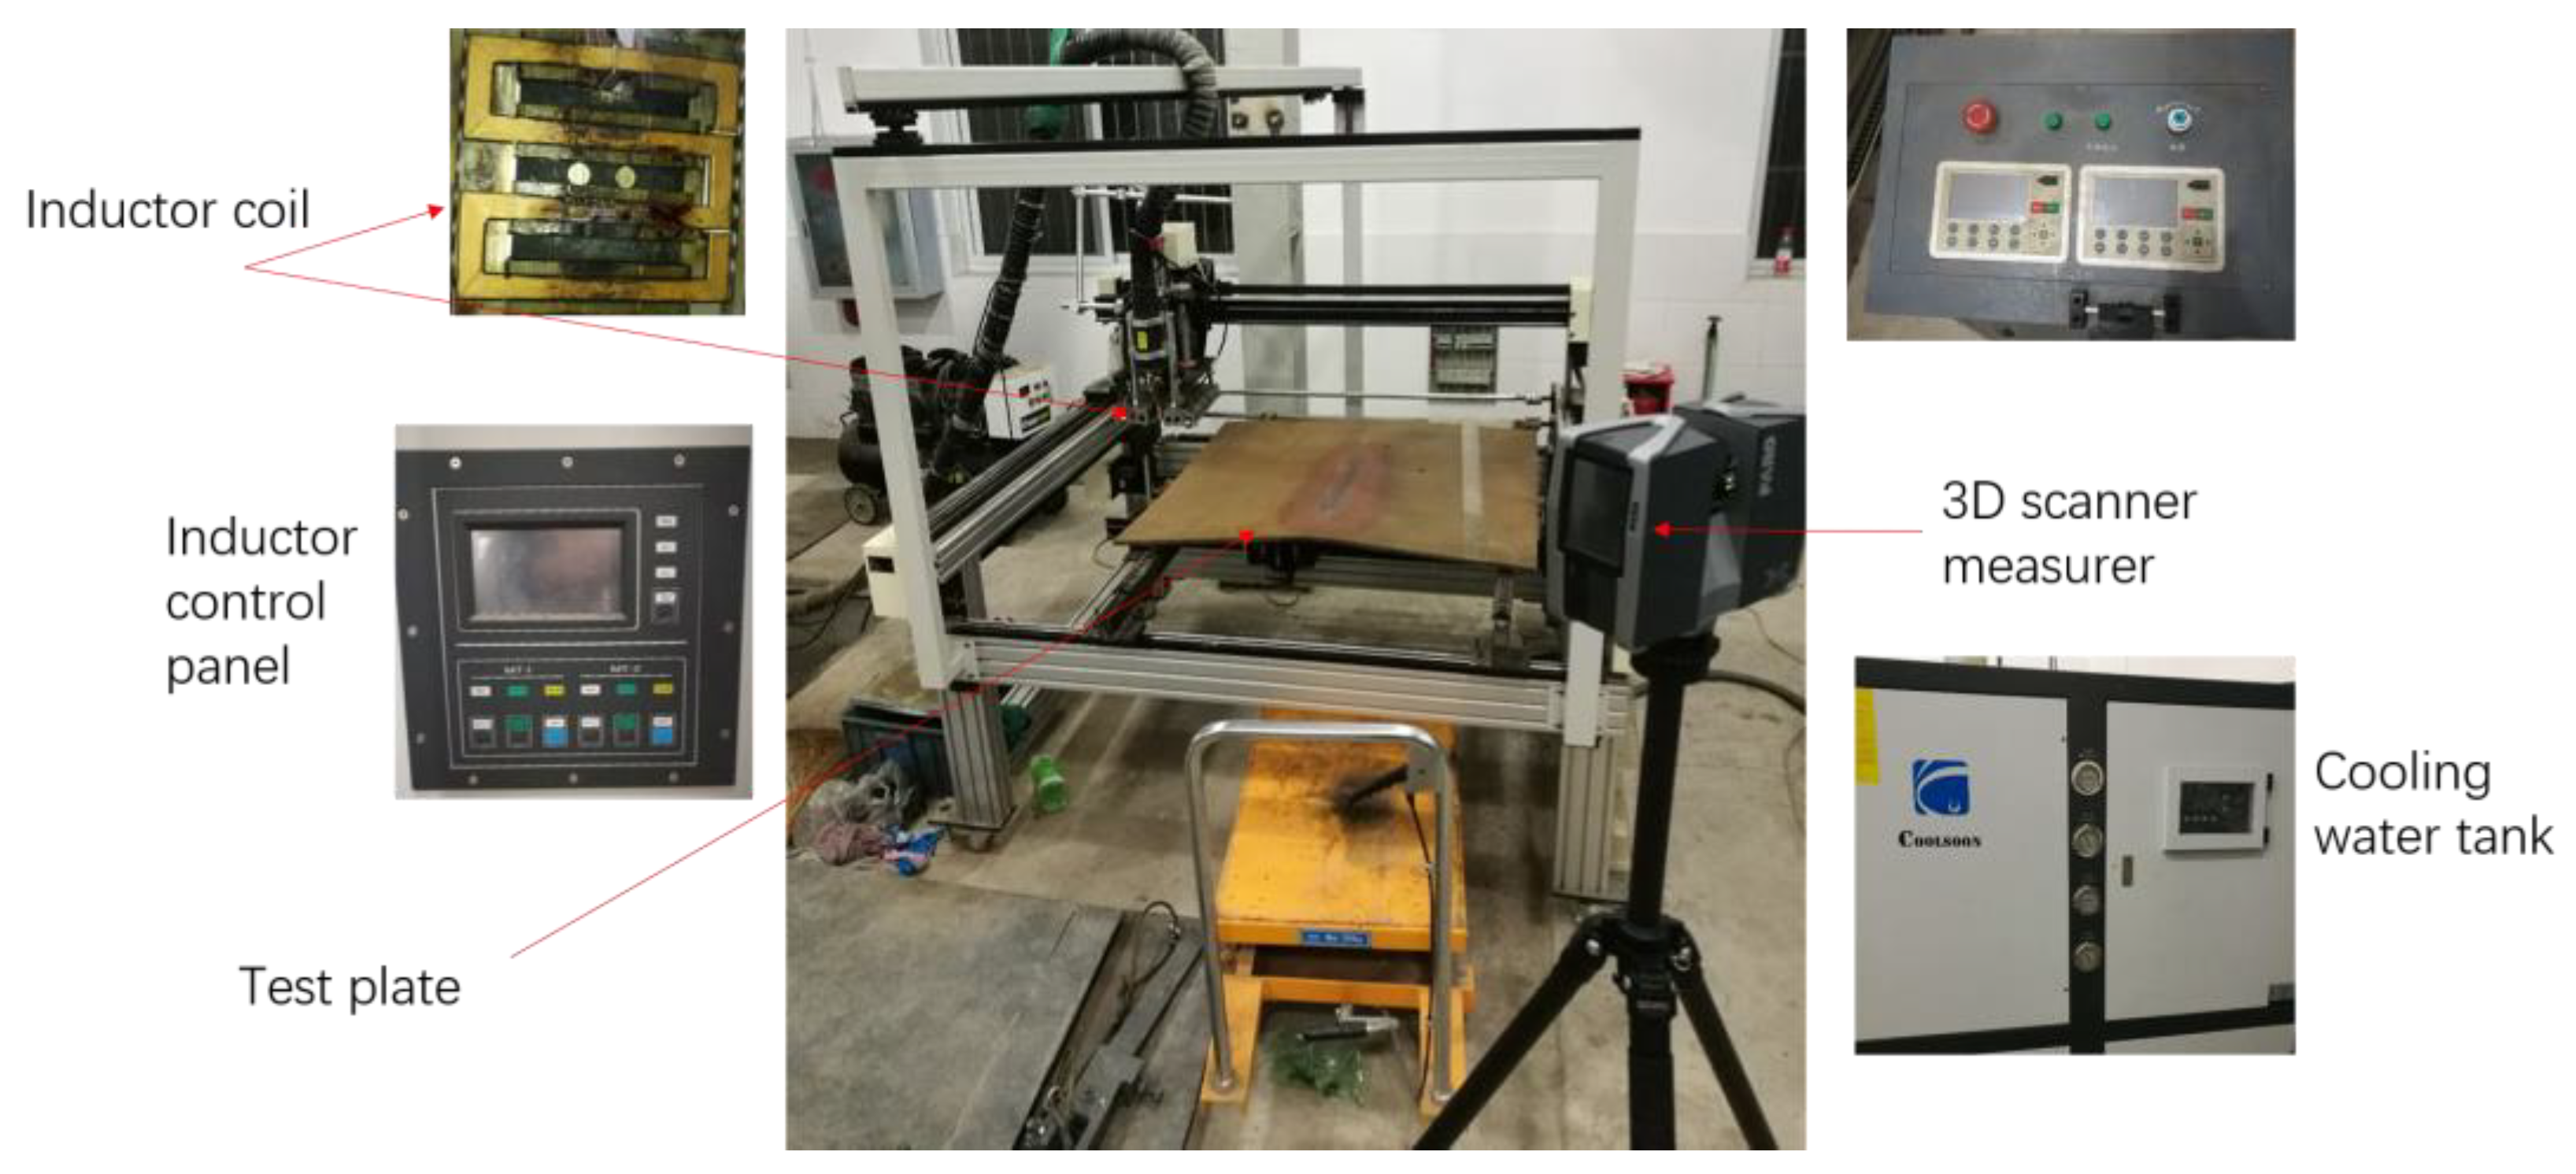
To verify the accuracy of the finite element method, an induction heating test was designed. Figure 5 shows the experimental platform, electromagnetic inductor, and laser scanner. The coil was installed on a frame with trolley wheels which are in contact with the plate. In order to ensure that the coil adapted to the plate deformation, we used a cardan joint to connect the frame and the experimental platform. The platform controls the position of the coil, and the precision of the platform position is 1 mm. After the host computer has planned the path, the path data are transmitted to the lower computer to control the inductor movement.
The FARO 3D focus scanner was used to measure the shape of the formed plate. The scanner uses phase difference laser ranging technology [19]. Phase difference laser ranging is also called continuous wave (CW) laser ranging. When the laser emits a CW laser, it is modulated by an amplitude modulator and then transmitted to the target to be tested. The echo signal returned from the target enters the receiving system. The distance can be obtained by measuring the phase difference between the transmitted signal and the received signal. The measurement accuracy of the FARO 3D focus scanner is 2 mm.
After the origin points cloud was obtained, the Random Sample Consensus (RANSAC) algorithm was employed to distinguish the plate [20]. The RANSAC is a general parameter estimation approach and can be used efficiently for point cloud detection.
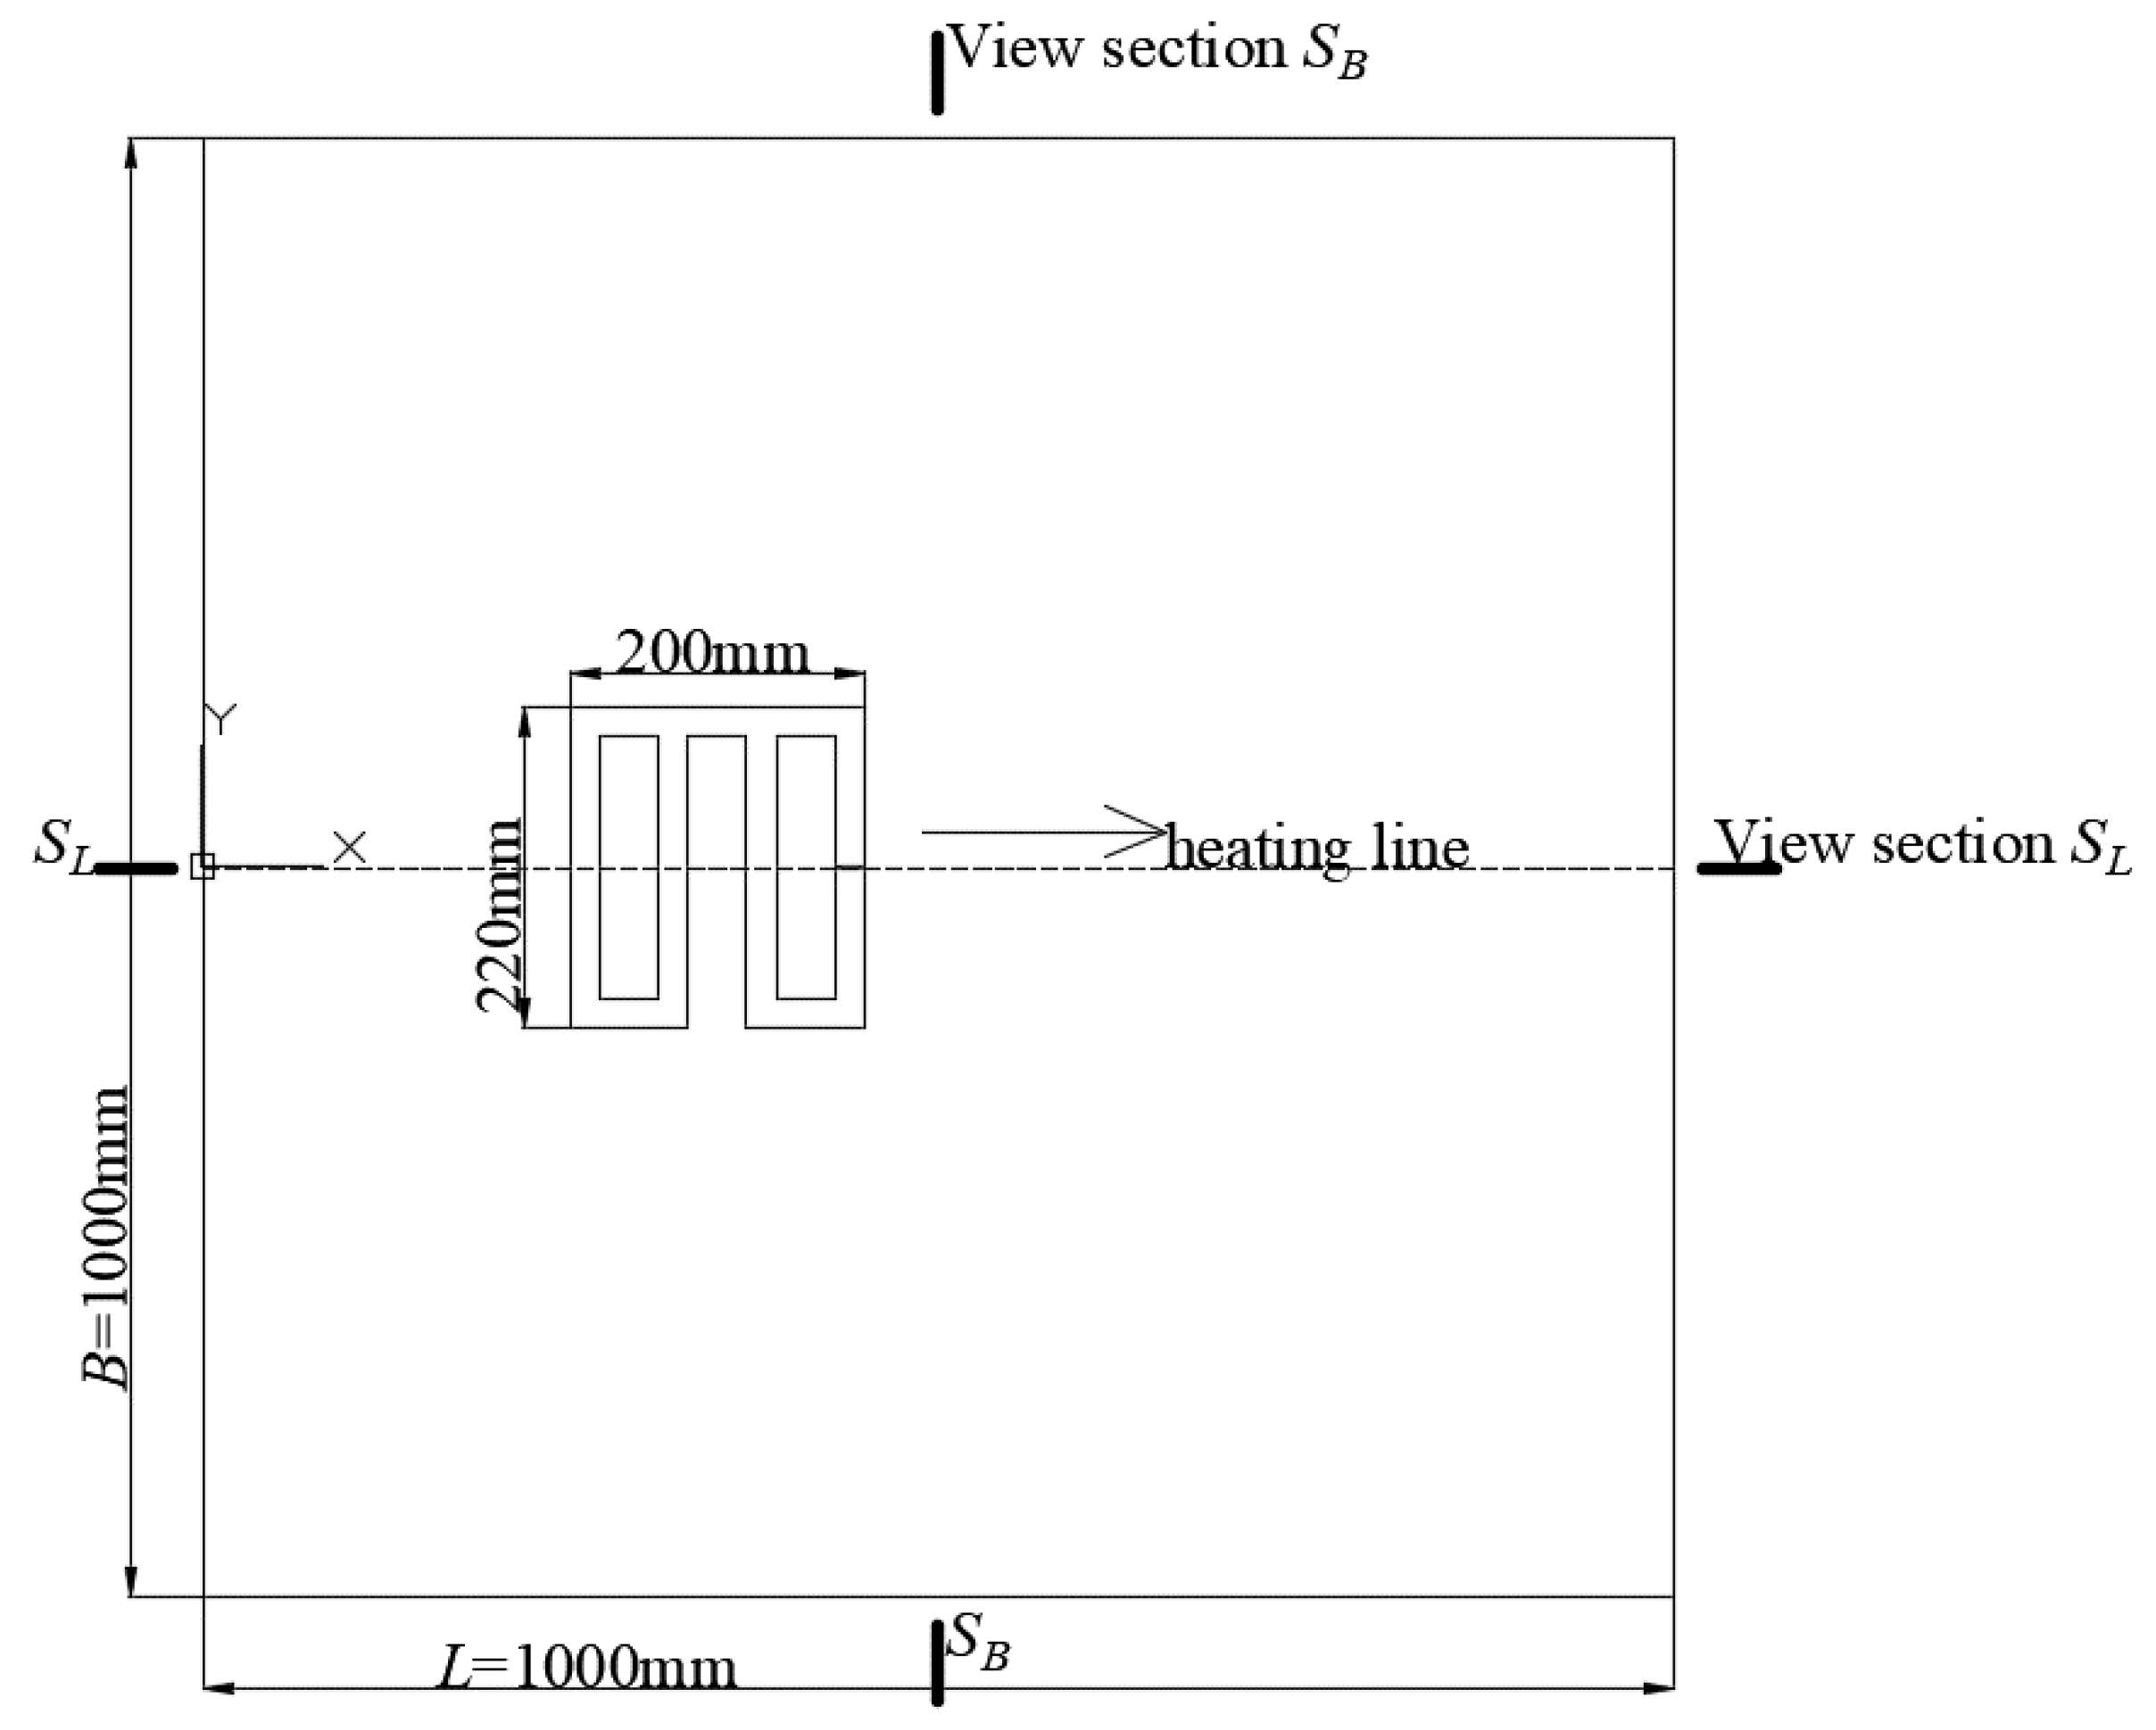
The heat line is along the symmetry axis of the plate from one side to another, and the heat source moves at a velocity of 5 mm/s (see Figure 6). The test plate undergoes three cycles of heating, cooling, and measurement in the same line. The input power of the inductor is 65 kW, and the frequency is 12.7 kHz.
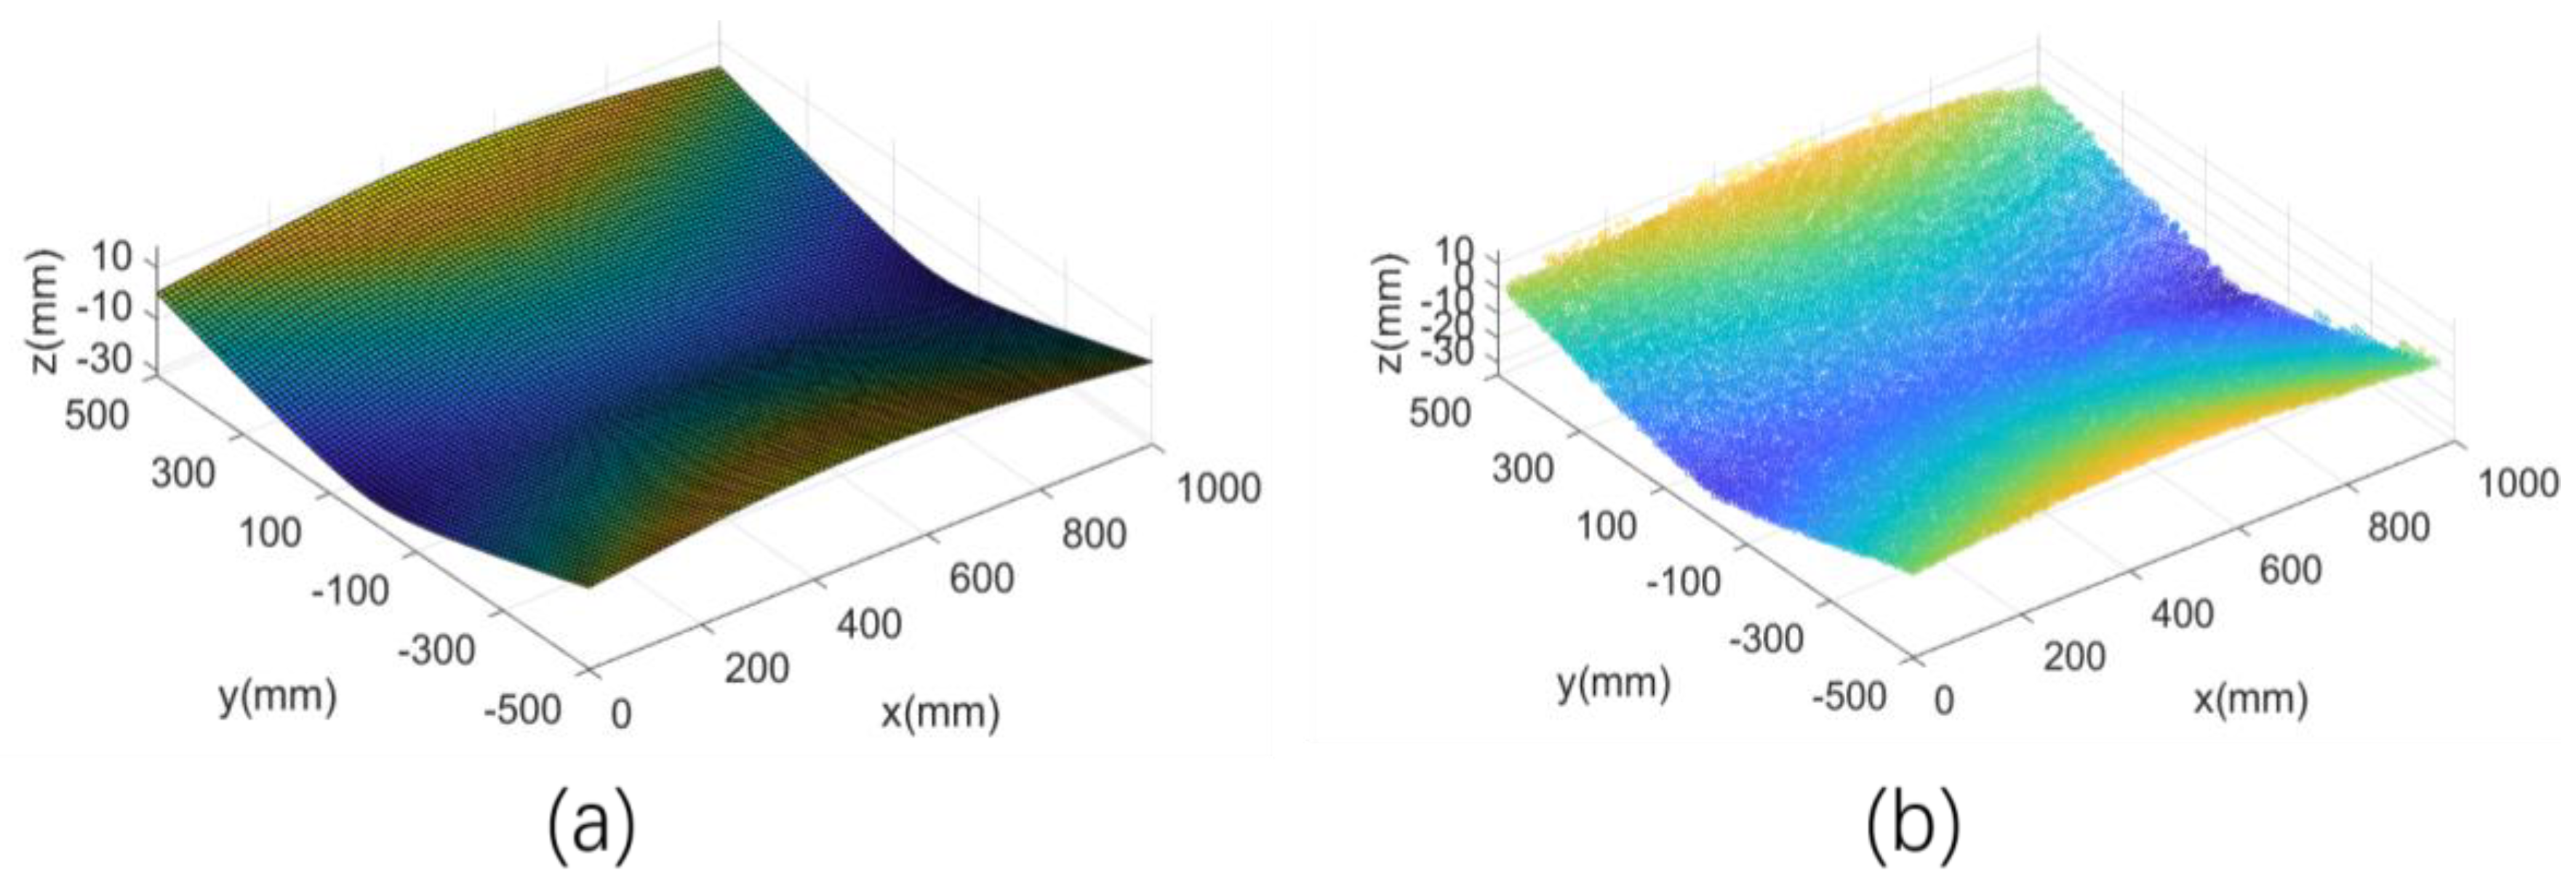
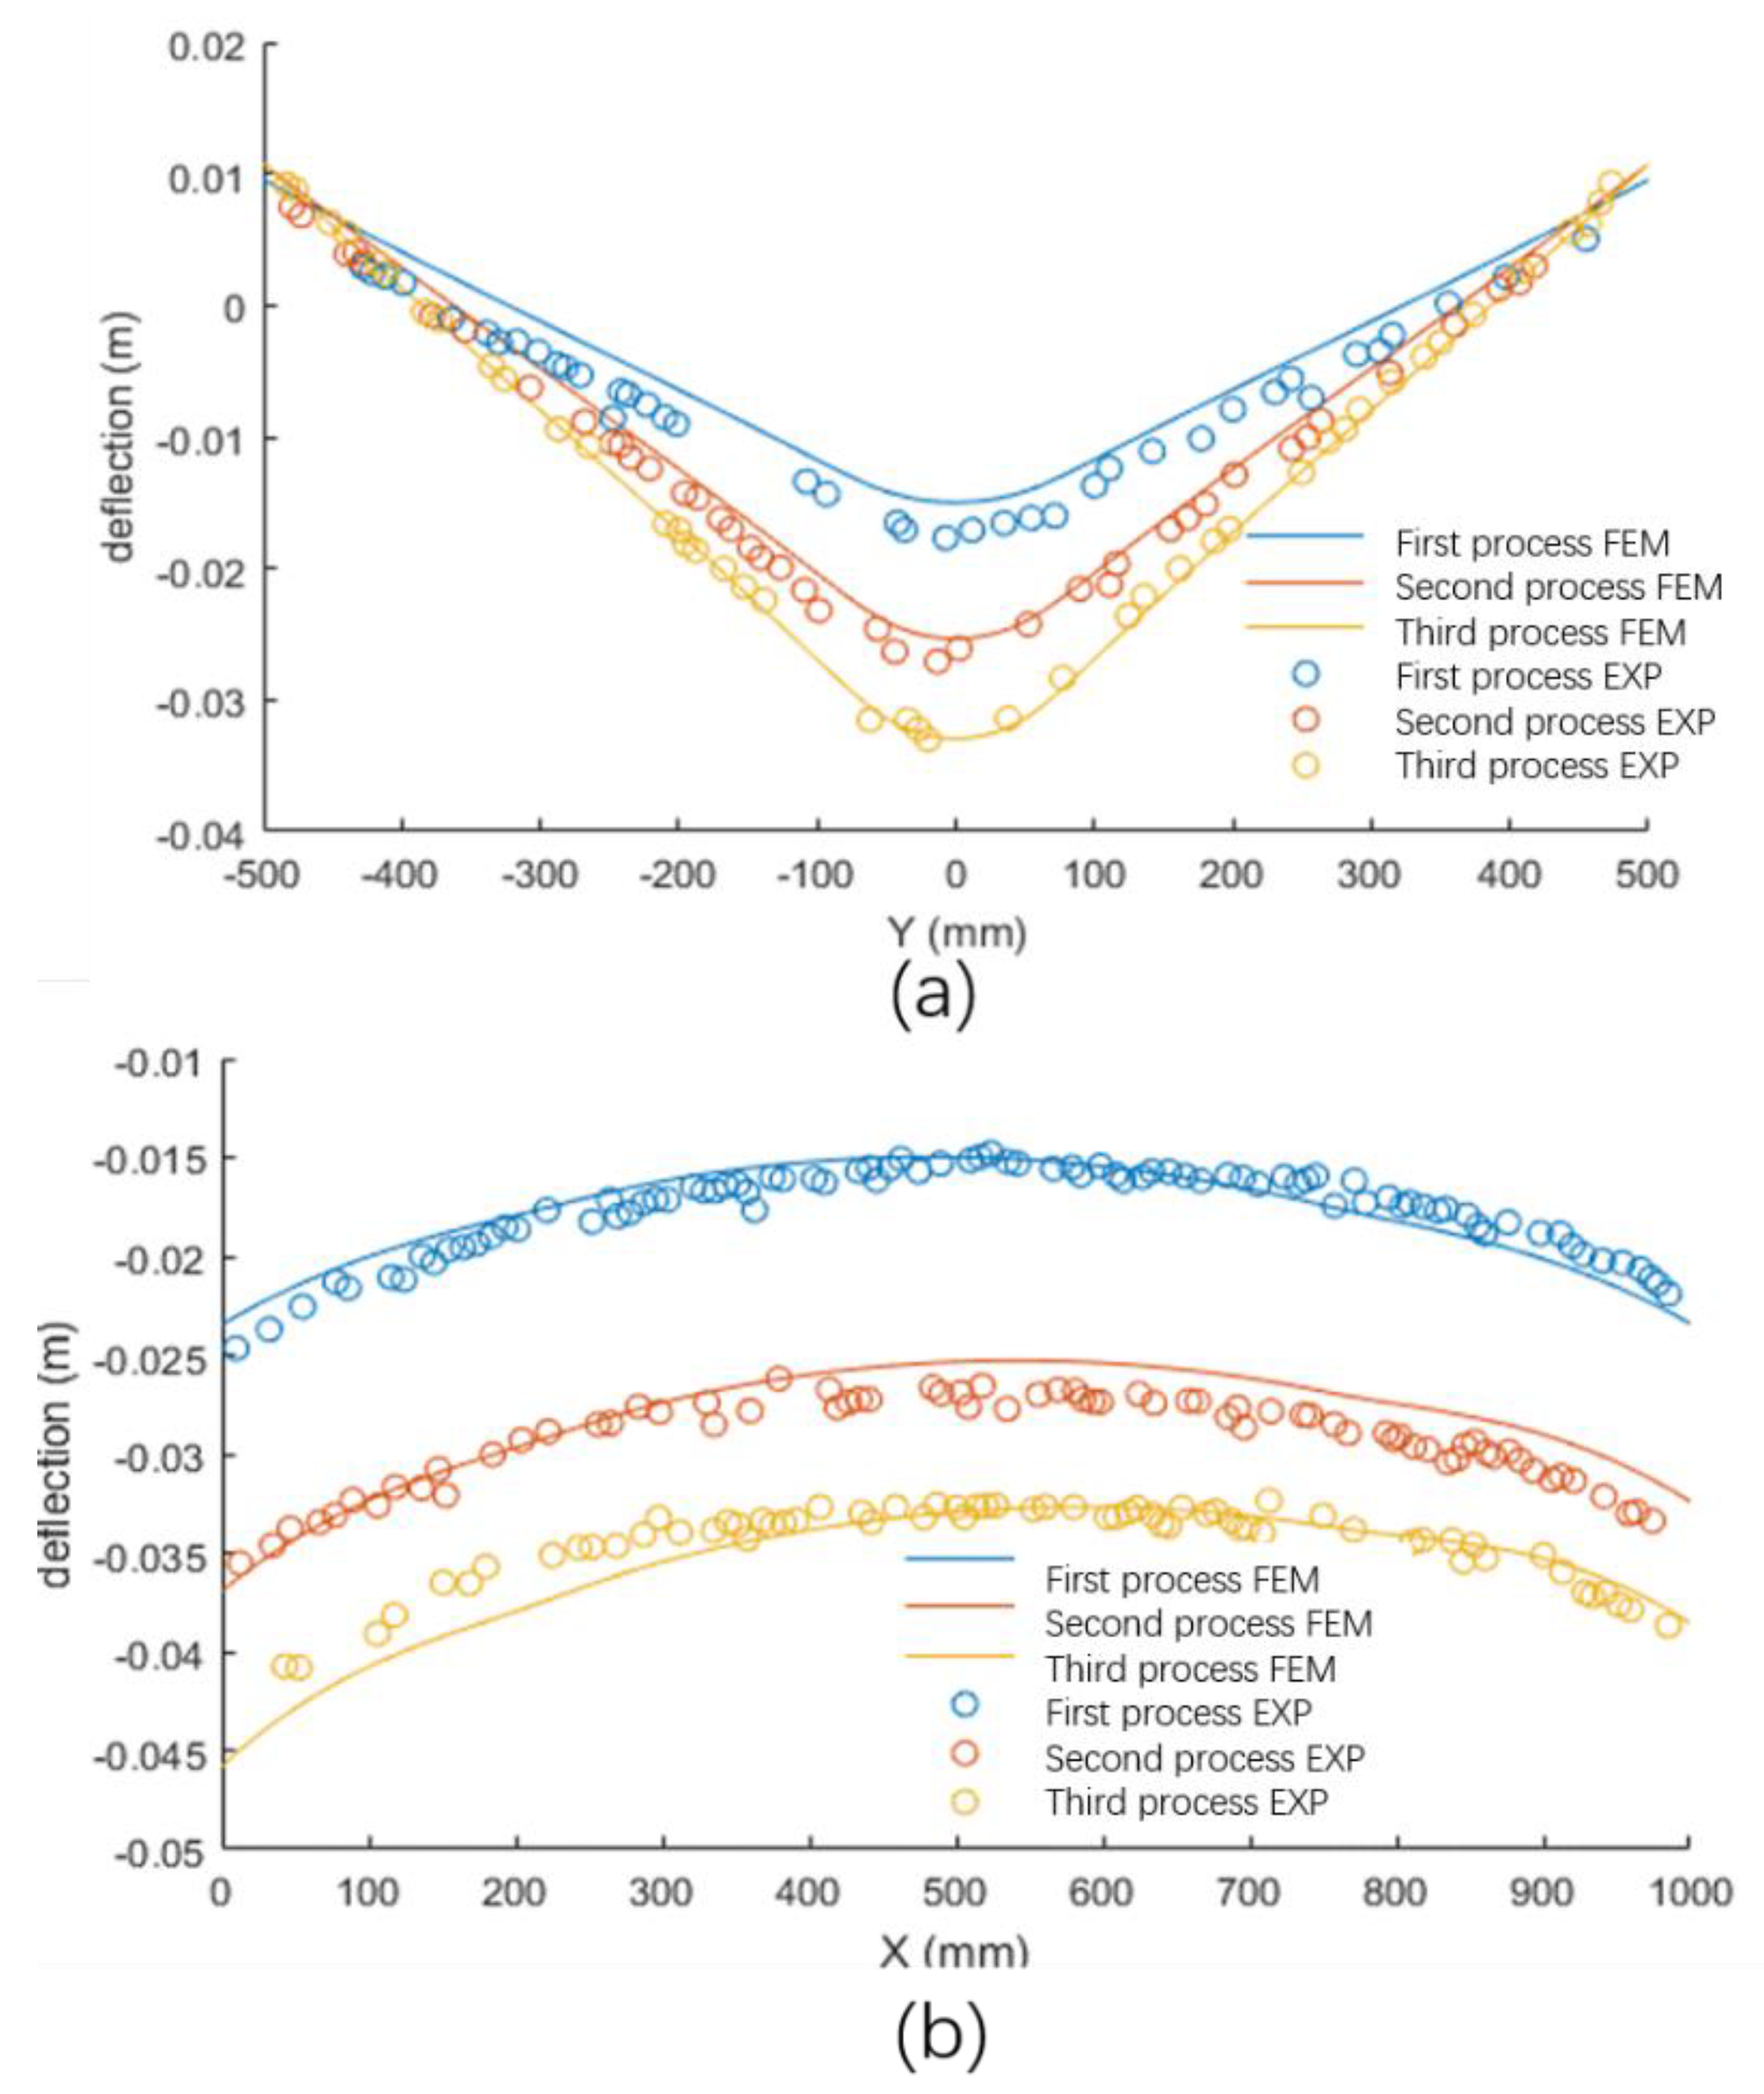
The points cloud of the experimentally measured results is shown in Figure 7. We chose a section in the X direction S L S L and a section in the Y direction S B S B to compare the results of the FEM calculation and experimental measurement. Figure 8 shows the deflection variation in the Z direction after the first, second, and third processes of line heating. The results of the FEM calculations are in good agreement with the experimental results, and the FEM is verified.

4. Results and Analysis

4.1. Effect of Initial Curvature

After the experimental test verified the FEM calculation method, the method was applied to investigate the influence of plate curvature on the heat source distribution. This paper focuses on the outer plate of the ship hull. According to the investigation in the shipyard, the curvatures of the ship hull plate are mostly in the range of 0 m-1 to 1 m-1. The initial curvature K (m-1) in the electromagnetic models was in the range of 0 to 1 and increased by increments of 0.25. The calculation schemes are shown in Table 2. The coil in Figure 2 was used, the power was 65 kW, and the moving velocity was 5 mm/s. The highest temperature was about 600 °C. A square plate, 1 m × 1 m, was modeled in this calculation, and the thickness was set to 20 mm and 16 mm.
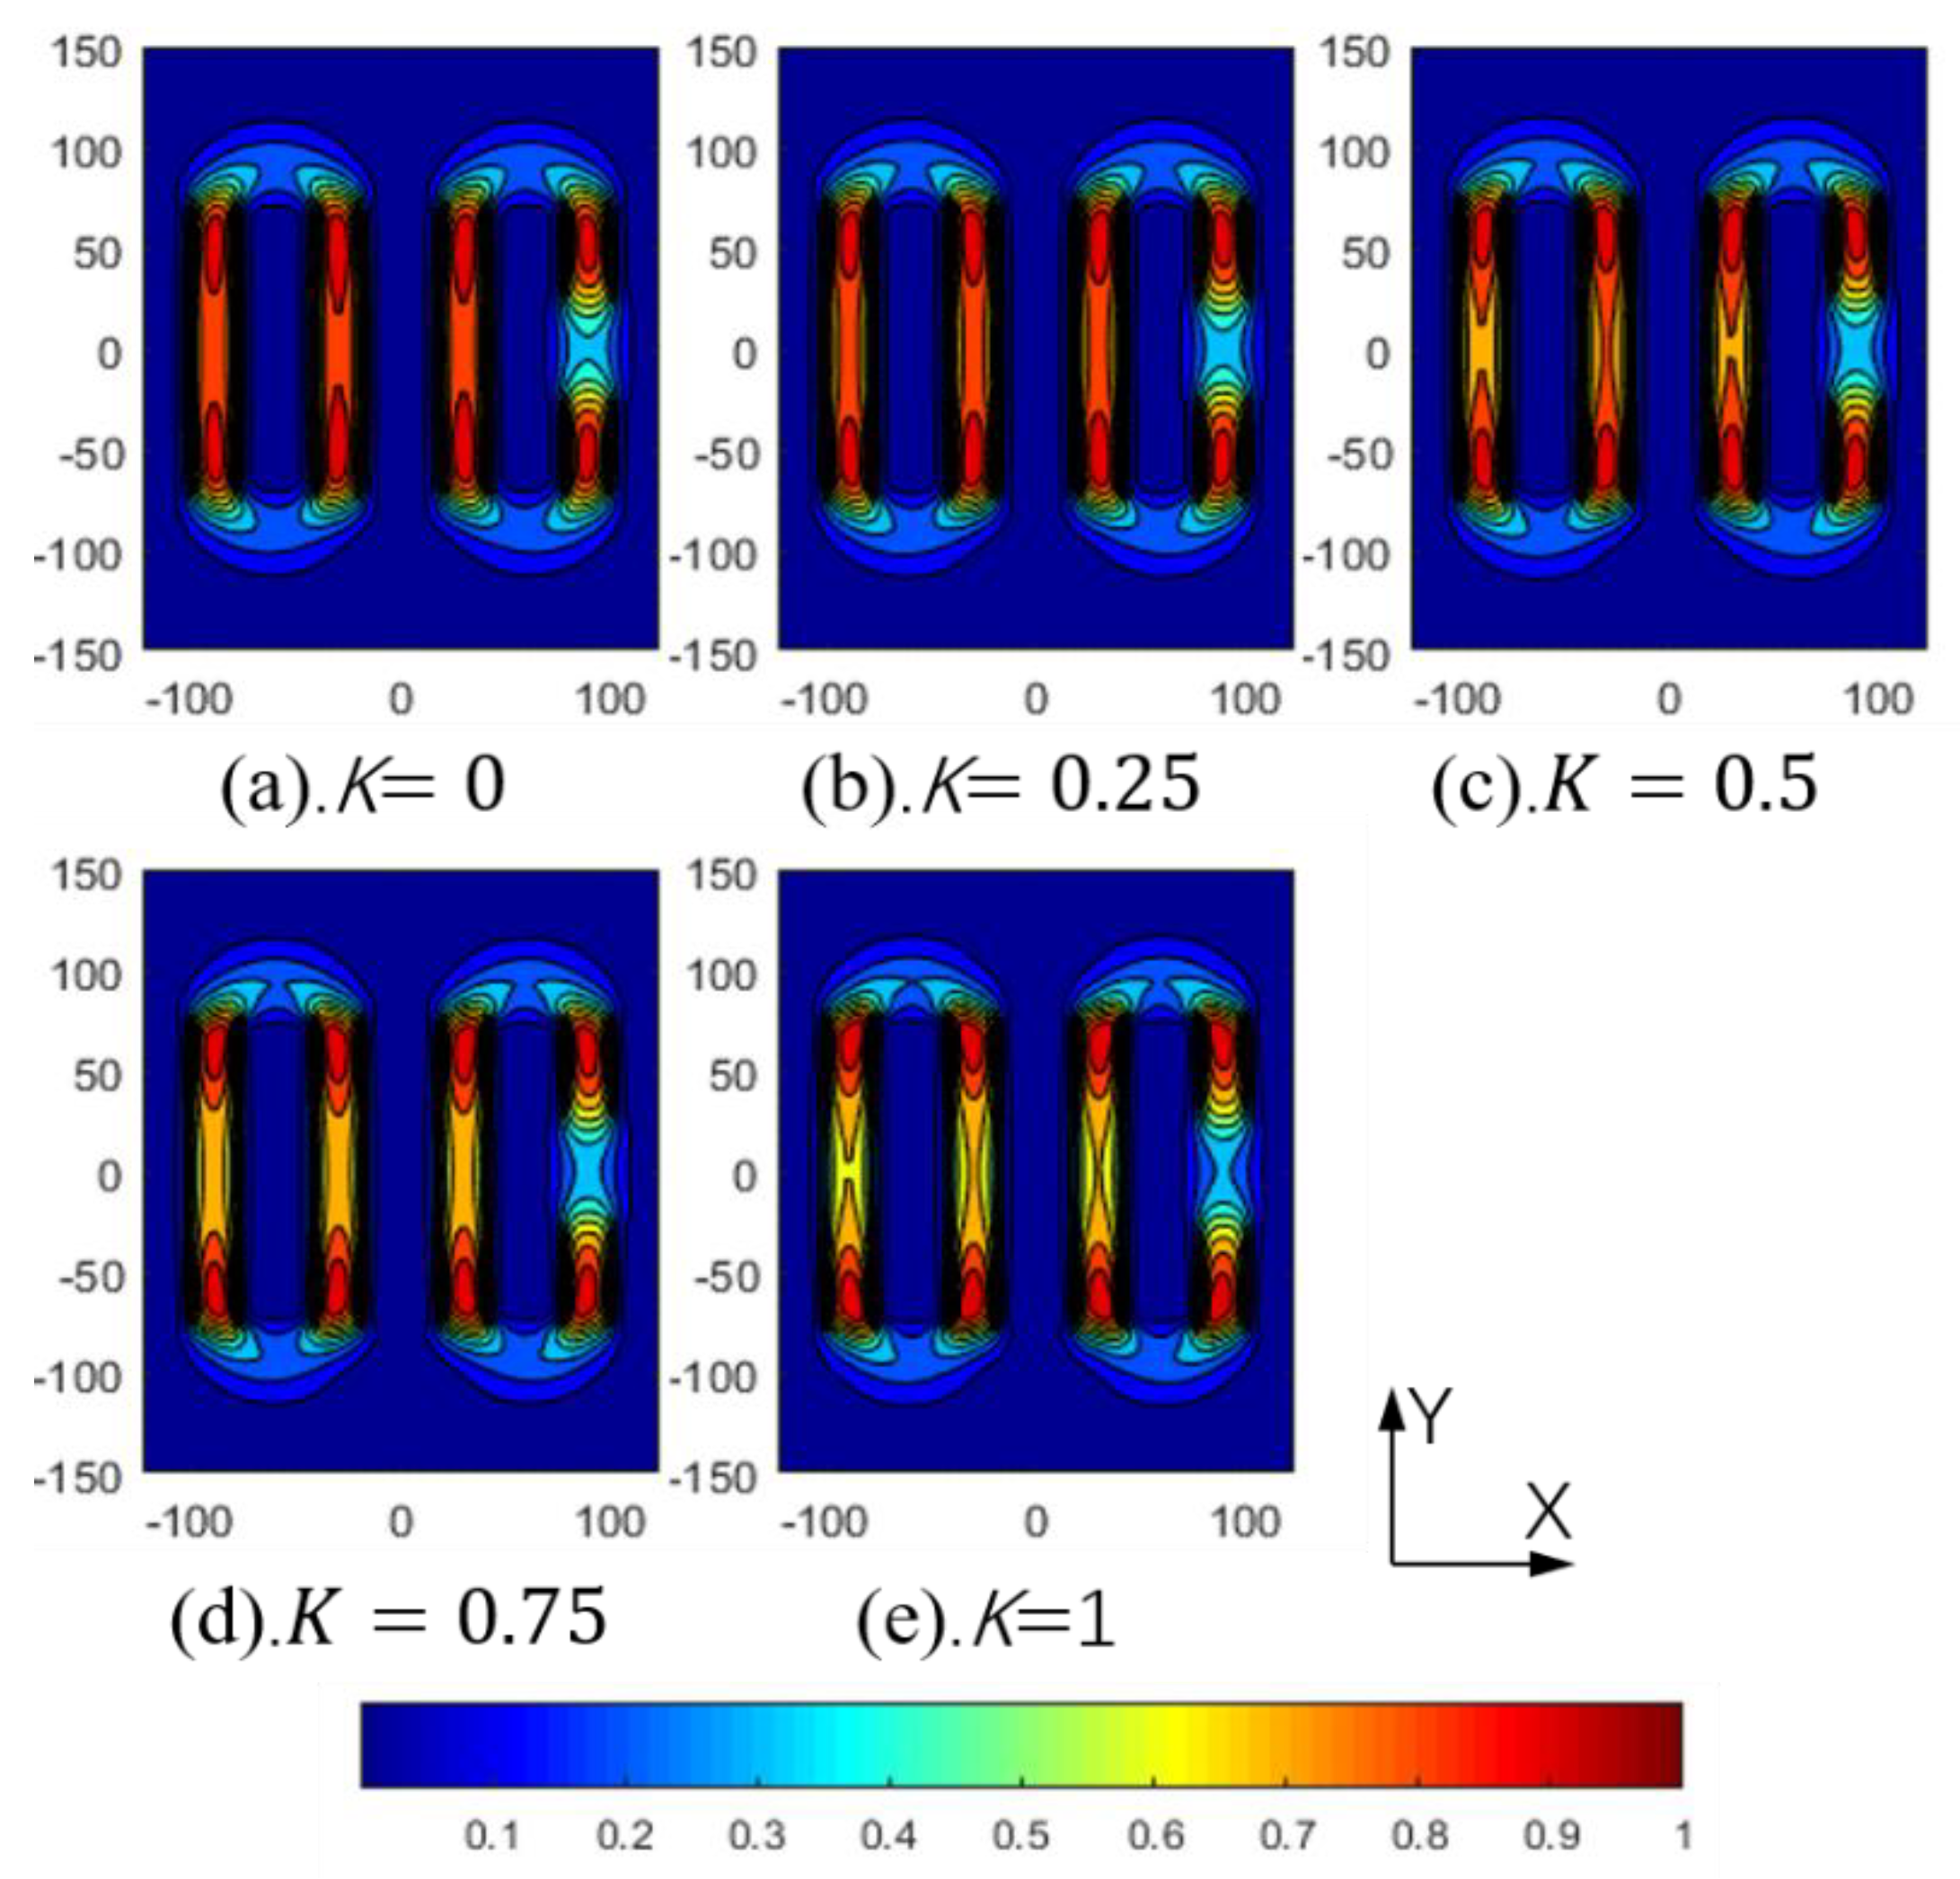
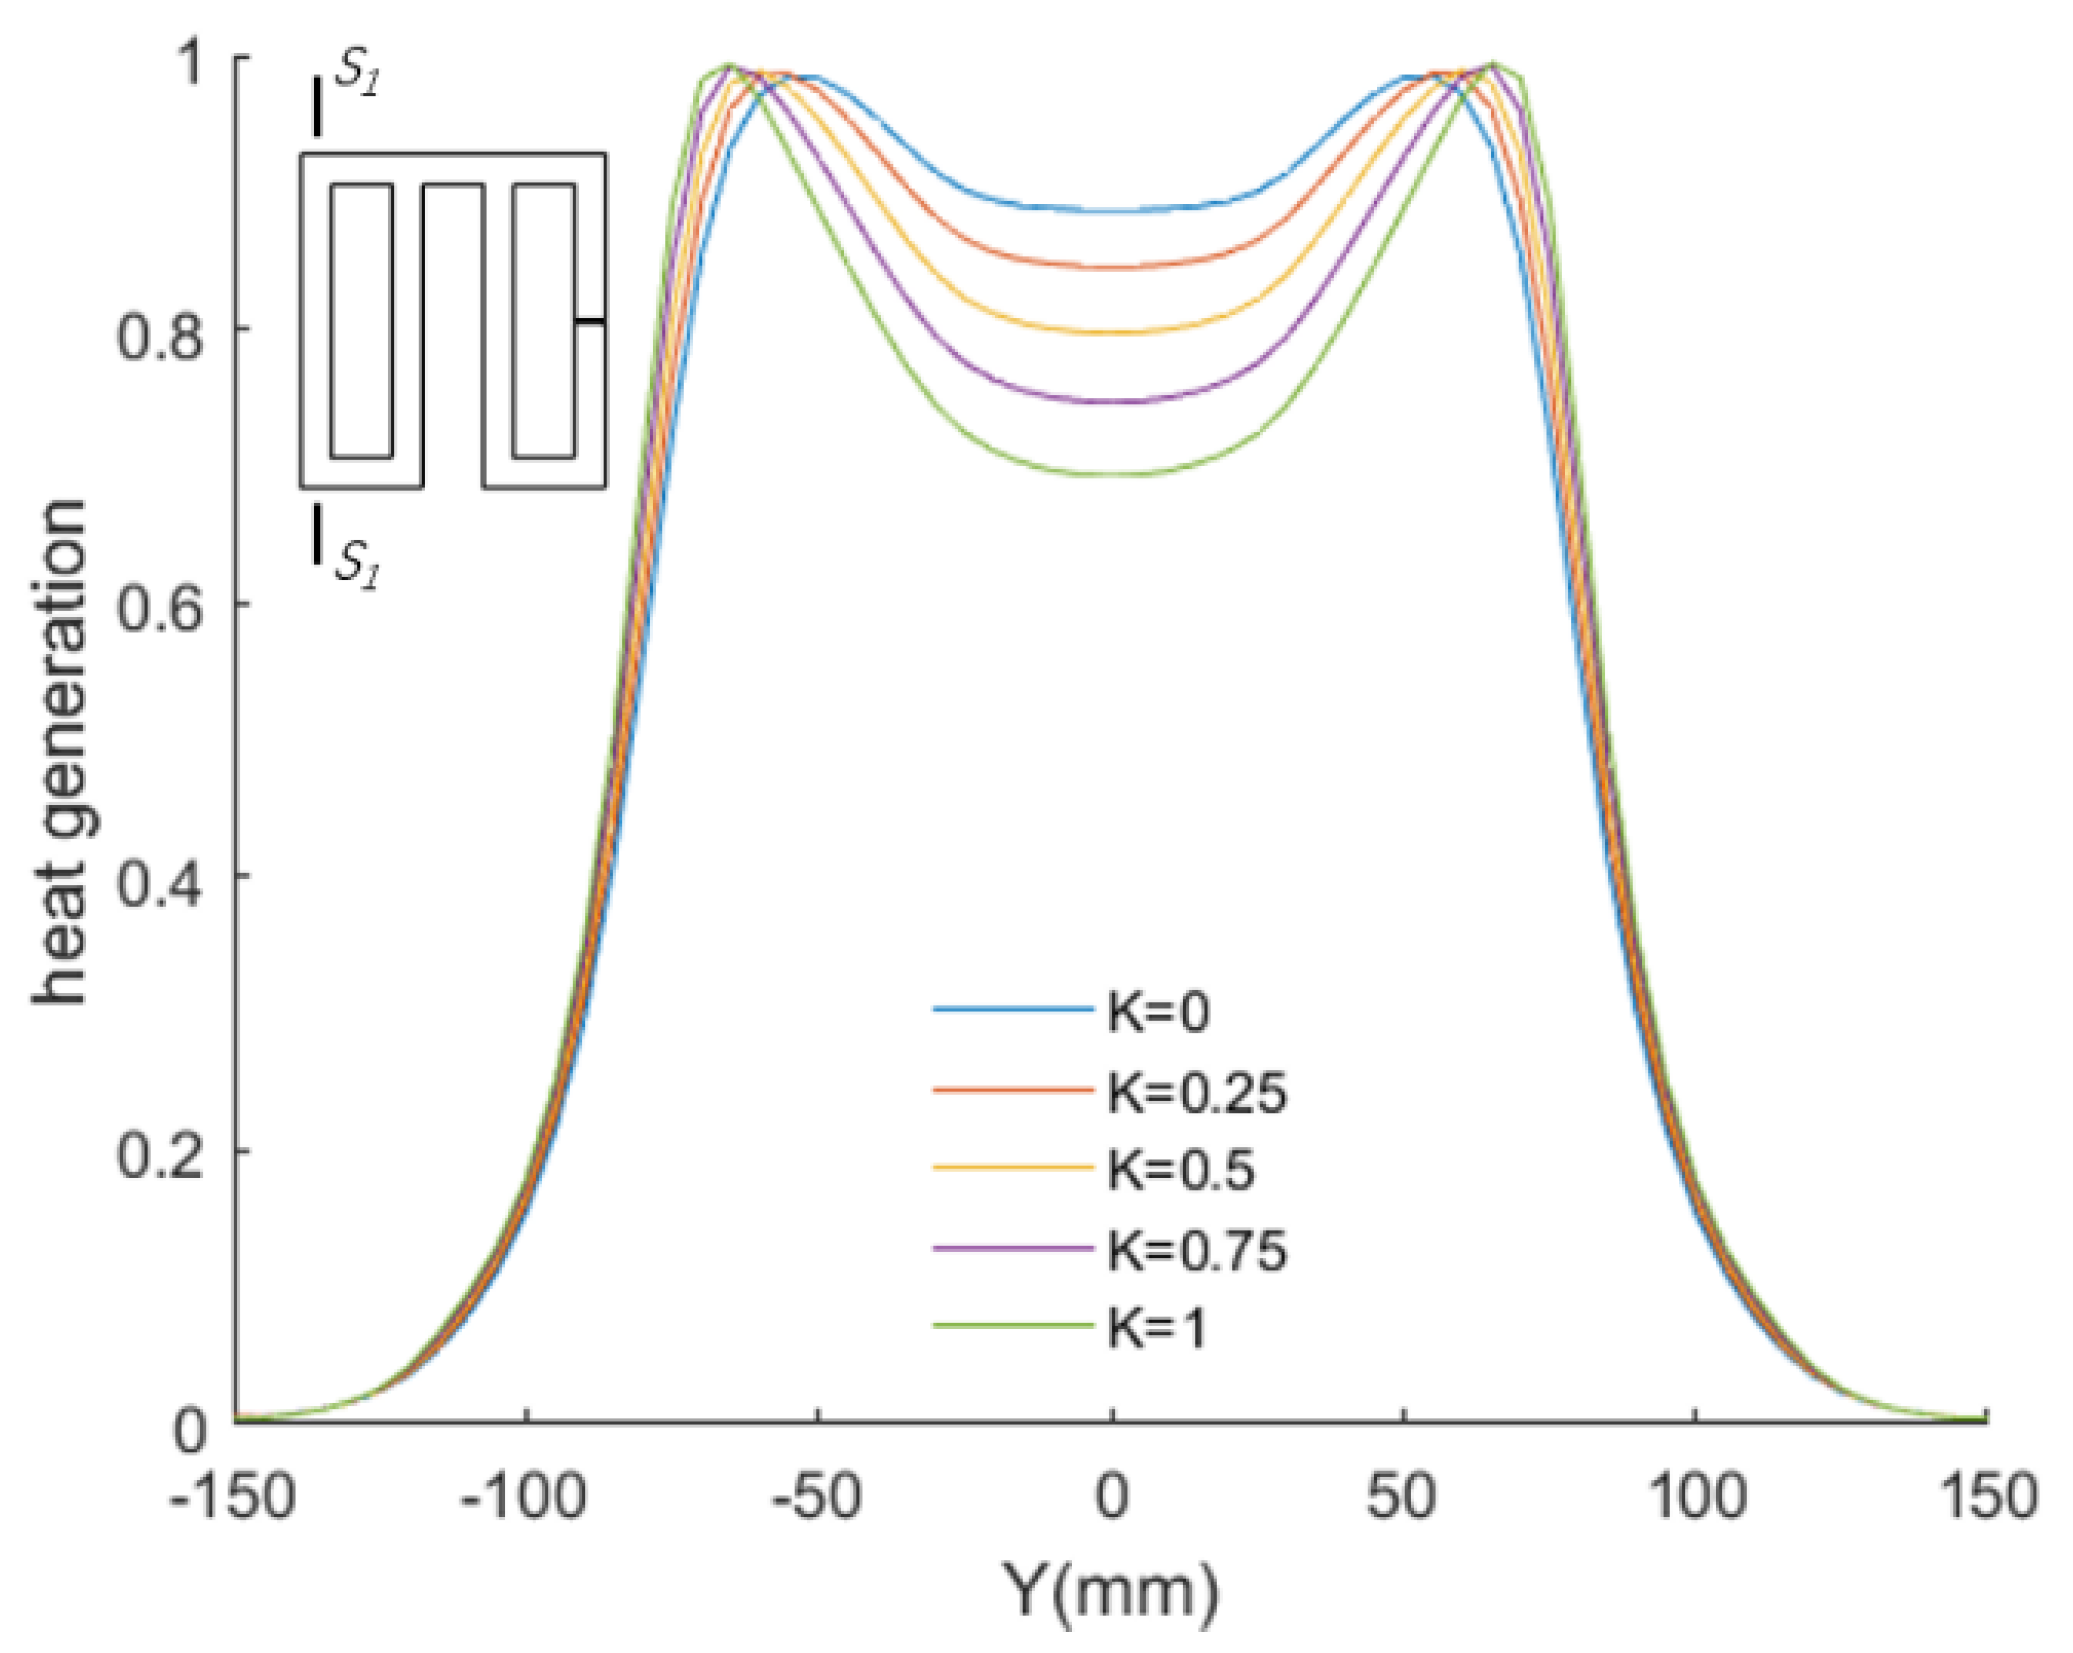
The heat source distribution with different initial curvatures was calculated. The normalized results are shown in Figure 9. We chose a cross section vertical to the symmetry axis (y = 0) S1–S1 to compare the distribution of heat generation (see Figure 10). The heat generation is concentrated in the area under the coil, and the shape of the area is similar to the coil. As a result of the influence of the core on the magnetic field distribution, the Joule heat on the side of the axis is always higher than at the center. It is clear that when the curvature increased, the Joule heat generation near the symmetry axis was reduced because the air gap increased. The heat generation on the side of the workpiece does not change. Under the conditions of an initial curvature K = 1, the Joule heat generation on the center of the workpiece is reduced by about 21%.
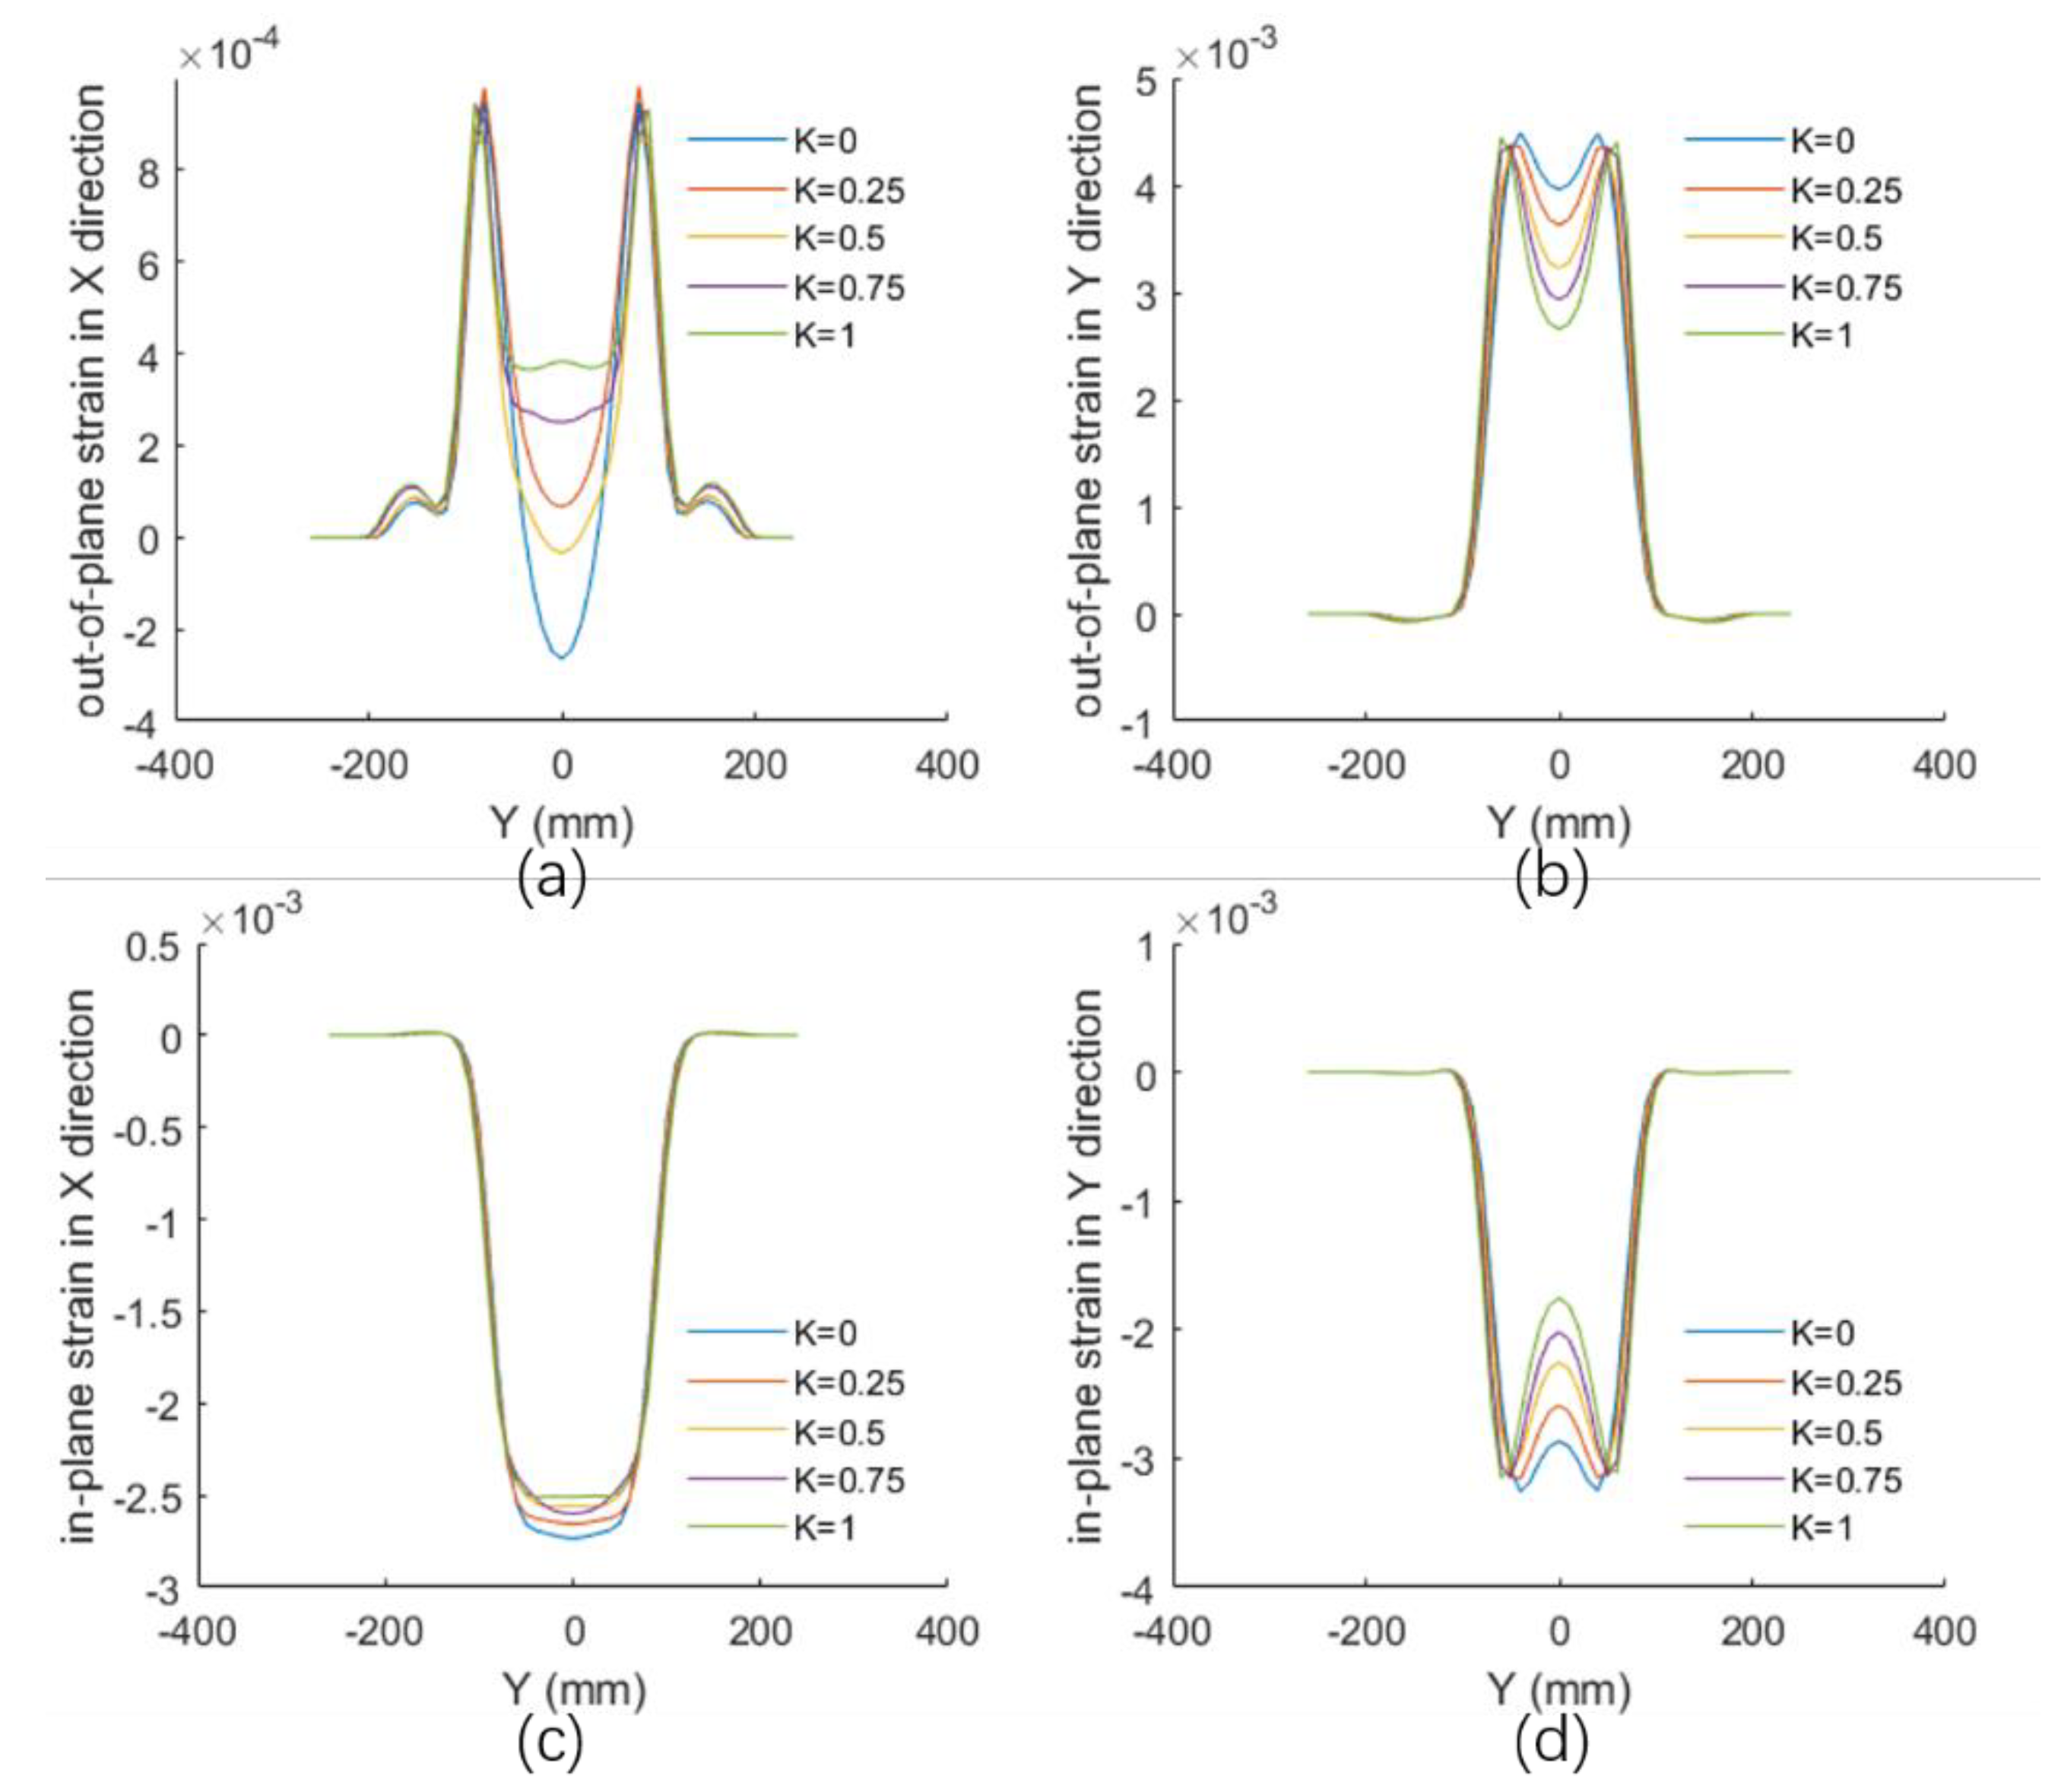
We performed the five heat source models on the heat transfer and mechanical analysis, and the plastic strain distribution and displacement were calculated. Figure 11 shows the plastic strain on the bottom surface (without the inductor side) of the plate along the section SBSB, which is vertical to the heating line, and the thickness is 20 mm. The strain was divided into in-plane strain and out-of-plane strain according to Equations (12) and (13). The strain components in the X and Y directions are shown.
With the curvature of the plate increasing, the out-of-plane strain in the heating area becomes less homogeneous—lower in the center and higher on the side. This occurs because the air gap between the coil and plate increased, and the heat generation was reduced. The relative change of the out-of-plane strain in the X direction is the greatest, and the relative change of the in-plane strain in the X direction is the smallest. In the Y direction, due to the heat generation decreasing in the center of the heat line, both the in-plane strain and the out-of-plane strain are reduced. The absolute change of strain in the X direction is smaller than the components in the Y direction. Table 3 shows the maximum relative variation of the plastic strain compared with the curvature K = 0, and it can be described as m a x ( ( ε ε K = 0 ) / ε K = 0 ) . The result shows that the curvature has the greatest influence on the out-of-plane strain in the X direction and the smallest influence on the in-plane strain in the Y direction. When the curvature K < 0.2, the variation of the plastic strain Joule heat generation is mainly below 10%, which means that the effect of the curvature is not apparent. The total transverse shrinkage and transverse angular distortion are reduced. With an initial curvature K=1, the transverse shrinkage is reduced by about 11%, and the transverse angular distortion is reduced by about 6%. After comparing the results of different plate thicknesses, the same pattern can be concluded. When the curvature is below 0.5 m-1, the effect of the curvature on the out-of-plane strain is more significant for thicker plates.
In practical applications, if the heat sources do not consider the change of plate curvature, the calculated plastic strain distribution will exhibit a significant deviation. According to the above calculation results, when the curvature is greater than 0.2, the influence of curvature on the distribution of the heat source should be considered. A compromise scheme is to use a heat source distribution under an intermediate curvature for calculation, so as to reduce the deviation caused by the curvature change.

4.2. Effect on Different Coil Widths

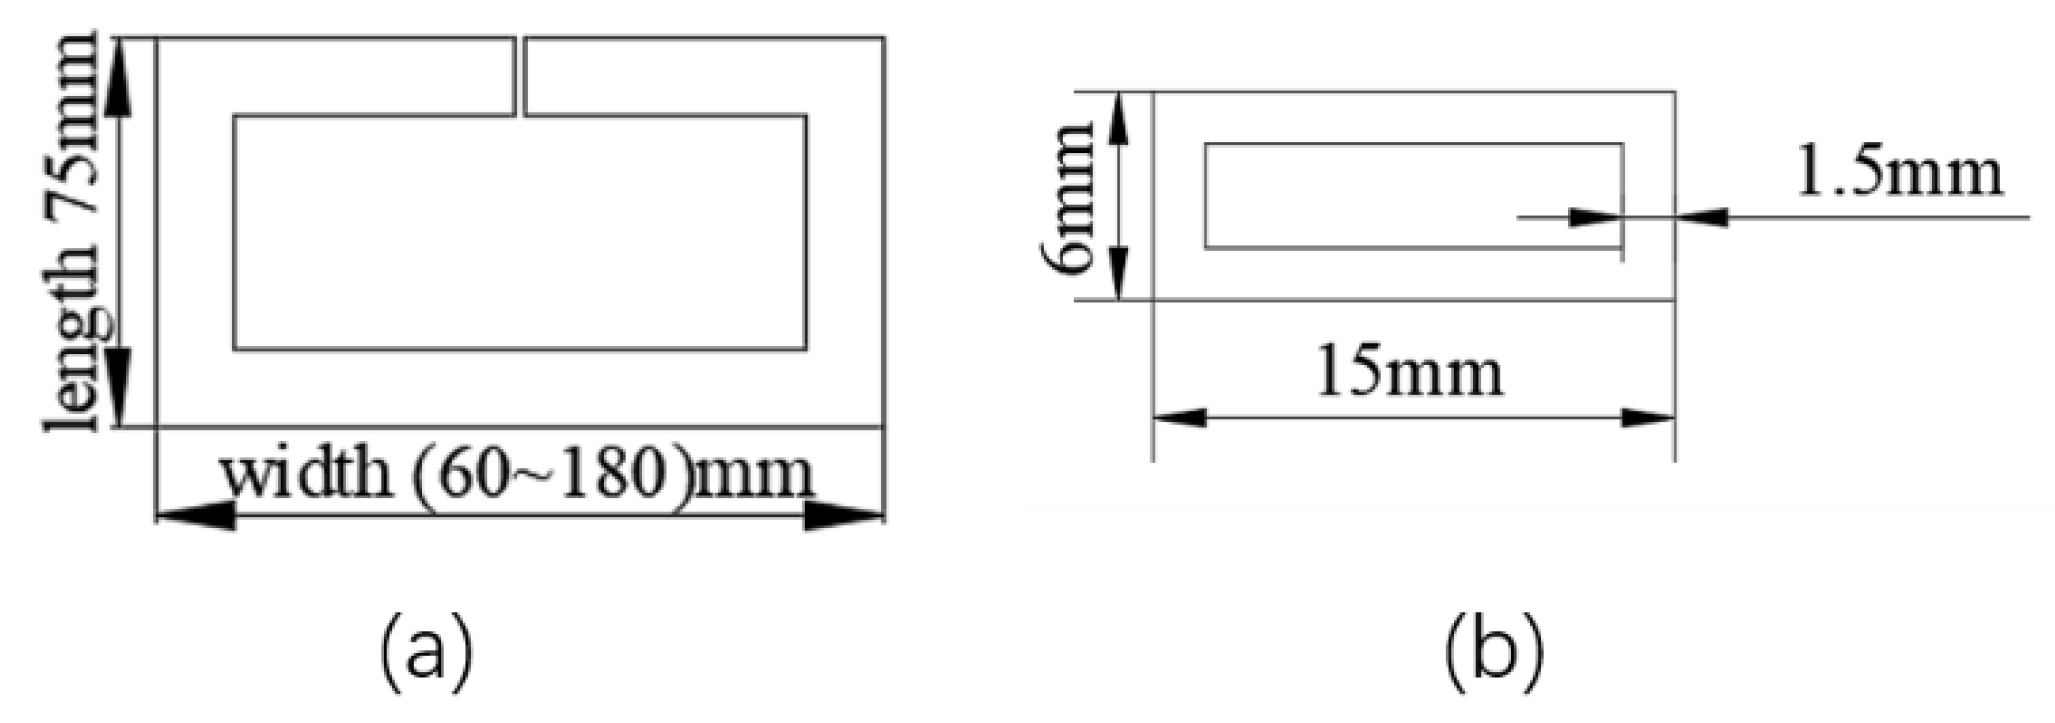
We then applied coils with different widths to the calculation and found that the coils with different widths are affected by the curvature of the plate. In the process of plate bending deformation, the change of curvature of the plate will cause a change to the air gap. When the curvature changes are the same, the wider the coil, the higher the change of the air gap. However, at the same time, a wider coil can achieve a higher forming efficiency. Thus, comparing the effect of the initial curvature on coils with different widths can help with choosing the coil’s dimensions. We chose a square coil with widths ranging from 60 mm to 180 mm for the simulation. The shape of the coil is shown in Figure 12. Calculation schemes are listed in Table 4. We compared the heat source distribution on the plate with an initial curvature equal to 0 and 1. The moving velocity was 5 mm/s. A square plate of 1 m × 1 m was modeled in this calculation, with thickness settings of 20 mm and 16 mm. In order to make the highest temperature produced by different coils around 600 °C, different input powers were used on different coils.
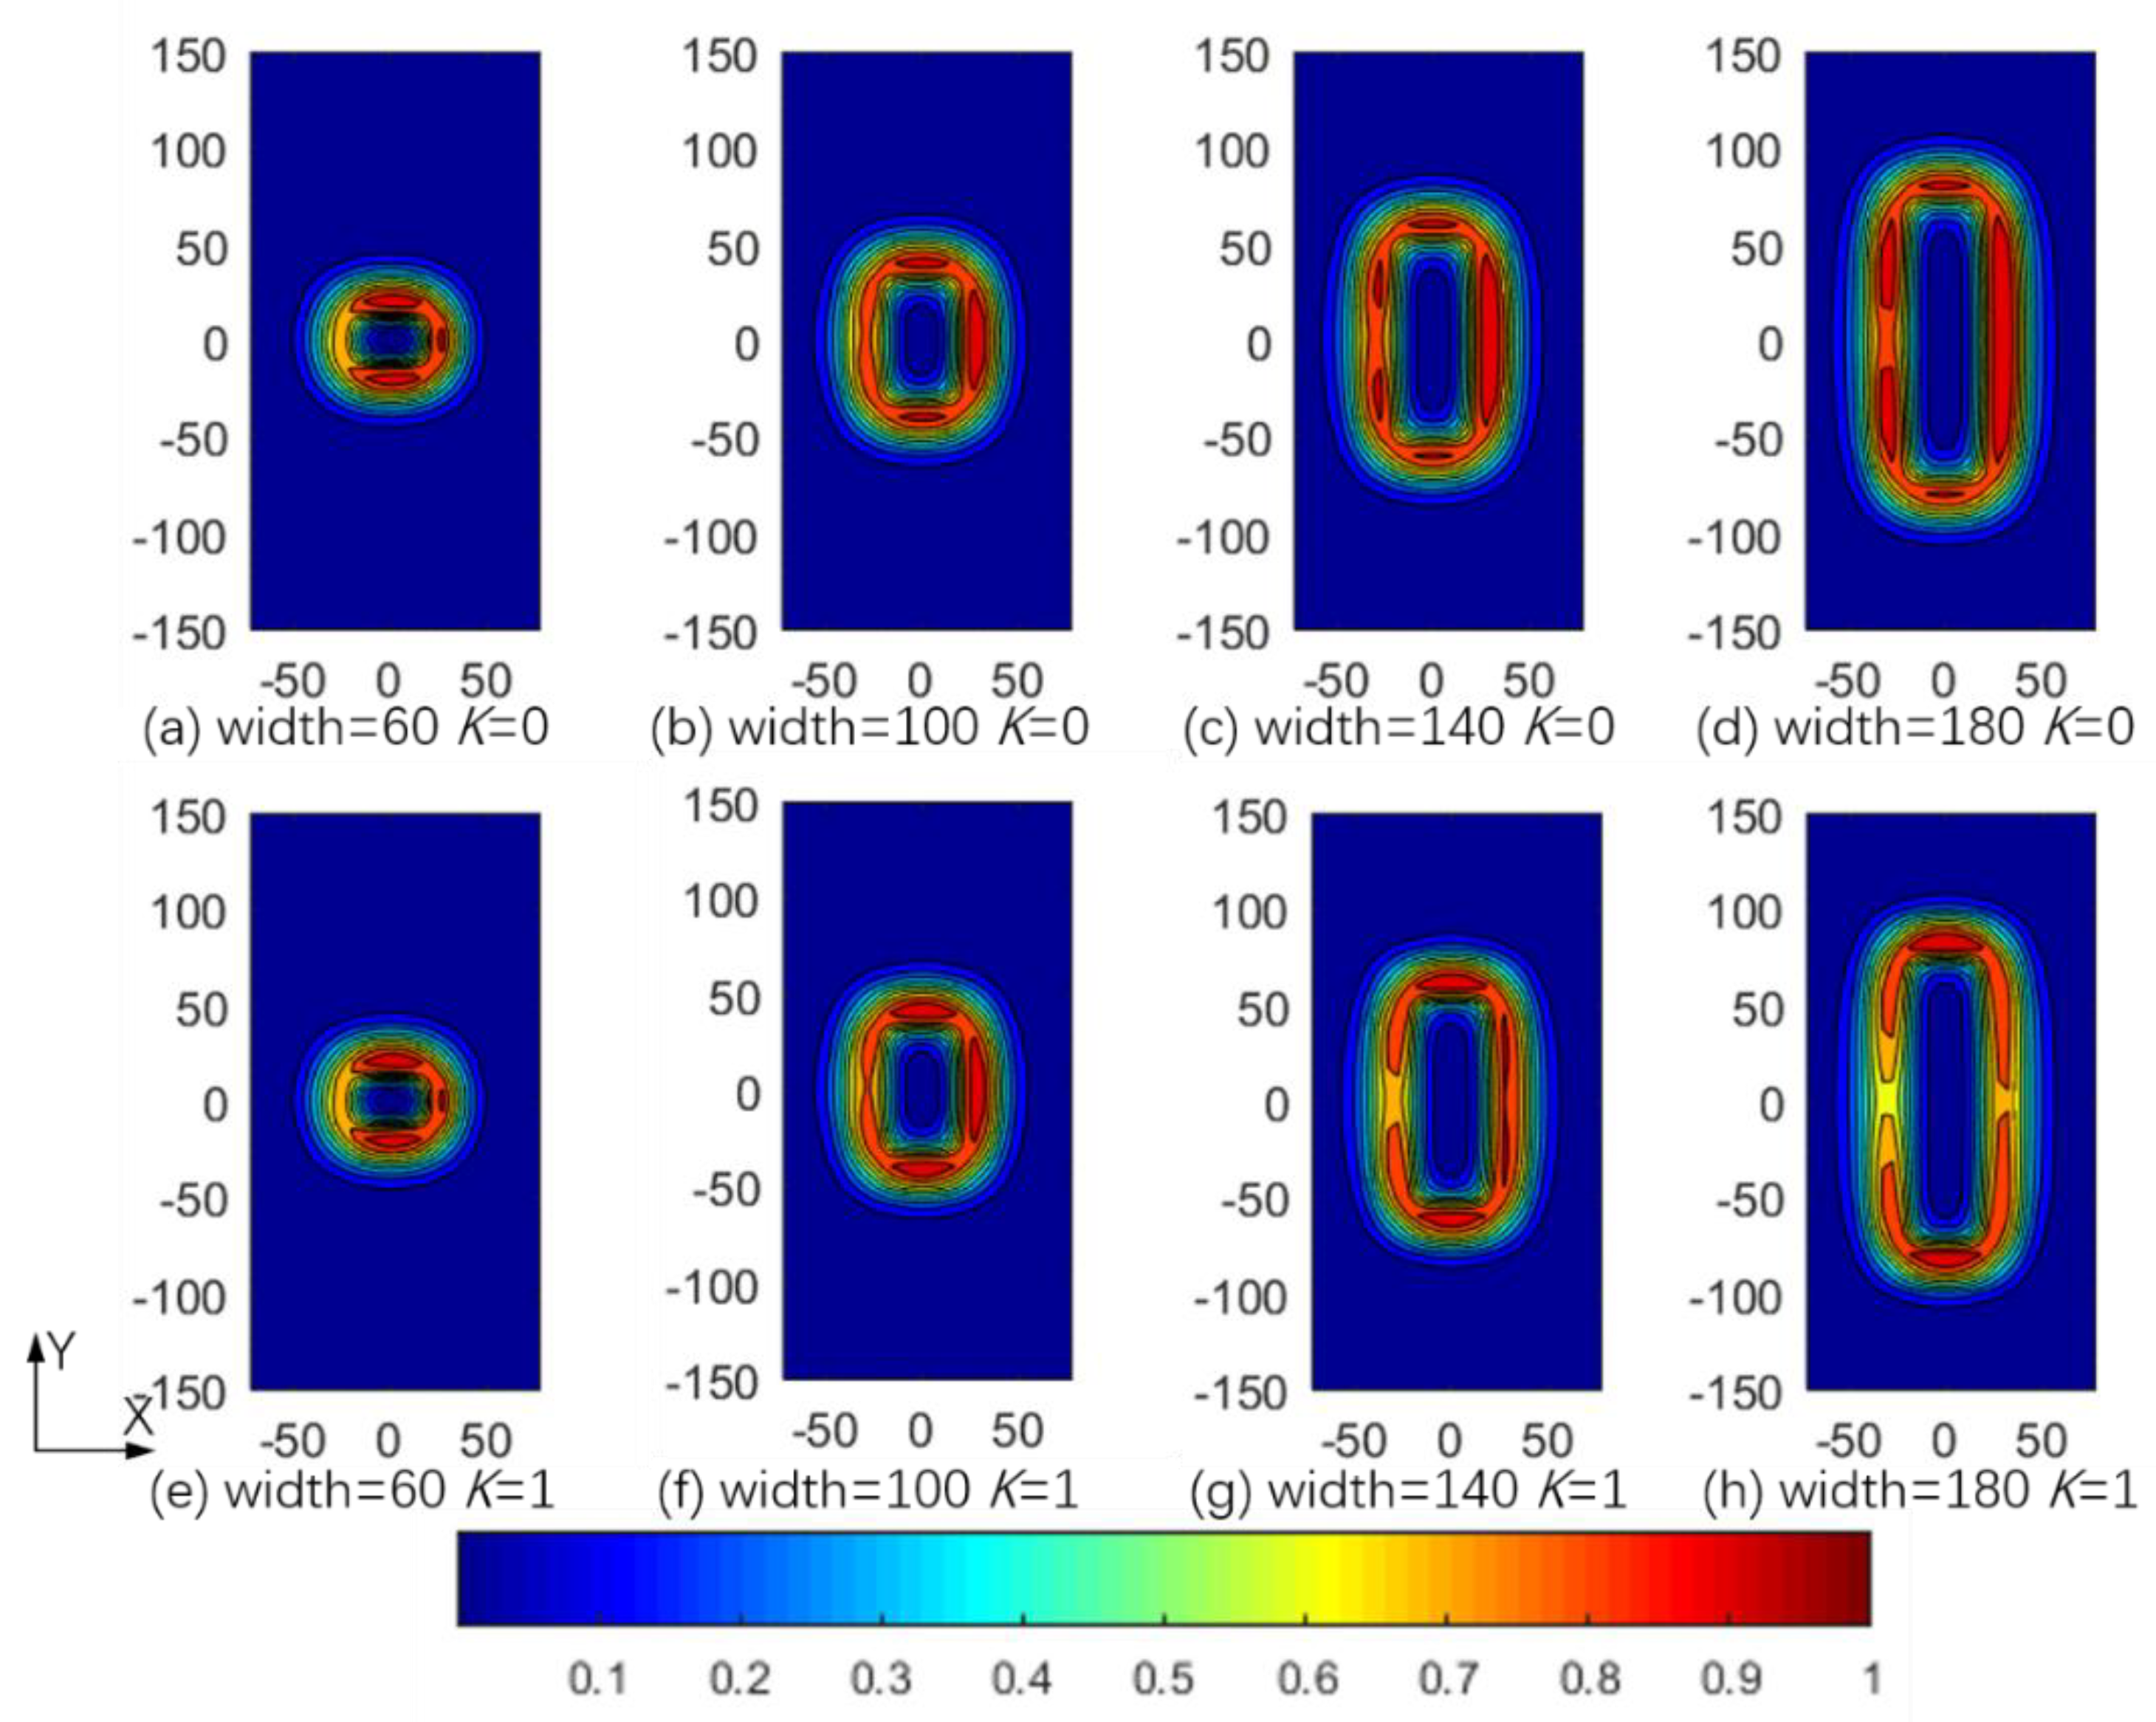
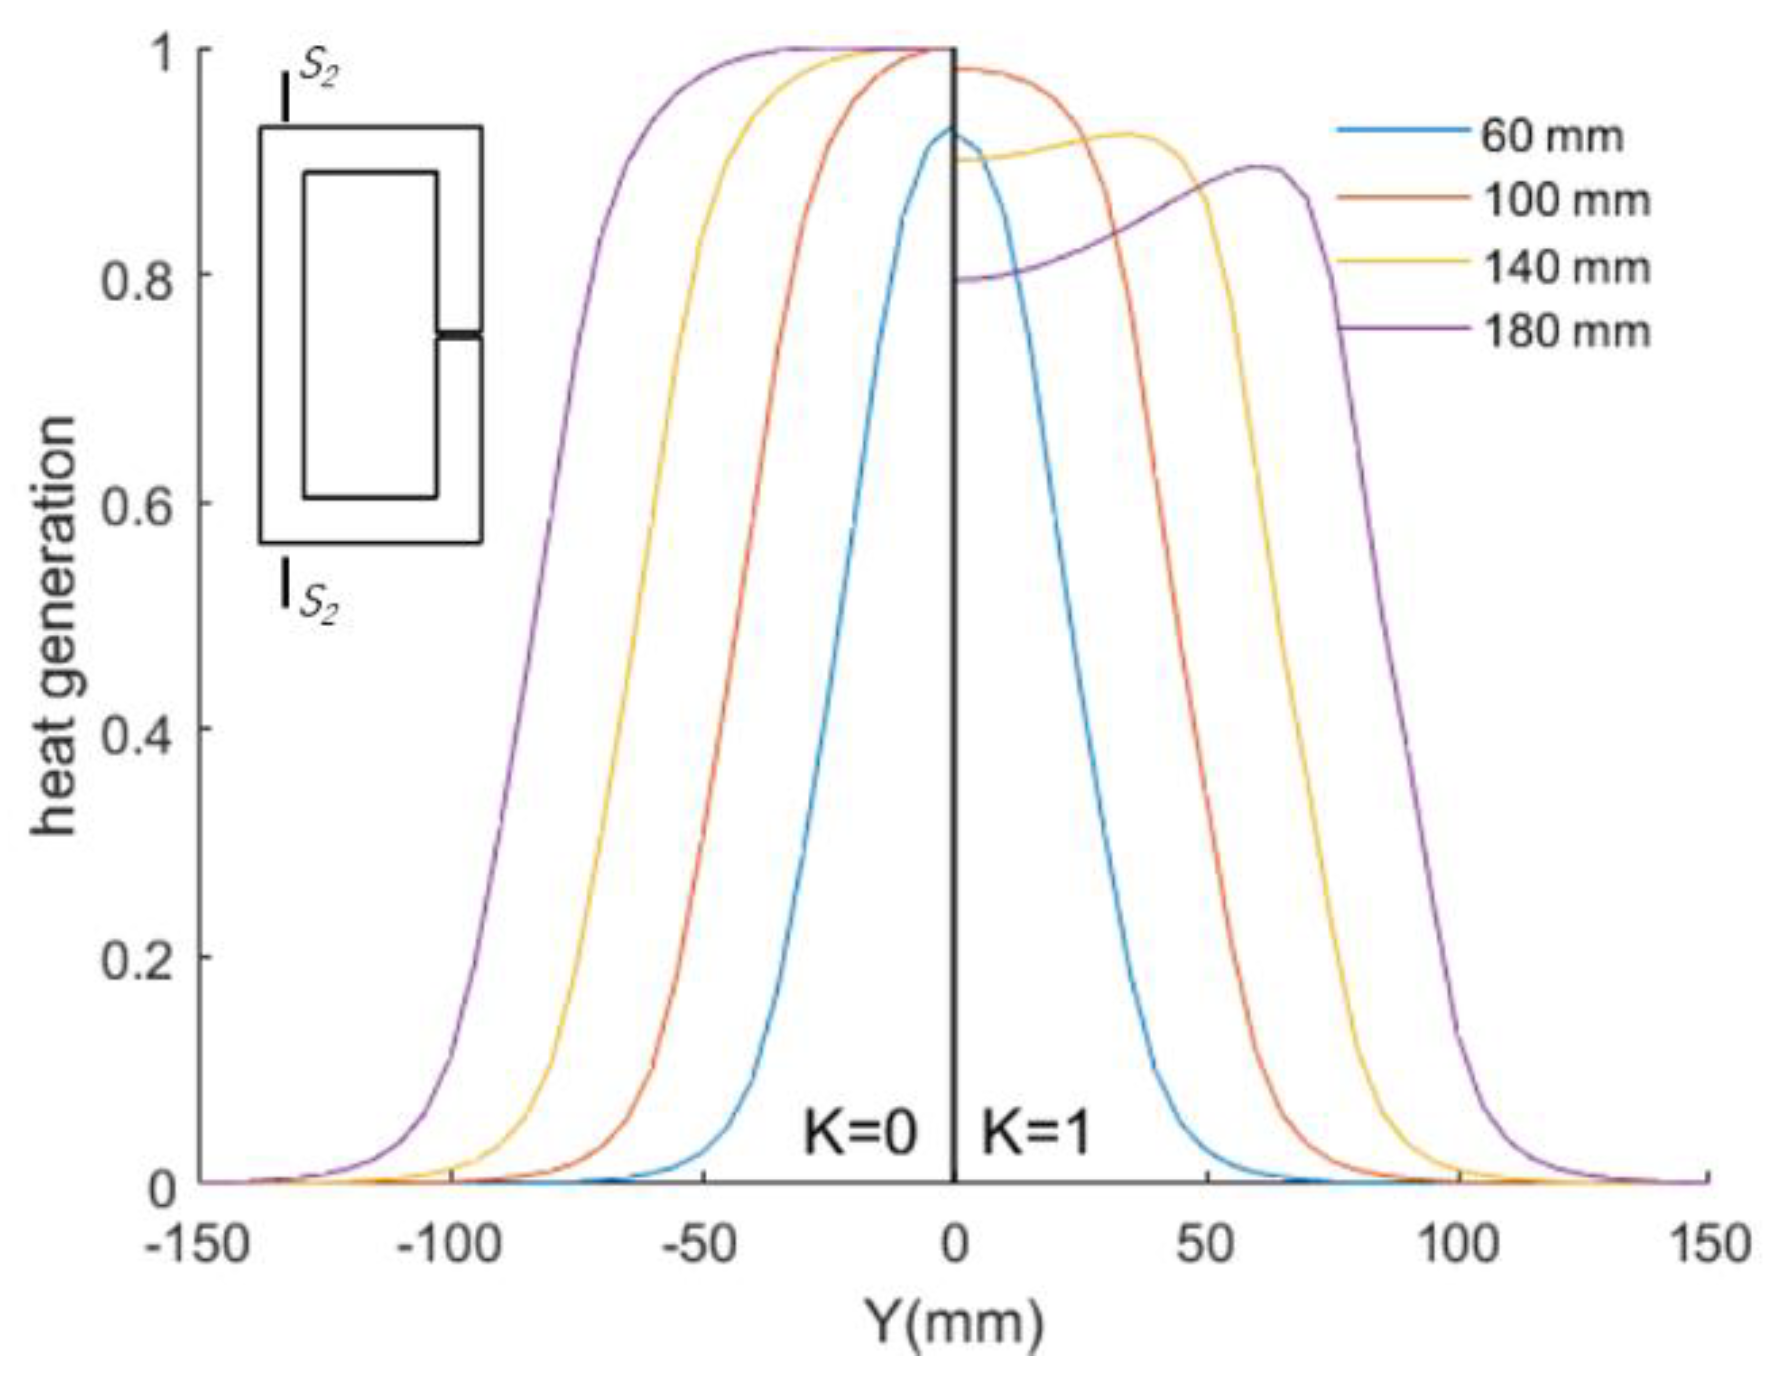
Heat source distributions with different initial curvatures and different coil widths were calculated. The normalized results are shown below in Figure 13. We chose a cross section vertical to the symmetry axis (y = 0) S2–S2 to compare the distribution of the heat generation (see Figure 14). The heat generation concentrated in the area under the coil, and the shape of the area was similar to the coil. When the coil width was smaller than 100 mm, the variation of Joule heat generation was not obvious. When the coil width was over 100 mm, the Joule heat generation was obviously reduced at the center of the workpiece. At a coil width of 180 mm and initial curvature K = 1, the Joule heat generation at the center of the workpiece was reduced by about 20%.
We performed the eight heat source models on the heat transfer and mechanical analysis, and the plastic strain distribution and displacement were calculated. Figure 15 shows the plastic strain on the bottom surface (without the inductor side) of the plate along the section SBSB, which is vertical to the heating line, and the thickness was 20 mm. The strain was divided into the in-plane strain and out-of-plane strain, according to Equations (12) and (13). Strain components in both the X and Y directions are shown.
A greater strain can be obtained in a single line process with a wider heat source. Considering the relative variation of the plastic strain when the curvature increases from 0 to 1, the maximum of the relative variation with different coil widths are listed in Table 5. Similar to the pattern of heat generation, when the coil width is less than 100 mm, it can be considered that the effect of plate curvature on heat source distribution and strain distribution is not obvious, as the relative variation is mainly below 15%. When the coil width is over 100 mm, the plastic strain was obviously reduced while the curvature increased. Curvature has a larger effect on strain in the Y direction than the X direction. The same pattern can be concluded from different plate thicknesses.
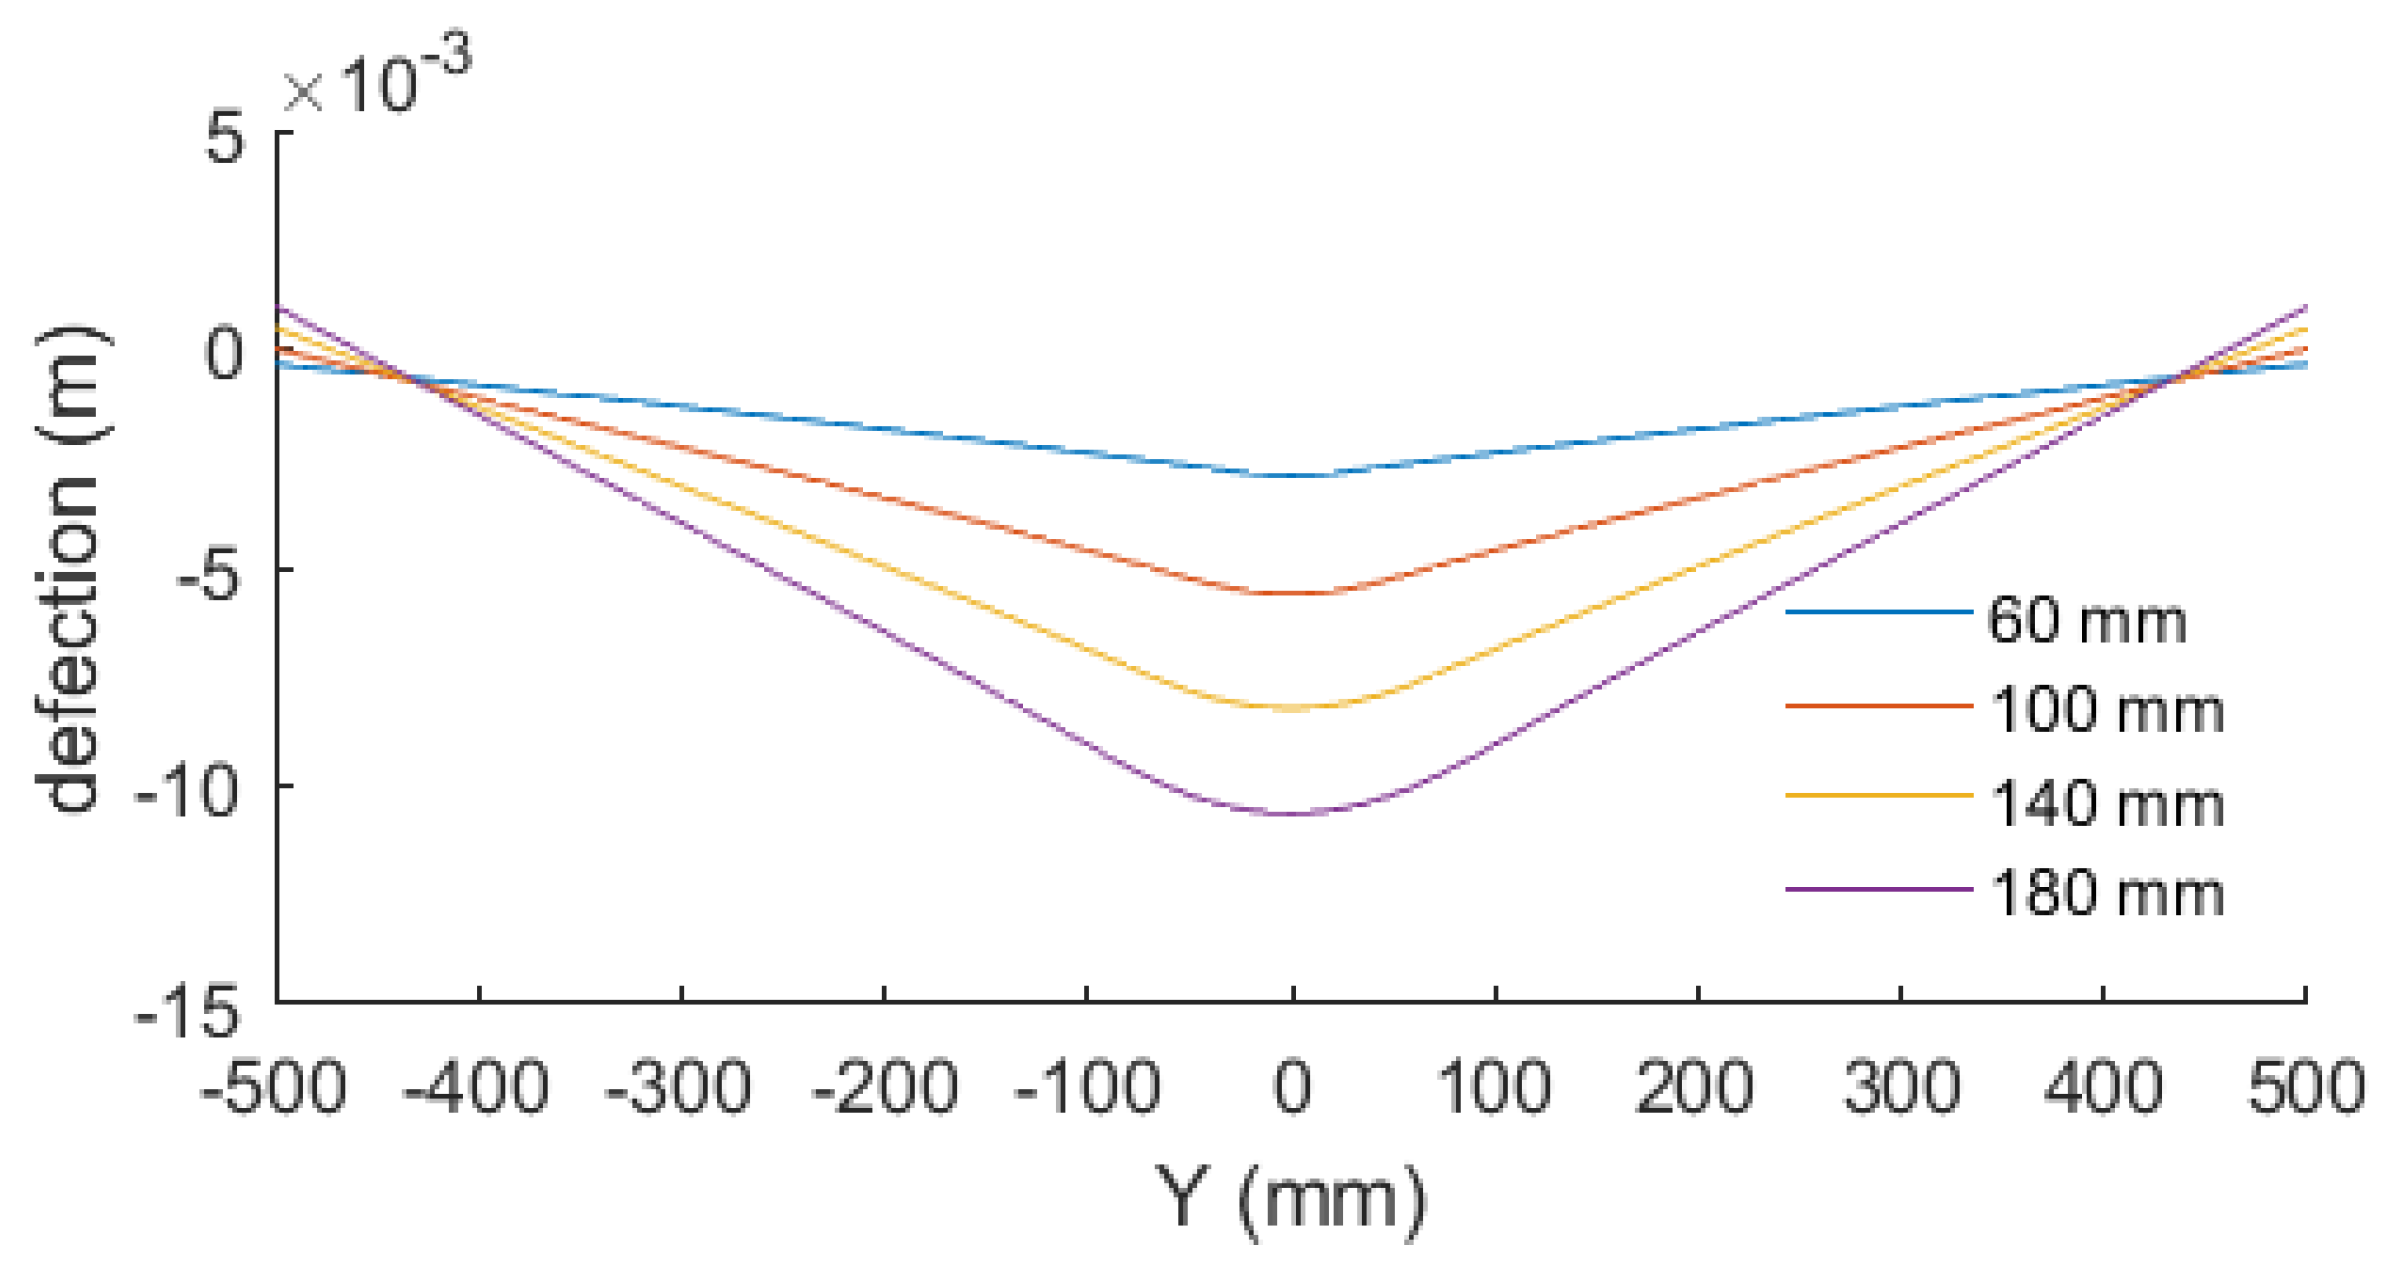
It should also be noted that the wider coil can achieve a wider plastic distribution, which means a higher processing efficiency. Figure 16 shows the defection of the formed plate in section SB–SB and compares the defection caused by different coil widths. In a single-pass heat line, when the highest temperature is the same, the wider coil can achieve a more significant defection, which means the forming ability of the wide coil is higher than that of the narrow coil.

5. Conclusions

In this paper, we used an FEM calculation to investigate the effect of plate curvature on heat source distribution and strain distribution, defining the influence range of plate curvature. The following conclusions were obtained:
  • The finite element method, which divides the whole problem into three parts in sequence, can reflect the deformation of the actual process very well.
  • When the coil width is less than 100 mm, it can be considered that the effect of plate curvature on heat source distribution and strain distribution is not apparent.
  • When the coil width is over 100 mm, the plate curvature affects the heat generation distribution. As the curvature increases, the Joule heat generation in the center of the heating area is reduced by up to 21%, and the plastic strain is obviously reduced.
  • A more significant deformation and strain can be obtained in a single-pass heat line with a wider heat source. A wider coil can achieve a higher processing efficiency.
  • When the coil width is less than 100 mm or the curvature is less than 0.2 m-1, the effect of the plate curvature is negligible. A compromise is to use a heat source distribution under an intermediate curvature for the calculation to reduce the deviation caused by a curvature change.

Author Contributions

Y.Z. designed the experimental plans, contributed to the discussions, and reviewed the paper; L.C. carried out the experiments, performed the numerical simulations, and wrote the paper; H.Y. assisted in the experiment and reviewed the paper; X.H., Z.Y. and H.Z. investigated the processing process in the shipyard. All authors have read and agreed to the published version of the manuscript.

Funding

This work was supported by the Ministry of Science and Technology of the People’s Republic of China (Grant No.: 2012DFR80390) and Ministry of Industry and Information Technology of the People’s Republic of China (Grant No.:2016545).

Conflicts of Interest

The authors declare that they have no conflicts of interest to report regarding the present study.

Nomenclature

H the magnetic field strength (Wb)
J the conduction current density ( A / m 2 )
t time (s)
E the electric field (V/m)
B the magnetic field (T)
D the electric flux density ( C / m 2 )
ρ v the electric charge density
q joule heat generation density ( J / m 3 )
J current density ( A / m 2 )
γ electric conductivity ( S m )
δ skin effect depth (mm)
f the current frequency (Hz)
μ r the relative magnetic permeability
q s u r f surface heat source distribution ( J / m 2 )
ρ the density ( kg / m 3 )
c the specific heat ( J / ( kg ° C ) )
T the temperature ( ° C )
λ the thermal conductivity ( W / ( m ° C ) )
h the convective heat transfer coefficient ( W / ( m 2 ° C ) )
n the external normal direction of the steel plate surface
T e n v the ambient temperature ( ° C )
σ i j stress tensor
F b i the body force
{ d σ } the stress increment
[ D ] the elastoplastic matrix
{ d ϵ } the strain increment
{ C } the thermal stiffness matrix
d T the temperature increment ( ° C )
t p l a t e plate thickness (mm)
ε i n _ p l a n e in-plane strain
ε o u t _ o f _ p l a n e out-of-plane strain

References

  1. Wang, S.; Hou, L.X.; Wang, J.; Liu, Y.J. Research progress of thermal working forming technologies for complex curved hull plates. Hot Work. Technol. 2019, 48, 1–4, 9. [Google Scholar]
  2. Ueda, Y.; Murakawa, H.; Rashwan, A.M.; Okumoto, Y.; Kamichika, R. Development of computer-aided process planning system for plate bending by line heating (report 1)—Relation between final form of plate and inherent strain. J. Ship Prod. 1994, 10, 59–67. [Google Scholar]
  3. Ueda, Y.; Murakawa, H.; Rashwan, A.M.; Okumoto, Y.; Kamichika, R.; Ishiyama, M.; Ogawa, J. Development of Computer Aided Process Planning System for Plate Bending by Line Heating (Report IV). Decision Making on Heating Conditions, Location and Direction. Trans. JWRI 1993, 22, 305–313. [Google Scholar]
  4. Vega, A.; Rashed, S.; Tango, Y.; Ishiyama, M.; Murakawa, H. Analysis and prediction of multi-heating lines effect on plate forming by line heating. Comput. Modeling Eng. Sci. 2008, 28, 1–14. [Google Scholar]
  5. Vega, A.; Escobar, E.; Fong, A.; Ma, N.; Murakawa, H. Analysis and prediction of parallel effect on inherent deformation during the line heating process. Comput. Modeling Eng. Sci. 2013, 90, 197–210. [Google Scholar]
  6. Yoshihiko, T.; Morinobu, I.; Hiroyuki, S. “IHIMU-α” a fully automated steel plate bending system for shipbuilding. IHI Technol. 2011, 51, 24–29. [Google Scholar]
  7. Zhou, H.; Jiang, Z.Y.; Luo, Y.; Luo, P.P. Research on hull plate bending based on the technology of high-frequency induction. Shipbuild. China 2014, 55, 128–135. [Google Scholar]
  8. Zhu, Y.; Luo, Y. Fully coupled magneto-thermo-structural analysis by morphing method and its application to induction heating process for plate bending. Int. J. Appl. Electromagn. Mech. 2018, 56, 573–583. [Google Scholar] [CrossRef]
  9. Yun, J.O.; Yang, S.Y. Analysis of the induction heating for moving inductor coil. J. Mech. Sci. Technol. 2006, 20, 1217–1223. [Google Scholar] [CrossRef]
  10. Lee, K.S.; Eom, D.H.; Lee, J.H. Deformation behavior of SS400 Thick plate by high-frequency-induction-heating-based line heating. Met. Mater. Int. 2013, 19, 315–328. [Google Scholar] [CrossRef]
  11. Dong, H.; Zhao, Y.; Yuan, H. Effect of coil width on deformed shape and processing efficiency during ship hull forming by induction heating. Appl. Sci. 2018, 8, 1585. [Google Scholar] [CrossRef] [Green Version]
  12. Dong, H.; Zhao, Y.; Yuan, H.; Hu, X.; Yang, Z. A Simplified Calculation Method of Heat Source Model for Induction Heating. Materials 2019, 12, 2938. [Google Scholar] [CrossRef] [PubMed] [Green Version]
  13. Zhang, X.; Cheng, C.; Liu, Y. Numerical analysis and experimental research of triangle induction heating of the rolled plate. Proceedings of the Institution of Mechanical Engineers, Part C. J. Mech. Eng. Sci. 2017, 231, 844–859. [Google Scholar] [CrossRef]
  14. Zhu, Y.; Luo, Y. A simplified heat source model for thick plate bending via high-frequency induction line heating. Ships Offshore Struct. 2019, 14, 64–73. [Google Scholar] [CrossRef]
  15. Chang, L.C.; Zhao, Y.; Yuan, H.; Hu, X.C. Influence of plate deformation on heat distribution in induction line heating. Visualization of advanced material processing. In Proceedings of the 8th International Conference of Welding Science and Engineering, Osaka, Japan, 21–22 November 2019. [Google Scholar]
  16. Stratton, J.A. Electromagnetic Theory; John Wiley & Sons: Hoboken, NJ, USA, 2007. [Google Scholar]
  17. Rudnev, V.; Loveless, D.; Cook, R.L. Handbook of Induction Heating; CRC Press: Boca Raton, FL, USA, 2017. [Google Scholar]
  18. ANSYS Inc. ANSYS Mechanical APDL Low-Frequency Electromagnetic Analysis Guide; Version15.0; ANSYS Inc.: Canonsburg, PA, USA, 2016. [Google Scholar]
  19. Wehr, A.; Lohr, U. Airborne laser scanning—An introduction and overview. ISPRS J. Photogramm. Remote Sens. 1999, 54, 68–82. [Google Scholar] [CrossRef]
  20. Schnabel, R.; Wahl, R.; Klein, R. Efficient RANSAC for Point-Cloud Shape Detection. Comput. Graph. Forum 2007, 26, 214–226. [Google Scholar] [CrossRef]
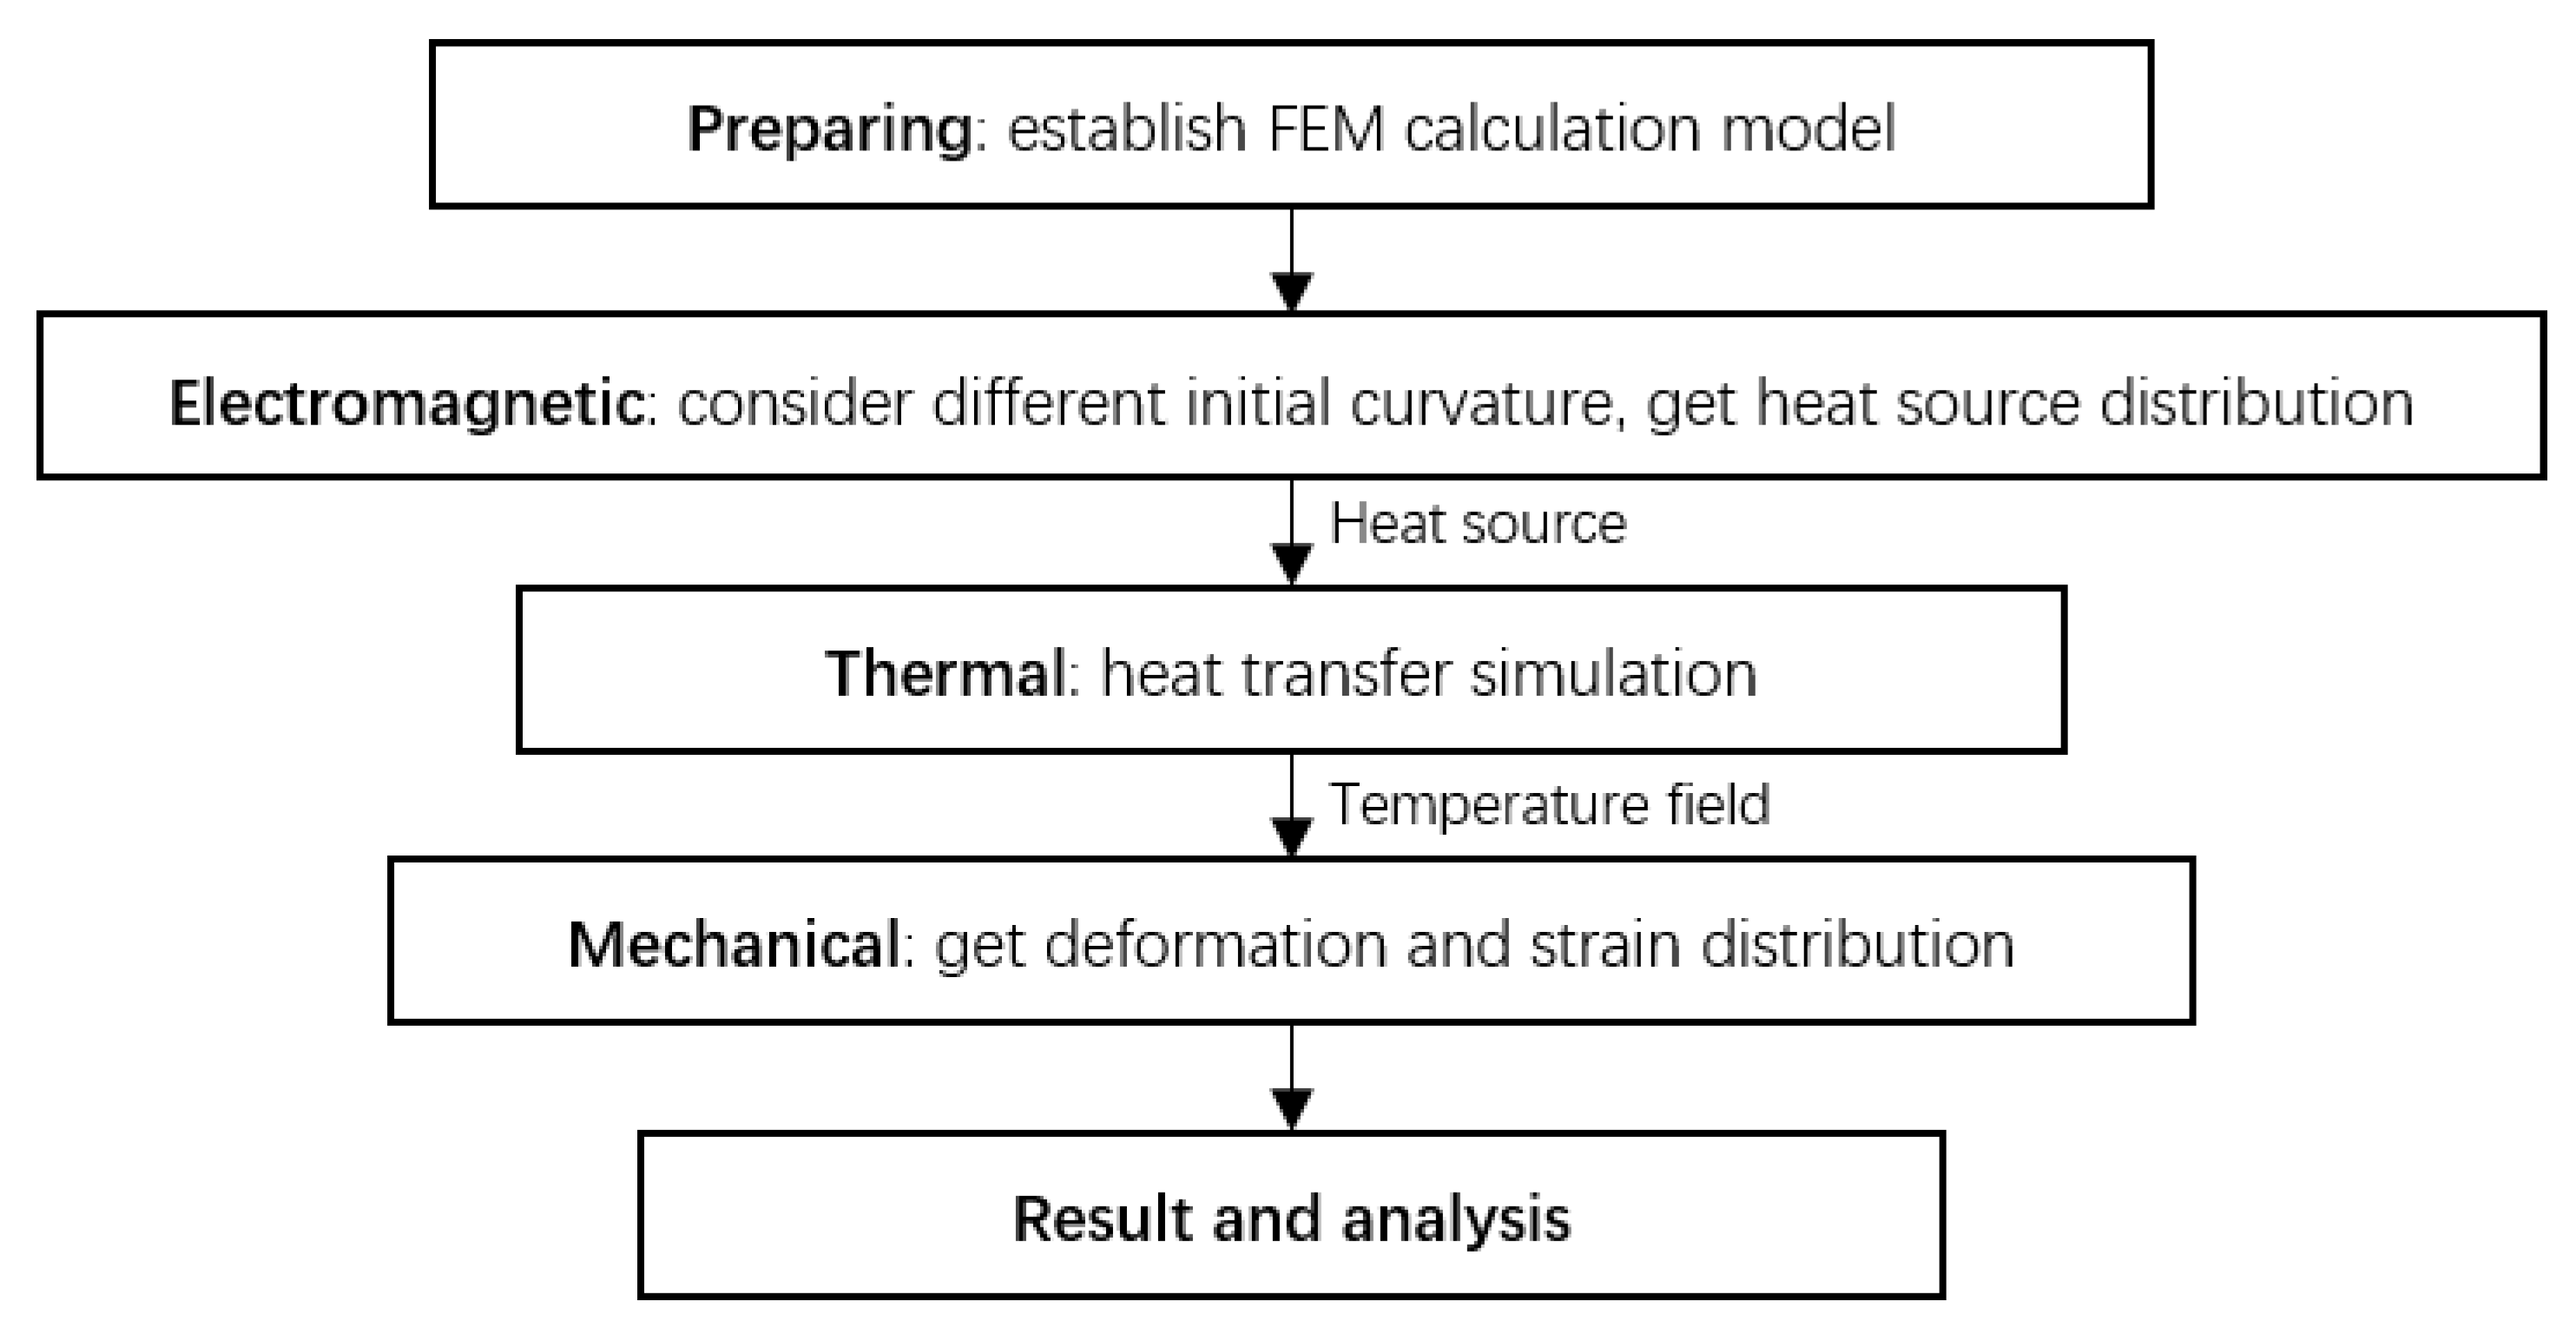
Figure 1. Main strategy for the calculation.
Applsci 10 02304 g001
Figure 2. The shape of the inductor coil: (a) coil model; (b) main dimensions of the coil; and (c) cross section of the coil.
Applsci 10 02304 g002
Figure 3. Finite element method (FEM) model for the electromagnetic calculation and the mesh of the air gap.
Applsci 10 02304 g003
Figure 4. FEM model for the mechanical and heat transfer calculation.
Applsci 10 02304 g004
Figure 5. Experimental platform.
Applsci 10 02304 g005
Figure 6. Heating line, moving direction, and view sections.
Applsci 10 02304 g006
Figure 7. Deformation of the plate: (a) FEM calculation result; (b) experimentally measured result.
Applsci 10 02304 g007
Figure 8. Deflection variation in the Z direction: (a) view section S B S B ; (b) view section S L S L .
Applsci 10 02304 g008
Figure 9. Normalized Joule heat generation.
Applsci 10 02304 g009
Figure 10. Heat generation in section S1–S1.
Applsci 10 02304 g010
Figure 11. Plastic strain distribution with different initial curvatures in section SB–SB: (a) out-of-plane strain in the X direction; (b) out-of-plane strain in the Y direction; (c) in-plane strain in the X direction; and (d) in-plane strain in the Y direction.
Applsci 10 02304 g011
Figure 12. The shape of the inductor: (a) main dimensions of the coil; (b) cross section of the coil.
Applsci 10 02304 g012
Figure 13. Heat source distribution comparison.
Applsci 10 02304 g013
Figure 14. Heat generation in section S2–S2.
Applsci 10 02304 g014
Figure 15. Plastic strain distribution with different coil width in section SB–SB: (a) out-of-plane strain in the X direction; (b) out-of-plane strain in the Y direction; (c) in-plane strain in the X direction; and (d) in-plane strain in the Y direction.
Applsci 10 02304 g015
Figure 16. Comparison of processing efficiency.
Applsci 10 02304 g016
Table 1. Material properties of the plate.
TemperatureYoung’s ModulusPoisson RatioHeat Expansion CoefficientYield StrengthDensitySpecific HeatHeat Conductivity Coefficient
(°C)(GPa) × 10 5 ( 1 / ° C ) (MPa) ( kg / m 3 ) ( J / ( kg ° C ) ) ( W / ( m ° C ) )
02060.2671.22357842450.3666.97
501960.291.25--464.665.21
2001960.3221.41637822498.157.38
2501860.2961.43--502.2654.91
3001860.2621.47--514.8253
4001660.241.541307802537.4247.92
4501570.2291.57--623.6445.83
5001570.2231.59--707.3543.53
6001350.2231.64119778281239.3
6501170.2231.66--904.0736.37
7001120.2231.67--967.6934.74
8001130.2231.6910977611026.3231.02
Table 2. Calculation schemes.
Initial Curvature K (m−1)Coil Width (m)Air Gap Increment (mm)Power (kW)Velocity (mm/s)
case 100.220655
case 20.250.221.51655
case 30.50.223.03655
case 40.750.224.55655
case 510.226.07655
Table 3. Maximum relative variation.
Thickness (mm)K = 0.25K = 0.5K = 0.75K = 1
out-of-plane strain in the X direction200.25050.31440.34630.3808
160.17670.2820.35370.4346
out-of-plane strain in the Y direction200.08450.17220.23840.2939
160.07230.14420.22330.2971
in-plane strain in the X direction200.09250.16990.26810.3476
160.11920.1650.23770.2426
in-plane strain in the Y direction200.05920.11640.15710.2032
160.0620.12660.18450.2433
Table 4. Calculation schemes.
Initial Curvature K (m−1)Coil Width (m)Air Gap Increment (mm)Power (kW)Velocity (mm/s)
case 600.060185
case 700.100305
case 800.140425
case 900.180545
case 1010.060.45185
case 1110.101.25305
case 1210.142.45425
case 1310.184.06545
Table 5. Maximum relative variation.
Thickness (mm)Width = 60 mmWidth = 100 mmWidth = 140 mmWidth = 180 mm
out-of-plane strain in the X direction200.05720.11470.09460.1136
160.04960.10760.12010.1301
out-of-plane strain in the Y direction200.08960.1130.17480.2657
160.06470.08830.13570.2255
in-plane strain in the X direction200.07120.12570.17230.2836
160.07570.14380.19770.2584
in-plane strain in the Y direction200.02220.04370.08210.1427
160.02270.05050.10580.1753