Abstract
The temperature of spatial structures under construction can have a significant non-uniform distribution induced by intense solar radiation. This temperature distribution affects the component assembly and results in closure difficulties, potentially causing safety hazards. A spatial grid structure model was designed and subjected to temperature field test under sunlight to study the temperature distribution of the structure and for comparison with numerical simulation methods. The distribution characteristics and the time-varying laws were analyzed based on the test data. Then, the ray-casting algorithm was introduced to analyze the shadow influence between members, so that the temperature distribution of the model was simulated accurately, which was verified by the test data. The results show that the spatial grid structure had an obvious non-uniform temperature distribution, with a maximum temperature rise of 16 °C when compared with ambient temperature and a maximum temperature difference between members of 11 °C. The variation laws were gained both from the test and the numerical simulation. The numerical simulation method proposed herein can be used to calculate the shadow distribution and the temperature field of the structure effectively. The research methods and conclusions can provide valuable references for thermal design, monitoring, and control of spatial grid structures.
1. Introduction
Spatial steel structures are widely used in various types of buildings (e.g., for industrial and housing purposes). This type of structure is sensitive to temperature effect due to its characteristics, which include a large number of hyperstatic members and a complex structural form. Especially during the construction period, continuous exposure to strong solar radiation can produce a significant non-uniform temperature effect, which directly affects the component assembling and may result in closure difficulties. Due to the residual temperature stress that is not fully released inside the structure, the actual stress status of the structure in use is different from that in the design state. The structure may then experience some potential safety problems [1]. Our previous studies showed that the temperature of an individual steel member can be 25 °C higher than the ambient temperature when subjected to strong solar radiation, and the temperature differences with the member itself can reach 17 °C, which can be more complicated in large-span structures [2]. In the general design of spatial structures, the value of the temperature load is determined according to atmospheric temperature without considering the influence of solar radiation, and only the uniform temperature effect is considered. This design cannot address the adverse effects of the non-uniform temperature field of the spatial structure under intense solar radiation. Therefore, to accurately analyze the non-uniform temperature effect in the construction period, we explore the temperature distribution of the spatial structure under solar radiation.
At present, few studies focus on the non-uniform temperature distribution of a spatial structure under solar radiation. Only a few scholars have performed some exploratory work on the temperature effects of steel structures. Tong et al. [3,4] proposed a theoretical calculation method for the non-uniform temperature distribution of a steel box girder by considering meteorological conditions. The accuracy of the results was verified by measuring the Hong Kong steel highway bridge. Kim et al. [5] performed a finite element analysis on the temperature field of the curved steel box girder bridge to study the influence of different azimuth angles and the sectional dimension of the box girder on the temperature field. Kromanis et al. [6] carried out long-term monitoring and identification of both the transverse temperature distribution and the temperature distribution along the depth of a steel box girder. Yarnold et al. [7] performed benchmark studies, along with long-term monitoring of a long-span steel tied arch bridge. Westgate et al. [8,9] explored temperature effects by simulating the transient thermal and quasistatic response of a steel bridge with separated finite element models of the bridge and suspension cables. Our research team [10,11,12] analyzed the temperature field changes of the reflective surface of a steel radio telescope combined with the time-varying environmental conditions, and we were aware of the temporal and spatial characteristics of the temperature field. The results show that the non-uniform temperature distribution has an obvious influence on the working accuracy of the telescope. Liu et al. [13,14] tested the solar radiation transmission coefficients of various materials, including glass, membrane, and fire-retardant coating, which provided experimental data for related parameters of numerical simulation. Qian et al. [15] and Liu et al. [16] carried out related studies on the numerical model and the simplified analysis methods of the temperature effects of steel members under solar radiation. Liu et al. [17,18,19,20] studied the distribution of residual stress and the deformation of a spatial structure under construction. Through the field measurement and simulation, the adverse effects of the non-uniform temperature effect were demonstrated.
The spatial structure often has various forms with many members. Not only is the temperature field of the member non-uniform, but the temperature between members of different regions also varies. With the change in solar azimuth, a complex shadowing relationship exists between adjacent members. At present, the numerical simulation methods used in the temperature field analysis of the spatial structures contain some simplifications and assumptions without the validation of test data. They do not consider the complex shadowing relationship between steel members. As a result, the numerical simulation method needs to be improved.
The temperature field test of a spatial grid structure model was designed and performed to study the temperature distribution of different members and to obtain the features of the non-uniform temperature distribution. The thermal boundary conditions, such as solar radiation, ambient temperature, and wind speed, were also monitored in real-time. The numerical simulation method, used to consider the influence of shadowing, was proposed and verified based on the measured data. This can provide the basis for testing and numerical method references for the thermal analysis of spatial grid structure while considering the influence of the temperature field induced by solar radiation.
2. Experimental Programs of Temperature Field Test of Spatial Grid Structure
2.1. Design of Test Model
To obtain more reliable test data, the test was carried out in an area that is open, flat, and well ventilated. There was sufficient sunlight free from the shadowing of surrounding buildings and trees. Because the double-layer grid structure is the most commonly used style of spatial structure, the test model was designed as a double-layer triangle grid structure using welding balls. Three angular points of the bottom chord were provided with cross plate supports. To facilitate the test, the test model was fixed onto an assembled triangular support frame, which was fixed onto the concrete bases. The detailed dimensions of the model are shown in Figure 1. The plane projection of the test model was an equilateral triangle with a side length of 4.5 m. The grid dimensions of the top and bottom chords were all 1.5 m, and the distance between the top and bottom chords was 0.7 m. The steel members were all φ60 mm × 3 mm round tubes and the welding ball joint WS160 mm × 6 mm was used. This solar temperature field test was conducted in Weihai, China, in August 2016.
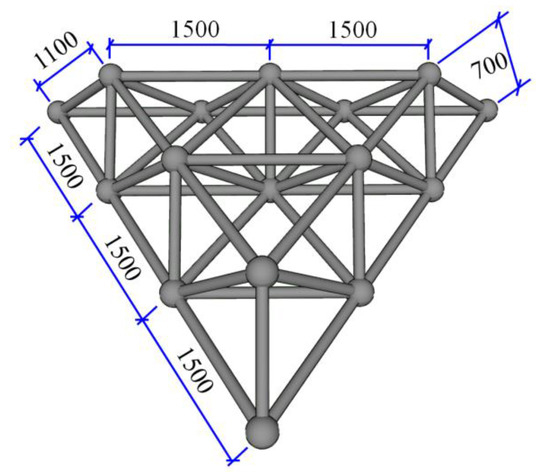
Figure 1.
The size of the spatial grid model (mm).
2.2. Test Content and Equipment
The test content of the spatial grid model included the temperature at different moments throughout the day and thermal boundary conditions, such as solar radiation intensity, ambient temperature, and wind speed, which directly influence the temperature distribution of the structure. The test equipment that was used is shown in Table 1. The measuring system was consisting of different monitoring sensors and data acquisition box. PT1000 temperature sensors were used in the temperature monitoring of the steel members. An atmosphere temperature sensor, a solar power sensor, and a three-cup anemometer were used for the monitoring of the thermal boundary conditions. The temperature acquisition box was used for real-time test data acquisition.

Table 1.
List of test equipment.
2.3. Arrangement of Test Points
Based on the results of our previous study of steel members [2], the temperature of each steel member along the length direction is constant, and the measuring points could only be arranged at the mid-span of the member. Since the temperature of the small-sized round pipe does not significantly change along the circumference of the cross-section, only two measuring points were arranged at the top and bottom of the cross-section. Due to the number of members, only one steel member of each spatial angle was selected for monitoring to reduce costs. For the bottom chord and the web member, the temperature measuring points were placed on the members that were easily affected by the shadowing of the surrounding members. In total, 15 member bars were selected for temperature monitoring in the model test, including the three top chords, numbered U1–U3, six web members, numbered W1–W6, and six bottom chords, numbered B1–B6, with a total of 30 temperature measuring points. The layout of the specific measuring points is shown in Figure 2. The overall layout of the spatial grid structure model test is shown in Figure 3.
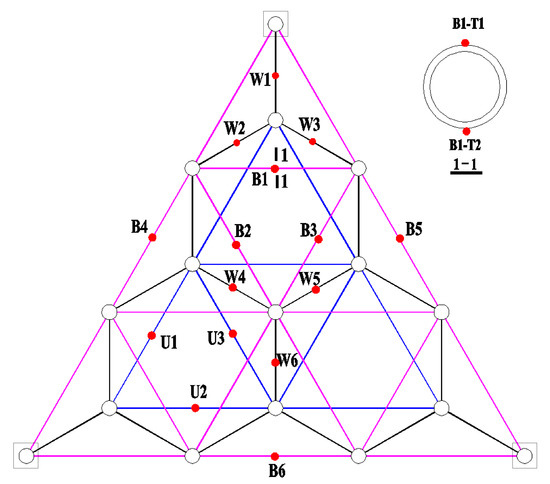
Figure 2.
The arrangement of the measuring points of the test model. Black boxes indicate the cross plate supports.
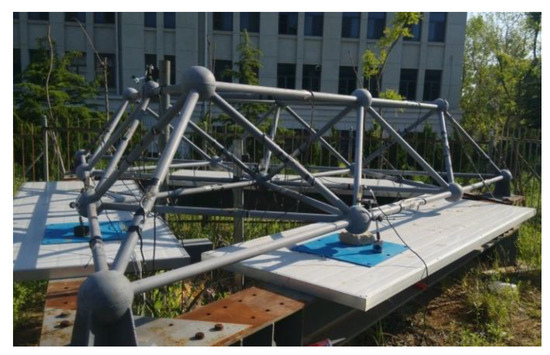
Figure 3.
The overall layout of the spatial grid structure model.
3. Analysis of Temperature Field Test Results
3.1. Temperature Field Distribution of Structure Model
The experiment was performed continuously for one month. Due to the significant amount of test data, the highest temperature was measured on 16 August, and it was taken as the representative to analyze the temperature distribution under solar radiation. Figure 4 shows the monitoring thermal boundary parameters. The maximum value of the ambient temperature is 32 °C at 12:00. The strong solar radiation is concentrated during 8:00–17:00, and the maximum radiation intensity is 1276 at 13:00. The wind speed is relatively small, and the highest wind speed is only 0.6 throughout the day.
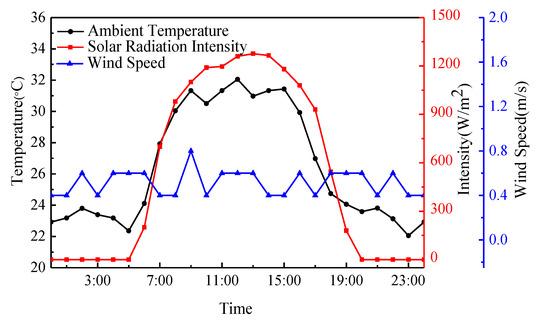
Figure 4.
The variation curves of thermal boundary parameters.
The average temperature of the top and the bottom measuring points was taken as the temperature of the member bar. The temperature variation curves of the top chord, the bottom chord, and the web member are shown in Figure 5. In the figure, the temperature variation laws of the measuring points of chord members are the same, i.e., the maximum temperature value of the day was reached at around 12:00. The temperature of the top chord has a maximum temperature of 43 °C and a maximum temperature rise of 12 °C compared with the ambient temperature. The temperatures of the peripheral members of the bottom chords are higher than those of the internal member bars, with a maximum temperature of 47 °C and a maximum temperature rise of 16 °C. The overall temperature variation law of each web member is different from the others, and the web members with different space angles reach the maximum temperature when the solar beam irradiates vertically. Therefore, the maximum temperatures of the web members appear at different moments, around 11:00 or 14:00, respectively, with a maximum temperature of 42 °C and a maximum temperature rise of 11 °C. From the overall temperature field of the structure, the maximum temperature difference between the web member and the chord member reached 11 °C, and there was an obvious non-uniform temperature field of the spatial grid structure.
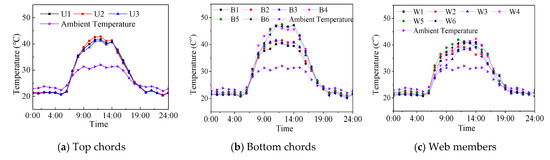
Figure 5.
The temperature variation curves of different structural members.
3.2. Comparison of Temperature Characteristics of Different Type Members
The steel members of the spatial grid structure received different levels of solar radiation due to the difference in space angle, and they were also affected by the shadows of the surrounding members. This directly resulted in the generation of a non-uniform temperature field of the spatial structure. The following is a comparative analysis of the temperature field distribution of the chord members and web members with different space angles or with the same space angle but different positions. Figure 6 shows the all-day temperature difference variation curves of various members at corresponding measuring points. Figure 6a shows the temperature difference variation of the three top chords (U1–U3), indicating that the all-day temperature differences of the top and bottom measuring points are small, and the maximum temperature difference of each moment does not exceed 2.0 °C. Figure 6b shows the all-day temperature difference variation of the bottom chords at the inner ring (B1–B3) at the corresponding measuring points. Because the bottom chord was affected by the shadowing of the top chord and the web member, the temperature difference between measuring points was slightly larger than that of the top chord, and the maximum value throughout the day was around 3.1 °C. Therefore, we considered that the temperature variation law of the horizontal chords is the same regardless of in-plane angle variation. Figure 6c shows the all-day temperature difference variation of the web members in different space angles (W1–W3) at the corresponding measuring points, with the maximum temperature difference throughout the day being around 7.8 °C. These results indicate that the space angle variation has a significant impact on the temperature field of the web member. Figure 6d shows the all-day temperature difference variation of the web member with the same space angle (W1 and W6) at the corresponding measuring points. The maximum temperature difference of the day was only 2.9 °C, which was mainly caused by shadowing between members.
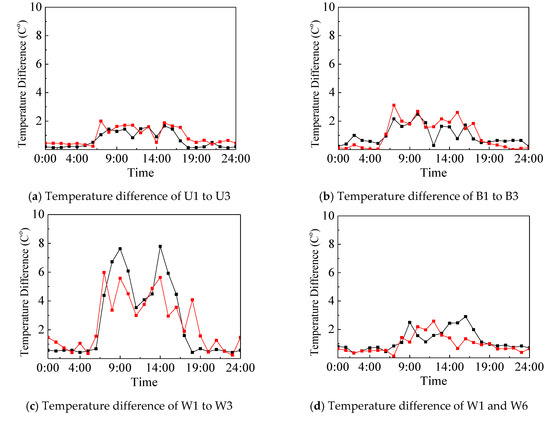
Figure 6.
All-day temperature difference variation curves of various members. Red and black lines indicate the top and bottom test points, respectively.
4. Numerical Simulation of Temperature Field of Spatial Grid Structure
4.1. Finite Element Model
According to the experimental design of the spatial grid model, the ANSYS software (ANSYS Inc., Canonsburg, PA, USA) thermal analysis module was used to establish the finite element model for the analysis of the structural temperature field. The assembled triangular support frame was not considered in the numerical model. In the thermal analysis, the three-dimensional shell element, Shell57, was used to simulate the heat conduction of the steel member. The surface effect element, Surf152, which covered the heat conduction element, was used to simulate the convective heat transfer between the structure and the surrounding environment. The thermal radiation element, Link31, was used to simulate the radiation with the sky and ground. Appropriate mesh generation can ensure the perfect combination of the result accuracy and computation efficiency. Due to the large number of members of the test model, the grid sensitivity analysis determined that the mesh size of the finite-element model was 0.1 m. Thermal boundary parameters including solar radiation intensity, ambient temperature, and wind speed measured on 16 August were used as the experimental basis for numerical simulation.
The flow chart of the temperature field simulation is shown in Figure 7. Heat transfer of the spatial grid model occurred through heat conduction, convection, and radiation. Heat conduction was calculated with the material properties by the software automatically. The material properties, i.e., the specific heat and thermal conductivity, were 465 J/kg∙K and 49.8 W/m∙K, respectively [21]. The measured ambient temperature and wind speed were used in heat convection calculation. Heat radiation is calculated according to the measured solar radiation intensity and shadow analysis of members is also involved. The numerical simulation method of the non-uniform temperature field under solar radiation, was carefully described in our previous studies [2]. The numerical simulation covered every hour of 16 August 2016.
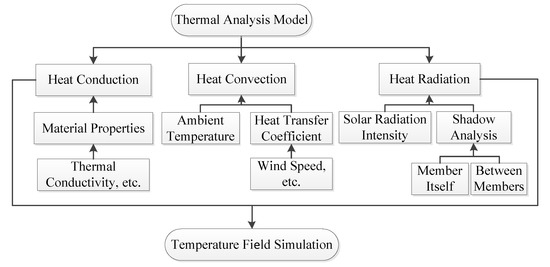
Figure 7.
Flow chart of the temperature field simulation under solar radiation.
4.2. Shadow Analysis of Spatial Grid Structure
The solar temperature field analysis of the spatial grid structure considers the shadowing not only of the steel member itself, but also among the surrounding steel members. The shadowing algorithm of the member itself was described carefully in our previous studies [11], thus it is not introduced in this paper. The shadowing among the surrounding steel members can be judged by the ray-casting algorithm based on computer graphics [22,23]. Sunlight incidence direction was calculated using related parameters and then projection in the sunlight incidence direction is solved. Using coordinate transformation and depth detection, the related position relation of each shell element was recorded. Then, the shadow occlusion relationship of each element was identified. The program concerning the numerical analysis of the shadowing among members of the spatial grid structure under sunlight was compiled. It directly contributed to improving the accuracy of the numerical simulation method of the solar temperature field. Figure 8 shows the specific calculation process of shadow analysis.
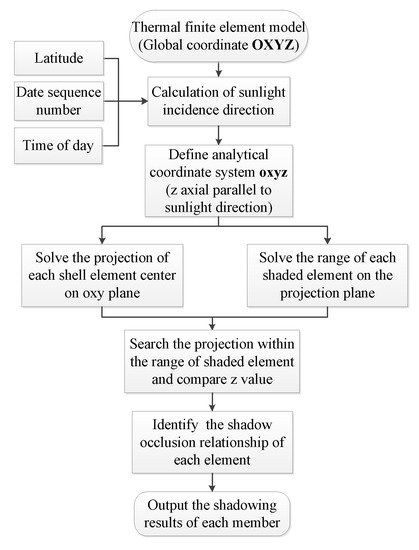
Figure 8.
Flow chart of shadow analysis.
Figure 9 shows the numerical results of the shadow distribution of each member at representative moments of 16 August. The elements that are directly irradiated by sunlight are shown in red and elements blocked by other elements are shown in blue. As shown in Figure 9, the web member and bottom chord are most affected by shadows. When the solar elevation angle is small in the early morning or late afternoon, the shadow range is wide and the shadow occlusion is obvious. When the solar elevation angle is larger at noon, the shadow range becomes smaller, which gradually changes at each moment. The variation law of the simulation shadow is in good agreement with that of the actual situation.
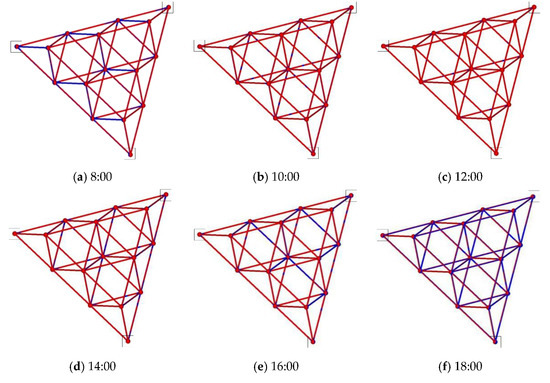
Figure 9.
Shadow distribution of the spatial grid structure model at representative moments. Black boxes indicate cross plate supports.
4.3. Comparative Analysis of Numerical Results and Test Results
The solar temperature field of the test model was subject to the numerical simulation. Through the comparative analysis, the accuracy of the numerical simulation method of the structural non-uniform temperature field was verified by comparison with the measured data. Figure 10 shows the comparison between the numerical simulation results and the measured data of the solar temperature field at representative moments. The comparison of the temperature distribution showed that the numerical results have a distribution law similar to that of the measured results, and the extreme temperatures are also relatively similar. The temperatures of the top chords were almost the same. The temperature of the internal bottom chords was slightly lower than that of other chord members affected by the shadowing of the top members. The temperature of the web member was significantly lower than that of the chord member and the web members in different space angles were also significantly different. Due to the effects of the reflected radiation, the test temperatures of the peripheral bottom chords were higher than the numerical results. The maximum temperature of the structure model appeared at node position in the numerical results, which is mainly because the welding ball node had a larger surface area and was more evenly radiated by sunlight.
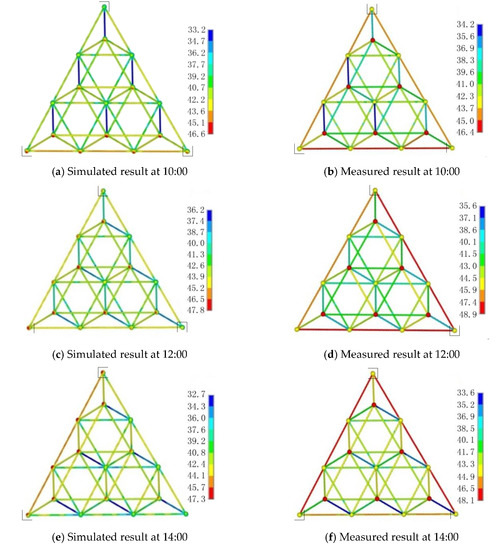
Figure 10.
Temperature distribution of the spatial grid structure model. Black boxes indicate cross plate supports.
Figure 11 compares the temperature field simulation value and the measured value at the representative measuring points, including the top and bottom chords and web members. From the results, the numerical results of each measuring point match with the measured results and the temperature variation trends throughout the day are the same. The numerical results at night were similar to the measured results, and the maximum temperatures of the day appear were also similar, but the numerical simulation results were slightly larger than the measured results.
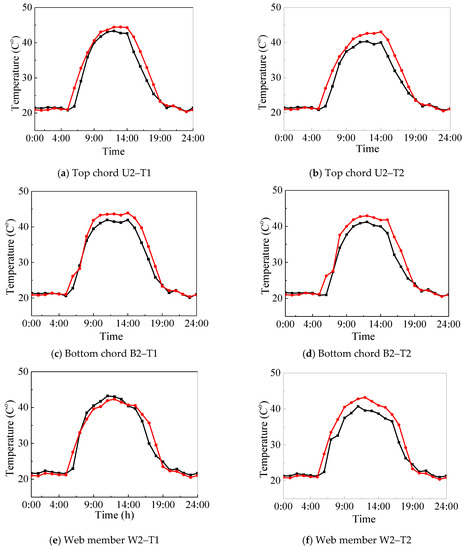
Figure 11.
Comparison between the simulation value and the measured value at the measuring point. Red and black lines indicate the simulated and measured results, respectively.
Figure 12 is the all-day average error rate curve of the top and bottom chords and web members at all measuring points. From the results, the simulated temperature of each member at night has a small discrepancy when compared with the measured result, and the maximum error rate is only 3.6%. Except for the sunrise and sunset moments, the error rates of the simulated and the measured values at daytime are also maintained at a low level with an average error rate of 5.3%. The average error rate of the web member is slightly larger than that of the chord member. At sunrise and sunset, because the intensity of solar radiation and the environmental temperature both vary significantly, the error rates increase, with a maximum value of 21%. Besides, the simulated temperature is the result after the thermal equilibrium, but the measured result is the directly measured temperature at the measuring moment. In summary, the simulated temperature field distribution matches well with the measured result, which proves that this numerical simulation method is reliable and effective.
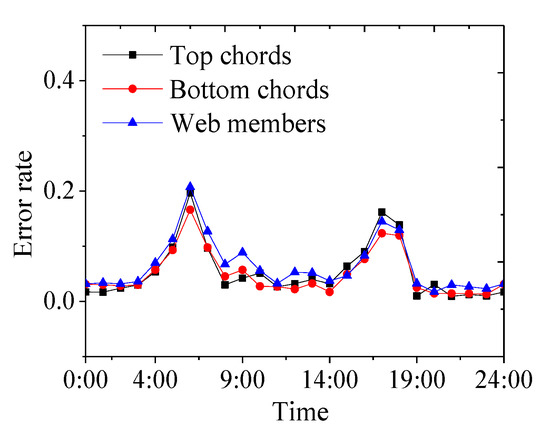
Figure 12.
Average error rate curves of different type members.
5. Conclusions
In this paper, we present a study of the non-uniform temperature field of a spatial grid structure under solar radiation using a combination of a structure model experiment and numerical simulation. Through the statistical analysis of the measured results and the comparison between the numerical results and the measured data, we drew the following conclusions:
- (1)
- The spatial grid structure model has a non-uniform temperature distribution. The maximum temperature is 47 °C, the difference between maximum temperatures and the ambient temperature is 16 °C, and the temperature difference is a maximum of 11 °C. These results are expected to be higher for intense solar radiation.
- (2)
- The temperature variations of the chord members are similar, regardless of their in-plane angle. The space angle has a significant influence on the temperature field of web members, but the web members with the same space angle and different positions are similar.
- (3)
- The ray-casting algorithm is introduced to the numerical simulation method for the non-uniform temperature field of the spatial grid structure, which can accurately calculate the real-time shadow distribution of the spatial grid structure.
- (4)
- The numerical simulation results of the non-uniform temperature field match well with the measured results. The average error rate throughout the daytime is only 5.3%. This proves that the numerical method for the temperature field analysis of the spatial grid structure is reliable and effective.
Author Contributions
Conceptualization, D.C.; data curation, D.C.; funding acquisition, J.L.; investigation, W.X.; project administration, H.Q.; resources, H.W.; and software, D.C. All authors have read and agreed to the published version of the manuscript.
Funding
This study was supported by the National Natural Science Foundation of China (Grant Nos. 51808168 and 51678191) and the Fundamental Research Funds for the Central Universities (Grant No. HIT.NSRIF.2019079).
Conflicts of Interest
The authors declare no conflicts of interest.
References
- Liu, H.; Liao, X.; Chen, Z.; Zhang, Q. Thermal Behavior of Spatial Structures under Solar Irradiation. Appl. Therm. Eng. 2015, 87, 328–335. [Google Scholar] [CrossRef]
- Chen, D.; Qian, H.; Wang, H.; Chen, Y.; Fan, F.; Shen, S. Experimental and numerical investigation on the non-uniform temperature distribution of thin-walled steel members under solar radiation. Thin Wall Struct. 2018, 122, 242–251. [Google Scholar] [CrossRef]
- Tong, M.; Tham, L.G.; Au, F.T.K. Numerical Modeling for Temperature Distribution in Steel Bridges. Comput. Struct. 2001, 79, 583–593. [Google Scholar] [CrossRef]
- Tong, M.; Tham, L.G.; Au, F.T.K. Extreme Thermal Loading on Steel Bridges in Tropical Region. J. Bridge Eng. 2002, 7, 357–566. [Google Scholar] [CrossRef]
- Kim, S.; Cho, K.; Won, J.; Kim, J. A Study on Thermal Behaviour of Curved Steel Box Girder Bridges Considering Solar Radiation. Arch. Civ. Mech. Eng. 2009, 9, 59–76. [Google Scholar] [CrossRef]
- Kromanis, R.; Kripakaran, P.; Harvey, B. Long-term structural health monitoring of the Cleddau bridge: Evaluation of quasi-static temperature effects on bearing movements. Struct. Infrastruct. Eng. 2016, 12, 1342–1355. [Google Scholar] [CrossRef]
- Yarnold, M.T.; Moon, F.L. Temperature-based structural health monitoring baseline for long-span bridges. Eng. Struct. 2015, 86, 157–167. [Google Scholar] [CrossRef]
- Westgate, R.; Koo, K.Y.; Brownjohn, J. Effect of Solar Radiation on Suspension Bridge Performance. J. Bridge Eng. 2015, 20, 04014077. [Google Scholar] [CrossRef]
- Westgate, R.J.; Brownjohn, J.M.W. Development of a Tamar Bridge Finite Element Model. In Dynamics of Bridges, Proceedings of the Society for Experimental Mechanics Series, Jacksonville, FL, USA, 1–4 February 2010; Springer: New York, NY, USA, 2011. [Google Scholar]
- Fan, F.; Jin, X.; Shen, S. Effect of non-uniform solar temperature field on cable-net structure of reflector of large radio telescope-FAST. Adv. Struct. Eng. 2009, 12, 503–512. [Google Scholar] [CrossRef]
- Chen, D.; Qian, H.; Wang, H.; Zhang, G.; Fan, F.; Shen, S. Non-uniform temperature field measurement and simulation of a radio telescope’s main reflector under solar radiation. Appl. Therm. Eng. 2017, 111, 1330–1341. [Google Scholar] [CrossRef]
- Chen, D.; Wang, H.; Qian, H.; Zhang, G.; Shen, S. Solar cooker effect test and temperature field simulation of radio telescope subreflector. Appl. Therm. Eng. 2016, 109, 147–154. [Google Scholar] [CrossRef]
- Liu, H.; Li, B.; Chen, Z.; Zhou, T.; Zhang, Q. Solar Radiation Properties of Common Membrane Roofs Used in Building Structures. Mater. Des. 2016, 105, 268–277. [Google Scholar] [CrossRef]
- Liu, H.; Chen, Z.; Chen, B.; Xiao, X.; Wang, X. Studies on the Temperature Distribution of Steel Plates with Different Paints under Solar Radiation. Appl. Therm. Eng. 2014, 71, 342–354. [Google Scholar] [CrossRef]
- Liu, H.; Chen, Z.; Zhou, T. Theoretical and Experimental Study on the Temperature Distribution of H-shaped Steel Members under Solar Radiation. Appl. Therm. Eng. 2012, 37, 329–335. [Google Scholar] [CrossRef]
- Chen, D.; Wang, H.; Qian, H.; Li, X.; Fan, F.; Shen, S. Experimental and numerical investigation of temperature effects on steel members due to solar radiation. Appl. Therm. Eng. 2017, 127, 696–704. [Google Scholar] [CrossRef]
- Liu, H.; Chen, Z.; Han, Q.; Chen, B.; Bu, Y. Study on the thermal behavior of aluminum reticulated shell structures considering solar radiation. Thin Wall Struct. 2014, 85, 15–24. [Google Scholar] [CrossRef]
- Zhao, Z.; Liu, H.; Chen, Z. Field Monitoring and Numerical Analysis of Thermal Behavior of Large Span Steel Structures under Solar Radiation. Adv. Steel Constr. 2017, 13, 190–205. [Google Scholar]
- Zhao, Z.; Zhu, H.; Liu, H.; Chen, Z. Thermal and integral lifting analysis of a lattice shell lighting roof based on genetic algorithm and probabilistic design. J. Constr. Steel Res. 2015, 112, 208–220. [Google Scholar] [CrossRef]
- Zhao, Z.; Liu, H.; Chen, Z. Thermal behavior of large-span reticulated domes covered by ETFE membrane roofs under solar radiation. Thin Wall Struct. 2017, 115, 1–11. [Google Scholar] [CrossRef]
- Albert, G.; Michael, B. Thermal Design and Thermal Behavior of Radio Telescopes and Their Enclosures; Springer: Berlin/Heidelberg, Germany, 2010; pp. 55–159. [Google Scholar]
- Levoy, M. Display of surface from volume data. IEEE Comput. Graph 1988, 8, 29–37. [Google Scholar] [CrossRef]
- Carboni, B.; Lacarbonara, W. A three-dimensional continuum approach to the thermoelastodynamics of large-scale structures. Eng. Struct. 2012, 40, 155–167. [Google Scholar] [CrossRef]


© 2020 by the authors. Licensee MDPI, Basel, Switzerland. This article is an open access article distributed under the terms and conditions of the Creative Commons Attribution (CC BY) license (http://creativecommons.org/licenses/by/4.0/).