Experimental Study on the Micromorphology and Strength Formation Mechanism of Epoxy Asphalt During the Curing Reaction


Abstract
Featured Application
Abstract
1. Introduction
2. Materials and Methods
2.1. Materials
2.2. Epoxy Asphalt Preparation
2.3. Tensile Test
2.4. Fourier Transform Infrared Spectroscopy
2.5. Laser Scanning Confocal Microscopy
2.6. Scanning Electron Microscopy
3. Results and Discussion
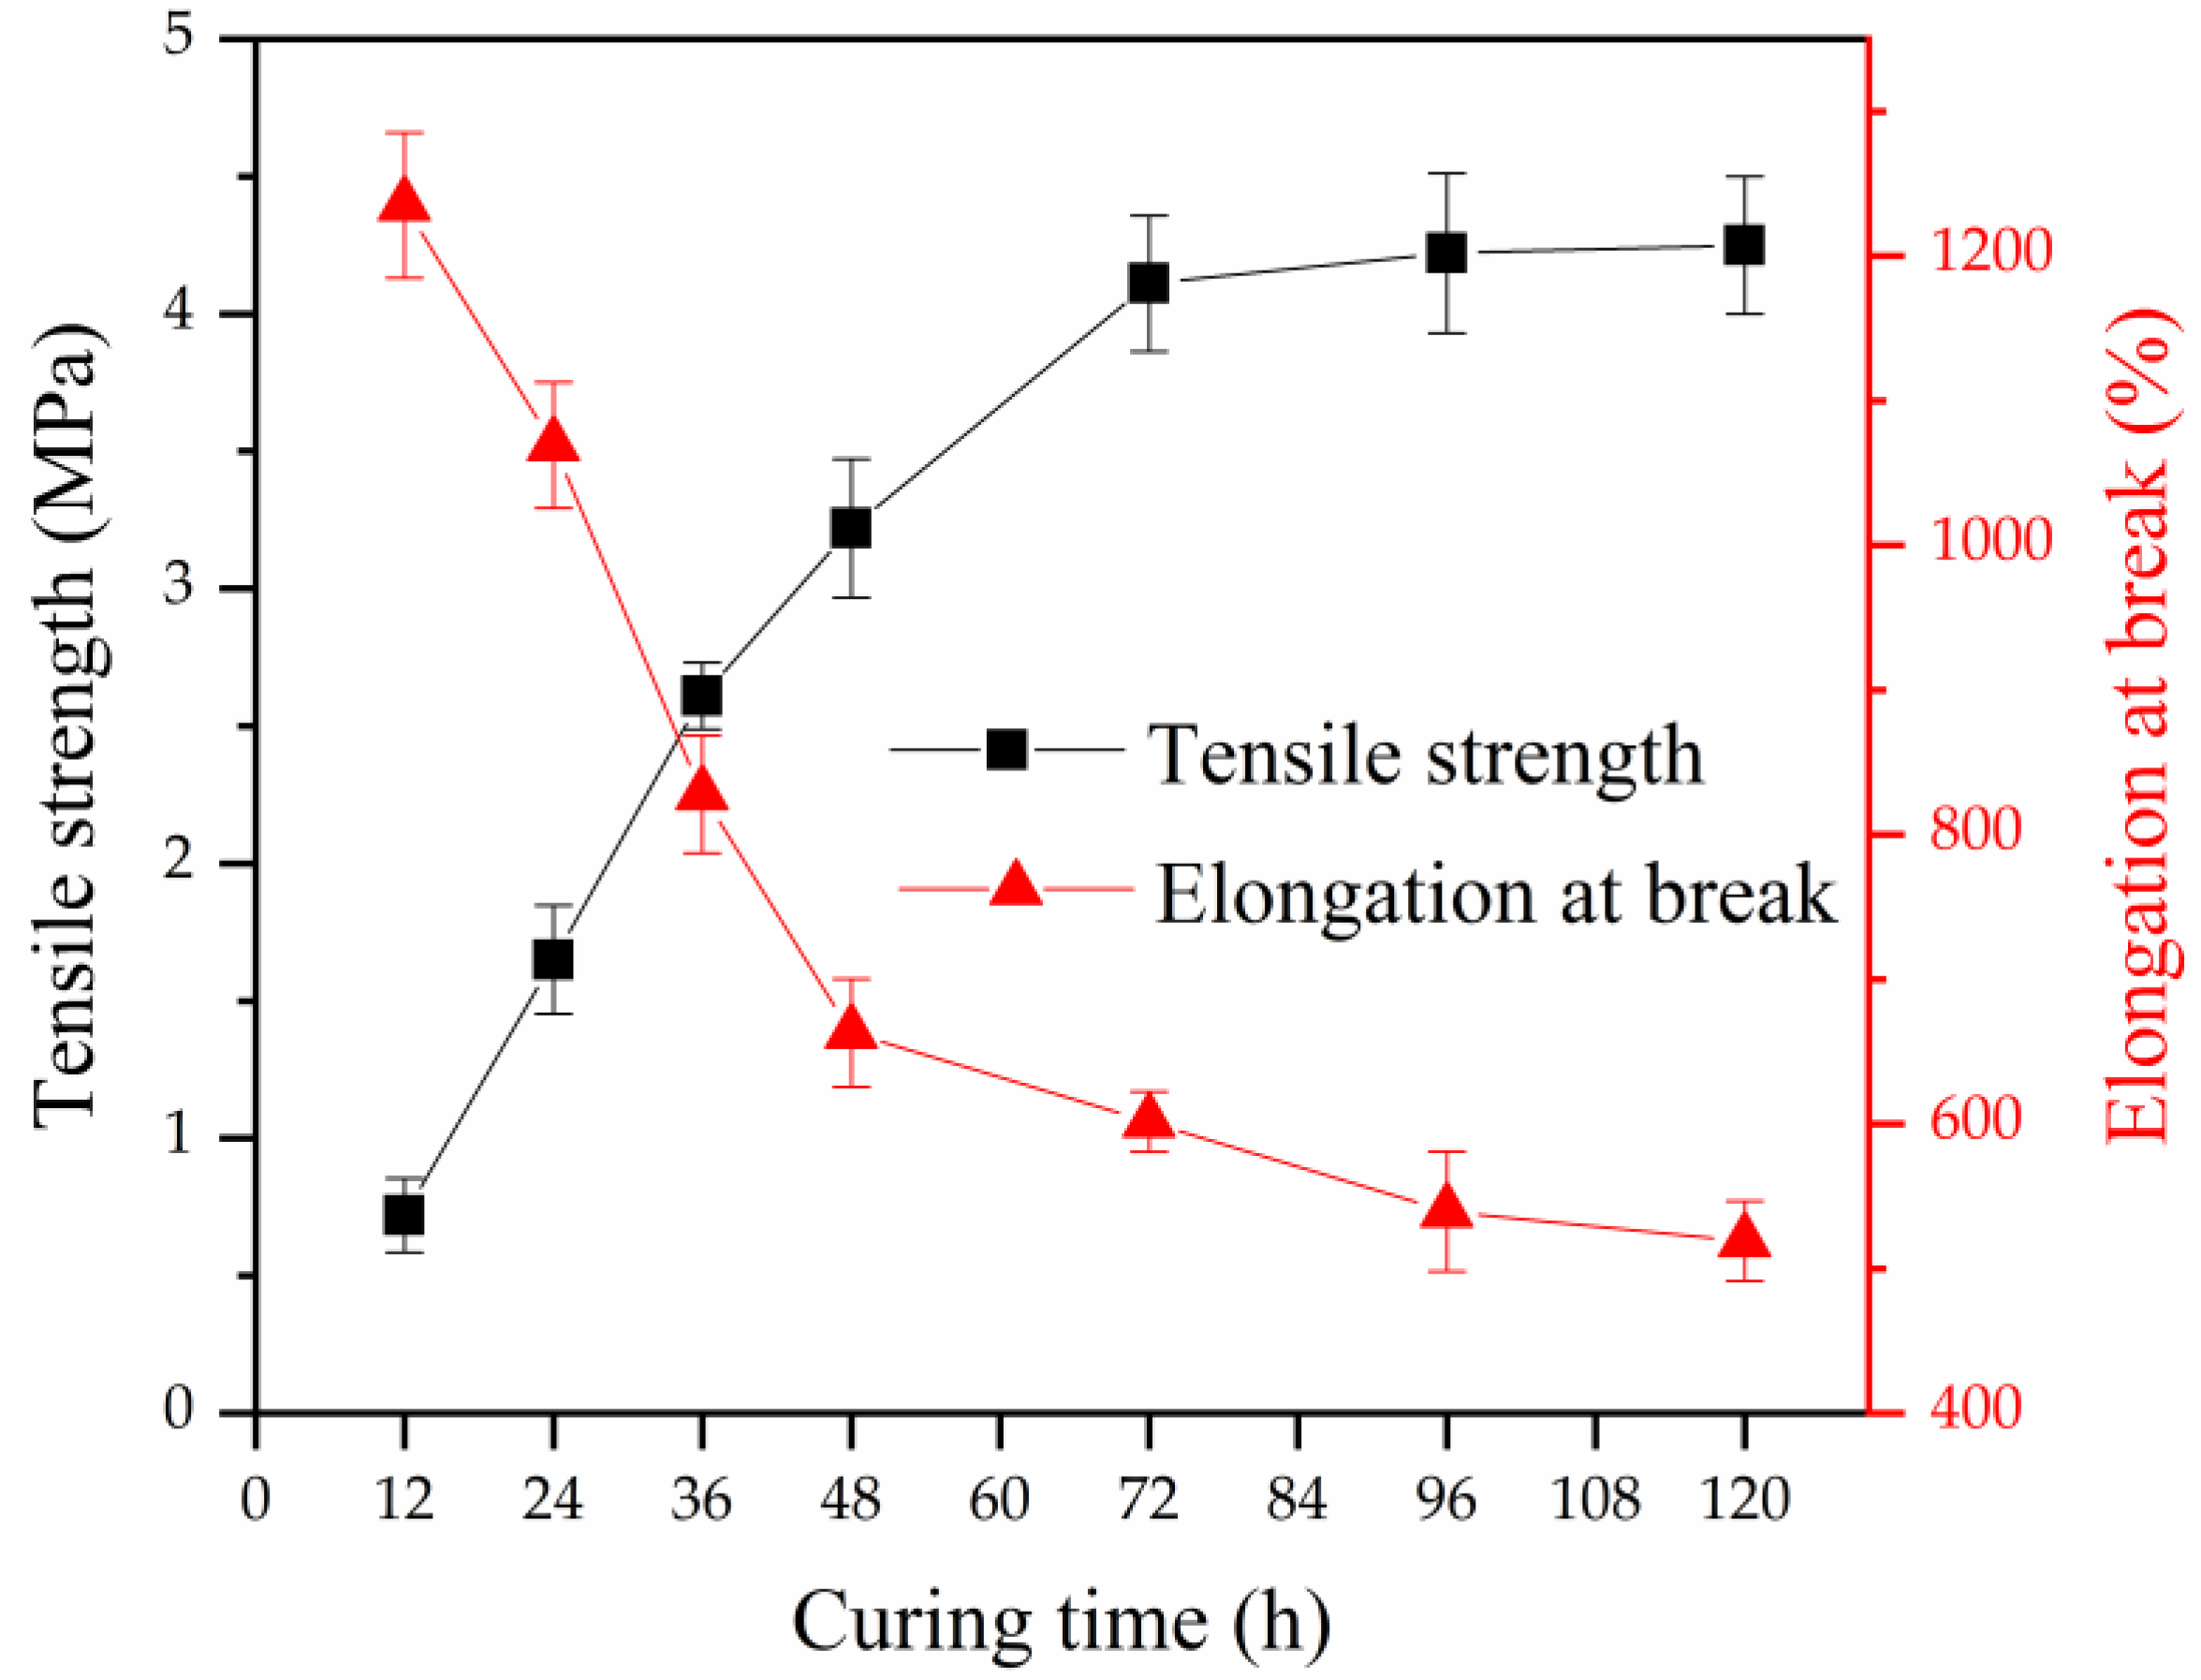
3.1. Mechanical Properties of Epoxy Asphalt During the Curing Process
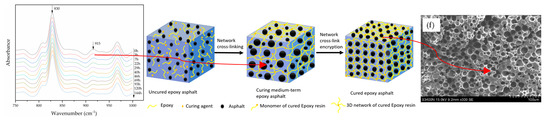
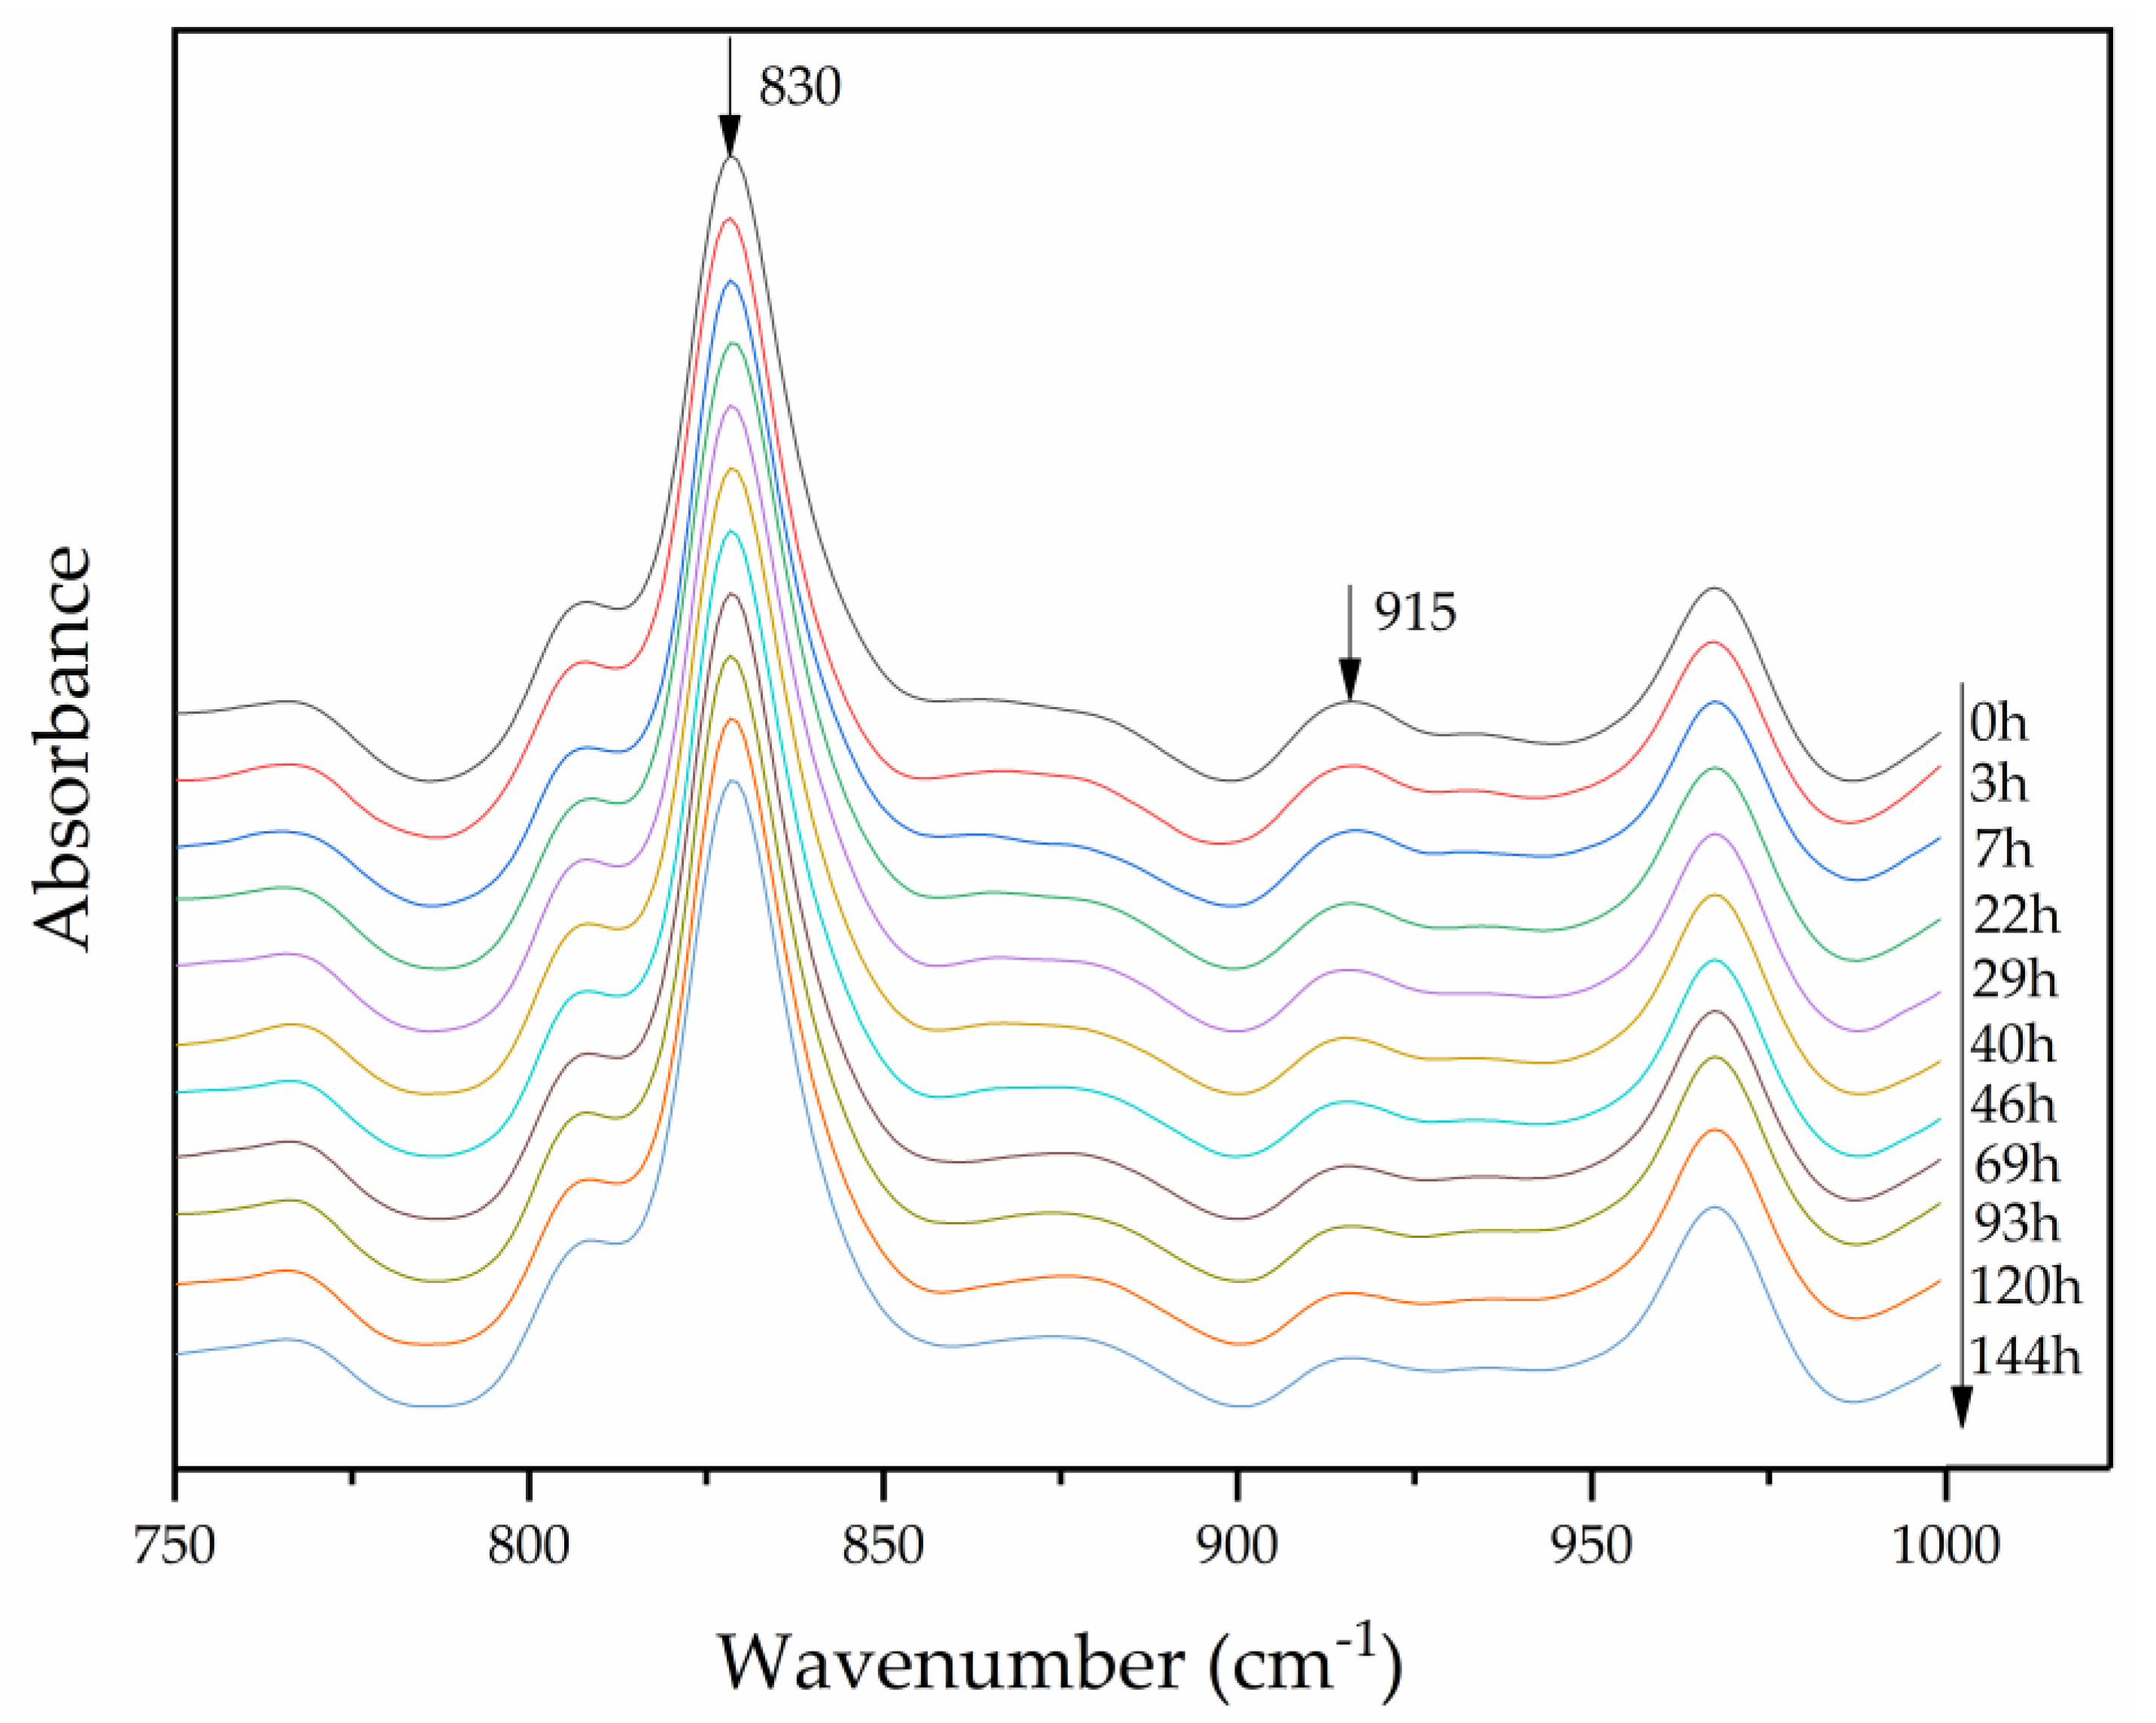
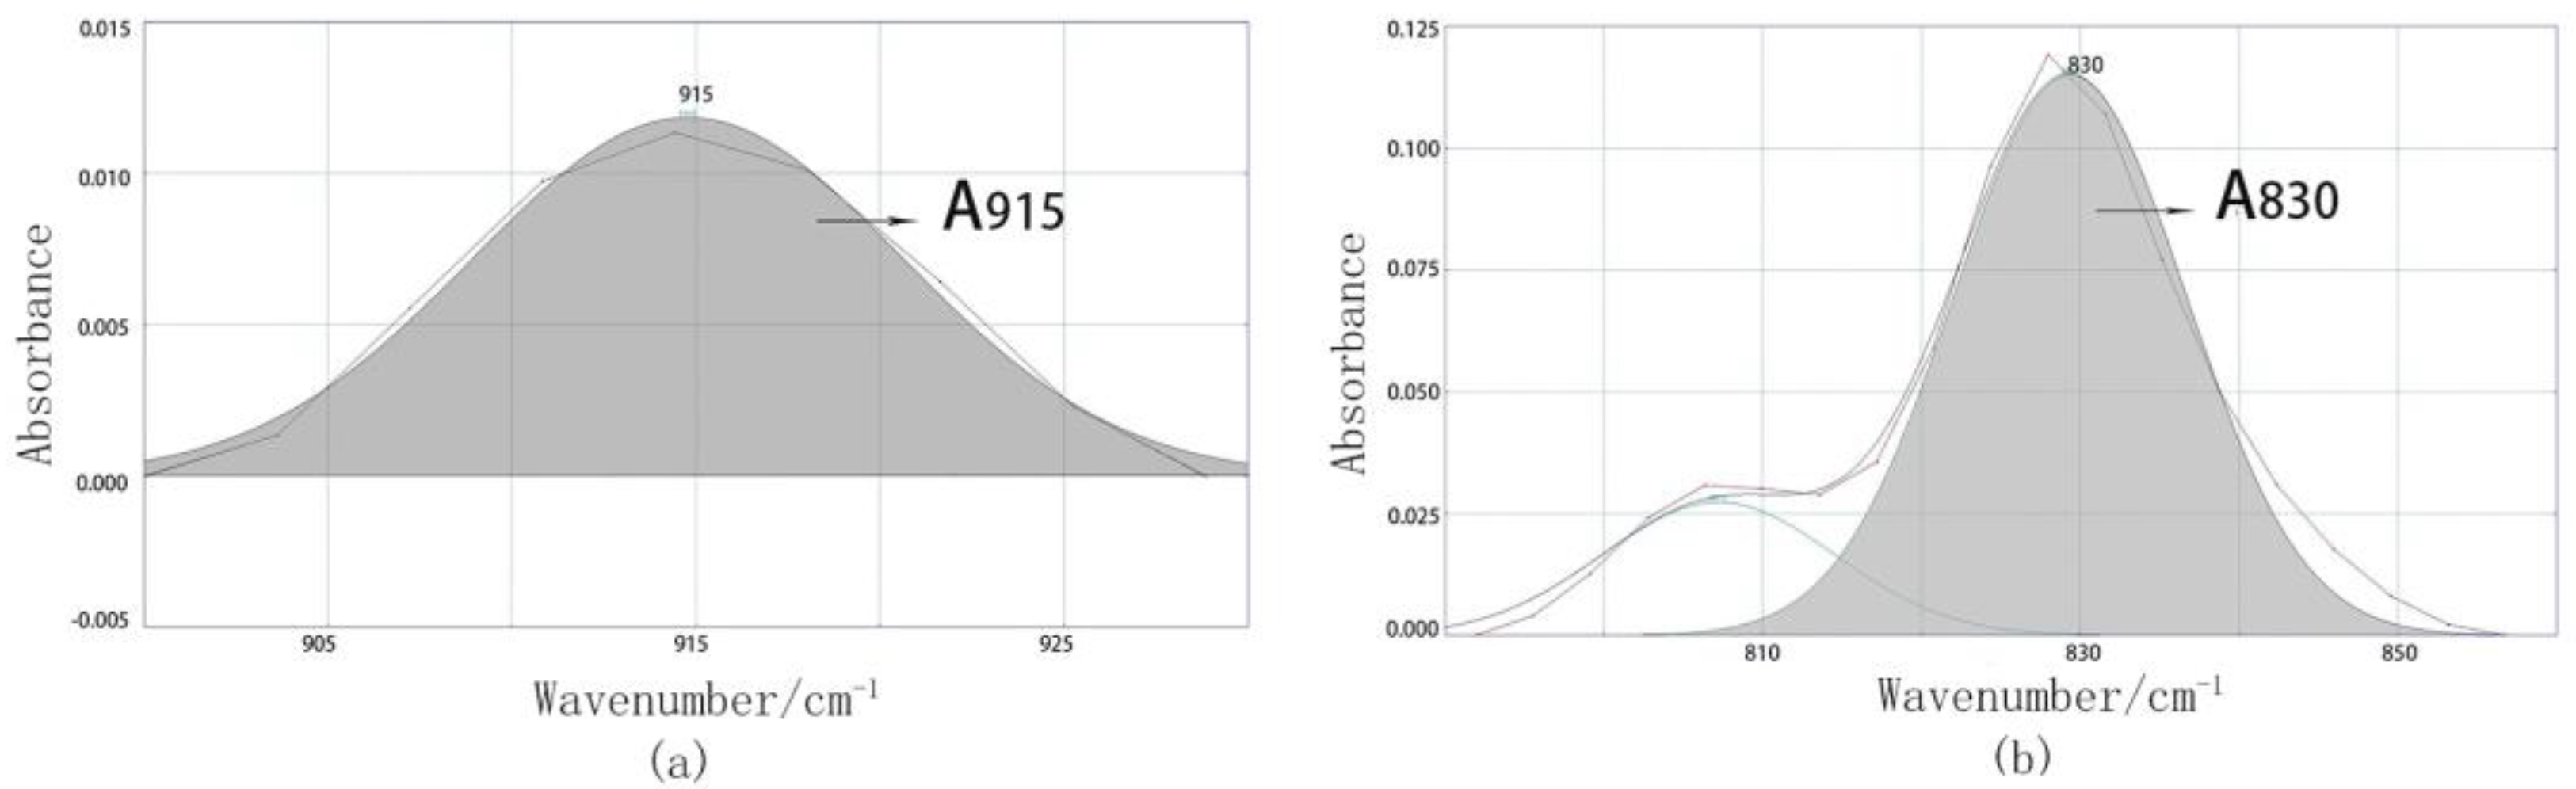
3.2. Quantitative Analysis of the Curing Process Using FTIR
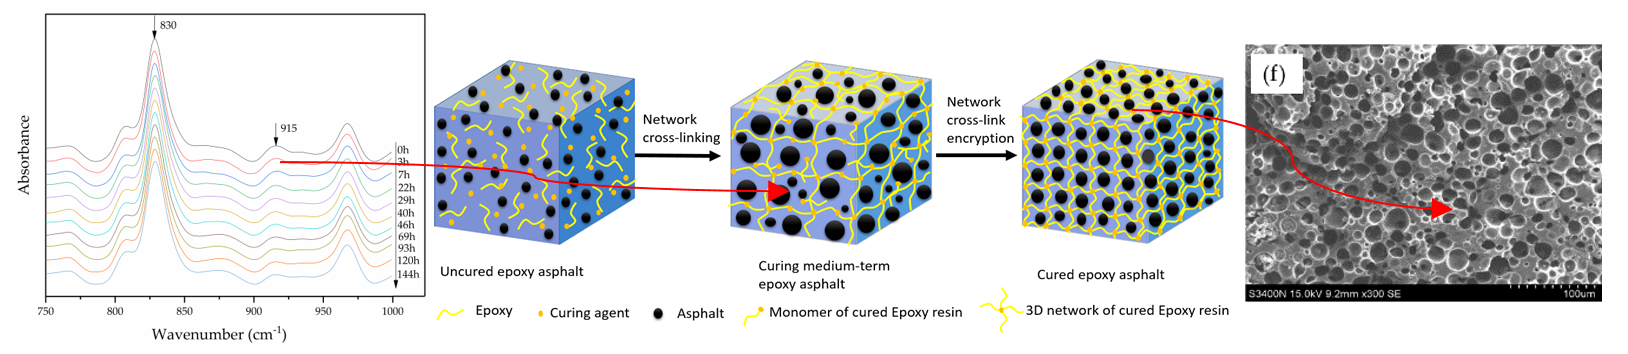
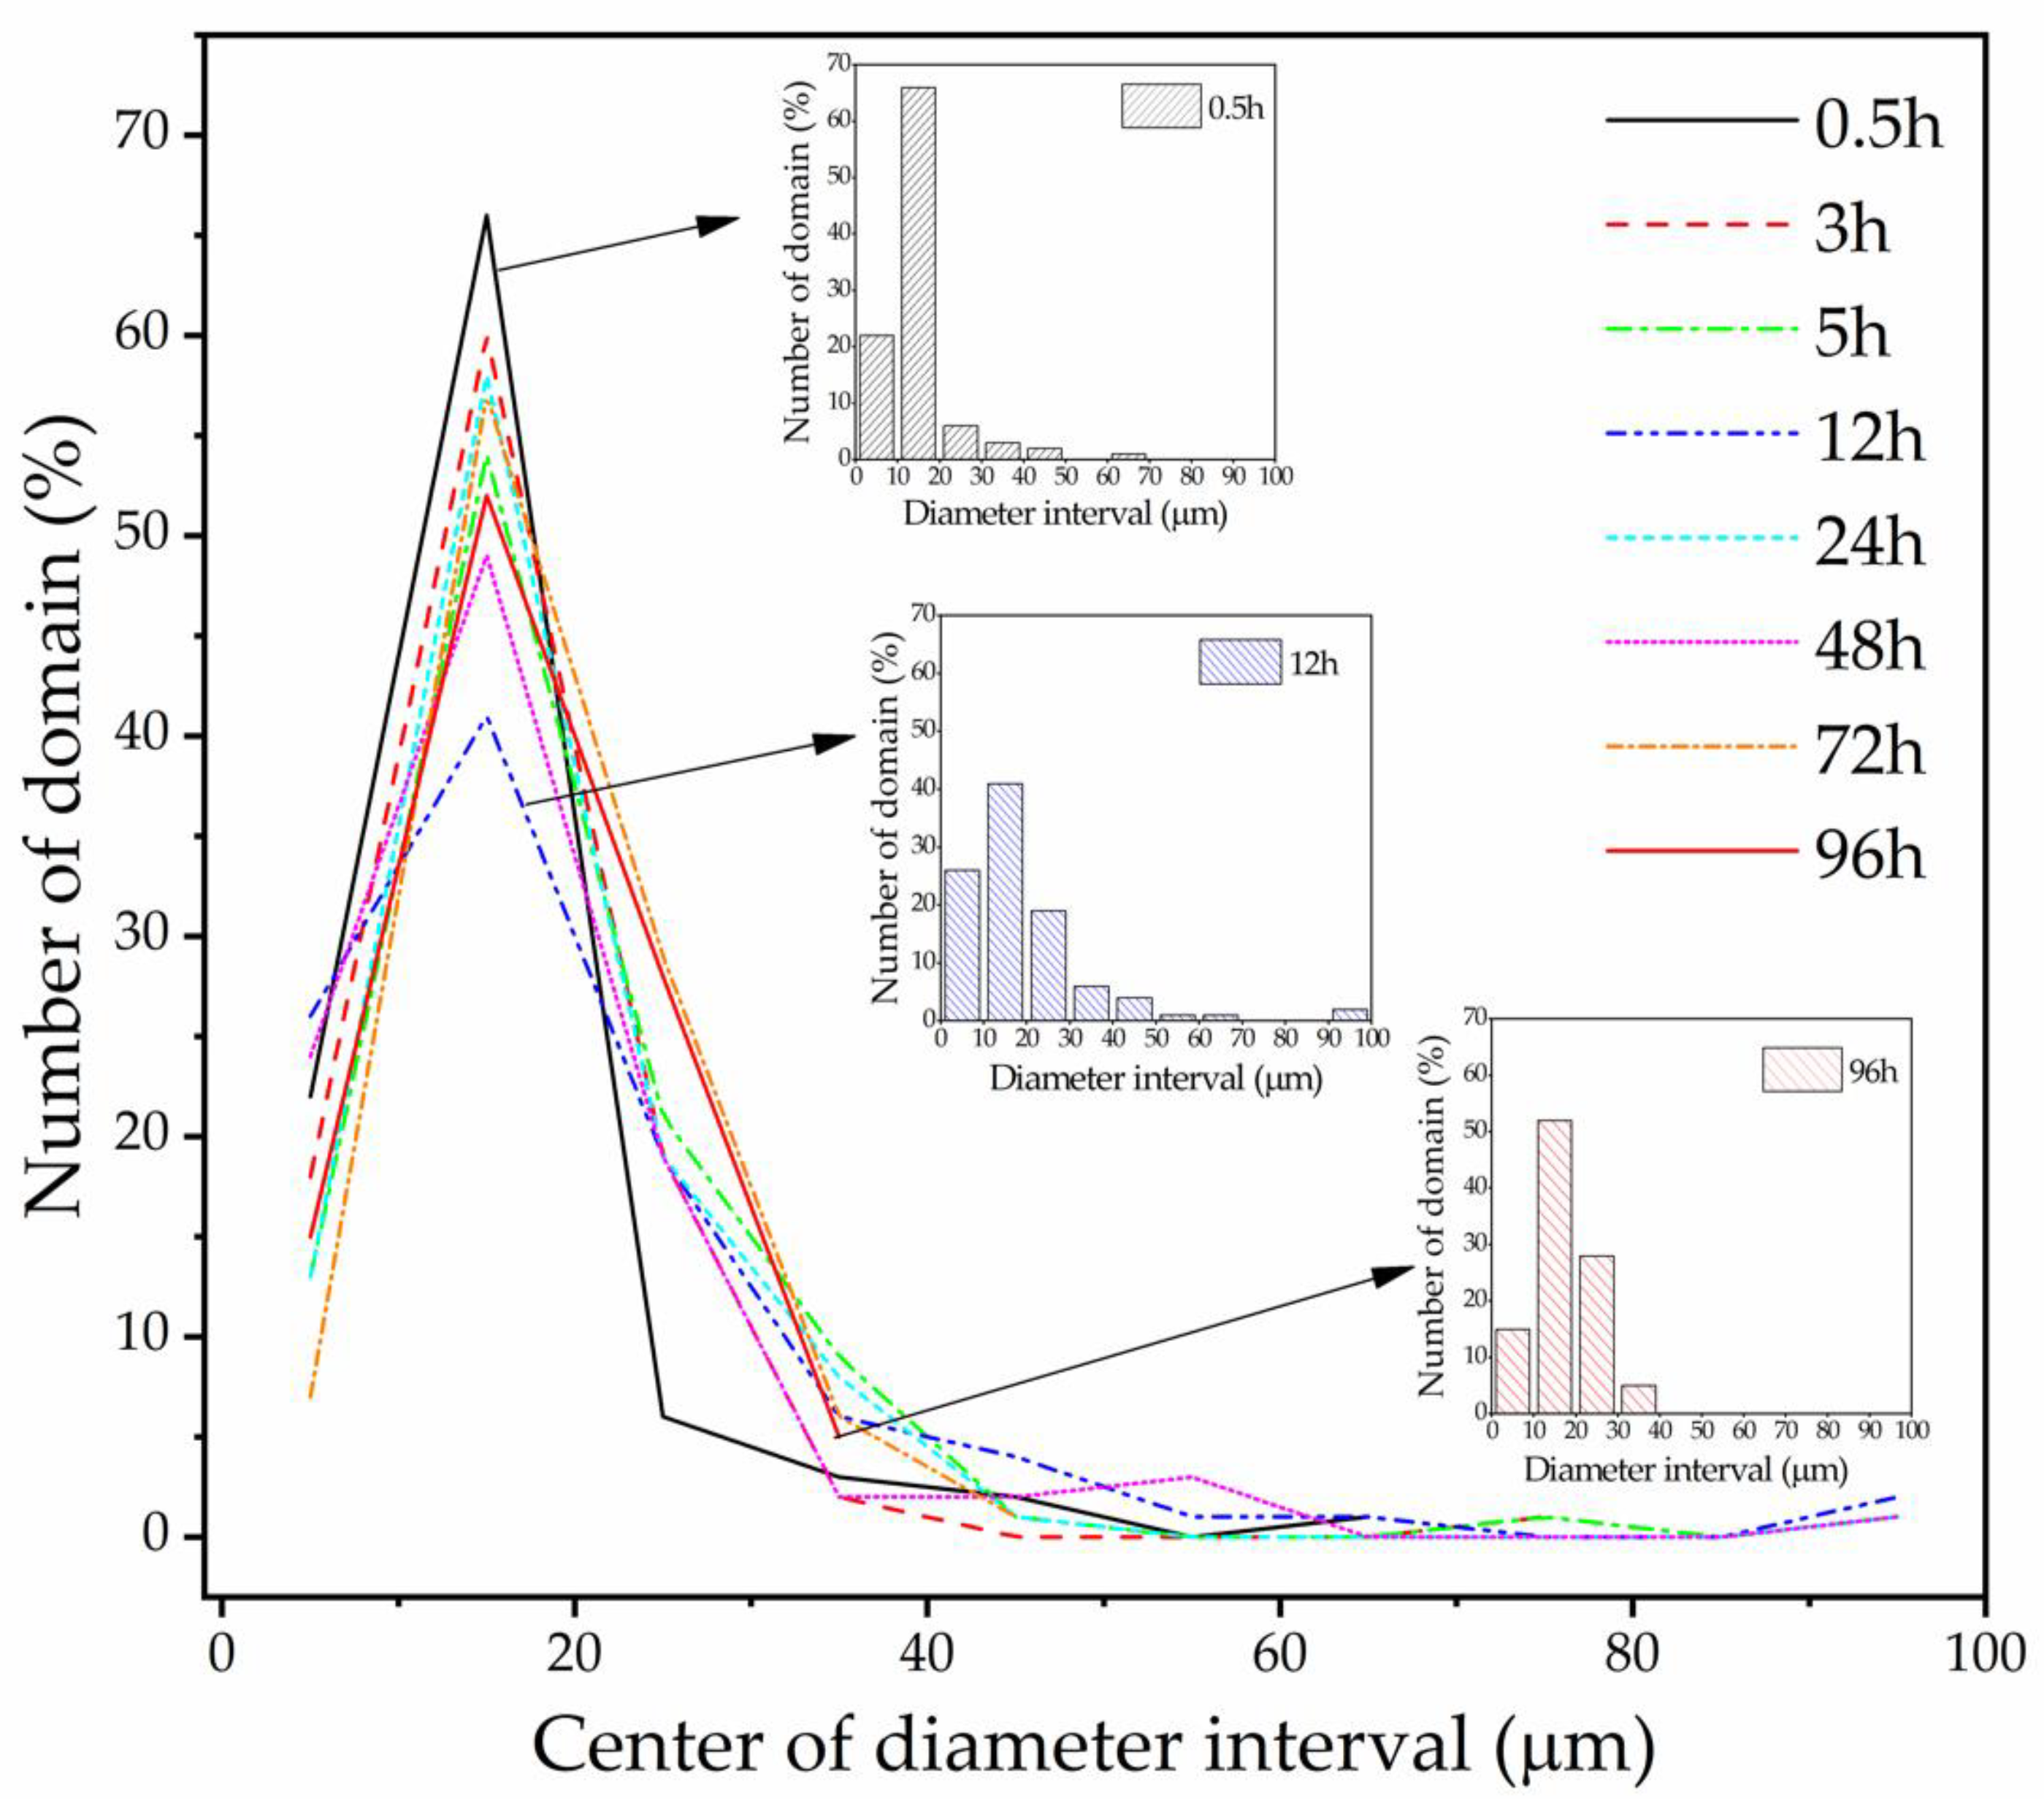
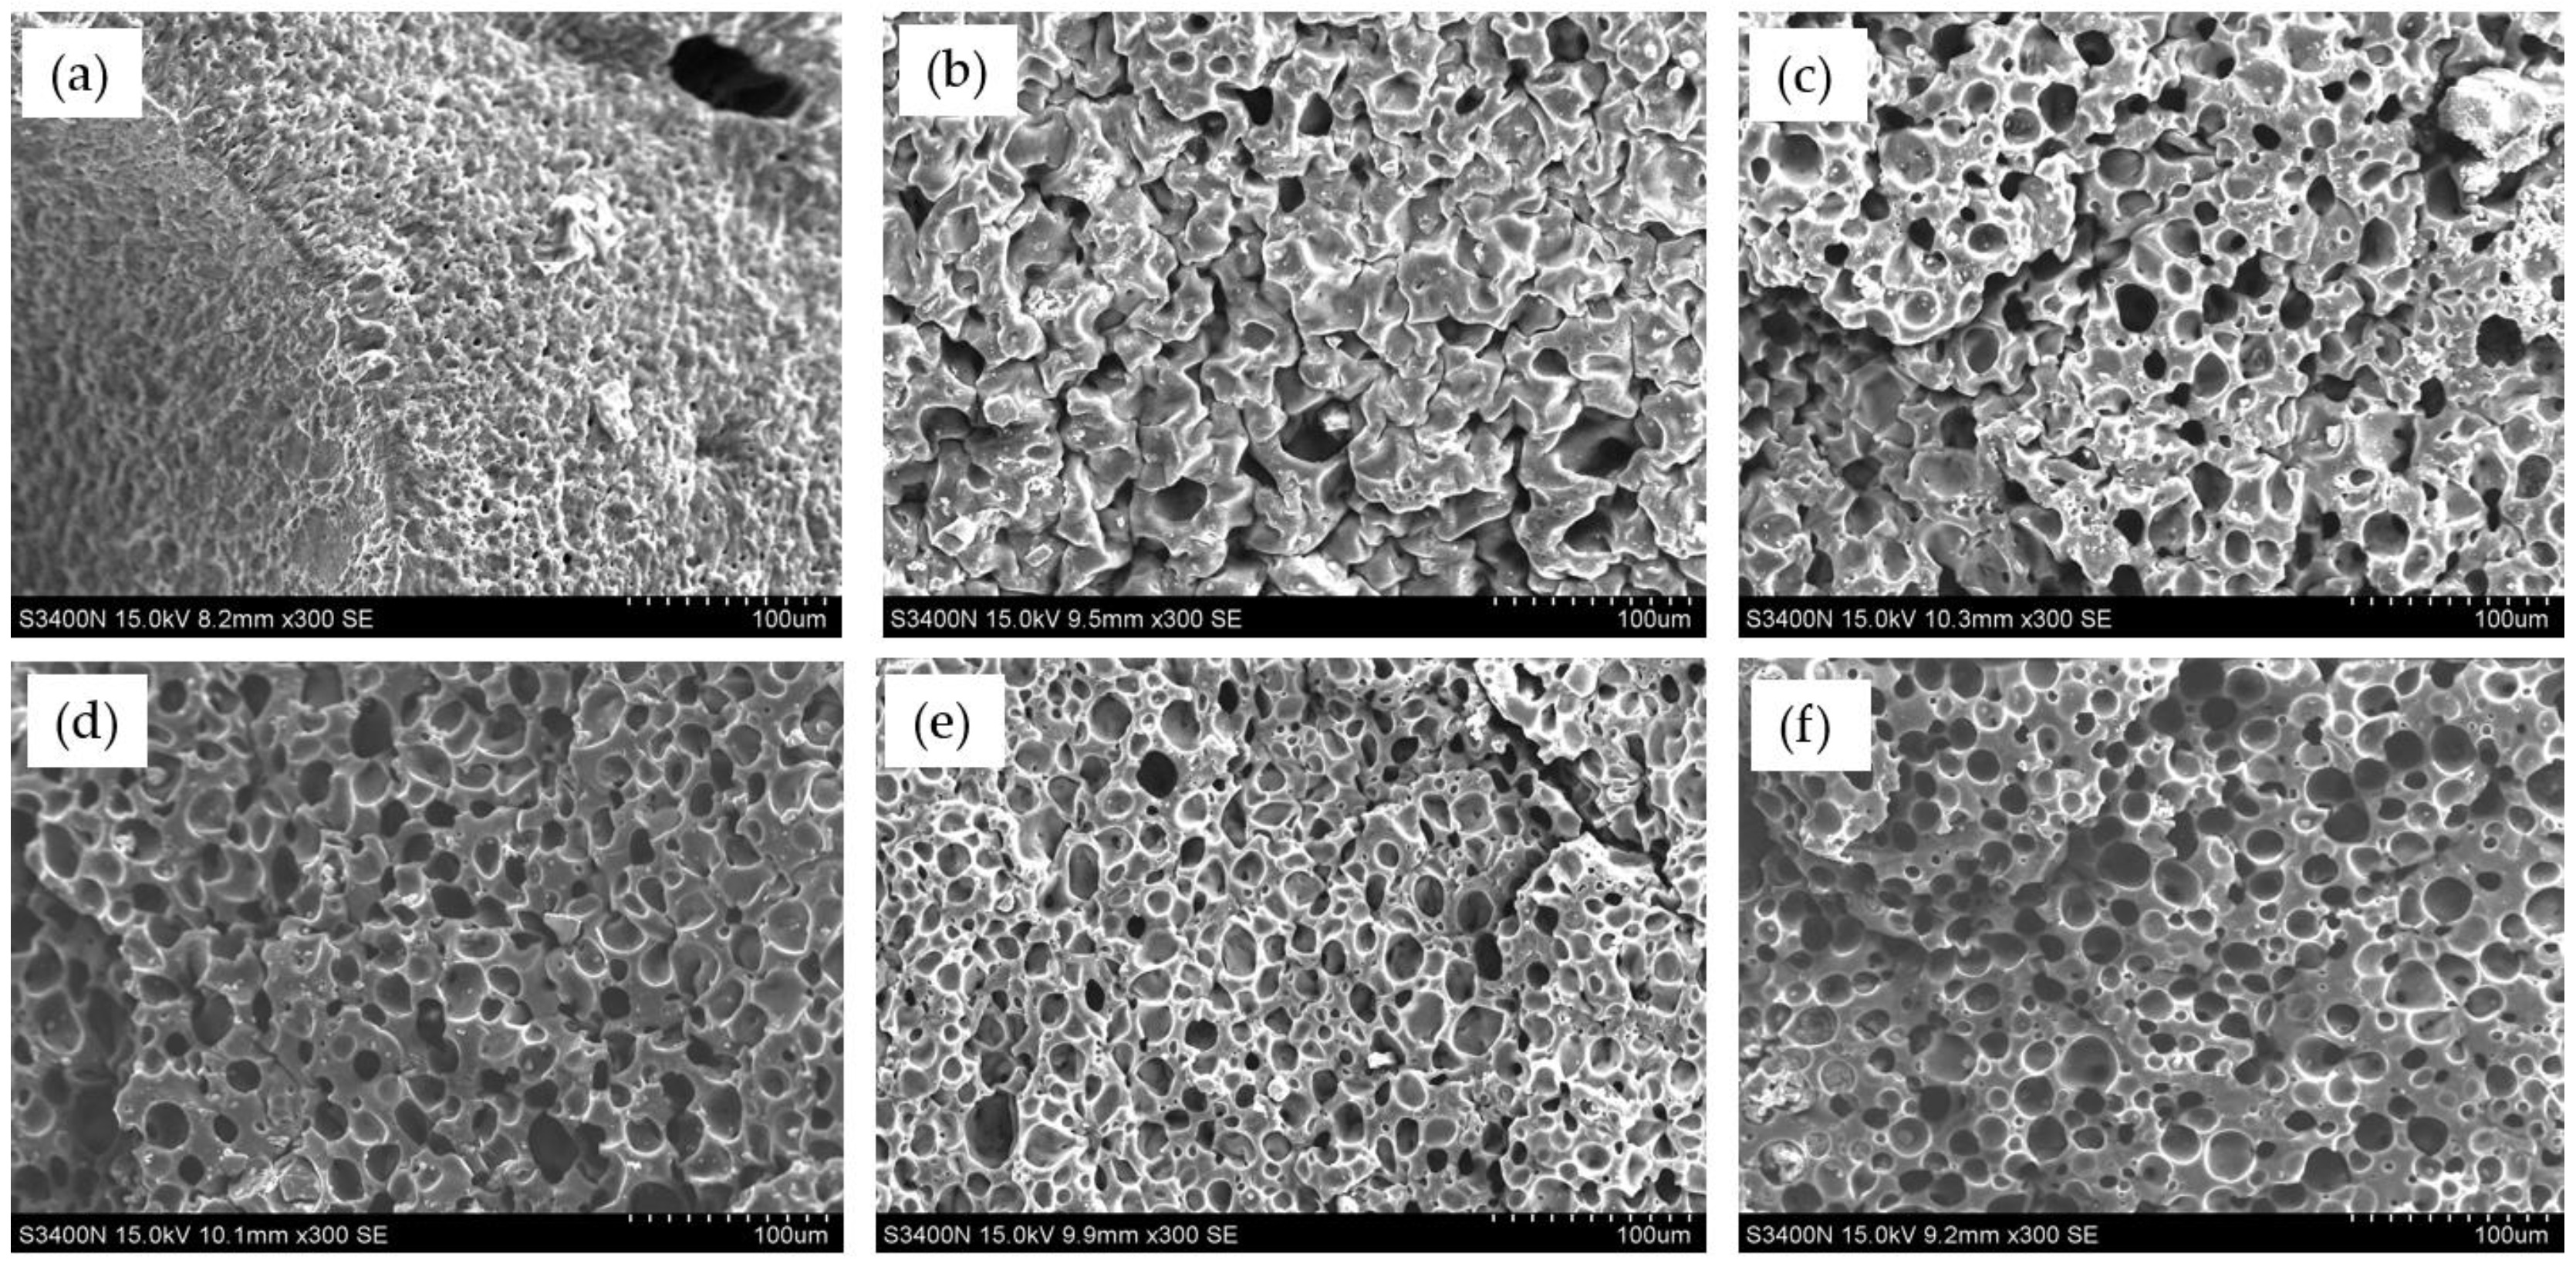
3.3. Morphological Analysis
4. Conclusions
- (1)
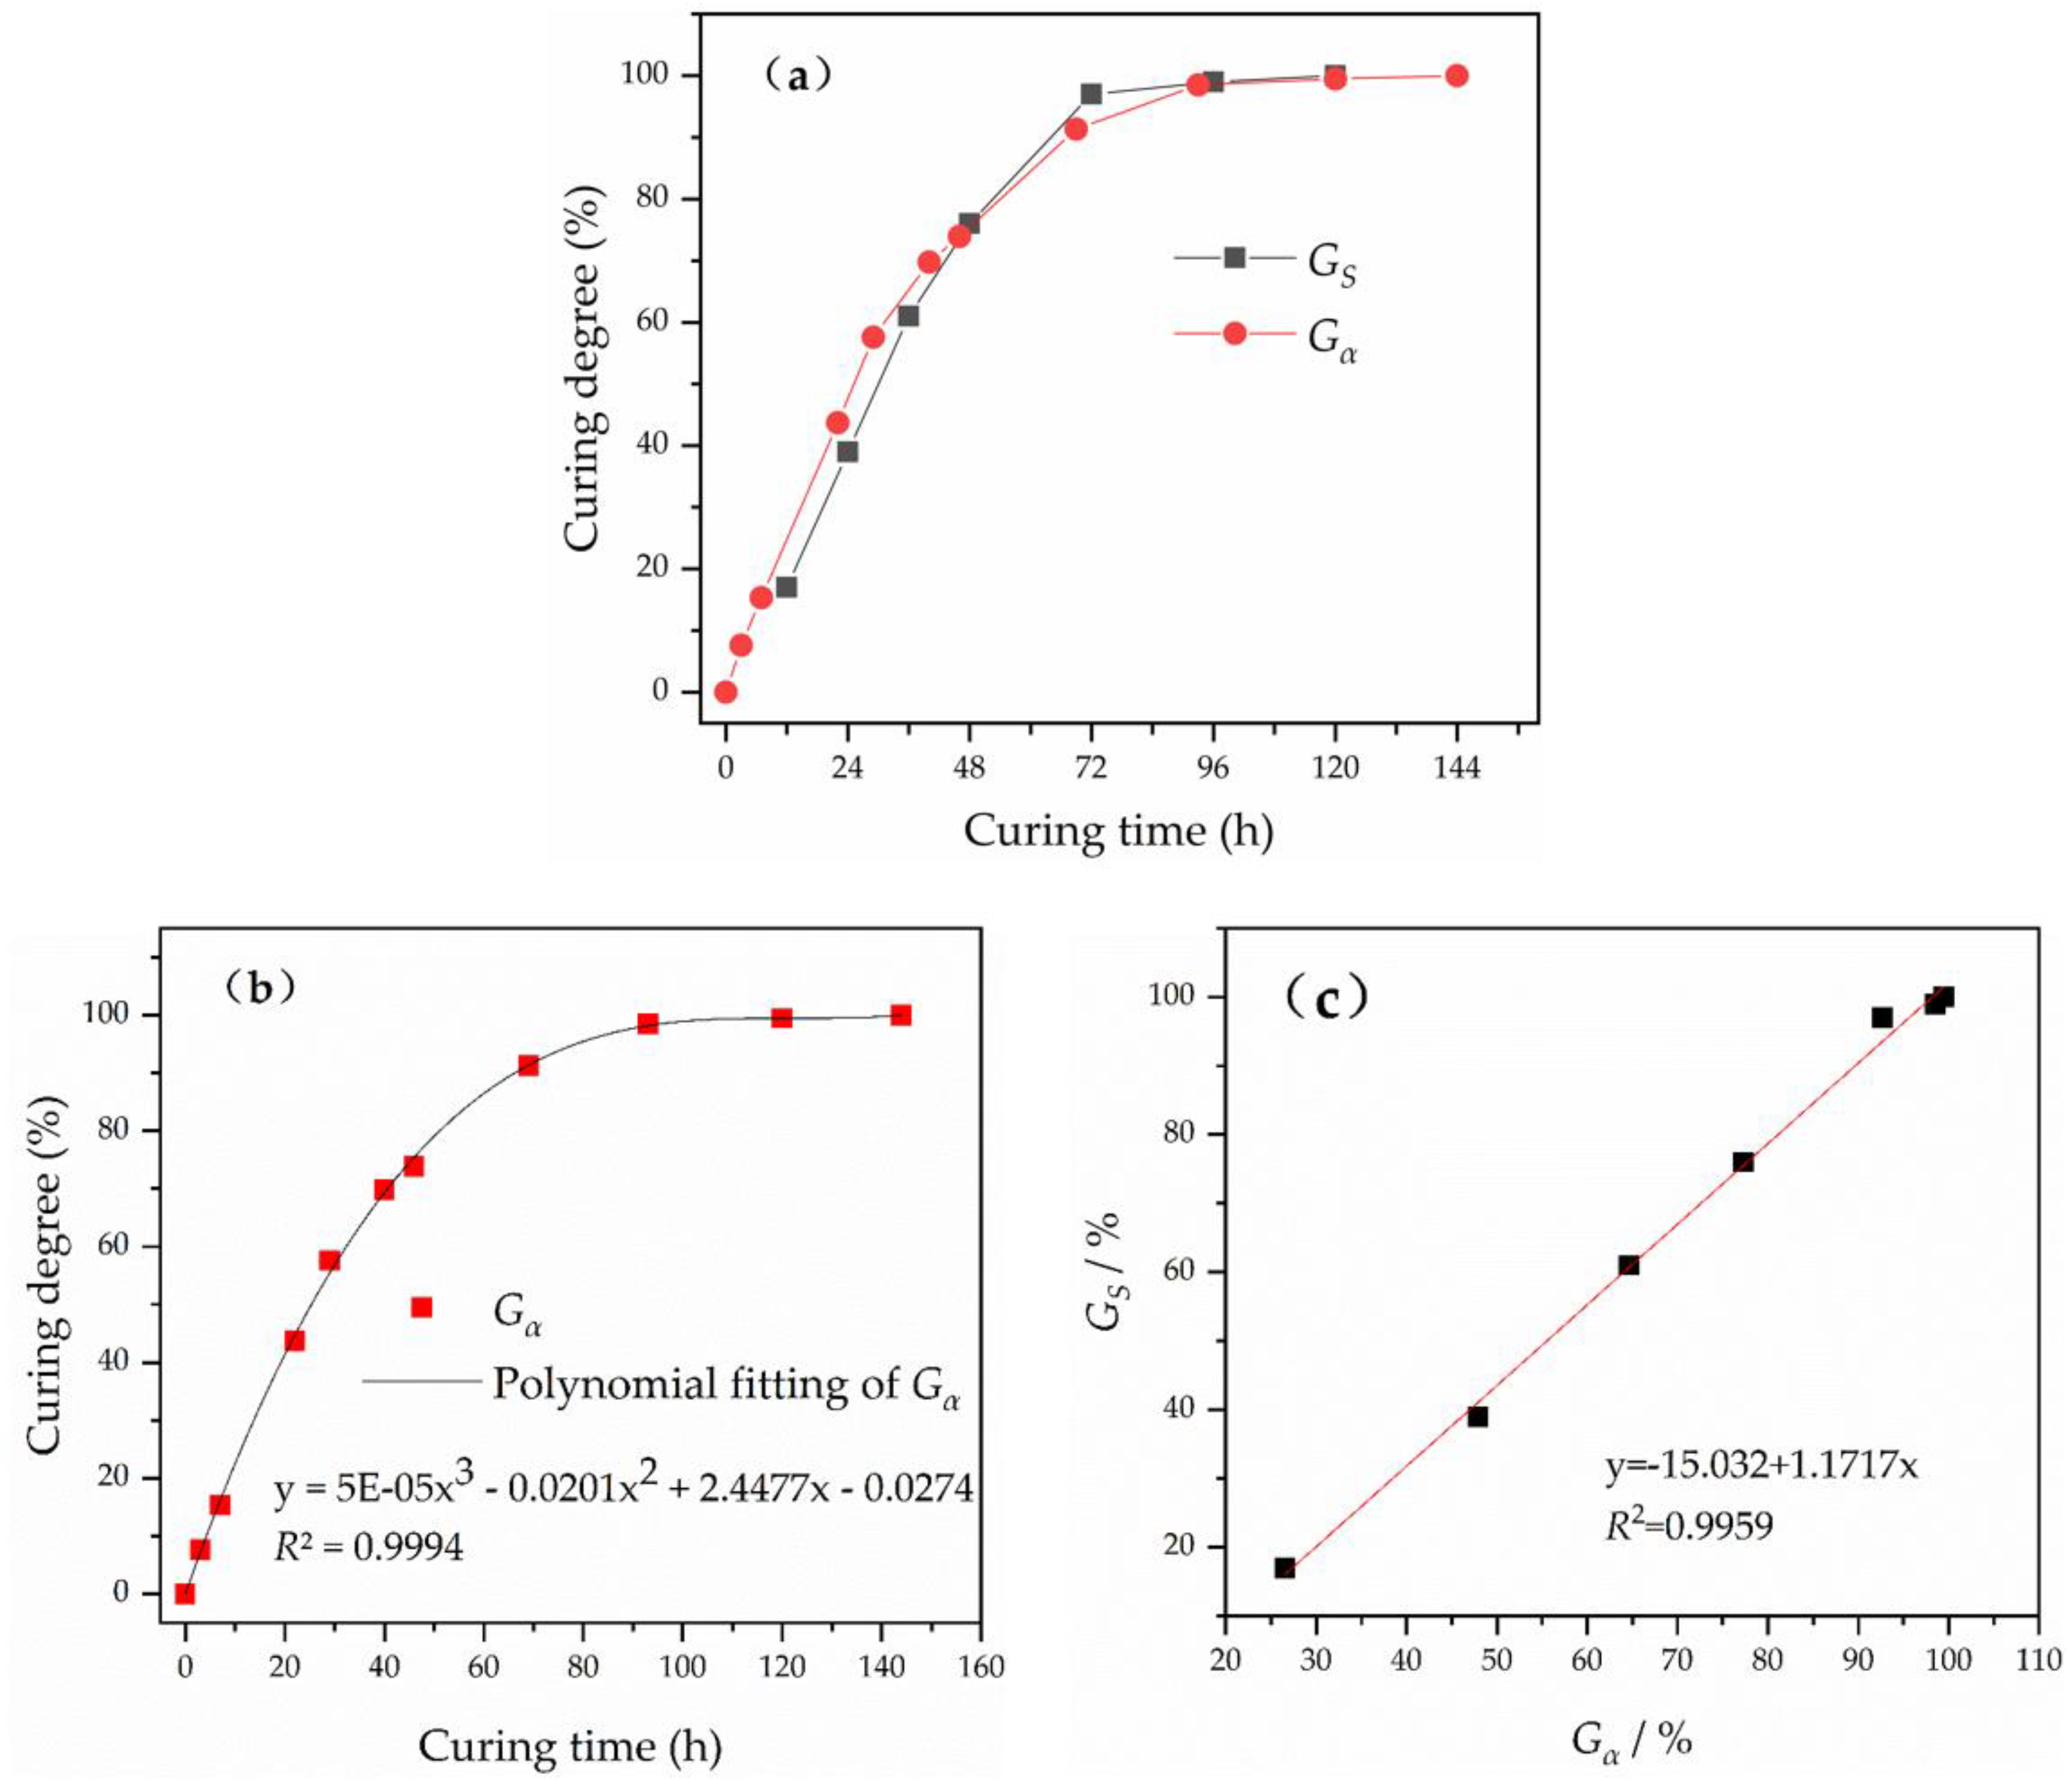
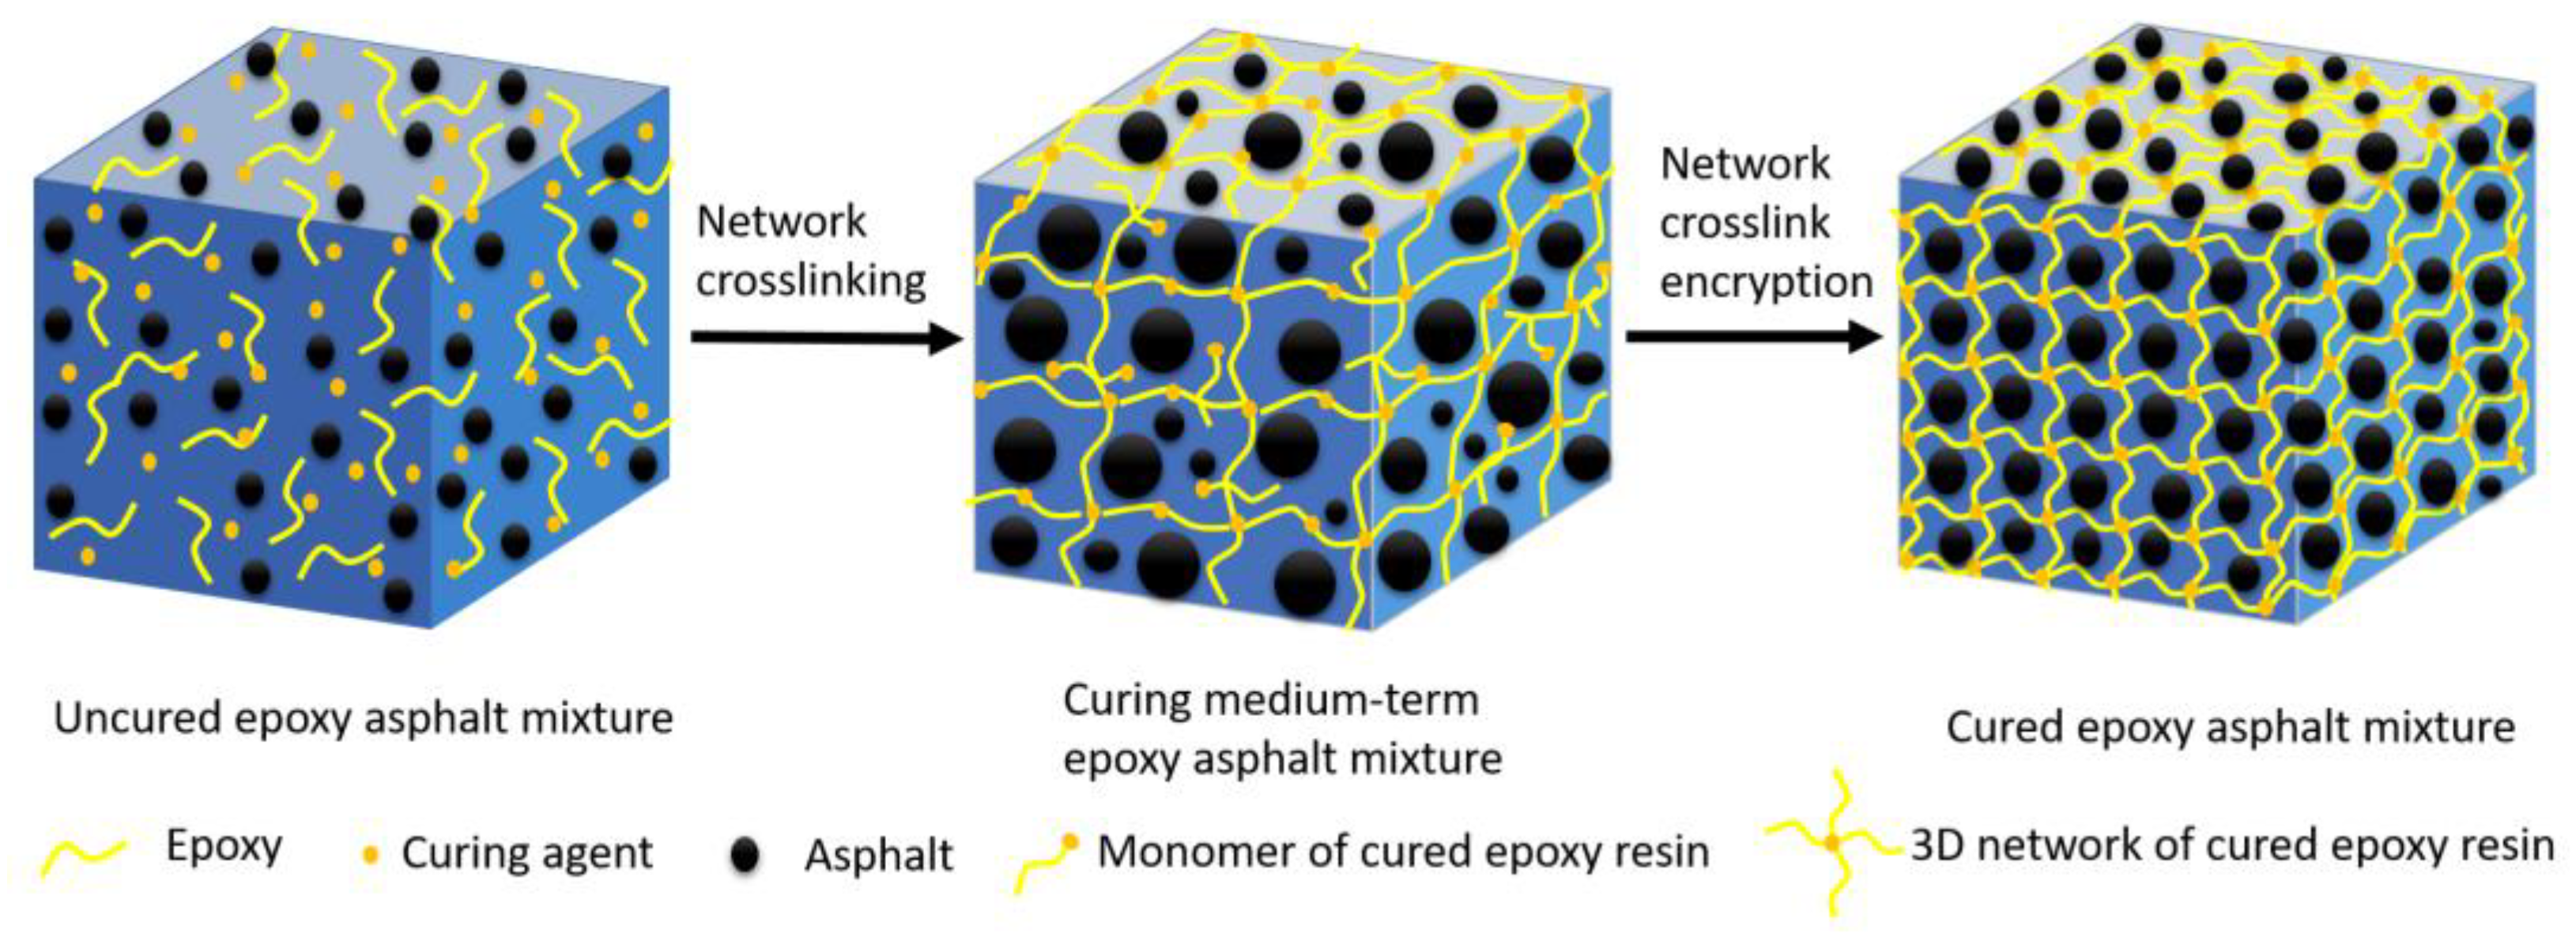
- The epoxy group content was quantitatively determined using FTIR and combined with the results for the tensile mechanical properties of epoxy asphalt. The conversion rate of epoxy groups is significantly related to the tensile strength of epoxy asphalt. The curing strength of epoxy asphalt increases via the development of a 3D network of crosslinked epoxy resin. The curing degree of epoxy asphalt can be evaluated using the conversion rate of epoxy groups.
- (2)
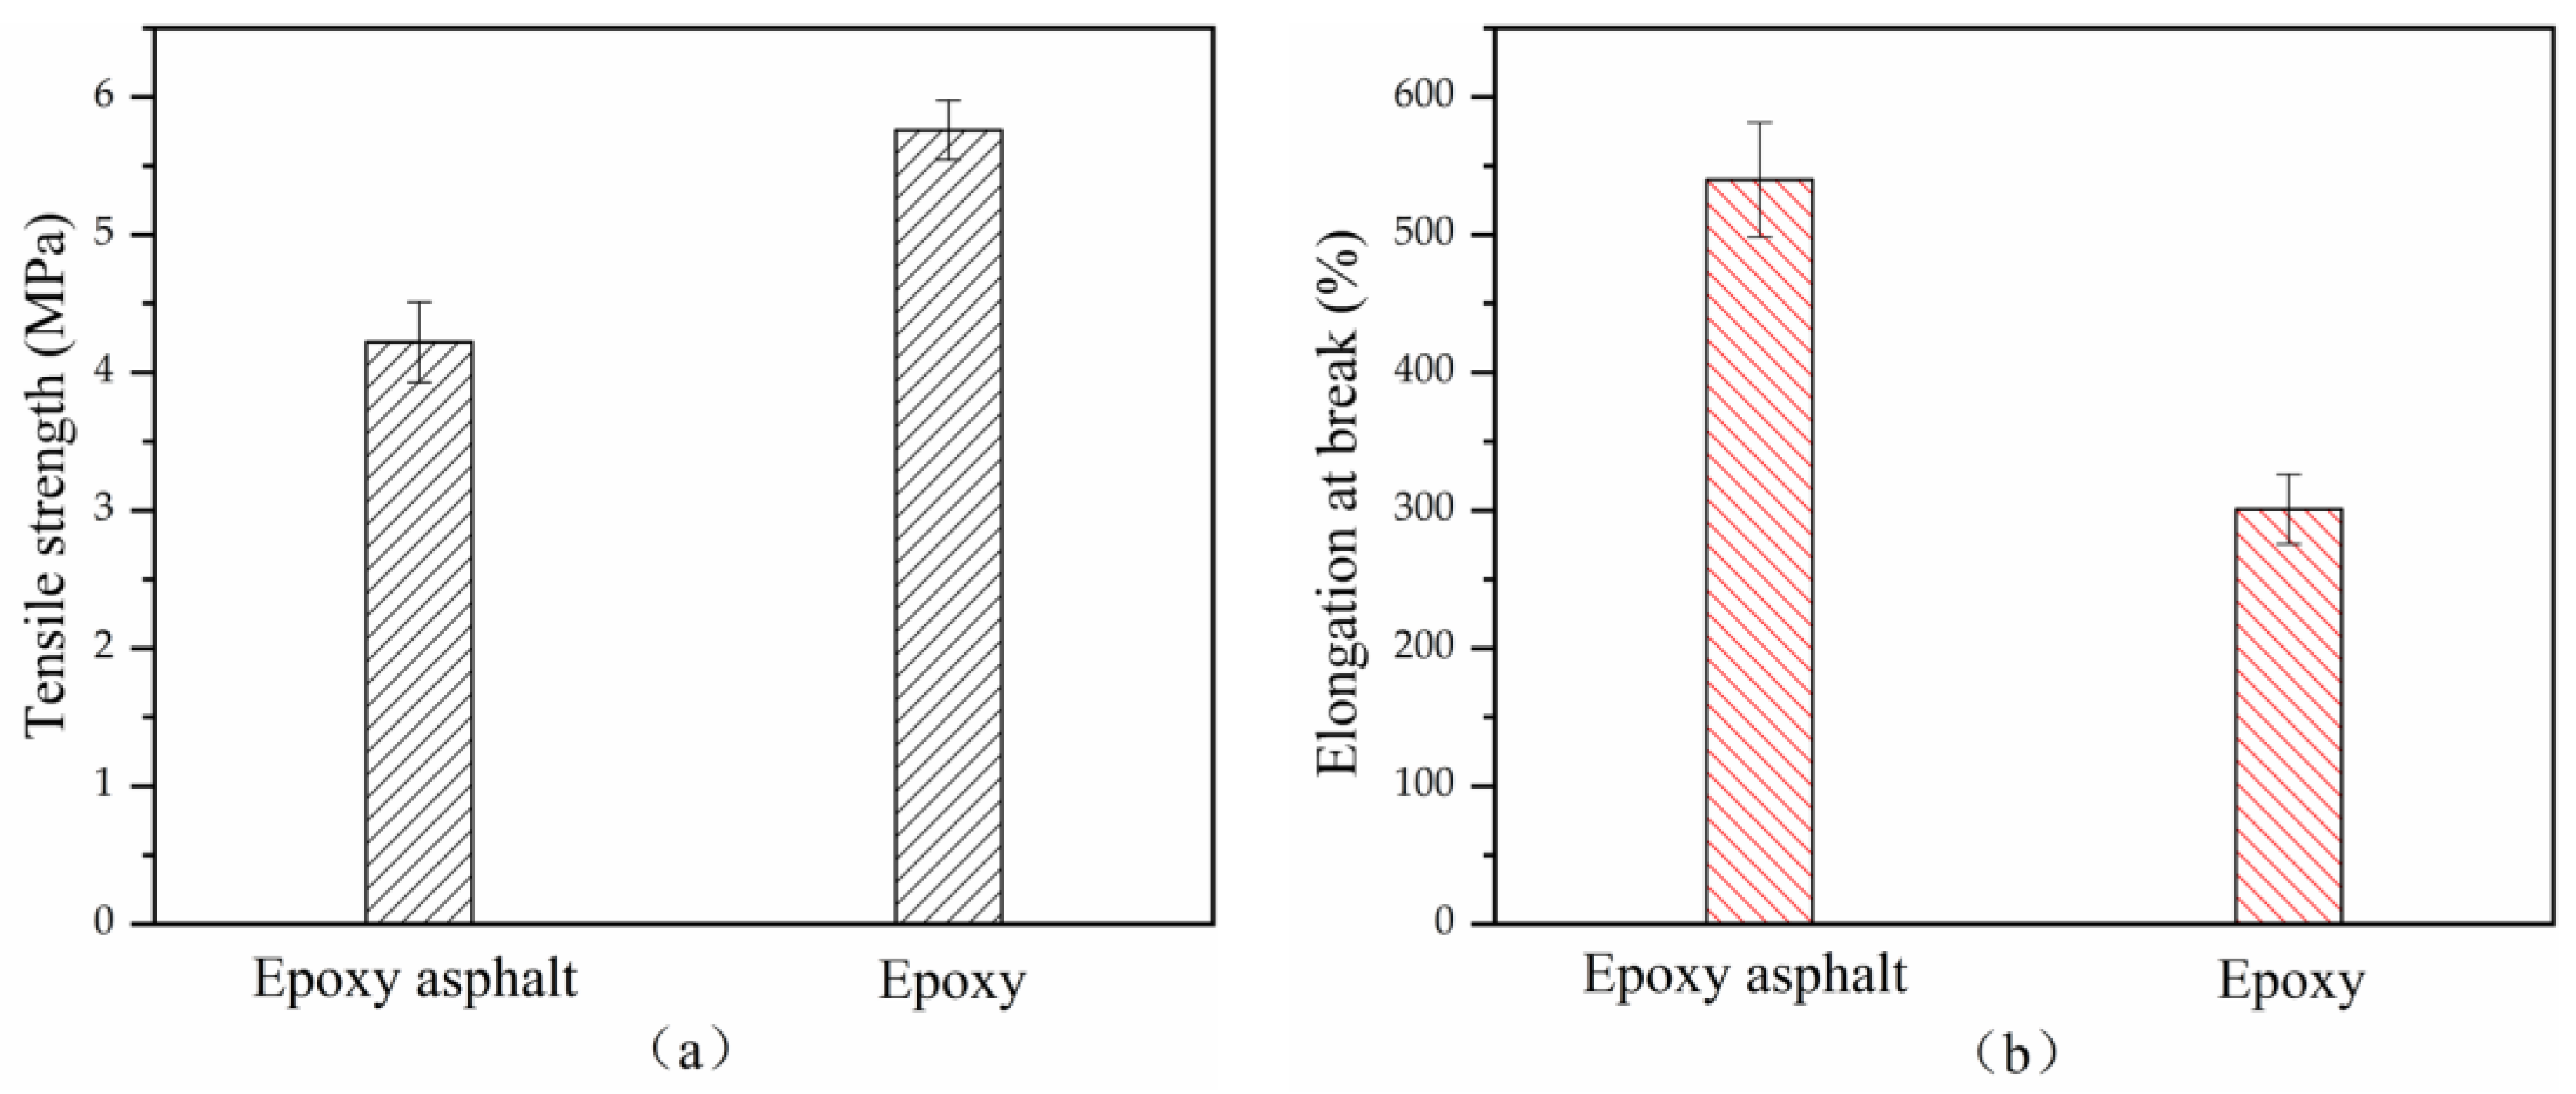
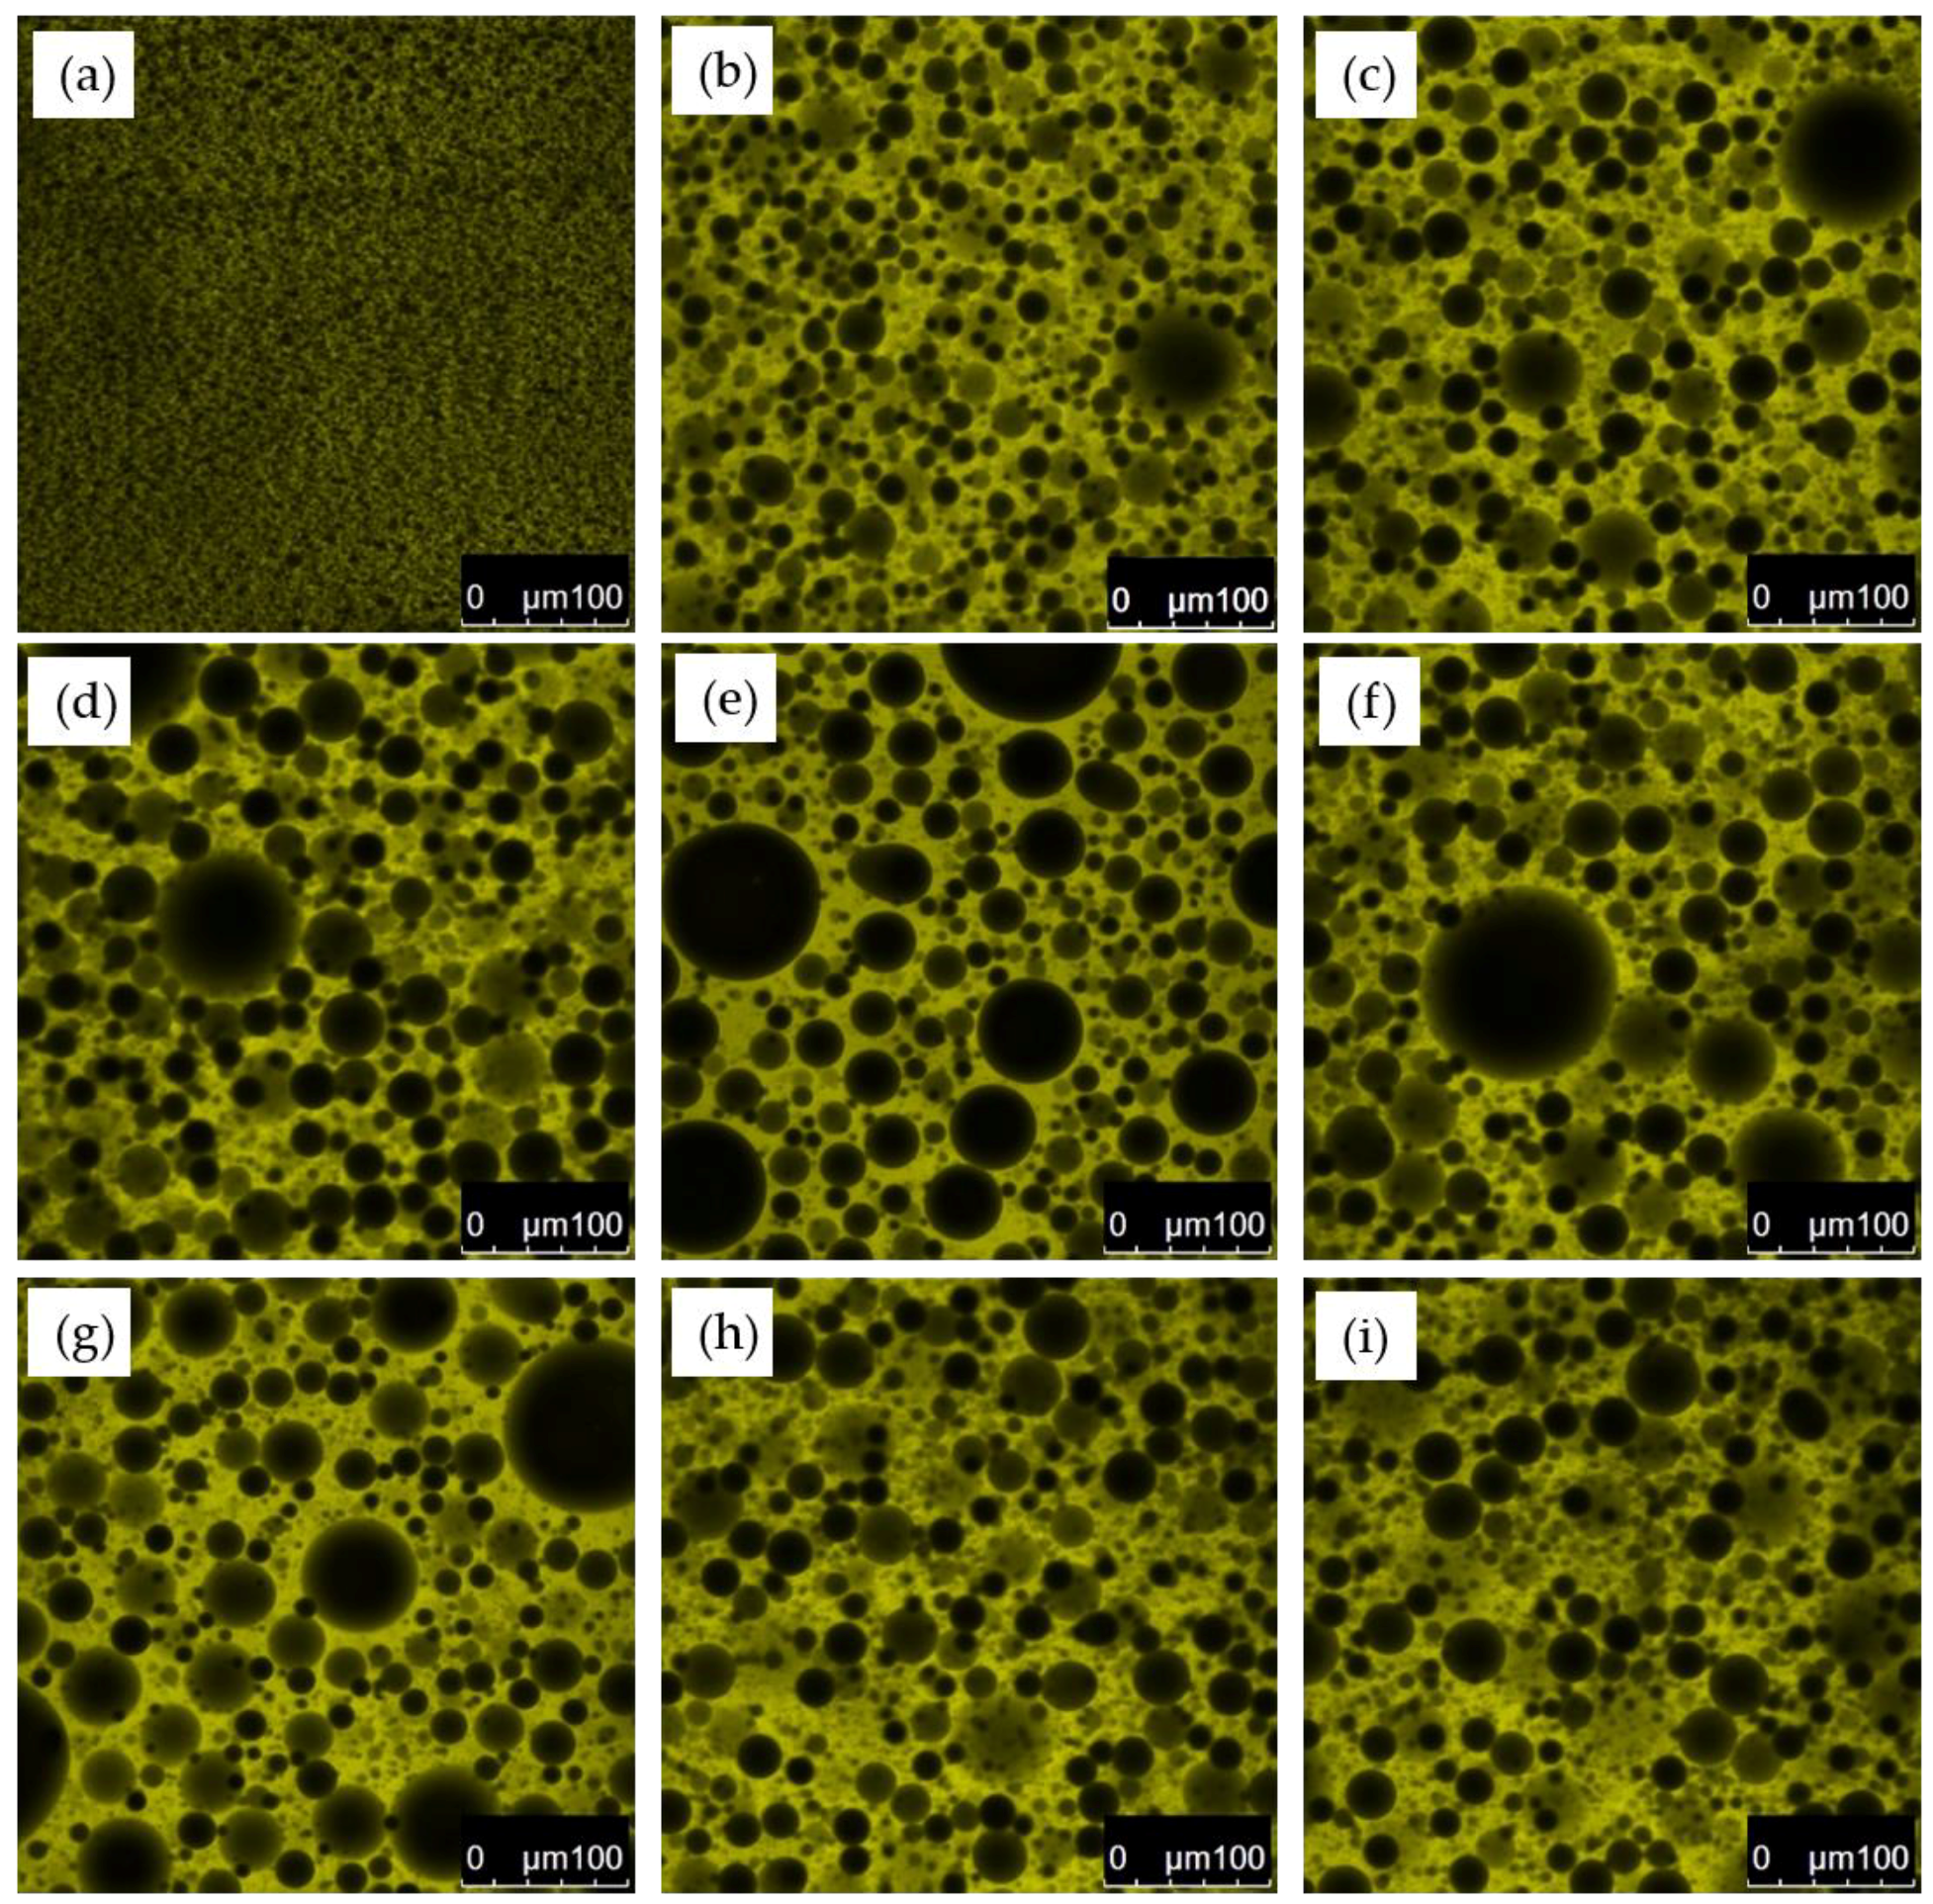
- A morphological analysis shows that during the curing process of epoxy asphalt, the asphalt PDI first increases, then decreases, and eventually stabilizes at approximately 1.15. The polymerization of epoxy resin into a spatial network results in a gradual two-phase separation, whereby asphalt is evenly distributed in a 3D epoxy resin network. The elongation at break of the cured epoxy asphalt is approximately 80% higher than that of the pure epoxy resin. The 3D network of epoxy asphalt increases the deformation of the pure epoxy resin.
- (3)
- In the curing of epoxy asphalt, epoxy resin is crosslinked into a stable 3D network structure in three stages: an initial stage (Gα less than approximately 27%), an intermediate stage (Gα between approximately 27% and 65%), and a late stage (Gα greater than approximately 65%).
- (4)
- In engineering practice, during the mixing, transporting, paving, and rolling process, the epoxy asphalt mixture is in the initial stage of curing and has a high reactivity. In the intermediate and late stages of curing, epoxy asphalt concrete should not be disturbed to avoid affecting the strength increase and long-term pavement performance. Attention should also be given to shortening the construction interval between the upper and lower pavement layers, completing the overall construction to the greatest extent possible in the initial stage of curing, and reducing disturbances to the concrete in the lower pavement layer.
Author Contributions
Funding
Conflicts of Interest
References
- Zhang, Z. Early Diseases of Asphalt Pavement Damage of Water Research and Countermeasures. Appl. Mech. Mater. 2015, 707, 532–535. [Google Scholar] [CrossRef]
- Solla, M.; Lagüela, S.; González-Jorge, H.; Arias, P. Approach to identify cracking in asphalt pavement using GPR and infrared thermographic methods: Preliminary findings. NDT&E Int. 2014, 62, 55–65. [Google Scholar]
- Norouzi, A.; Kim, D.; Kim, Y.R. Numerical evaluation of pavement design parameters for the fatigue cracking and rutting performance of asphalt pavements. Mater. Struct. 2016, 49, 3619–3634. [Google Scholar] [CrossRef]
- Mull, M.A.; Stuart, K.; Yehia, A. Fracture resistance characterization of chemically modified crumb rubber asphalt pavement. J. Mater. Sci. 2002, 37, 557–566. [Google Scholar] [CrossRef]
- Yang, P.; Zhang, X. Pavement performance of high modulus asphalt mixtures modified by PE and SBS. J. Cent. South Univ. (Sci. Technol.) 2012, 43, 4044–4049. [Google Scholar]
- Ai-Hadidy, A.I.; Yi-qiu, T. Effect of styrene-butadiene-styrene on the properties of asphalt and stone-matrix-asphalt mixture. J. Mater. Civ. Eng. 2011, 23, 504–510. [Google Scholar] [CrossRef]
- Sureshkumar, M.S.; Filippi, S.; Polacco, G.; Kazatchkov, I.; Stastna, J.; Zanzotto, L. Internal structure and linear viscoelastic properties of EVA/asphalt nanocomposites. Eur. Polym. J. 2010, 46, 621–633. [Google Scholar] [CrossRef]
- Zhu, J.; Birgisson, B.; Kringos, N. Polymer modification of bitumen: Advances and challenges. Eur. Polym. J. 2014, 54, 18–38. [Google Scholar] [CrossRef]
- Yin, H.; Wang, C.; Wang, Y.; Yuan, Z.; Wang, Z.; Xie, H.; Cheng, R. Cure reaction and morphology of epoxy asphalts. Polym. Mater. Sci. Eng. 2012, 28, 30–33. [Google Scholar]
- Zhang, Y.; Pan, X.; Sun, Y.; Xu, W.; Pan, Y.; Xie, H.; Cheng, R. Flame retardancy, thermal, and mechanical properties of mixed flame retardant modified epoxy asphalt binders. Constr. Build. Mater. 2014, 68, 62–67. [Google Scholar] [CrossRef]
- Yin, C.; Zhang, H.; Pan, Y. Cracking Mechanism and Repair Techniques of Epoxy Asphalt on Steel Bridge Deck Pavement. Transp. Res. Rec. 2016, 2550, 123–130. [Google Scholar] [CrossRef]
- Yin, H.; Zhang, Y.; Sun, Y.; Xu, W.; Yu, D.; Xie, H.; Cheng, R. Performance of hot mix epoxy asphalt binder and its concrete. Mater. Struct. 2015, 48, 3825–3835. [Google Scholar] [CrossRef]
- Chen, C.; Eisenhut, W.O.; Lau, K.; Buss, A.; Bors, J. Performance characteristics of epoxy asphalt paving material for thin orthotropic steel plate decks. Int. J. Pavement Eng. 2020, 21, 397–407. [Google Scholar] [CrossRef]
- Xiang, Q.; Xiao, F. Applications of epoxy materials in pavement engineering. Constr. Build. Mater. 2020, 235, 117–529. [Google Scholar] [CrossRef]
- Lu, Q.; Bors, J. Alternate uses of epoxy asphalt on bridge decks and roadways. Constr. Build. Mater. 2015, 78, 18–25. [Google Scholar] [CrossRef]
- Apostolidis, P.; Liu, X.; Kasbergen, C.; Ven, M.; Pipintakos, G.; Scarpas, A. Chemo-Rheological Study of Hardening of Epoxy Modified Bituminous Binders with the Finite Element Method. Transp. Res. Rec. 2018, 2672, 190–199. [Google Scholar] [CrossRef]
- Apostolidis, P.; Liu, X.; Ven, M.; Erkens, S.; Scarpas, T. Kinetic Viscoelasticity of Crosslinking Epoxy Asphalt. Transp. Res. Rec. 2019, 2673, 551–560. [Google Scholar] [CrossRef]
- Yu, J.; Cong, P.; Wu, S. Laboratory investigation of the properties of asphalt modified with epoxy resin. J. Appl. Polym. Sci. 2009, 113, 3557–3563. [Google Scholar] [CrossRef]
- Kang, Y.; Song, M.; Pu, L.; Liu, T. Rheological behaviors of epoxy asphalt binder in comparison of base asphalt binder and SBS modified asphalt binder. Constr. Build. Mater. 2015, 76, 343–350. [Google Scholar] [CrossRef]
- Yu, J.; Cong, P.; Wu, S.; Cheng, S. Curing behavior of epoxy asphalt. J. Wuhan Univ. Technol. Mater. Sci. Ed. 2009, 24, 462–465. [Google Scholar] [CrossRef]
- Cong, P.; Luo, W.; Xu, P.; Zhang, Y. Chemical and physical properties of hot mixing epoxy asphalt binders. Constr. Build. Mater. 2019, 198, 1–9. [Google Scholar] [CrossRef]
- Zeng, G.; Xu, W.; Huang, H.; Zhang, X. Study on the microstructure and properties of hot-mix epoxy asphalt. Int. J. Pavement Eng. 2019, 12, 147–153. [Google Scholar] [CrossRef]
- Liu, Y.; Zhang, J.; Jiang, Y.; Li, C.; Xi, Z.; Cai, J.; Xie, H. Investigation of secondary phase separation and mechanical properties of epoxy SBS-modified asphalts. Constr. Build. Mater. 2018, 165, 163–172. [Google Scholar] [CrossRef]
- Hong, X.; Wang, X.; Wang, Y.; Liang, W. Study on Curing Kinetics of Epoxy Resin by In-situ and Ex-situ FTIR. Mater. Rev. 2012, 26, 64–66. [Google Scholar]
- Yang, Z.; Zhuang, G.; Wei, X.; Wei, J.; Yu, H.; Xu, W. Quantitative analysis of the blending degree of virgin and RAP binders in recycled asphalt mixtures with a high RAP content. Appl. Sci. 2018, 8, 2668. [Google Scholar] [CrossRef]
- Liu, Y.; Zhang, J.; Chen, R.; Cai, J.; Xi, Z.; Xie, H. Ethylene vinyl acetate copolymer modified epoxy asphalt binders: Phase separation evolution and mechanical properties. Constr. Build. Mater. 2017, 137, 55–65. [Google Scholar] [CrossRef]
- Gong, J.; Liu, Y.; Wang, Q.; Xi, Z.; Cai, J.; Ding, G.; Xie, H. Performance evaluation of warm mix asphalt additive modified epoxy asphalt rubbers. Constr. Build. Mater. 2019, 204, 288–295. [Google Scholar] [CrossRef]
- Pascault, J.P.; Sautereau, H.; Verdu, J.; Williams, R.J.J. Thermosetting polymers; Marcel Dekker. Inc.: New York, NY, USA, 2002. [Google Scholar]
- Si, J.; Jia, Z.; Wang, J.; Yu, X.; Li, Y.; Dong, F.; Jiang, R. Comparative analysis of cold-mixed epoxy and epoxy SBS-modified asphalts: Curing rheology, thermal, and mechanical properties. Constr. Build. Mater. 2018, 176, 165–171. [Google Scholar] [CrossRef]


| Test Property | Technical Requirements | Test Results | Test Method |
|---|---|---|---|
| Penetration (25 °C, 100 g, 5 s, 0.1 mm) | 60–80 | 62 | ASTM D5 |
| Softening point TR & B (°C) | ≥47 | 50 | ASTM D2398 |
| Ductility (15 °C, 5 cm/min, cm) | ≥100 | > 100 | ASTM D113 |
| Density (15 °C, g/cm3) | ≥1.000 | 1.037 | ASTM D1298 |
| Solubility (%) | ≥99.5 | 99.9 | ASTM D2042 |
| Flash point (°C) | ≥260 | 319 | ASTM D92 |
| Test Property | Technical Requirements | Test Results | Test Method |
|---|---|---|---|
| Viscosity (23 °C, Pa·s) | 1000–5000 | 2130 | ASTM D445 |
| Specific gravity (23 °C) | 1.00–1.20 | 1.137 | ASTM D1475 |
| Epoxide equivalent weight | 190–210 | 207 | ASTM D1652 |
| Flash point (°C) | >230 | 244 | ASTM D92 |
| Appearance | Light yellow transparent liquid | Light yellow transparent liquid | Visual |
| Test Property | Technical Requirements | Test Results | Test Method |
|---|---|---|---|
| Viscosity (23 °C, Pa·s) | 100–800 | 234 | ASTM D445 |
| Specific gravity (23 °C) | 0.80–1.00 | 0.864 | ASTM D1475 |
| Acid value (mgKOH/g) | 150–200 | 153 | ASTM D1652 |
| Flash point (°C) | > 145 | 167 | ASTM D92 |
| Appearance | Light yellow brown liquid | Light yellow brown liquid | Visual |
| Curing Time / h | (A′915/A′830)t | Conversion Rate of Epoxy Groups, α | Curing Reaction Degree, Gα / % | |
|---|---|---|---|---|
| 0 | 0.109 | 1.000 | 0.000 | 0 |
| 3 | 0.104 | 0.958 | 0.042 | 8 |
| 7 | 0.100 | 0.915 | 0.085 | 15 |
| 22 | 0.083 | 0.759 | 0.241 | 44 |
| 29 | 0.085 | 0.782 | 0.318 | 58 |
| 40 | 0.067 | 0.615 | 0.385 | 70 |
| 46 | 0.065 | 0.592 | 0.408 | 74 |
| 69 | 0.054 | 0.496 | 0.504 | 91 |
| 93 | 0.050 | 0.456 | 0.544 | 98 |
| 120 | 0.049 | 0.451 | 0.549 | 99 |
| 144 | 0.049 | 0.448 | 0.552 | 100 |
| Curing Time/h | 12 | 24 | 36 | 48 | 72 | 96 | 120 |
|---|---|---|---|---|---|---|---|
| Gα/% | 27 | 48 | 65 | 77 | 93 | 99 | 99 |
| Gs/% | 17 | 39 | 64 | 76 | 97 | 99 | 100 |
| Sample | Dn (μm) | Dw (μm) | PDI |
|---|---|---|---|
| 0.5 h | 14.5 | 19.6 | 1.35 |
| 3 h | 15.9 | 21.8 | 1.37 |
| 5 h | 19.2 | 27.0 | 1.40 |
| 12 h | 19.5 | 33.2 | 1.70 |
| 24 h | 18.0 | 29.1 | 1.62 |
| 48 h | 17.5 | 26.6 | 1.52 |
| 72 h | 18.1 | 20.8 | 1.15 |
| 96 h | 18.0 | 20.7 | 1.15 |
© 2020 by the authors. Licensee MDPI, Basel, Switzerland. This article is an open access article distributed under the terms and conditions of the Creative Commons Attribution (CC BY) license (http://creativecommons.org/licenses/by/4.0/).
Share and Cite
Xu, W.; Zhuang, G.; Chen, Z.; Wei, J. Experimental Study on the Micromorphology and Strength Formation Mechanism of Epoxy Asphalt During the Curing Reaction. Appl. Sci. 2020, 10, 2610. https://doi.org/10.3390/app10072610
Xu W, Zhuang G, Chen Z, Wei J. Experimental Study on the Micromorphology and Strength Formation Mechanism of Epoxy Asphalt During the Curing Reaction. Applied Sciences. 2020; 10(7):2610. https://doi.org/10.3390/app10072610
Chicago/Turabian StyleXu, Wei, Guoyi Zhuang, Zhengxiong Chen, and Jintao Wei. 2020. "Experimental Study on the Micromorphology and Strength Formation Mechanism of Epoxy Asphalt During the Curing Reaction" Applied Sciences 10, no. 7: 2610. https://doi.org/10.3390/app10072610
APA StyleXu, W., Zhuang, G., Chen, Z., & Wei, J. (2020). Experimental Study on the Micromorphology and Strength Formation Mechanism of Epoxy Asphalt During the Curing Reaction. Applied Sciences, 10(7), 2610. https://doi.org/10.3390/app10072610