Automatic 2D Floorplan CAD Generation from 3D Point Clouds
Abstract
:1. Introduction
2. Backgrounds and Related Works
3. Proposed Method
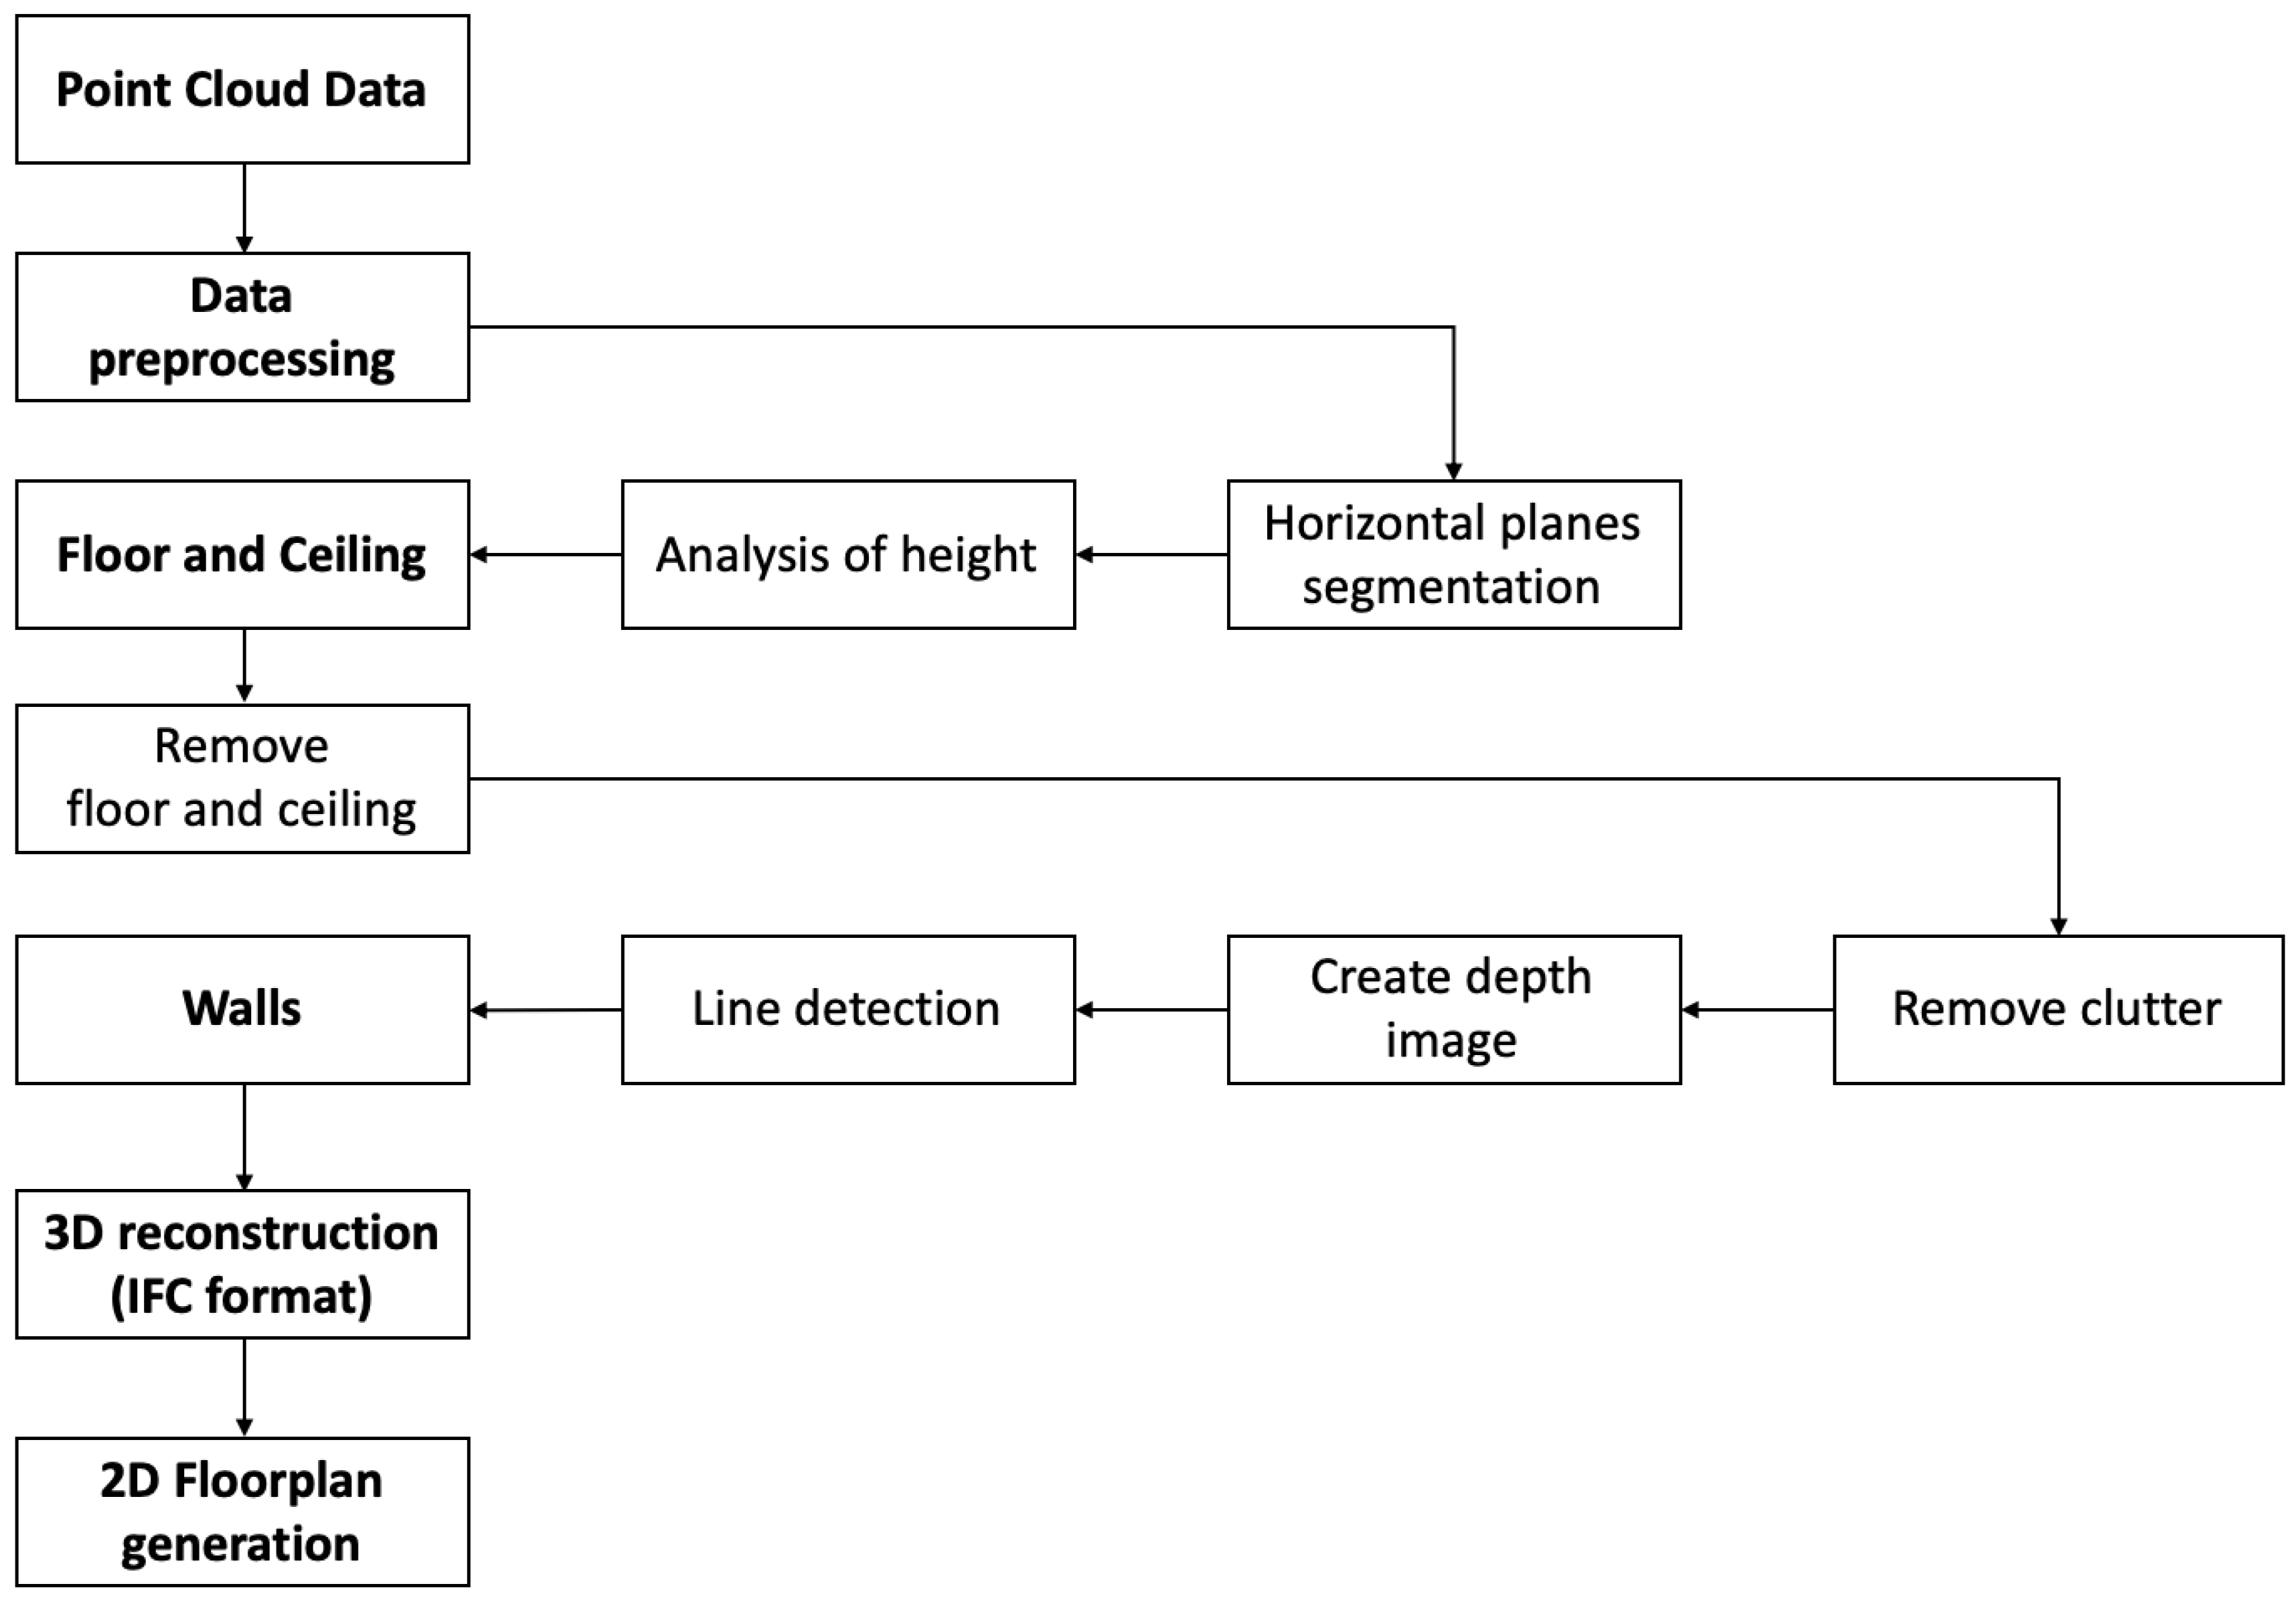
- 3D point cloud data preprocessing
- Floor segmentation based on horizontal planes
- Wall proposals based on vertical planes for each floor
- Wall detection using the horizontal projection of wall proposals
- IFC file generation from the detected wall points
3.1. Data Pre-Processing
3.2. Floor Segmentation
3.3. Wall Detection
- -
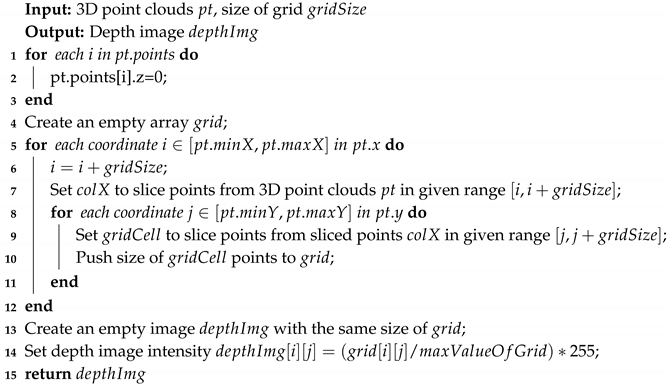
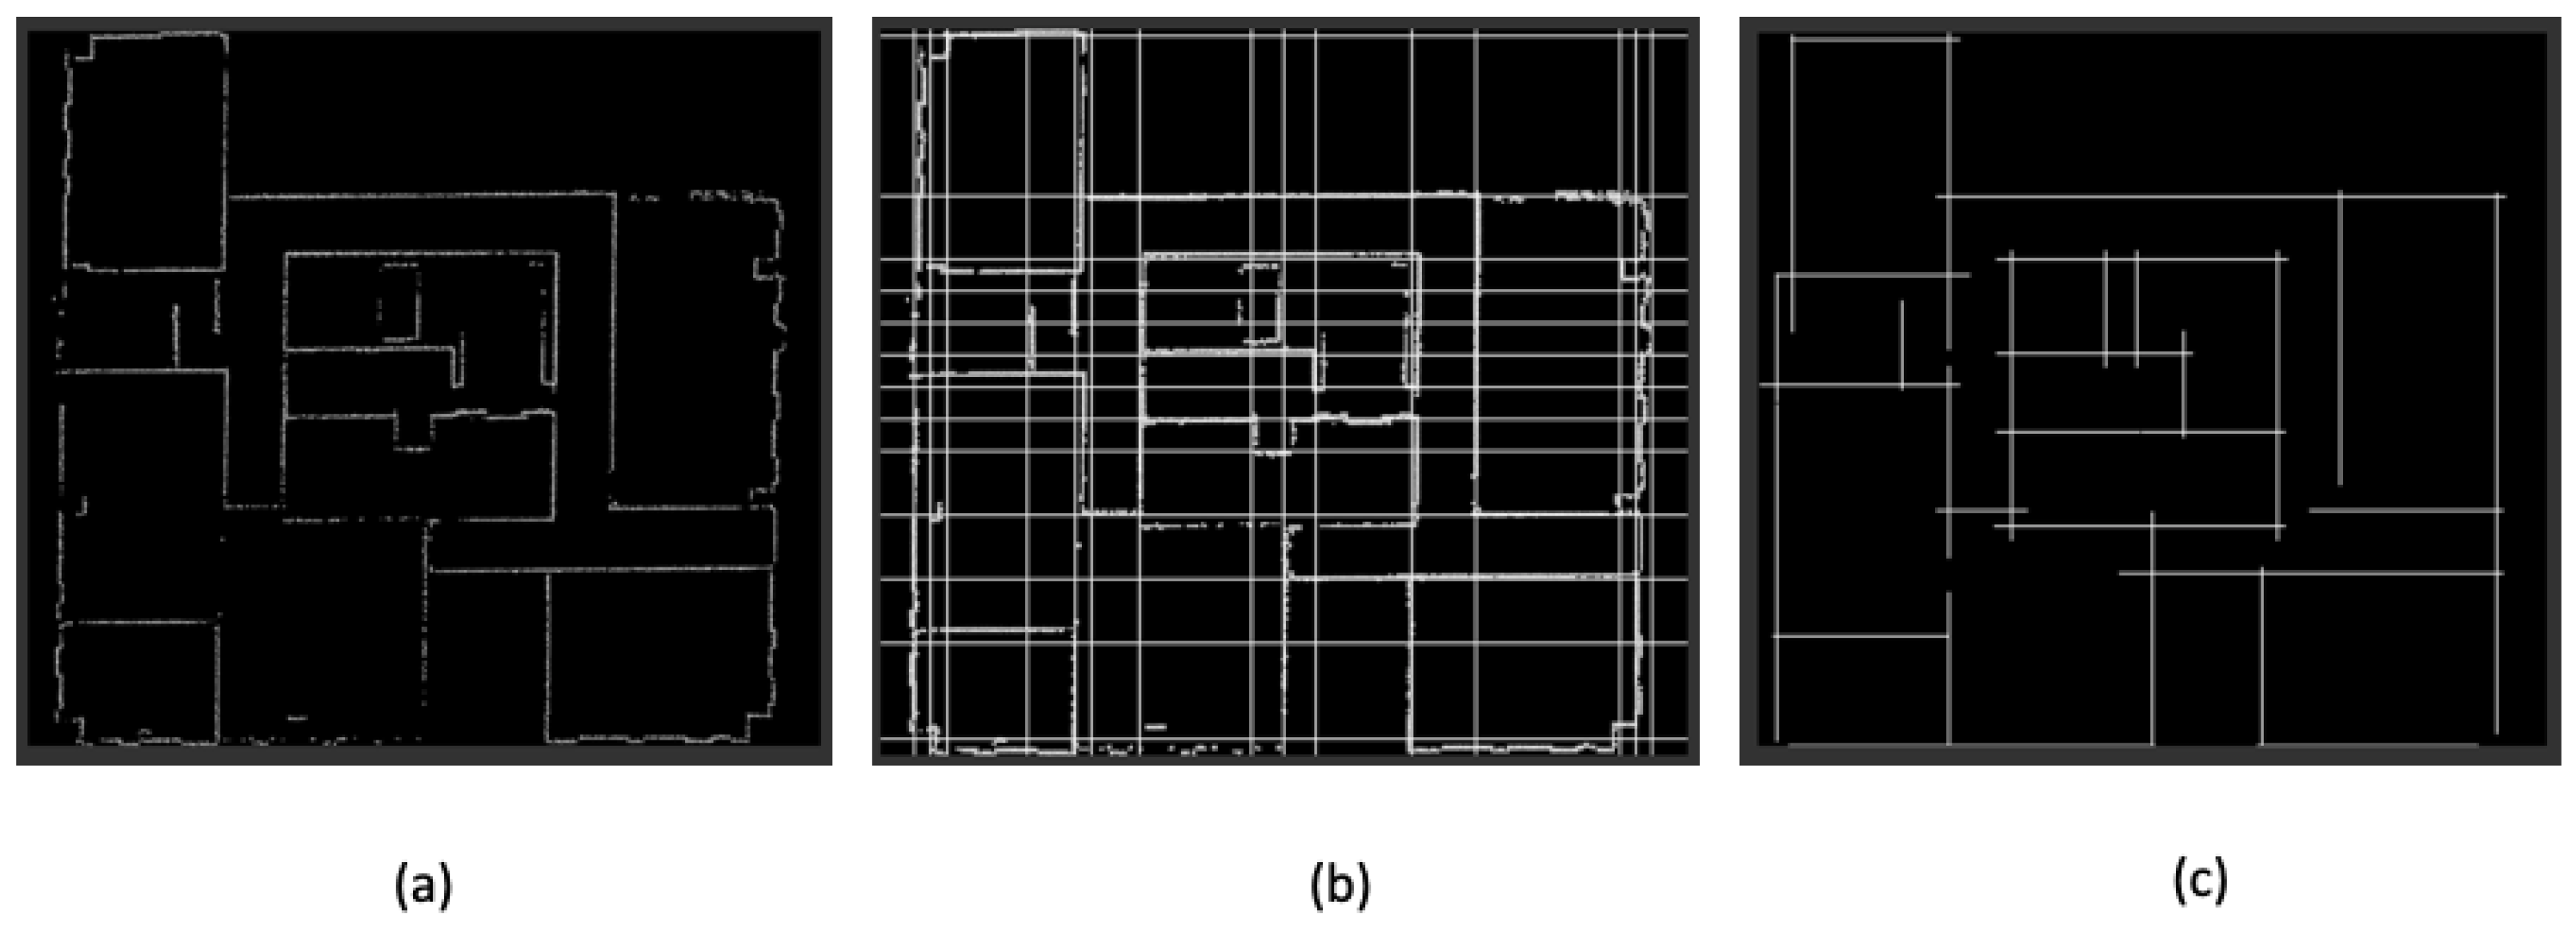
- Inputs are 3D point clouds of wall proposals and the grid size (default value for the grid size: 0.01 m).
- -
- 3D point clouds are projected into the x–y plane (lines 1 and 3), meaning we set all z-axis points to zero.
- -
- Create a grid structure from projected 3D point clouds (lines between 4 and 12). The projected 3D point clouds are initially sliced on the x-coordinate with range [i, i+gridSize] and then on the y-coordinate with range [j, j+gridSize], where i is an x-coordinate value of i-th point and j is a y-coordinate value of the j-th point. Then, the point density of each grid cell is then saved in a grid.
- -
- Create an empty image with the height and width of the grid (line 13).
- -
- Calculate the image intensity based on the described grid (line 14). In an image, intensity defines the pixel value; i.e., the pixel can have a value from 0 to 255 in a grayscale image.
| Algorithm 1: Create Depth Image from 3D Point Clouds. |
 |
- -
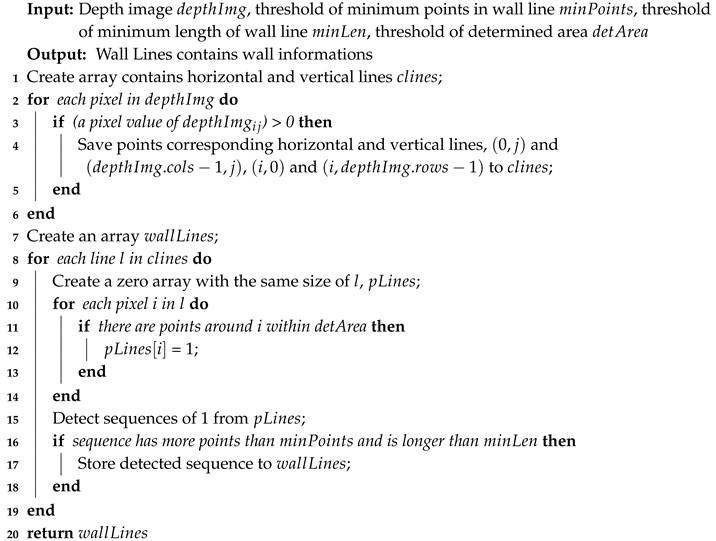
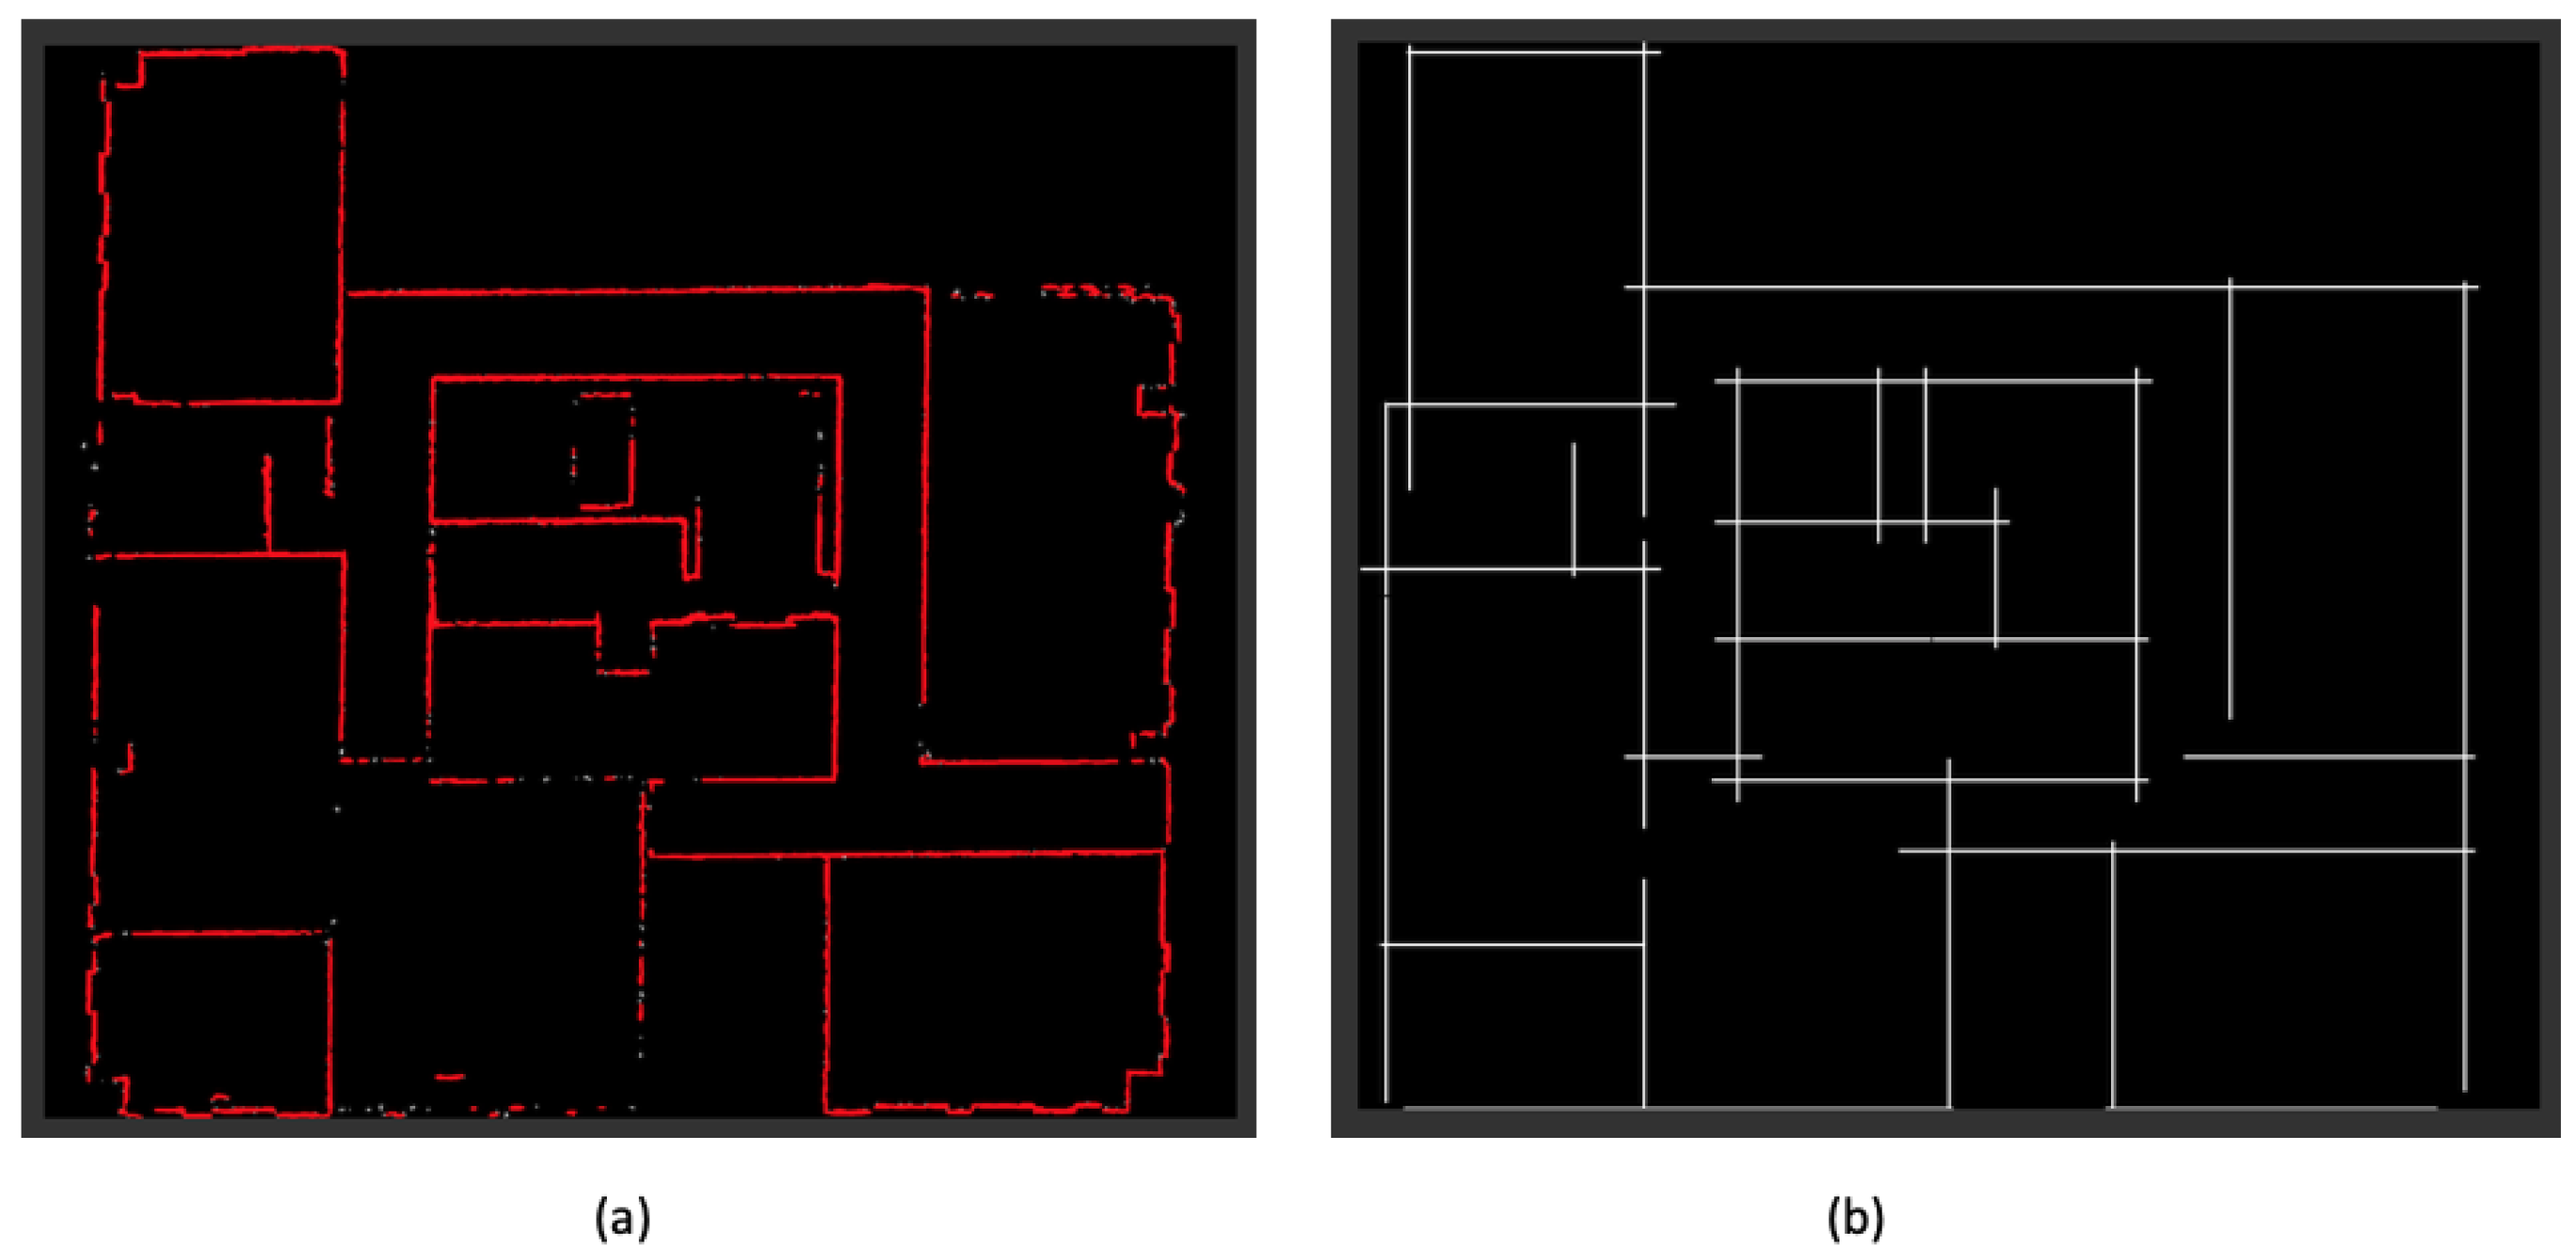
- Inputs are the depth image that results from Algorithm 1 and the thresholds, i.e., minimum points for the wall line, ; minimum length of the wall line, ; and determined area, .
- -
- Define the wall candidate lines, (lines between 1 and 6). If a pixel, , has an intensity value greater than 0, i.e., the pixel is not black, then the pixel is a part of the wall candidate lines. Therefore, the horizontal and vertical lines that pass the pixel are drawn. In detail, the horizontal and vertical lines are described by two points: and , and and . This process is repeatedly done for all pixels in .
- -
- Define actual wall lines from wall candidate lines (lines between 7 and 20). First, we check the pixels in each wall candidate line, . If there are points around the pixel within the predefined area threshold (the default value is 50 pixels), it means that the pixel can be a part of the wall line. We set an area threshold value because there are some missing points and noise from the LIDAR sensor. We set to 1 if the i-th pixel satisfies the condition, and set it to 0 otherwise. As a result, we obtain the vector, which is a sequence of 0 and 1 for each wall candidate line. The size of the vector is equal to the width and height of the depth image for the horizontal and vertical wall candidate lines, respectively. Based on the vector, we determine the actual wall lines using the thresholds, i.e., minimum points on the wall line, , and minimum length of the wall line, . For example, if = {1, 1, 1, 1, 1, 1, 0, 0, 0, 1, 1, 1, 1, 1}, we can see two sequences of ones. If these two sequences meet the threshold condition, they are determined to be actual wall lines.
| Algorithm 2: Detect Wall Lines from Wall Candidate Lines. |
 |
3.4. IFC File and 2D Floorplan CAD Generation
4. Experiments
4.1. Experimental Environment
4.2. Experiment Results
5. Conclusions and Future Work
Author Contributions
Funding
Conflicts of Interest
References
- Wang, C.; Yong, K.; Kim, C. Automatic BIM component extraction from point clouds of existing buildings for sustainability applications. Autom. Constr. 2015, 56, 1–13. [Google Scholar] [CrossRef]
- Volk, R.; Stengel, J.; Schultmann, F. Building Information Modeling (BIM) for existing buildings—Literature review and future needs. Autom. Constr. 2014, 38, 109–127. [Google Scholar] [CrossRef] [Green Version]
- Previtali, M.; Díaz-Vilariño, L.; Scaioni, M. Indoor Building Reconstruction from Occluded Point Clouds Using Graph-Cut and Ray-Tracing. Appl. Sci. 2018, 8, 1529. [Google Scholar] [CrossRef] [Green Version]
- Coughlan, J.; Yuille, A. Manhattan world: Compass direction from a single image by Bayesian inference. IEEE ICCV 1999, 2, 941–947. [Google Scholar]
- Fischler, M.A.; Bolles, R.C. Random Sample Consensus: A Paradigm for Model Fitting with Applications to Image Analysis and Automated Cartography. Commun. ACM 1981, 24, 381–395. [Google Scholar] [CrossRef]
- Duda, R.O.; Hart, P.E. Use of the Hough Transformation to Detect Lines and Curves in Pictures. Commun. ACM 1972, 15, 11–15. [Google Scholar] [CrossRef]
- Peter, M.; Jafri, S.; Vosselman, G. Line segmentation of 2d laser scanner point clouds for indoor slam based on a range of residuals. ISPRS Ann. Photogramm. Remote Sens. Spat. Inf. Sci 2017, IV-2/W4, 363–369. [Google Scholar] [CrossRef] [Green Version]
- Anagnostopoulos, I.; Patraucean, V.; Brilakis, I.; Vela, P. Detection of walls, floors and ceilings in point cloud data. In Proceedings of the Construction Research Congress 2016, San Juan, Puerto Rico, 31 May 2016. [Google Scholar]
- Landrieu, L.; Mallet, C.; Weinmann, M. Comparison of belief propagation and graph-cut approaches for contextual classification of 3D lidar point cloud data. In Proceedings of the IGARSS2017, Fort Worth, TX, USA, 23 July 2017. [Google Scholar]
- Vo, A.V.; Truong-Hong, L.; Laefer, D.F.; Bertolotto, M. Octree-based region growing for point cloud segmentation. ISPRS J. Photogramm. Remote Sens. 2015, 104, 88–100. [Google Scholar] [CrossRef]
- Schnabel, R.; Wahl, R.; Klein, R. Efficient RANSAC for Point-Cloud Shape Detection. Comput. Graph. 2007, 26, 214–226. [Google Scholar] [CrossRef]
- Ochmann, S.; Vock, R.; Wessel, R.; Tamke, M.; Klein, R. Automatic generation of structural building descriptions from 3D point cloud scans. In Proceedings of the 2014 International Conference on Computer Graphics Theory and Applications (GRAPP), Lisbon, Portugal, 5–8 January 2014; pp. 1–8. [Google Scholar]
- Borrmann, D.; Elseberg, J.; Kai, L.; Nüchter, A. The 3D Hough Transform for plane detection in point clouds: A review and a new accumulator design. 3D Res. 2011, 2, 3. [Google Scholar] [CrossRef]
- Okorn, B.; Xiong, X.; Akinci, B.; Huber, D. Toward Automated Modeling of Floor Plans. 2010. Available online: https://ri.cmu.edu/pub_files/2010/5/20093DPVTplanviewmodelingv13(resubmitted).pdf (accessed on 31 December 2019).
- Oesau, S.; Lafarge, F.; Alliez, P. Indoor scene reconstruction using feature sensitive primitive extraction and graph-cut. ISPRS J. Photogramm. Remote Sens. 2014, 90, 68–82. [Google Scholar] [CrossRef] [Green Version]
- Fan, Y.; Wang, M.; Geng, N.; He, D.; Chang, J.; Zhang, J.J. A self-adaptive segmentation method for a point cloud. Vis. Comput. 2018, 34, 659–673. [Google Scholar] [CrossRef]
- Vosselman, G.; Rottensteiner, F. Contextual segment based classification of airborne laser scanner data. ISPRS J. Photogram. Remote Sens. 2017, 128, 354–371. [Google Scholar] [CrossRef]
- Xiong, X.; Adan, A.; Akinci, B.; Huber, D. Automatic creation of semantically rich 3D building models from laser scanner data. Autom. Constr. 2013, 31, 325–337. [Google Scholar] [CrossRef] [Green Version]
- Wolf, D.; Prankl, J.; Vincze, M. Fast Semantic Segmentation of 3D Point Clouds using a Dense CRF with Learned Parameters. In Proceedings of the IEEE International Conference on Robotics and Automation (ICRA), Seattle, WA, USA, 26 May 2015. [Google Scholar]
- Bassier, M.; Vergauwen, M.; Van Genechten, B. Automated Semantic Labelling of 3D Vector Models for Scan-to-BIM. In Proceedings of the 4th Annual International Conference on Architecture and Civil Engineering (ACE 2016), Singapore, 26 April 2016; pp. 93–100. [Google Scholar]
- Nikoohemat, S.; Peter, M.; Oude Elberink, S.; Vosselman, G. Exploiting Indoor Mobile Laser Scanner Trajectories for Semantic Interpretation of Point Clouds. ISPRS Ann. Photogram. Remote Sens. Spat. Inf. Sci. 2017, 355–362. [Google Scholar] [CrossRef] [Green Version]
- Adan, A.; Huber, D. 3D Reconstruction of Interior Wall Surfaces under Occlusion and Clutter. In Proceedings of the 2011 International Conference on 3D Imaging, Modeling, Processing, Visualization and Transmission, Hangzhou, China, 16–19 May 2011; pp. 275–281. [Google Scholar]
- Michailidis, G.T.; Pajarola, R. Bayesian graph-cut optimization for wall surfaces reconstruction in indoor environments. Vis. Comput. 2017, 33, 1347–1355. [Google Scholar] [CrossRef] [Green Version]
- Nguyen, T.; Oloufa, A.; Nassar, K. Algorithms for automated deduction of topological information. Autom. Constr. 2005, 14, 59–70. [Google Scholar] [CrossRef]
- Belsky, M.; Sacks, R.; Brilakis, I. Semantic Enrichment for Building Information Modeling. Comput. Aided Civ. Inf. 2016, 31, 261–274. [Google Scholar] [CrossRef]
- Anagnostopoulos, I.; Belsky, M.; Brilakis, I. Object Boundaries and Room Detection in As-Is BIM Models from Point Cloud Data. In Proceedings of the 16th International Conference on Computing in Civil and Building Engineering, Osaka, Japan, 6–8 July 2016. [Google Scholar]
- Rusu, R.B.; Cousins, S. 3D is here: Point Cloud Library (PCL). In Proceedings of the IEEE International Conference on Robotics and Automation (ICRA), Shanghai, China, 13 May 2011. [Google Scholar]
- Ifcopenshell Team. The Open Source IFC Toolkit and Geometry Engine. Available online: http://ifcopenshell.org/ (accessed on 31 December 2019).
- Liu, C.; Wu, J.; Furukawa, Y. FloorNet: A Unified Framework for Floorplan Reconstruction from 3D Scans. Lect. Notes Comput. Sci. 2018, 203–219. [Google Scholar] [CrossRef] [Green Version]


| Dataset | Scanner | # of Rooms | # of Points | Floor Size | Degree of Clutter | Degree of Missing Points |
|---|---|---|---|---|---|---|
| Seventh floor of the Robot Convergence Building of Korea University | ZEB-REVO | 7 | 1,969,106 | 300 m | High | Low |
| Second floor of residential house | Velodyne HDL-32E | 5 | 14,756,398 | 66.6 m | High | High |
| Tango Scan-1 | Google Tango phones | 4 | 1,000,193 | - | Medium | High |
| Tango Scan-2 | Google Tango phones | 5 | 1,000,077 | - | Low | High |
| Processing Time (s) | |
|---|---|
| Hough transform | 15.7166 |
| Proposed algorithm | 15.6943 |
| Seventh Floor of the Robot Convergence Building of Korea University | Second Floor of Residential House | Tango Scan-1 | Tango Scan-2 | |
|---|---|---|---|---|
| TP | 92.8% | 91% | 92.2% | 97.5% |
| FT | 5.8% | 7.1% | 5.5% | 1.6% |
| FN | 2% | 2.3% | 2.2% | 0.08% |
| Precision | 94% | 92.7% | 94.3% | 98.3% |
| Recall | 97.8% | 97.5% | 97.6% | 99.1% |
| Dataset | 3D Reconstruction BIM | 2D Floorplan CAD [SVG] |
|---|---|---|
| Seventh floor of the Robot Convergence Building of Korea University | 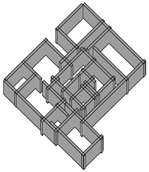 |  |
| Second floor of residential house |  | 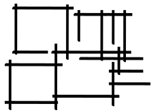 |
| Tango Scan-1 |  |  |
| Tango Scan-2 |  |  |
© 2020 by the authors. Licensee MDPI, Basel, Switzerland. This article is an open access article distributed under the terms and conditions of the Creative Commons Attribution (CC BY) license (http://creativecommons.org/licenses/by/4.0/).
Share and Cite
Gankhuyag, U.; Han, J.-H. Automatic 2D Floorplan CAD Generation from 3D Point Clouds. Appl. Sci. 2020, 10, 2817. https://doi.org/10.3390/app10082817
Gankhuyag U, Han J-H. Automatic 2D Floorplan CAD Generation from 3D Point Clouds. Applied Sciences. 2020; 10(8):2817. https://doi.org/10.3390/app10082817
Chicago/Turabian StyleGankhuyag, Uuganbayar, and Ji-Hyeong Han. 2020. "Automatic 2D Floorplan CAD Generation from 3D Point Clouds" Applied Sciences 10, no. 8: 2817. https://doi.org/10.3390/app10082817
APA StyleGankhuyag, U., & Han, J.-H. (2020). Automatic 2D Floorplan CAD Generation from 3D Point Clouds. Applied Sciences, 10(8), 2817. https://doi.org/10.3390/app10082817


