Abstract
To investigate the level of bilateral symmetry or asymmetry between right and left foot center of pressure (COP) trajectory in the mediolateral and anteroposterior directions, this study involved 102 participants (54 females and 48 males). Ground reaction forces were measured using two Kistler force plates during two 45-s quiet standing trials. Comparisons of COP trajectory were performed by correlation and scatter plot analysis. Strong and very strong positive correlations (from 0.6 to 1.0) were observed between right and left foot anteroposterior COP displacement trajectory in 91 participants; 11 individuals presented weak or negative correlations. In the mediolateral direction, moderate and strong negative correlations (from −0.5 to −1.0) were observed in 69 participants, weak negative or weak positive correlations in 30 individuals, and three showed strong positive correlations (0.6 to 1.0). Additional investigation is warranted to compare COP trajectories between asymptotic individuals as assessed herein (to determine normative data) and those with foot or leg symptoms to better understand the causes of COP asymmetry and aid clinicians with the diagnosis of posture-related pathologies.
1. Introduction
The force exerted by the body on the ground when standing is mirrored by a reaction force. The use of footwear during many activities of daily living not only provides a level of protection but also modifies the pressure distribution characteristics of the feet and, therefore, the forces that act on the foot. Depending on the type of footwear, these forces may be attenuated or “dampened”. Additionally, the shape and construction of the sole, insole and heel may all modify the forces and load experienced by different foot regions [1,2,3].
From a mechanical perspective, balance preservation during upright standing is quite complex as the human body is never in a condition of perfect equilibrium and that balance must be maintained via two points of contact (both feet). The center of all external forces acting on the plantar surface of the foot is known as the center of pressure (COP). While providing a base of support, the feet can independently induce changes in COP trajectory in the coronal (anteroposterior direction) and sagittal (mediolateral direction) planes and, therefore, obfuscate right and left COP to create a condition of asymmetry. While COP displacement in the anteroposterior direction can be understood as bilaterally symmetrical when the trajectory (forward or backward) is concurrently equal between both feet, the level of bilateral symmetry in the mediolateral direction is far more problematic to measure. One possible method for assessing bilateral symmetry in mediolateral COP trajectory is by considering foot structure. Albeit an oversimplification, this paradigm allows us to treat COP displacement as symmetrical when left and right foot mediolateral COP both shift either to the inside or outside of the feet.
The literature is abound with studies investigating balance preservation during quiet standing primarily by analyzing COP-related variables. However, the vast majority is based on using a single force plate and thus measure the exerted force concurrently for both feet [4,5,6,7,8,9,10]. Few investigations have addressed the magnitude and distribution of force separately for the right and left foot with the use of more than one force platform. Although Soangra and Lockhart [11] and Brauer et al. [12] investigated the similarities and dissimilarities between right and left foot COP trajectories, no studies have yet addressed COP displacement in regards to the level of symmetry (or asymmetry) between the left and right foot. As COP has been identified as a measure of the neuromuscular response to maintain balance, differences in right and left foot COP trajectories can serve as a measure of sensorimotor control and function. In this way, the respective COP trajectories for either foot and the congruence between both points of application signify the ability of the central nervous system to integrate information from the sensory systems and then activate different postural muscles (exerting pressure at a specific foot region) so that upright stance is preserved.
While the foot can be assumed to hold two degrees of freedom relative to the lateral gastrocnemius (plantarflexion/dorsiflexion and inversion/eversion), COP displacement can independently shift not only in the anteroposterior and mediolateral directions but also combinations of the two, such as an anterior or posterior slant to either the medial or lateral side. If analyzed as a temporal series, this bivariate approach for each foot could help identify patterns in left and right foot COP trajectory. Knowledge of COP displacement between both feet across different population cohorts can help identify postural pathologies including foot deformities resulting from improper footwear or decreased neuromuscular control by some deficiency in central nervous system function.
Therefore, the purpose of the study was to define the incidence of right and left foot symmetry or asymmetry via displacement in COP trajectory by identifying what associations exist between left and right foot COP direction in an asymptomatic population. By knowing the value of the symmetry between left and right foot COP displacement, it could be possible to formulate criteria for evaluating postural balance during upright standing. We hypothesized that the temporal and spatial characteristics of right and left foot COP trajectories during upright stance would show little variability in a sample of healthy young adults.
2. Material and Methods
2.1. Subject
An age-homogeneous sample of 102 university students (54 females and 48 males) was recruited. Mean age was 21.08 ± 1.08 years, height 172.89 ± 9.56 cm and body mass 68.09 ± 13.12 kg. All individuals provided their written informed consent to participate in the study and ethical approval was obtained. All procedures were performed at a biomechanics research laboratory at the Opole University of Technology in Opole, Poland. The participants signed informed consent and were informed of the protocol and procedures for the experiment prior to the exercise. The study was approved by the Human Ethics Committee.
2.2. Ground Reaction Force (GRF) Measurement Procedure
The study protocol involved measuring ground reaction force during two 45-s trials of static standing. Ground reaction force (GRF) data were synchronously collected on two 600 × 400 mm piezoelectric force platforms (Kistler Type 9286B; Kistler Instruments AG, Winterthur, Switzerland) placed under each foot. Four tri-axial force sensors located in the corners of each platform quantified the ground reaction force signals at a sampling frequency of 50 Hz (measurement range was from 10 kN to 20 kN). The force platforms were calibrated before use and integrated with a base transceiver station (BTS) Smart optoelectronic system (BTS Bioengineering, USA) to register the force–time characteristics. During signal acquisition, the participant was asked to assume a relaxed upright posture (minimizing head and trunk movements) with the upper extremities resting freely against the trunk and to fixate on a point placed at eye level 3 m from the subject. Only running shoes were allowed, and the participant stood with their feet completely parallel (no ankle rotation with a 30 cm stance width).
2.3. COP Measurement
GRF signals were recorded 10 s after trial commencement for 45 s. The two trials were executed one after the other with no change in foot position. The Bioware software automatically calculated x- and y-axis COP location (in mm) separately for right and left foot using the equations:
where:
where:
Ax = (Fx*az0 − My)/Fz = −My’/Fz
| Ax | path of the lateral direction of the force component |
| Fx | magnitude of the component of the ground reaction force, caused by the pressure of the foot acting on the left to the right direction |
| az0 | constant value for a given measuring instrument (see Kistler platform) determining the distance of the piezoelectric sensor from the platform level |
| My | the moment of the component of the ground reaction force, caused by the pressure of the foot acting in the forward–backward direction |
| Fz | the magnitude of the component of the ground reaction force, caused by the pressure of the foot acting vertically |
Ay = (Fy*az0 + Mx)/Fz = Mx’/Fz,
| Ay | way of action of force component back and forth |
| Fx | the magnitude of the component of the ground reaction force, caused by the pressure of the feet acting on the left to the right direction |
| az0 | constant value for a given measuring instrument (see Kistler platform) determining the distance of the piezoelectric sensor from the platform level |
| Mx | the moment of the component of the ground reaction force, caused by the pressure of the foot acting in the direction to the left to the right |
| Fz | the magnitude of the component of the ground reaction force, caused by vertical pressure of the feet |
In order to aid the quantification of COP trajectory as a function of time, the initial COP location was shifted to the mean COP location (calculated for each trial).
A mathematical coordinate system was used to present the test results. The x- and y-axes show the direction of action of ground reaction forces caused by foot pressure on the ground. This is called phase plane (ground). The x-axis represents the action of these forces in the left and right directions. The y-axis represents the action of these forces in the forward and reverse directions. In the context of these axes, anterior foot pressure means that the subject transfers weight to the toes and hind toes. There are people who transfer weight to the foot in opposite directions: outside, to the left foot to the left and to the right foot to the right; or inwards, to the left foot to the right and to the right foot to the left. Hence the term “mid-lateral”.
The COP data (2250 measures per trial) were then plotted as a statokinesigram for COP spatial trajectory in the mediolateral and anteroposterior directions as well as a stabilogram showing the temporal domain of COP in both directions. An example of the COP trajectory as a stabilogram and statokinesigram is illustrated in Figure 1 and Figure 2, respectively.
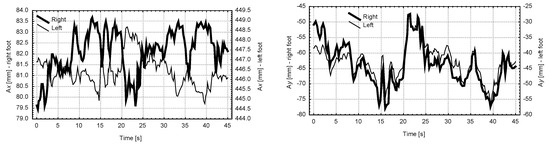
Figure 1.
Exemplary stabilogram of center of pressure (COP) time series data in the mediolateral (Ax) and anteroposterior (Ay) directions.
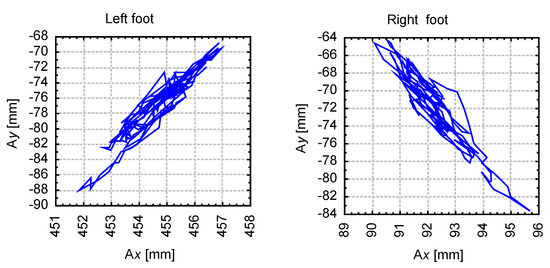
Figure 2.
Exemplary statokinesigram of COP spatial data in the mediolateral (Ax) and anteroposterior (Ay) direction.
The selection of a right COP shift trajectory of the right and left foot may illustrate the motor abilities of the subject. The human may determine and choose a right COP displacement trajectory for the right or left foot. Namely, the human may decide on part of a foot which will put pressure on the surface.
2.4. Statistical Analysis
Basic descriptive statistics were calculated (means ± standard deviations). The Shapiro–Wilk test was used to determine if the data set was well-modeled by a normal distribution. Differences between the obtained values were assessed using Student’s t-test. The level of symmetry or asymmetry in COP displacement trajectory between the right and left foot in both the mediolateral and anteroposterior directions was assessed with Pearson’s correlation coefficients. Correlations between right and left foot COP trajectory were independently calculated in the mediolateral and anteroposterior directions for each participant. Additionally, the correlation coefficients of COP trajectory between the mediolateral and anteroposterior directions were also calculated independently for the right and left foot. The level of significance was set at α = 0.05. All data processing was performed with the Statistica 10.0 software package.
3. Results
The assumption of normality was confirmed, indicating a normal distribution. As no significant between-sex differences for COP displacement trajectory were found, the data were analyzed for the entire sample (n = 102). Furthermore, t-tests revealed no significant differences between the first and second trial, hence analysis involved only data from the first trial.
The correlations between right and left foot COP trajectory in the mediolateral and anteroposterior directions are presented as a histogram (Figure 3). Strong and very strong positive correlations (0.6 to 1.0) for right and left foot COP displacement trajectory in the mediolateral direction were observed in 91 participants while 11 individuals presented weak or negative correlations. In the anteroposterior direction, moderate and strong negative correlations (−0.5 to −1.0) were observed in 69 participants while 30 were found with weak negative or positive correlations. Strong positive correlations (0.6 to 1.0) in the mediolateral direction were observed in only three individuals.
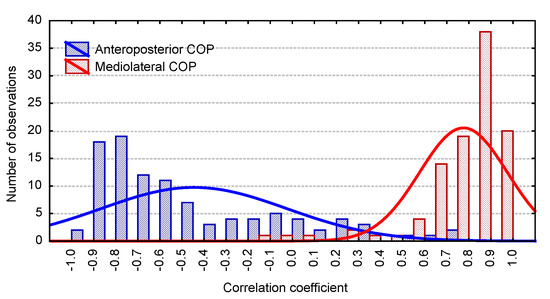
Figure 3.
Histogram of correlation coefficients between right and left foot COP trajectory in the mediolateral and anteroposterior directions.
In order to better illustrate the correlations of COP trajectory between the mediolateral and anteroposterior directions, a scatter plot was generated in which the correlations were plotted for each participant (Figure 4). The x-axis was used to delineate the right foot correlations between COP trajectory directions whereas the y-axis represented the left foot. Based on this structure, four quadrants were defined.
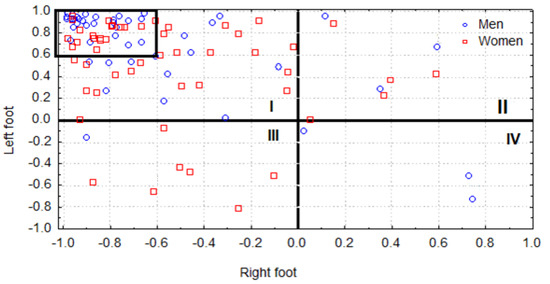
Figure 4.
Scatter plot illustrating the correlations between right (x-axis) and left foot (y-axis) mediolateral and anteroposterior COP trajectories for each participant.
The first quadrant (Quadrant I) contains the participants (42 females and 41 males) presenting positive left foot and negative right foot correlations. The second quadrant (Quadrant II) represents those participants (five females and three males) with a positive correlation between the mediolateral and anteroposterior directions in both the right and left foot The third quadrant (Quadrant III), in turn, contains those participants (seven females and one male) with negative right and left foot correlations in both directions whereas the fourth quadrant (Quadrant IV) entails the small group of participants (three males) with positive right foot and negative left foot correlations.
The majority of the sample (n = 83) was grouped in the second quadrant (Quadrant II). A statokinesigram representative of this group was extracted from Participant 1 (Figure 5), who was found with a correlation coefficient of 0.94 for the left and −0.94 for the right foot. Furthermore, 57 participants (more than half the sample) in this quadrant presented strong correlations in both the left (r = 0.6 to 1.0) and right (r = −1.0 to −0.6) feet. A box was drawn in Figure 4 to highlight this congregation.
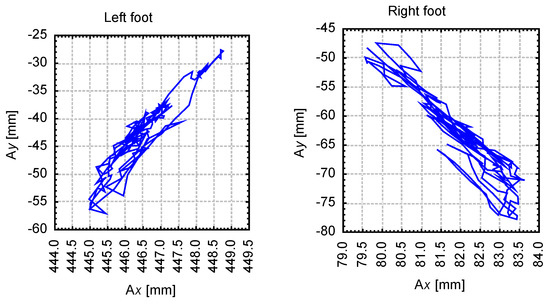
Figure 5.
Stabilogram of right and left foot COP trajectories in the mediolateral (Ax) and anteroposterior (Ay) directions for Participant 1 (Quadrant II).
On the opposite spectrum, the three individuals composing the fourth quadrant (Quadrant IV) can be characterized by the statokinesigram of Participant 13 (Figure 6), who was found to present a correlation coefficient of −0.72 for the left and 0.74 for the right foot. The third quadrant (Quadrant III) can be represented by the statokinesigram of Participant 72 (Figure 7), with correlation coefficients of −0.65 for the left and 0.62 for the right foot. An exemplary statokinesigram of the participants located in the first quadrant (Quadrant I) is provided by Participant 93 (Figure 8), with correlation coefficients of 0.67 for the left and 0.59 for the right foot.
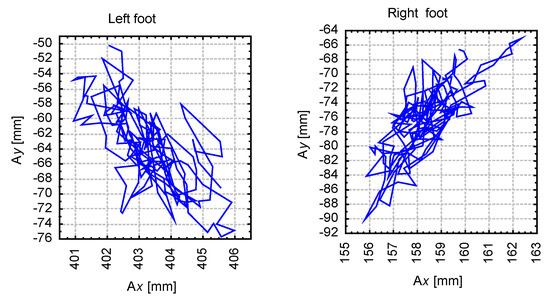
Figure 6.
Stabilogram of right and left foot COP trajectories in the mediolateral (Ax) and anteroposterior (Ay) directions for Participant 13 (Quadrant IV).
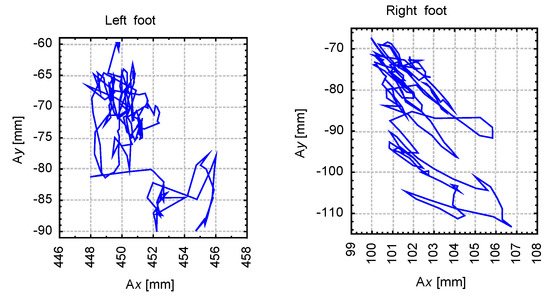
Figure 7.
Stabilogram of right and left foot COP trajectories in the mediolateral (Ax) and anteroposterior (Ay) directions for Participant 72 (Quadrant III).
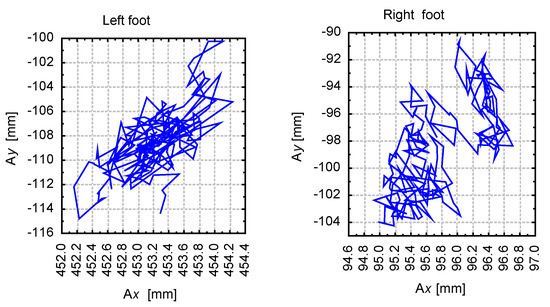
Figure 8.
Stabilogram of right and left foot COP trajectories in the mediolateral (Ax) and anteroposterior (Ay) directions for Participant 93 (Quadrant I).
4. Discussion
This investigation considered how balance is maintained during an upright stance when COP is assessed over two points of application (both feet) with respect to the supporting surface. At first glance, it seems logical that the COP of each foot should be equal and, therefore, exhibit symmetry when balance is being maintained in a static position. The present study operated under the premise that a positive correlation between right and left foot COP trajectories (in the mediolateral and anteroposterior directions) indicates symmetry whereas a negative correlation indicates asymmetry. We hypothesized that the incidence of fluctuations or asymmetry between right and left foot COP can indicate foot pathology resulting from improper footwear or decreased neuromuscular control.
In our sample of healthy young adults, strong negative correlations between right and left foot COP in the mediolateral direction were found in approximately 67% of the participants. This indicates that during the quiet standing task the participants exerted pressure on the lateral boundary of the left foot while concurrently exerting pressure on the medial boundary of the right foot and, therefore, exhibit asymmetry. In turn, approximately 29% of the sample presented correlations coefficients between −0.4 and 0.3 between right and left foot mediolateral COP, which was considered to indicate more balanced symmetry albeit without any characteristic trend. More puzzling is the fact that the remaining 3% of the sample was found to show COP displacement simultaneously towards the medial and lateral sides of the right and left foot. From a biomechanical perspective, this type of balance control is difficult to understand. Interpretation of the correlation coefficients between right and left foot anteroposterior COP displacement found that approximately 88% of the sample presented considerable symmetry between both feet and that compared with mediolateral COP, anteroposterior COP trajectory shows a greater level of symmetry between both feet. In effect, these results find that the majority of the sample presented asymmetry albeit defined as mediolateral COP trajectory traversing towards both the medial and lateral boundaries of the feet. Symmetry, in turn, was observed in the anteroposterior direction in which COP trajectory was along the toes or heel of the foot. This asymmetry and symmetry were presented by 86 participants (n = 102) and, therefore, suggests that this form of postural control defines healthy and active adults.
Research has suggested that the occurrence of asymmetry when maintaining balance to be the result of musculoskeletal dysfunction or lower extremity dominance. These conclusions were drawn by Ageberg [13], Lin [14] or Barone [15] who performed posturography on two force plates or by comparing COP variables between the dominant and non-dominant leg in static bilateral conditions. However, during single-leg testing, Hoffmann [16] and Greve [17] or Cuğ et al. [18] did not observe any differences in postural balance between the dominant and non-dominant leg in young adults. The aforementioned studies have mentioned that functional leg dominance may play an important role in bilateral postural stability, where, in most individuals, the left leg is the functionally dominant extremity and the right leg the functionally non-dominant extremity. Interestingly, Micarelli et al. [19] found greater COP displacement in the right rather than left leg during quiet standing in a group of children 4–13 and 4–7 years old. Research on the development of postural control by Assaiante [20] found that the trunk serves as an important reference frame in the emergence of structured postural strategies. It has been suggested that shifting the center of mass over the left increases weight-bearing load of the left leg over time.
Of consideration is the use of a scatter plot as presented herein as it can provide facile comparisons with other cohorts or normative data or illustrate more clearly the relationships of COP trajectories between the right and left foot. For example, when considering left foot COP trajectory in both directions, over half of the sample was found to present a pattern in which COP displacement traversed in the anteroposterior direction with a rightwards slant (medial direction) whereas right foot COP followed an anteroposterior displacement with a leftwards shift (medial direction). This medial shift of right and left foot COP trajectory with an anteroposterior displacement in the majority of the sample is contrasted by the marginal number of participants (three individuals) who presented an inverse pattern. In this small group, anteroposterior COP trajectory was associated with a lateral COP displacement (towards the outside of both feet) in the forward direction whereas in the backward direction COP transversed in the medial direction (towards the outside of the feet). In addition, the visualization of COP data by mapping its trajectory in the spatial domain can show patterns in COP trajectory over the base of the support, i.e., the feet. The trends that we observed in the majority of the sample (Quadrant II, Figure 5) confirm the findings of Oba et al. [21], Rival et al. [22] and Cumberworth et al. [23], who concluded that postural stability (COP displacement) is limited to an area between the heel and toe alongside the lateral edge in adults.
Our sample, as previously mentioned, was composed of young and asymptotic individuals free of lower extremity injury or disability. Although not assessed in the present study, it can be presumed that the incidence of foot or leg pathologies can modify the maximum displacement of COP trajectory and, therefore, stability. The literature contains numerous reports that utilize data on COP area and its relation to the base of support as a measure of postural stability [24,25,26]. Riach and Starkes [20] sound that children show a larger area of stability than adults and that the limit of stability decreases with age. Young adults aged 18–27 years appropriate on average 73% of the anteroposterior and 75% of the mediolateral base of support during upright standing. By ages 40–70, individuals use only 54% and 59%, respectively [22]. Clifford and Holder-Powell [23] indicated that the elderly show an even further reduced base of support for postural stability. Bottaroa [24] reported that this observation is associated with the fact that young asymptotic adults use up to 80% while older adults only up to 50% of foot length to maintain balance.
The present findings raise a number of questions concerning the etiology of disturbed COP displacement trajectory between the right and left foot and indicate the need for additional investigation in this area. Further research on COP symmetry in various populations (athletes, physically impaired, sedentary individuals) can provide further insight on the causes of asymmetry (e.g., decreased neuromuscular control) and aid clinicians with the diagnosis of various posture-related pathologies.
5. Conclusions
Approximately 88% of the participants exhibited left and right foot symmetry for anteroposterior COP trajectory magnitude and direction. Asymmetry was noted in 67% of participants for mediolateral COP trajectory, in which COP displacement was observed along the lateral boundary of one foot and along the medial boundary of the other. In 82% of the samples, COP displacement followed an anteroposterior trajectory with a medial slant for left foot and lateral slant for right foot COP, whereas the remaining 12% showed other variations. These findings raise a number of questions concerning the etiology of asymmetric COP displacement trajectory between the right and left foot. Additional investigation is warranted to compare COP trajectories between asymptotic individuals and various populations (e.g., sedentary individuals, patients with foot or leg pathologies or athletes engaged in sports with strong lateralization) to better understand the causes of asymmetry and aid clinicians with the diagnosis of various posture-related pathologies.
Author Contributions
Conceptualization, J.S., J.V. and K.M.; methodology, K.M., W.B. and J.S.; software, W.B. and J.V.; validation, W.S., M.K. and J.S.; formal analysis, K.M. and J.S.; investigation, W.B., K.M. and J.S.; resources, J.S. and W.B.; data curation, W.B. and K.M.; writing—original draft preparation, J.S., J.V., K.M. and M.C.; writing—review and editing, J.S., J.V. and K.M.; visualization, J.S. and K.M., supervision, J.S. and K.M. All authors have read and agreed to the published version of the manuscript.
Funding
This research received no external funding.
Acknowledgments
The authors would like to acknowledge the involvement of the participants for their contribution to this study.
Conflicts of Interest
The authors have no conflict of interest to declare. The results do not constitute endorsement of any product or device. The authors would like to thank the sprinters who participated in this study.
References
- Fuller, J.T.; Bellenger, C.R.; Thewlis, D.; Tsiros, M.D.; Buckley, J.D. The effect of footwear on running performance and running economy in distance runners: A systematic review. Sports Med. 2015, 45, 411–422. [Google Scholar] [CrossRef] [PubMed]
- Mohr, M.; Meyer, C.; Nigg, N.; Nigg, B. The relationship between footwear comfort and variability of running kinematics. J. Footwear Sci. 2017, 9, 45–47. [Google Scholar] [CrossRef]
- Squadrone, R.; Rodano, R.; Preatoni, E.; Andreoni, G.; Pedotti, A. The EUROSHOE approach to ergonomics of foot and shoe. Ergon. IJE HF 2005, 27, 43–51. [Google Scholar]
- Winter, D.A. Human balance and posture control during standing and walking. Gait Posture 1995, 3, 193–214. [Google Scholar] [CrossRef]
- Winter, D.A. Biomechanics and Motor Control of Human Movement; John Wiley and Sons, Inc.: Hoboken, NJ, USA, 2009. [Google Scholar]
- Prieto, T.E.; Myklebust, J.B.; Hoffmann, R.G.; Lovett, E.G.; Myklebust, B.M. Measures of postural steadiness: Differences between healthy young and elderly adults. IEEE Trans. Biomed. Eng. 1996, 43, 956–966. [Google Scholar] [CrossRef] [PubMed]
- Winter, D.A.; Patla, A.E.; Prince, F.; Ishac, M.; Gielo-Perczak, K. Stiffness control of balance in quiet standing. J. Neurophysiol. 1998, 80, 1211–1221. [Google Scholar]
- Karlsson, A.; Frykberg, G. Correlations between force plate measures for assessment of balance. Clin. Biomech. 2000, 15, 365–369. [Google Scholar] [CrossRef]
- Gage, W.H.; Winter, D.A.; Frank, J.S.; Adkin, A.L. Kinematic and kinetic validity of the inverted pendulum model in quiet standing. Gait Posture 2004, 19, 124–132. [Google Scholar] [CrossRef]
- Kleipool, R.P.; Blankevoort, L. The relation between geometry and function of the ankle joint complex: A biomechanical review. Knee Surg. Sports Traumatol. Arthrosc. 2010, 18, 618–627. [Google Scholar] [CrossRef]
- Soangra, R.; Lockhart, T.E. Determination of stabilogram diffusion analysis coefficients and invariant density analysis parameters to understand postural stability associated with standing on anti-fatigue mats. Biomed. Sci. Instrum. 2012, 48, 415–422. [Google Scholar]
- Brauer, S.G.; Burns, Y.R.; Galley, P.A. prospective study of laboratory and clinical measures of postural stability to predict community-dwelling fallers. J. Gerontol. A Biol. Sci. Med. Sci. 2000, 55, 469–476. [Google Scholar] [CrossRef] [PubMed]
- Ageberg, E.; Roberts, D.; Holmström, E.; Fridén, T. Balance in single-limb stance in healthy subjects—Reliability of testing procedure and the effect of short-duration sub-maximal cycling. BMC Musculoskelet Disord. 2003, 27, 4–14. [Google Scholar] [CrossRef] [PubMed]
- Lin, W.H.; Liu, Y.F.; Hsieh, C.C.; Lee, A.J. Ankle eversion to inversion strength ratio and static balance control in the dominant and non-dominant limbs of young adults. J. Sci. Med. Sport 2009, 12, 42–49. [Google Scholar] [CrossRef] [PubMed]
- Rosario, B.F.; Macaluso, M.T.; Leonardi, V.; Farina, F.V. Soccer players have a better standing balance in nondominant one-legged stance. J. Sports Med. 2011, 2, 1–6. [Google Scholar]
- Hoffman, M.; Schrader, J.; Applegate, T.; Koceja, D. Unilateral postural control of the functionally dominant and nondominant extremities of healthy subjects. J. Athl. Train. 1998, 33, 319–322. [Google Scholar]
- Greve, J.; Alonso, A.; Bordini, A.C.; Camanho, G.L. Correlation between body mass index and postural balance. Clinics (Sao Paulo) 2007, 62, 717–720. [Google Scholar] [CrossRef]
- Cuğ, M.; Özdemir, A.R.; AK, E. Influence of leg dominance on single-leg stance performance during dynamic conditions: An investigation into the validity of symmetry hypothesis for dynamic postural control in healthy individuals. Turk. J. Phys. Med. Rehabil. 2014, 60, 22–26. [Google Scholar]
- Micarelli, A.; Viziano, A.; Augimeri, I.; Micarelli, B.; Alessandrini, M. Age-related assessment of postural control development: A cross-sectional study in children and adolescents. J. Mot. Behav. 2019. [Google Scholar] [CrossRef]
- Assaiante, C.; Mallau, S.; Viel, S.; Jover, M.; Schmitz, C. Development of postural control in healthy children: A functional approach. Neural Plast. 2005, 12, 109–118. [Google Scholar] [CrossRef]
- Oba, N.; Sasagawa, S.; Yamamoto, A.; Nakazawa, K.; Glasauer, S. Difference in postural control during quiet standing between young children and adults: Assessment with center of mass acceleration. PLoS ONE 2015, 10, e0140235. [Google Scholar] [CrossRef]
- Rival, C.; Ceyte, H.; Olivier, I. Developmental changes of static standing balance in children. Neurosci. Lett. 2005, 376, 133–136. [Google Scholar] [CrossRef]
- Cumberworth, V.L.; Patel, N.N.; Rogers, W.; Kenyon, G.S. The maturation of balance in children. J. Laryngol. Otol. 2007, 121, 449–454. [Google Scholar] [CrossRef] [PubMed]
- Lacour, M.; Bernard-Demanze, L.; Dumitrescu, M. Posture control, aging, and attention resources: Models and posture-analysis methods. Neurophysiol. Clin. 2008, 38, 411–421. [Google Scholar] [CrossRef] [PubMed]
- Clifford, A.M.; Holder-Powell, H. Postural control in healthy individuals. Clin. Biomech. 2010, 25, 546–551. [Google Scholar] [CrossRef] [PubMed]
- Bottaroa, A.; Yasutakeb, Y.; Nomurab, T.; Casaidioma, M.; Morassoa, P. Bounded stability of the quiet standing posture: An intermittent control model. Hum. Mov. Sci. 2008, 27, 473–495. [Google Scholar] [CrossRef] [PubMed]


© 2020 by the authors. Licensee MDPI, Basel, Switzerland. This article is an open access article distributed under the terms and conditions of the Creative Commons Attribution (CC BY) license (http://creativecommons.org/licenses/by/4.0/).