Article

Performance of a Trickling-Bed Biocathode Microbial Electrochemical System Treating Domestic Wastewater and Functional Microbial Community Characteristics

School of Municipal and Environmental Engineering, Shenyang Jianzhu University, No.25 Hunnan Middle Road, Hunnan New District, Shenyang 110168, China
*
Authors to whom correspondence should be addressed.
Appl. Sci. 2020, 10(9), 2989; https://doi.org/10.3390/app10092989
Submission received: 31 March 2020 / Revised: 17 April 2020 / Accepted: 21 April 2020 / Published: 25 April 2020

Abstract

:
Biocathode microbial electrochemical systems (MESs) that remove nitrogen compounds out of wastewater are of special interest for practice. High energy-input for aeration is one of the barriers that hinder their application on a wider scope. A trickling-bed biocathode MES (TB-MES) was developed by integrating biotrickling filters with a biocathode MES. By recirculating the catholyte and sprinkling it through a spray nozzle, the system was able to achieve a reoxygenation process, which could facilitate the creation of an aerobic and anoxic environment. At an optimal recirculation rate of 200 mL min−1, the TB-MES removed 87.2 ± 2.7% of ammonium nitrogen and 79.7 ± 2.5% of total nitrogen (TN), and simultaneously achieved a maximum power density of 3.8 ± 0.3 Wm−3. Comparable performances were achieved when treating domestic wastewater, which were 84.6 ± 2.4%, 70.1 ± 4.2%, and 3.2 ± 0.2 W m−3 for ammonium nitrogen removal, TN removal, and maximum power density. Pyrosequencing analysis revealed Nitrosomonas was more abundant in the upper portion of the carbon fiber brush biocathode (CFBup, 20.4%) and Azoarcus was more abundant in the lower portion (CFBbottom, 12.6%), which was probably caused by the difference in dissolved oxygen concentration in different parts of the biocathode. The TB-MES shows great promise for domestic wastewater treatment by employing biotrickling filters for oxygen supply in biocathode MES.

1. Introduction

Recovering useful energy from wastewater represents a promising way to transform traditional wastewater treatment processes from energy consumers to energy producers [1]. Among recently developed treatment approaches, microbial electrochemical systems (MESs) are capable of simultaneous wastewater treatment and electricity production through the catalytic activity of exoelectrogens [2]. Having achieved great progress in MES research and development with numerous bench-scale systems tests, more research has been carried out in scaling up MESs [3,4,5,6]. Up to now, biocathode MESs, using a microorganism catalyst instead of a chemical catalyst to promote the cathodic reaction, have drawn considerable attentions in pilot-scale MESs, due to their advantages in relatively low cost and long-term sustainability for wastewater treatment [7,8,9]. Moreover, because of the variety of in situ accumulated functional microorganisms, the biocathode exhibits as a potential approach to produce useful products and remove unwanted compounds, such as nitrogen compounds, which are common pollutants in agricultural, industrial, and domestic wastewater [10,11,12,13].
Since the anaerobic condition in the anode of an MES does not effectively facilitate total nitrogen removal, incorporating an aerobic process into an MES for nitrification becomes a key step for efficient nitrogen removal through biocathode MESs. The first demonstration of complete nitrogen removal in an MES was accomplished with the aid of an external biofilm-based aerobic reactor for nitrification [14]. In this system, the anodic effluent containing ammonia was pumped into an external aerated vessel, where ammonia was biologically oxidized to nitrate, and the nitrified liquid was subsequently flowed into the cathodic chamber for denitrification. Even though this “loop-configuration” successfully coupled nitrogen removal with energy recovery from acetate, it was unable to achieve low nitrogen levels in the effluent, largely due to the ammonia diffusion through the cation exchange membrane. To resolve this shortcoming, the subsequent design integrated the nitrification stage into the cathodic chamber, thus promoting simultaneous nitrification and denitrification (SND) in the same chamber [15]. Though a high nitrogen removal efficiency of 94.1 ± 0.9% was obtained in the MES, extra energy should be provided for aeration of the catholyte. It was estimated that the energy consumed by an activated sludge-based aerobic process (0.3 kWh m−3) was about one order of magnitude higher than the average energy produced by an MES treating domestic wastewater [16].
To reduce energy consumption associated with aeration, some rotating biocathodes were developed, which were able to achieve an oxygen gradient through agitation of the electrolyte and, consequently, produced aerobic and anoxic zones for nitrification and denitrification [17,18,19]. Though the membrane-less design of these systems could reduce the construction cost, it would facilitate the contact between organic matter and nitrate, thereby leading to significant heterotrophic denitrification and inhibiting bioelectrochemical denitrification (carried out by autotrophic denitrifying bacteria that are capable of accepting electrons from cathode). Consequently, the benefit of using MESs’ electricity-generating feature for nitrogen removal would be weakened [12]. Further improvement of energy reduction was accomplished in a tide-type biocathode MES [20]. Using the siphon principle for periodical water drainage, the biocathode was able to achieve intermittent aerobic/anoxic conditions during a continuous feeding and periodical draining process. Though energy-intensive aeration was obviated, and net energy output was achieved in this tide-type biocathode MES, the biocathode material preparation procedure should be further simplified for practical application [21].
Biotrickling filters (BFs), a common biological treatment technology for gaseous volatile organic compound, have been coupled with MES for treating ethyl acetate in waste gas [22,23,24]. These previous results demonstrated the feasibility of BF-MES integrated systems for coupling the biodegradation of gaseous contaminants with the generation of electricity. The porous filter materials used in BFs, involving a mixed population and upholding oxygen diffusion limits, could create both aerobic and anoxic microenvironments, which were suitable for the enrichment of nitrifiers and denitrifiers [25]. Therefore, integrating BF with biocathode MESs might be an effective approach for nitrogen removal and energy saving.
In this study, a trickling-bed biocathode microbial electrochemical system (TB-MES) was developed by integrating BF with a biocathode MES. The effect of the catholyte recirculation rate on TB-MES performance, in terms of energy production, nitrogen removal, and reoxygenation ability of the biocathode, was evaluated with synthetic medium as the feed. In addition, domestic wastewater was employed as a feed to investigate the feasibility of TB-MES for real wastewater treatment. Furthermore, microbial community composition, which developed on the biocathode, was analyzed to determine their contribution to power generation and pollutant removal.

2. Materials and Methods

2.1. Configuration of TB-MES

The trickling-bed biocathode microbial electrochemical system (TB-MES), constructed from Plexiglas, was comprised of two chambers separating by a cation exchange membrane (Ultrex CMI-7000, Membranes International, Inc., Ringwood, NJ, USA) (Figure 1) The cylindrical anode chamber with a total empty bed volume of 0.76 L (11 cm in inner diameter, 8 cm in height) was located at the bottom. The cathode chamber with a total empty bed volume of 2.4 L was located on the top, consisting of a thinner cylinder (8 cm in inner diameter, 25 cm in height) and a thicker cylinder (11 cm in inner diameter, 8 cm in height) connected by a cone frustum (8 cm in upper inner diameter, 11 cm in lower inner diameter, 5 cm in height). The cathode chamber was designed to be an irregular-shape, in order to facilitate the proton transfer, and to increase the differences in dissolved oxygen (DO) concentration between the upper and lower portion of the cathode chamber. Five carbon fiber brushes (4 cm in diameter and 8 cm in length; 3 K carbon fiber, Toray, Tokyo, Japan) were used as anodes [26], leaving the liquid volume of anode chamber to 0.72 L. Columnar activated carbon (CAC, Beijing Sanye Carbon Co. Ltd., Beijing, China), with a diameter of 2–4 mm and a length of 4–6 mm, was used as the packing material to support cathodic microbial attachment and biofilm formation. A porous Plexiglas plates with a diameter of 8 cm was used to support the CAC. The CAC was only placed in the thinner cylinder section of the cathode chamber, in order to slow down the membrane biofouling of the CEM. The CAC also functioned as auxiliary biocathode, by collecting and transporting electrons from the microorganisms to the main biocathodes, which were composed of four carbon fiber brushes (3 cm in diameter, 35 cm in length). The main biocathodes connected by titanium wires were inserted vertically into the packing material. The anode and biocathode electrodes were connected with titanium wires through an external resistance of 10 Ω during a stable operation period. The liquid volume of cathode chamber was reduced to approximate 2.1 L due to the use of main biocathode and auxiliary biocathode.

2.2. Inoculation and Operation

The anaerobic sludge and aerobic sludge, collected from secondary sedimentation tank and aeration tank, were respectively used as the anodic and cathodic inoculums. During the acclimation period, the external resistor was gradually reduced from 500 Ω to 10 Ω (500, 200, 100, 50, 10 Ω), with the whole acclimation period lasting for nearly 500 h. The system was operated at a hydraulic retention time (HRT) of 48 h, with the influent continuously pumped into the anode chamber. The anode effluent was then flowed through a loop connection, sprinkled to the cathode chamber through a spray nozzle, and finally drained out through an outlet. The operation period of TB-MES was divided into two phases. The artificial medium was employed as feed in Phase I, while that of Phase II was raw domestic wastewater. The synthetic medium contained 0.71 g L−1 sucrose, 0.16 g L−1 NH4Cl, 100 mL L−1 500 mM PBS (comprised of 33.2 g L−1 NaH2PO4∙2H2O, 1.3 g L−1KCl and 103.2 g L−1 Na2HPO4∙12 H2O), 5 mL L−1 vitamins, and 12.5 mL L−1 trace minerals [27]. In Phase I, the effects of catholyte recirculation rates on power generation, reoxygenation ability of the biocathode, and nitrogen removal were investigated. By adjusting the peristaltic pump, the TB-MES was operated at three recirculation rate of 50, 200, and 400 mL min−1, each of which was maintained for two weeks. In Phase II, domestic wastewater collected from wastewater pipeline in Harbin Institute of Technology, was employed as the influent. The characteristics of the domestic wastewater was as follows: COD, 285 ± 36 mg L−1; NH 4 + - N , 36 ± 5 mg L−1; NO 3 - N , 2 ± 0.8 mg L−1; NO 2 - N , 0 mg L−1; conductivity, 850 ± 118 μS cm−1; pH, 7.2 ± 1.6. Real wastewater treatment, in terms of COD removal, ammonia removal, and total nitrogen removal, was evaluated in Phase II, and microbial community composition was analyzed to determine their contribution to power generation and pollutant removal.

2.3. Measurements and Calculation

The voltage output was measured once every 30 min, using a PISO-813 data acquisition system (ICP DAS Co., Ltd., Taiwan, China). Polarization curves were acquired by varying the external resistance from 200 Ω to 2.5 Ω (200, 150, 100, 50, 25, 20,15, 10, 5, and 2.5 Ω). Data obtained at each resistor was recorded after a steady voltage was achieved, with a minimum running time of 1 h at each resistor. Before polarization curve measurement, the system was operated under open circuit mode for more than 12 h until a stable open circuit voltage was obtained. Power density (W m−3) and coulombic efficiency (CE) were obtained according to the previous method [28]. Chemical oxygen demand (COD), ammonium nitrogen, nitrate nitrogen and nitrite nitrogen were measured using the HACH DR/3900 Spectrophotometer (HACH Co., Loveland, CO, USA). Dissolved oxygen concentration was measured by a nonconsumptive dissolved oxygen probe (FOXY, Ocean Optics, Inc., Dunedin, FL, USA). The statistical significance of differences under different experiments was analyzed by Student’s t-test. The levels p< 0.05 is considered significantly different.

2.4. Microbial Community Analysis

Microbial communities of the biocathode were analyzed by pyrosequencing. Four samples, CFBup (Point A), CFBbottom(Point D), CACup(Point B),and CACbottom (Point C), were respectively collected from the carbon fiber brush biocathode and columnar activated carbon biocathode at the end of operation. Total genomic DNA was extracted using a Bacteriag DNA Mini Kit (Watson Biotechnologies, Inc., Shanghai, China) according to the manufacturer’s instructions, and the DNA density was assessed by 1% agarose gel electrophoresis. Pyrosequencing of amplicons was conducted using a 454/Roche GS-FLX instrument (Sangon Biotech Company, Shanghai, China) as in the previous study [29].

3. Results

3.1. Effects of Catholyte Recirculation Rate

The TB-MES was operated at a fixed HRT of 48 h during the start-up phrase, when the external resistor was gradually reduced from 500 Ω to 10 Ω (500, 200, 100, 50, 10 Ω). Functional microbial communities on anode and biocathode were accumulated, and the current density stabilized at 5.5 ± 1.8 A m−3 after an acclimation period of 500 h. As the anode effluent sprinkling to the cathode chamber, oxygen in the air could be carried into the cathode chamber by the anode effluent. In order to enhance this reoxygenation process, as well as to improve the agitation and mixing of substrates, the catholyte was circulated back to the spray nozzle by a peristaltic pump at a flow rate of 50, 200, and 400 mL min−1. Data was recorded after the current generation became relatively stable, and results showed that current density gradually increased from 6.2 ± 2.8 A m−3 to 19.6 ± 4.6 A m−3 as the catholyte recirculation rate increased from 50 mL min−1 to 400 mL min−1. Polarization curves were conducted after a stable open circuit voltage was obtained, and the system achieved a maximum power density at a 10 Ω resistor at each recirculation rate. Based on the polarization curve, the maximum power density increased gradually as the recirculation rate increased, following the same trend as the current generation. At a recirculation rate of 50 mL min−1, the maximum power density of TB-MES was 2.6 ± 0.1 Wm−3, which increased to 3.8 ± 0.3 Wm−3 at 200 mL min−1 (Figure 2) As the recirculation rate was further increased to 400 mL min−1, a maximum power density of 6.7 ± 0.5 Wm−3 was achieved by the TB-MES, which was 1.6 times higher in comparison with that at 50 mL min−1.
The improved performance in power generation at higher recirculation rate was probably due to the following reasons. Firstly, recirculation could generate shear effects, which facilitated the formation of thicker and denser biofilm, thus resulting in a better performance in TB-MES [30]. It is reported that, in a upflow MES, the maximum power density increased from 3.43 ± 0.04 Wm−3 to 7.11 ± 0.24 Wm−3 as the anolyte recirculation rate increased from 0 to 500 mL min−1 [31]. In the TB-MES, the higher catholyte recirculation rate was beneficial to the acclimation of cathodic microbial community, which could strengthen cathodic oxygen reduction reaction (ORR) and, thus, improved the power output of the TB-MES.
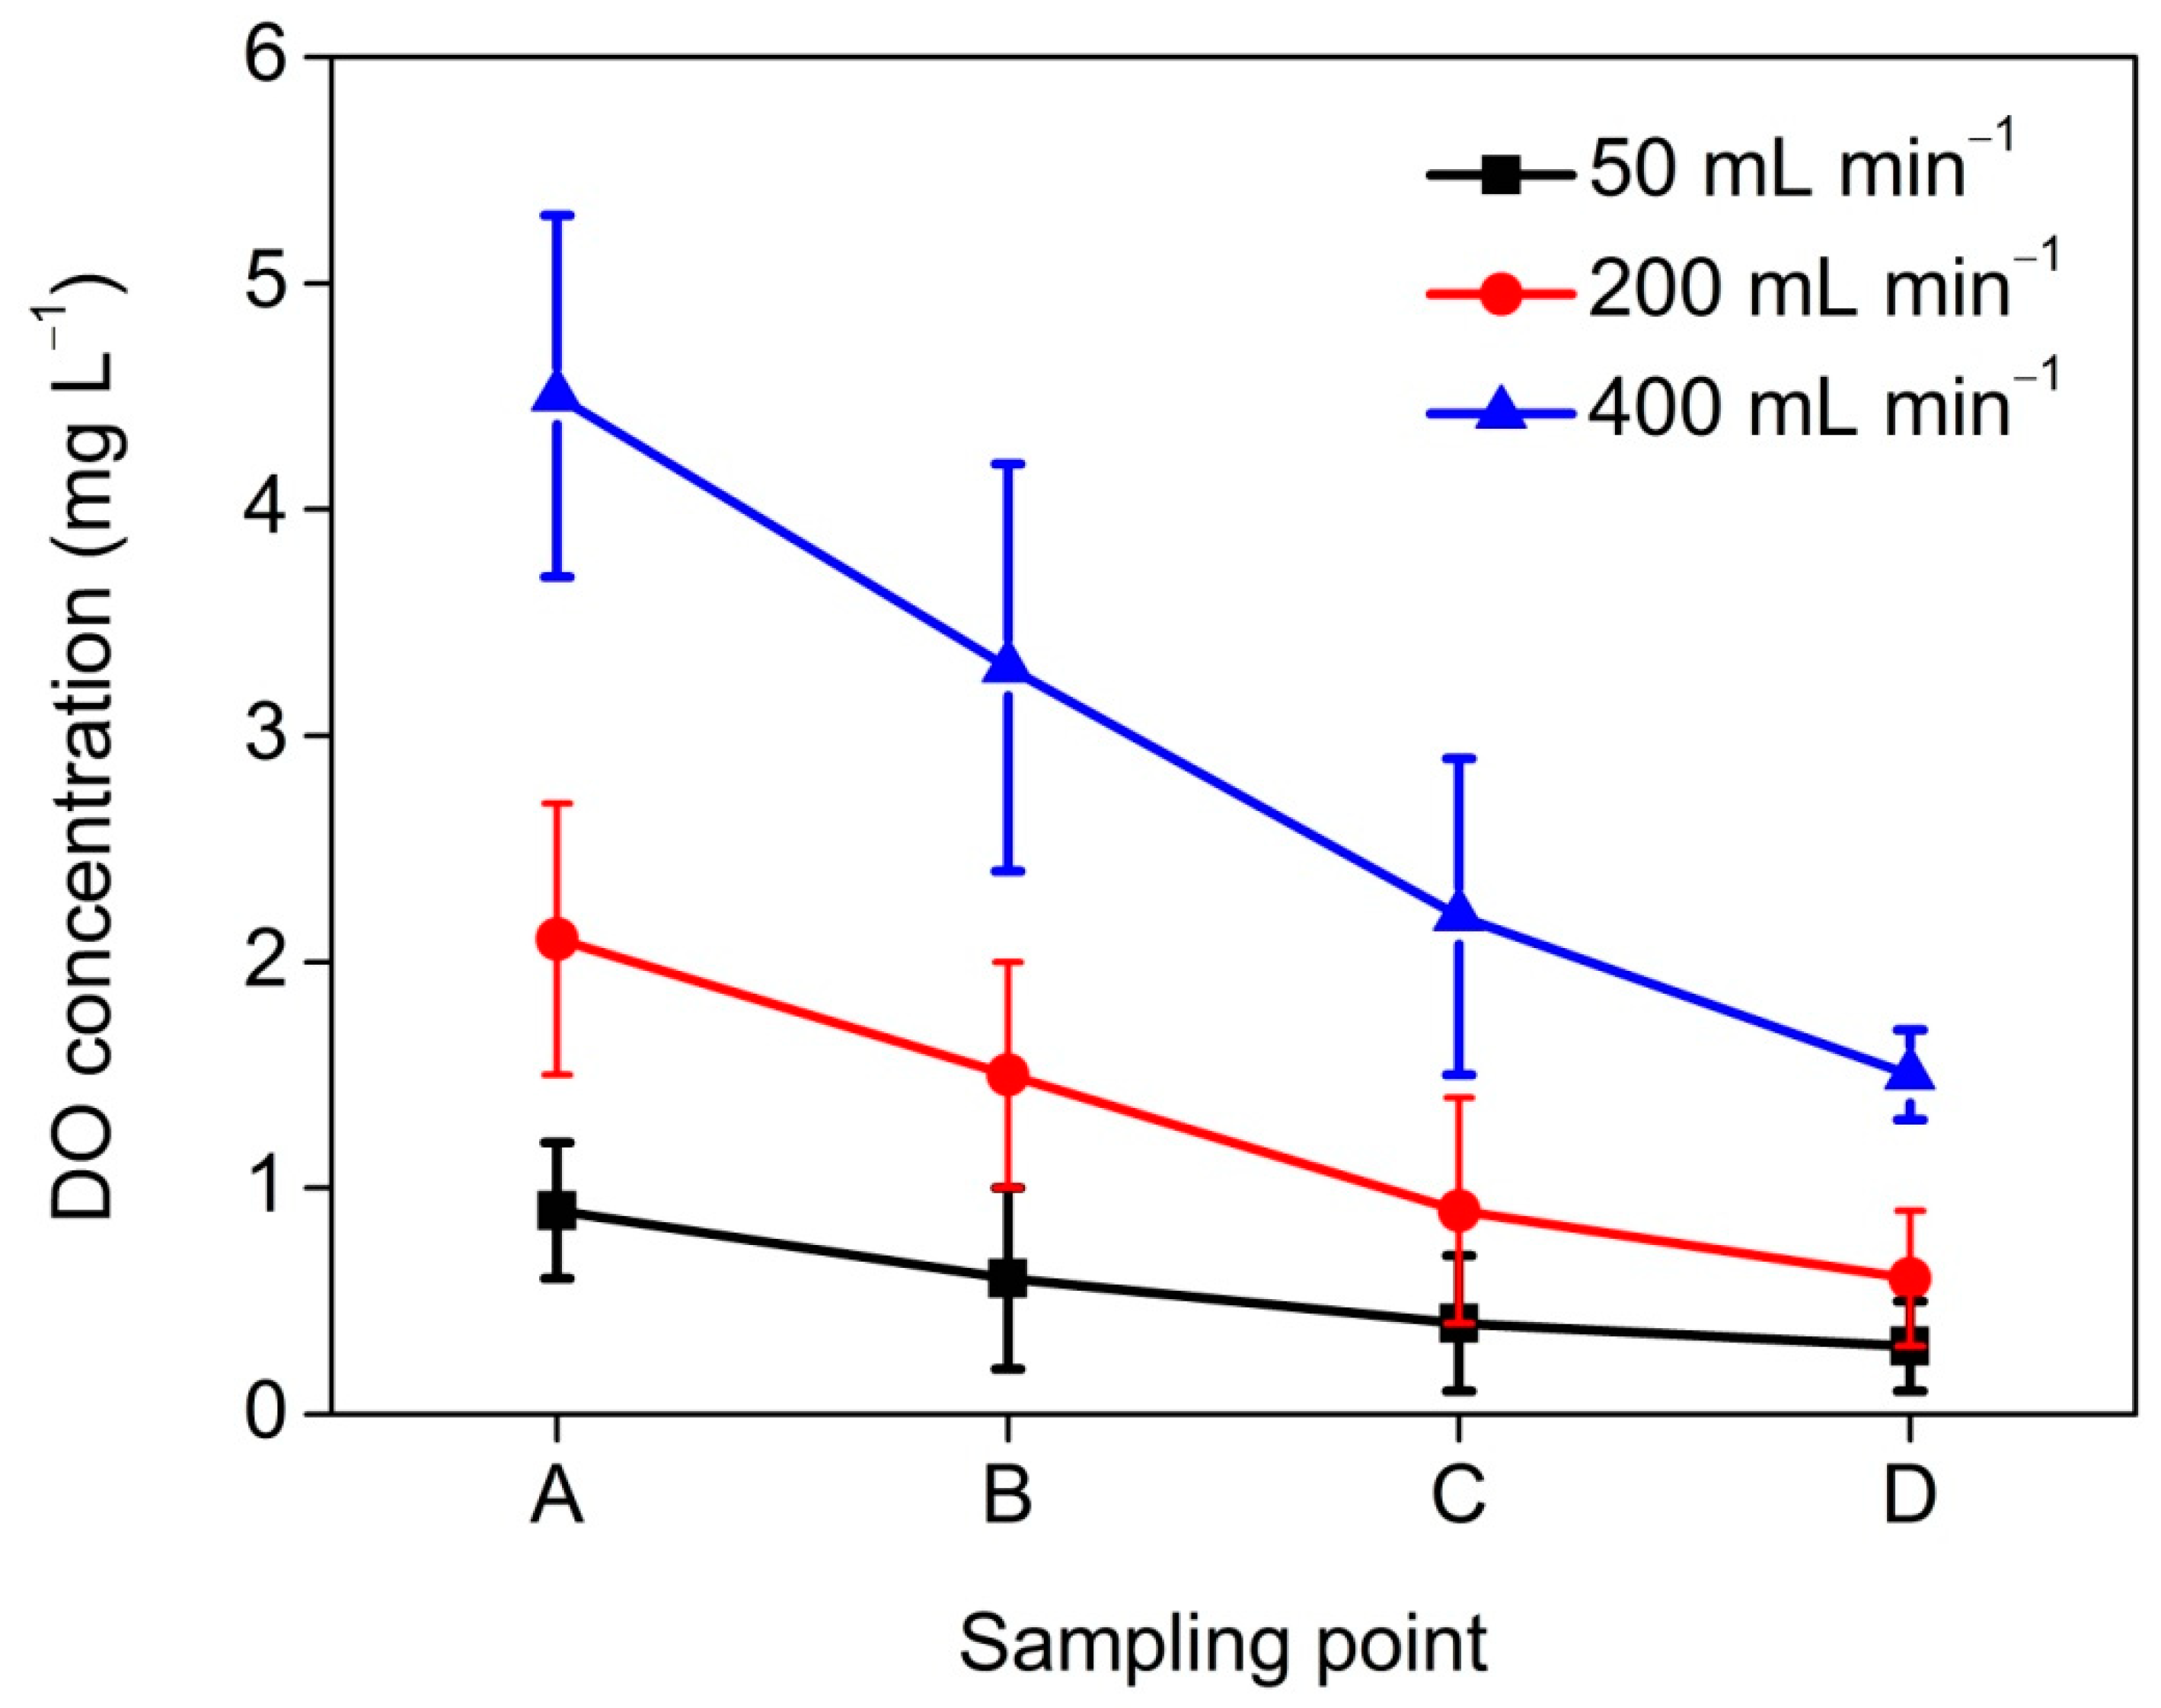
Secondly, the increased dissolved oxygen (DO) concentration that was available for the ORR might be another reason for the improved power generation of TB-MES. To investigate the effects of the catholyte recirculation rate on reoxygenation performance of the trickling-bed biocathode, the DO concentration on different parts of the biocathode was monitored at each recirculation rate (Figure 3). The DO concentration at each sampling point gradually increased as the recirculation rate increased. Taking the upper sampling point for example, the DO concentration at Point A increased from 0.9 ± 0.3 mg L−1 to 4.5 ± 0.8 mg L−1 as the recirculation rate increased from 50 mL min−1 to 400 mL min−1, indicating that higher recirculation rate could help larger amounts of oxygen dissolve in the catholyte. At each recirculation rate, the DO concentration gradually decreased from the upper sampling point (Point A) to the lower sampling point (Point D). At 50 mL min−1, the DO concentration decreased from 0.9 ± 0.3 mg L−1 to 0.3 ± 0.2 mg L−1, and it decreased from 2.1 ± 0.6 mg L−1 to 0.6 ± 0.3 mg L−1 at 200 mL min−1. As the recirculation rate was further increased to 400 mL min−1, the DO concentration decreased from 4.5 ± 0.8 mg L−1 to 1.5 ± 0.2 mg L−1 (Figure 3) This dissolved oxygen gradient was suitable for the creation of aerobic and anoxic microenvironments, which was an ideal habitat for nitrifiers and denitrifiers.
In addition to power generation, nitrogen removal efficiency is also an important indicator for evaluating MES performance. Therefore, ammonium nitrogen removal and total nitrogen (TN) removal were also investigated at each recirculation rate. Ammonium nitrogen removal gradually increased from 53.4 ± 1.6% to 89.1 ± 3.6% as the recirculation rate increased from 50 mL min−1 to 400 mL min−1, thus decreasing the ammonium concentration to 4.5-17.6 mg L−1 in the effluent. However, the TN removal decreased from 79.7 ± 2.5% to 60.3 ± 2.8% as the recirculation rate increased from 200 mL min−1 to 400 mL min−1, resulting in the accumulation of nitrate and nitrite in the concentration of 11.6 ± 1.2 at 400 mL min−1. The reduction in TN removal at 400 mL min−1 was probably because of the increased DO concentration at lower sampling point (Point C: 2.2 ± 0.7 mg L−1, Point D: 1.5 ± 0.2 mg L−1), which would inhibit the denitrification process [32,33]. Though a higher recirculation rate (400 mL min−1) could improve power generation, TN removal declined by 24.1% compared with that at 200 mL min−1, and obviously more energy would be required to drive the higher circulation. Consequently, the TB-MES was operated at 200 mL min−1 in the following tests.

3.2. Performance of TB-MES with Domestic Wastewater

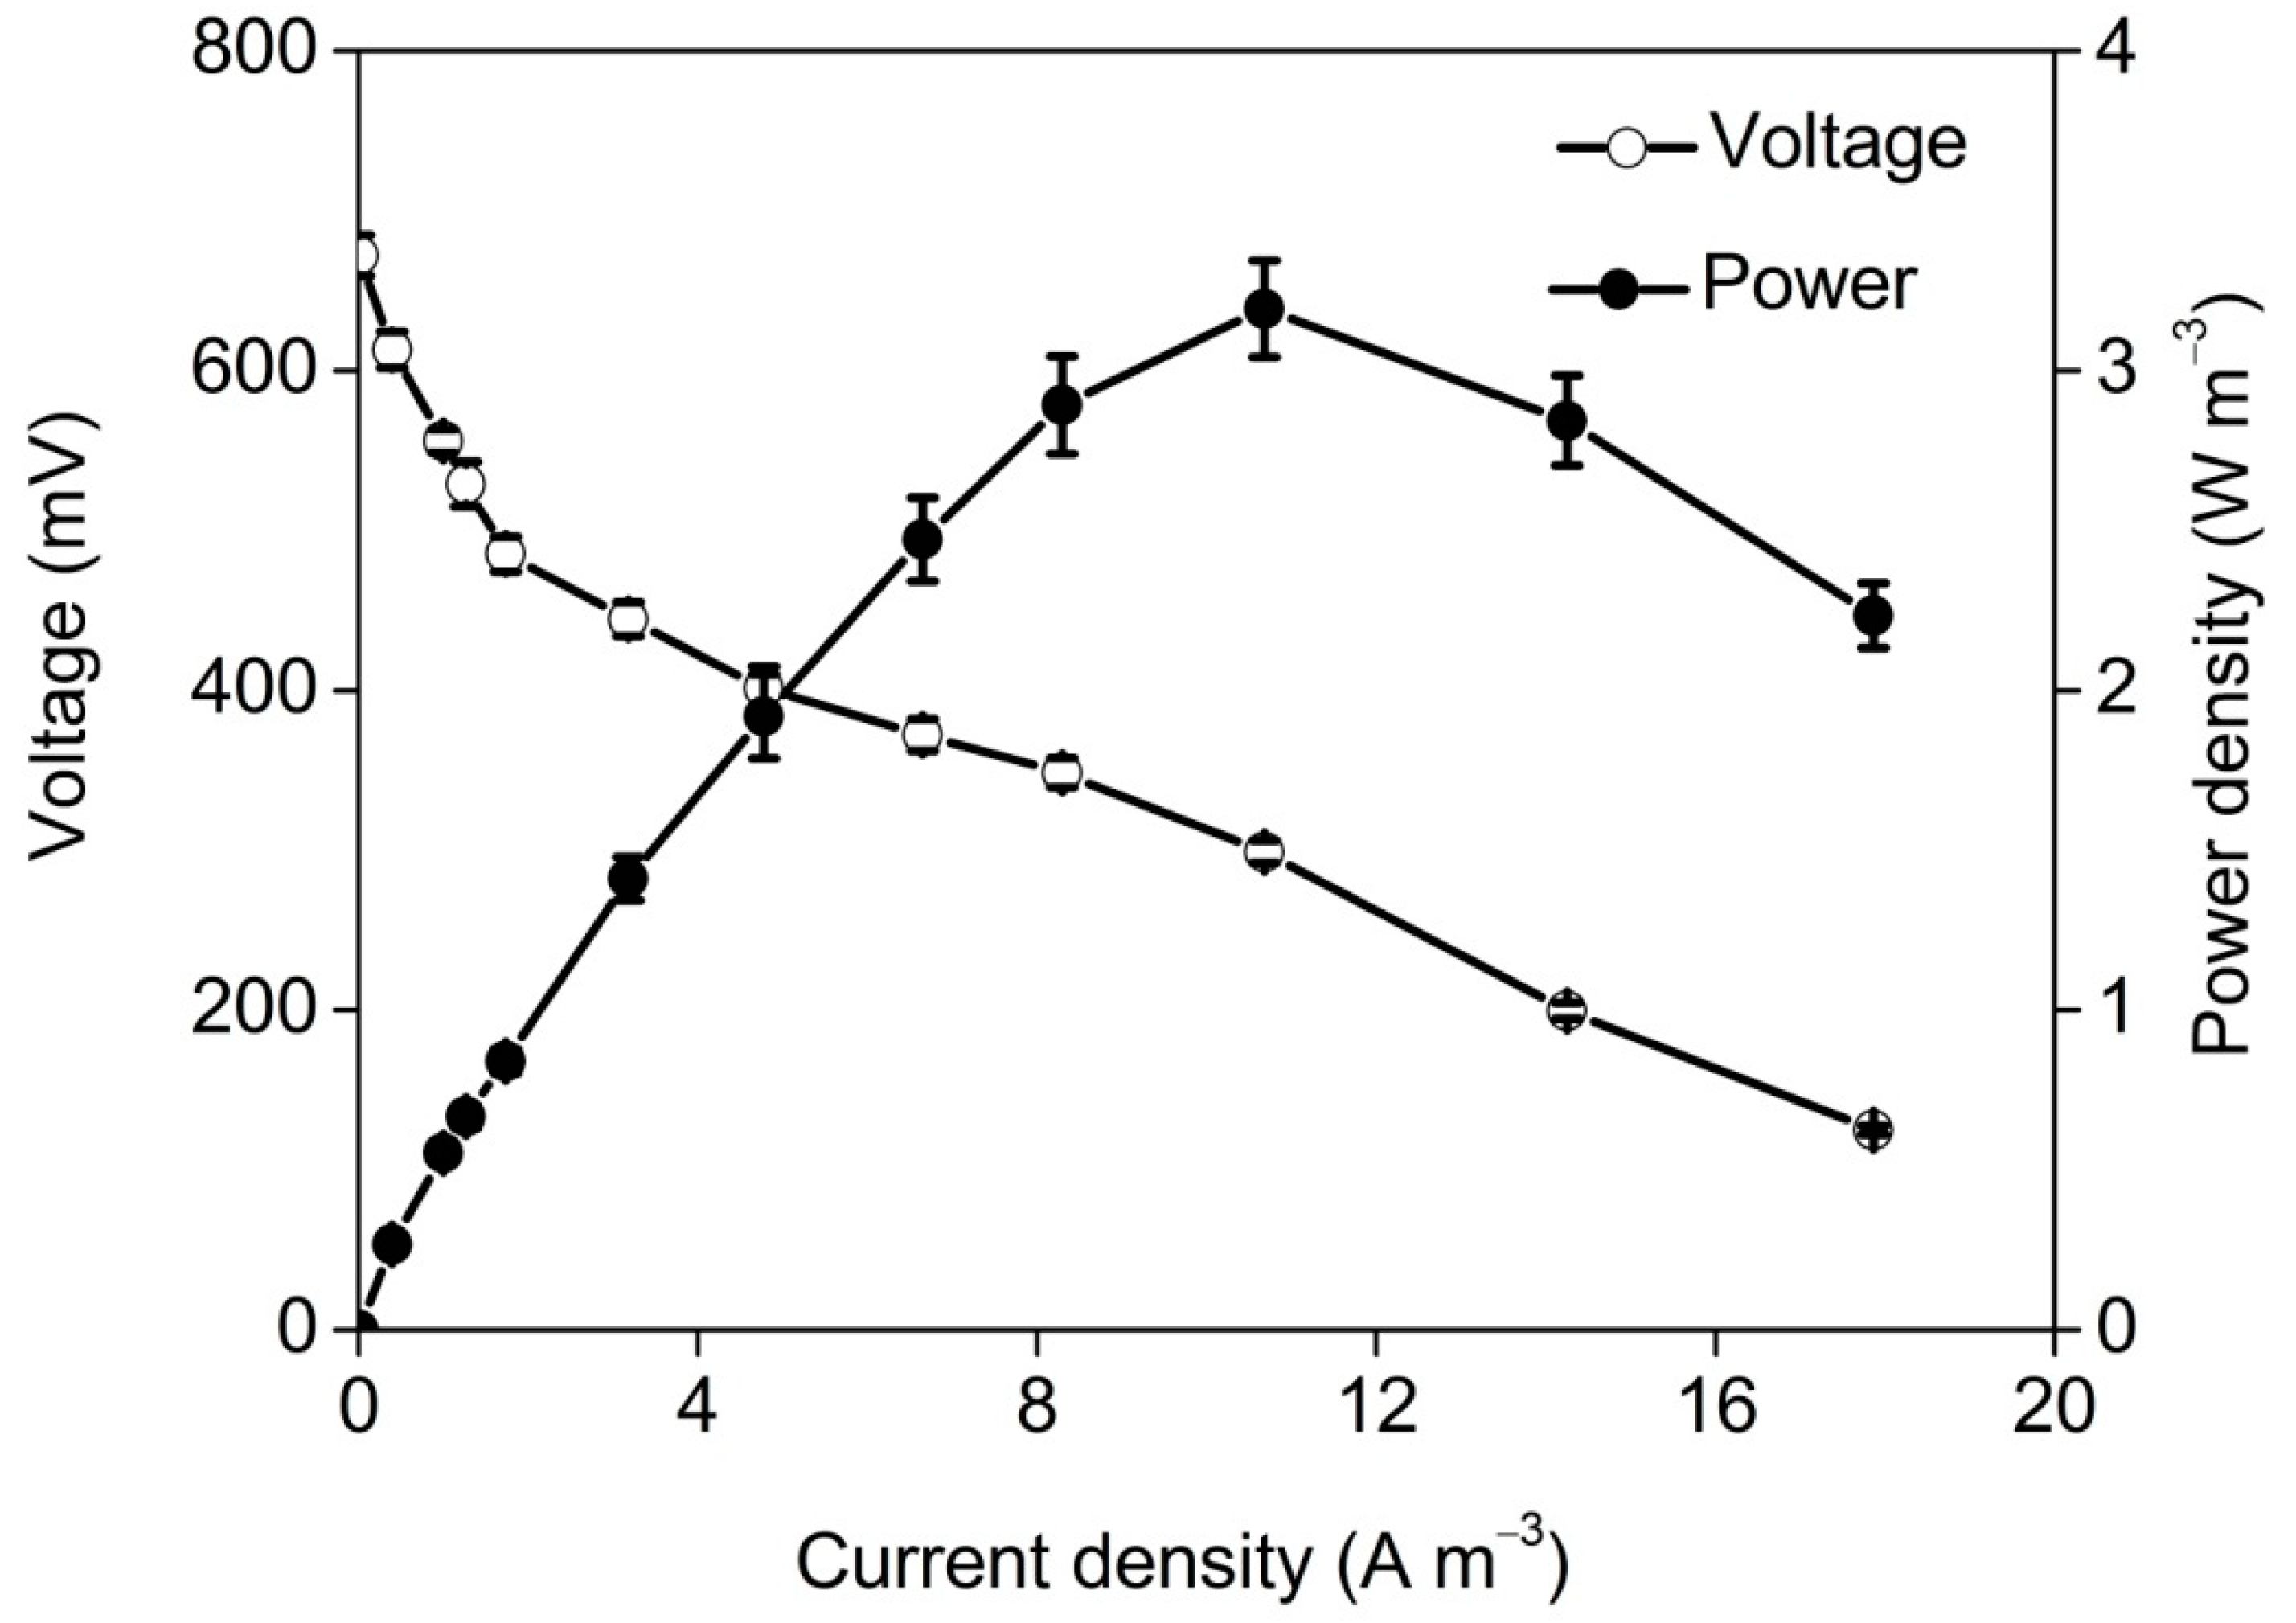
Domestic wastewater was employed as feed to evaluate the viability of TB-MES for real wastewater treatment. With an adaption period of 19 days, its current generation gradually increased from 4.2 A m−3 to 10.6 A m−3, and finally stabilized at 10.8 ± 2.2 A m−3 during the following 26 stable-operation days. According to the polarization curve, a maximum power density of 3.2 ± 0.2 W m−3 was achieved by the TB-MES (Figure 4), decreasing by 15.8% in comparison with that using artificial medium (3.8 ± 0.3 W m−3). The reduction in power generation was probably because of the relatively low conductivity of domestic wastewater (850 ± 118 μS cm−1), which was much lower than the artificial medium of 6.8 mS cm−1. Furthermore, due to the unbuffered condition in domestic wastewater, it might be difficult to maintain the pH in the range suitable for the growth of microorganisms [34]. Though the power production was reduced as the influent changed from artificial medium to real wastewater, as compared to some works, the TB-MES obtained the same or even higher magnitude of maximum power density with the benefits of saving energy input for aeration [35,36,37].
During the 19-day adaption period, COD removal gradually increased from 64.4% to 89.9%, resulting in the effluent COD concentration decreasing from 126 mg L−1 to 37 mg L−1. During the stable operation period, an average COD removal of 90.7 ± 1.1% was obtained by the TB-MES, with the COD concentration decreased from 297 ± 30 mg L−1 in the influent to 27 ± 4 mg L−1 in the effluent (Figure 5a). Coulombic efficiency of TB-MES was 57.1%, demonstrating more than a half of the organic pollutant (equivalent to 214.6 mg·d−1 COD) in domestic wastewater was used for electricity generation. The COD consumption related to electricity process might include COD recovery in the form of electricity and COD metabolized by exoelectrogens. About 72.8 ± 3.5% of the COD was removed in the anode chamber, resulting in an anode effluent COD concentration of 78 ± 9 mg L−1. COD concentration at this relatively low level was suitable for biocathodes to function well in terms of electricity production, since direct contact with solutions containing high concentrations of organic matter would make the heterotrophic bacteria out-compete the cathodic autotrophic bacteria (using electrons from the cathode), which would lead to the decrease in electricity generation [38].
The nitrogen mainly existed in the form of ammonium nitrogen in domestic wastewater, with its concentration fluctuated around 36 ± 5 mg L−1. Nitrate nitrogen was also detected in domestic wastewater, but the concentration was only 2 ± 0.8 mg L−1. A stable ammonium nitrogen removal efficiency of 84.6 ± 2.4% was achieved by the TB-MES after being fed with domestic wastewater for nine days, indicating that microbial communities for ammonium degradation were well established (Figure 5b) The ammonium nitrogen concentration in anode effluent was 29 ± 4 mg L−1, demonstrating that majority of the ammonium nitrogen was removed in cathode chamber. The ammonium loss in anode chamber was most probably due to ammonium diffusion through the cation exchange membrane connecting the anode and cathode chambers, although some losses may occur through biological nitrification and denitrification [39]. The total nitrogen (TN) removal achieved by TB-MES was 70.1 ± 4.2%, resulting in the accumulation of ammonium, nitrate and nitrite nitrogen in the concentration of 4.8 ± 0.8 mg L−1, 5.7 ± 0.9 mg L−1 and 0.6 ± 0.4 mg L−1 in the effluent. The TN removal in TB-MES was mainly occurred in biocathode, through the combination processes of nitrification, heterotrophic denitrification and bioelectrochemical denitrification. This was really a complicated process, where nitrate could be reduced directly by using organic matter as electron donor, or indirectly by obtaining electrons from biocathode supply. After treatment by the TB-MES, both the COD and nitrogen concentration in the effluent could meet the discharge standard of pollutants for municipal wastewater treatment plant. Therefore, the TB-MES held great promise for efficient domestic wastewater treatment and energy recovery.

3.3. Microbial Community Analysis

Four samples taken from the main biocathode and auxiliary biocathode were analyzed by pyrosequencing. They yielded 14706 (CFBup), 18726 (CFBbottom), 34133 (CACup) and 32657 (CACbottom) qualified sequencing reads, with each sample clustered to 1120, 1011, 1808 and 1775 operational taxonomic units (OTUs) based on a threshold of 97%. The Shannon index indicated the CACup had the highest diversity (Shannon = 4.78), being slightly larger than that of the CACbottom (Shannon = 4.32), and the CFBbottom showed the lowest diversity (Shannon = 3.02) (Table 1). The coverage value of each sample was more than 0.95, showing sufficient sampling for the assessment of microbial community composition.
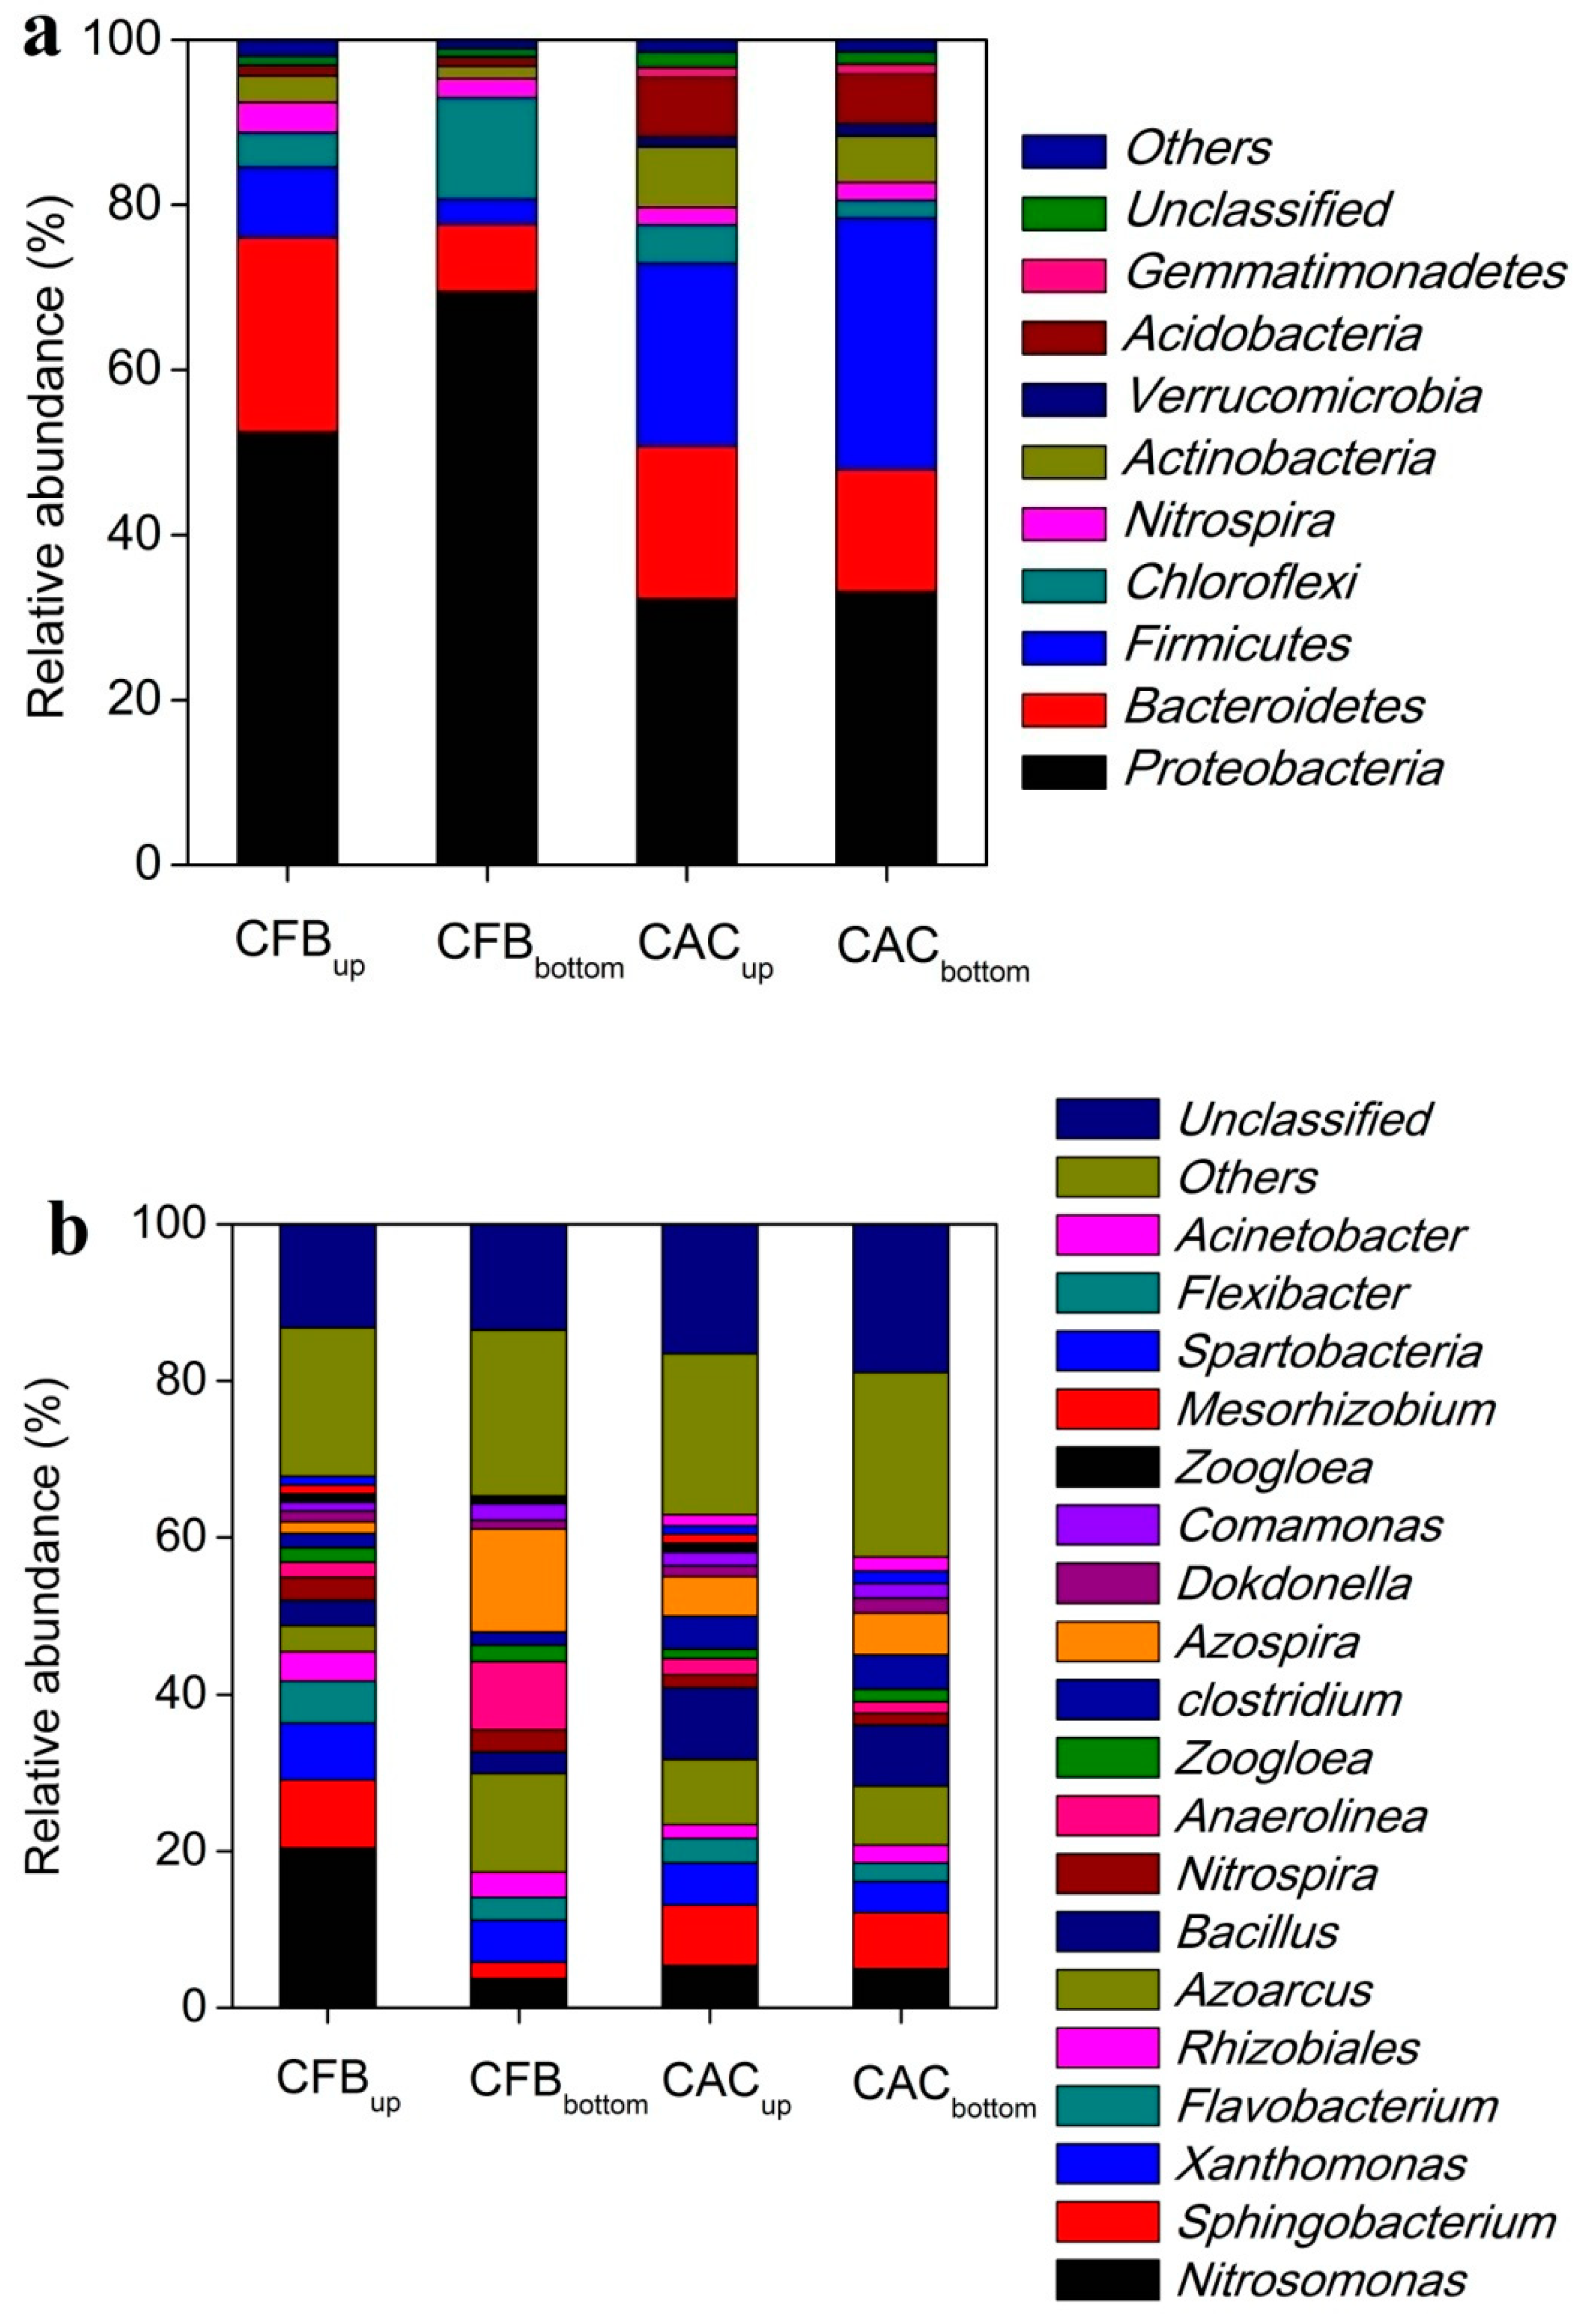
Qualified reads retrieved from CFBup, CFBbottom, CACup, and CACup were assigned to phyla and genera (Figure 6). The four samples mainly belonged to nine phyla, including Proteobacteria, Bacteroidetes, Firmicutes, Chloroflexi and so on. Proteobacteria was the most abundant phylum in each sample, with a relative abundance of 52.5%, 69.5%, 32.3% and 33.1% in CFBup, CFBbottom, CACup, and CACbottom. This was consistent with previous studies, since a large number of nitrifying bacteria and denitrifying bacteria belonged to the Proteobacteria and played an important part in the nitrogen transformation process of the water environment [40]. The second abundant phylum varied among each sample, demonstrating by the fact that CFBup was affiliated with Bacteroidetes(23.6%), while the CFBbottom was affiliated with Chloroflexi(12.3%), and the CACup and CACbottom were affiliated with Firmicutes (22.2% and 30.5%, respectively) (Figure 6a) The reason for larger fraction of Bacteroidetes in CFBup than in other samples was likely due to the relatively high DO concentration in the upper part of carbon fiber brush biocathode (2.3 ± 0.7 mg L−1), since Bacteroidetes was a common existing phylum in the aerobic condition [41].
Genus level classification was conducted to further investigate the microbial community composition. The dominant genera identified in CFBup were affiliated with Nitrosomonas (20.4%), Sphingobacterium (8.7%), Xanthomonas (7.2%) and Flavobacterium (5.4%) (Figure 6b) It is well known that Nitrosomonas is a main nitrifying bacterium in wastewater treatment plants, where it get rid of excess ammonia by converting it to nitrite [42]. Nitrosomonas was also detected in CFBbottom, CACup, and CACbottom with a relative abundance of 3.7%, 5.4%, and 5.0%, which was much lower than that in CFBup, indicating the upper portion of carbon fiber brush biocathode was the main place for ammonia oxidation. The genus Nitrospira, constituting a diverse group of nitrite oxidizing bacteria, was also enriched in CFBup (2.9%). Additionally, it was present in CFBbottom, CACup, and CACbottom, which was associated with the oxidation of nitrite to nitrate. Xanthomonas, identified as dominant in mixed-community biocathodes in a previous study [43], was likely to play a key role in cathodic electron transfer in the TB-MES. The most frequently identified sequence in CFBbottom were assigned to Azospira (13.1%), Azoarcus (12.6%), Anaerolinea (8.7%), and Xanthomonas (5.4%). The genus Azoarcus is a well-known denitrifying species that can anaerobically degrade both organic ethylbenzene and other aromatic hydrocarbons [44]. Anaerolinea is a kind of anaerobic microorganism in mesophilic and thermophilic sludge granules of upflow anaerobic sludge blanket (UASB)reactors, which may play a key role in the primary degradation of carbohydrates and amino acids [45]. Azoarcus and Anaerolinea were more abundant in CFBbottom compared to the CFBup, CACup, and CACbottom. This could be caused by the relatively low DO concentration (0.7 ± 0.5 mg L−1) in the bottom part of cathode chamber, which was suitable for the enrichment of anaerobic microorganisms. The CACup and CACbottom were possessed of an approximately same structure at the genus level, with the predominance of Bacillus (9.2%, 7.8%), Azoarcus (8.3%, 7.5%), Sphingobacterium (7.7%, 7.1%), and Azospira (5.0%, 5.3%).
The microbial community composition in biocathode of the TB-MES was probably affected by two reasons: DO concentration and electrode material. At a catholyte recirculation rate of 200 mL min−1, dissolved oxygen gradient was formed in the cathode chamber, where DO concentration gradually decreased from 2.3 ± 0.7 mg L−1 (point A) to 0.7 ± 0.5 mg L−1 (point D). This dissolved oxygen gradient created an ideal habitat for functional microorganisms, where the aerobic Nitrosomonas was more abundant in CFBup (Point A), while the anaerobic Azoarcus was more abundant in CFBbottom (Point D). Electrode materials also have a significant effect on the type of microbial species in MES reactors. In MESs respectively employing GAC (granular activated carbon), GS (granular semicoke), and CFC (carbon felt cube) as packed cathodic materials, Comamonas was the dominant genus, while the GG (granular graphite) packed MES was dominated by Acidovorax [46]. This is because different electrode materials have different microscopic surface structure and conductivity, which in turn affect the adhesion of specific microorganisms [47]. The difference in microbial community between CFBup and CACup was probably due to the different morphology structure of the carbon fiber brush and columnar activated carbon, since DO concentration in Point A (CFBup, 2.3 ± 0.7 mg L−1) and Point B (CACup, 2.0 ± 0.5 mg L−1) was not significantly different (p>0.05, Student’s t-test).

4. Conclusions

A trickling-bed biocathode microbial electrochemical system (TB-MES) employing biotrickling filters for oxygen supply was designed for nitrogen removal and power generation. Catholyte recirculation rate was a key factor in influencing the performance of TB-MES. At an optimal recirculation rate of 200 mL min−1, ammonium nitrogen removal of 84.6 ± 2.4%, total nitrogen removal of 70.1 ± 4.2%, and maximum power density of 3.2 ± 0.2 W m−3 were achieved when treating domestic wastewater. Microbial community analysis revealed that both the dissolved oxygen concentration and electrode material played a role in affecting the microbial composition and relative abundance.

Author Contributions

H.W. and Z.M. conceived, designed, performed the experiments, and contributed to the preparation of the paper. L.C., Y.L., and G.W. contributed to the review and editing of the paper. All authors have read and agreed to the published version of the manuscript.

Funding

This research received no external funding.

Acknowledgments

This work was supported by the National Natural Science Foundation of China (grant no. 51908377), the Nature Science Foundation of Liaoning Province (grant no. 2019-BS-194), the China Postdoctoral Science Foundation (grant no. 2018M641713), the National Science and Technology Major Project of the Ministry of Science and Technology of China (grant no. 2018ZX07601-002), and the National Key Research and Development Program of China (2017YFB0604004-03)

Conflicts of Interest

The authors declare no conflict of interest.

References

  1. Mccarty, P.L.; Bae, J.; Kim, J. Domestic wastewater treatment as a net energy producer-Can this be achieved? Environ. Sci. Technol. 2011, 45, 7100–7106. [Google Scholar] [CrossRef]
  2. Do, M.H.; Ngo, H.H.; Guo, W.S.; Liu, Y.; Ni, B.J. Challenges in the application of microbial fuel cells to wastewater treatment and energy production: A mini review. Sci. Total Environ. 2018, 639, 910–920. [Google Scholar] [CrossRef]
  3. Logan, B.E.; Rabaey, K. Conversion of wastes into bioelectricity and chemicals by using microbial electrochemical technologies. Science 2012, 337, 686–690. [Google Scholar] [CrossRef] [PubMed] [Green Version]
  4. Slate, A.J.; Whitehead, K.A.; Brownson, D.A.C.; Banks, C.E. Microbial fuel cells: An overview of current technology. Renew. Sustain. Energy Rev. 2019, 101, 60–81. [Google Scholar] [CrossRef]
  5. Abdallah, M.; Feroz, S.; Alani, S.; Sayed, E.T.; Shanableh, A. Continuous and scalable applications of microbial fuel cells: A critical review. Rev. Environ. Sci. Biotechnol. 2019, 18, 543–578. [Google Scholar] [CrossRef]
  6. Logan, B.E. Scaling up microbial fuel cells and other bioelectrochemical systems. Appl. Microbiol. Biotechnol. 2010, 85, 1665–1671. [Google Scholar] [CrossRef] [PubMed]
  7. Clauwaert, P.; van der Ha, D.; Boon, N.; Verbeken, K.; Verhaege, M.; Rabaey, K.; Verstraete, W. Open air biocathode enables effective electricity generation with microbial fuel cells. Environ. Sci. Technol. 2007, 41, 7564–7569. [Google Scholar] [CrossRef] [PubMed]
  8. Huang, L.; Regan, J.M.; Quan, X. Electron transfer mechanisms, new applications, and performance of biocathode microbial fuel cells. Bioresour. Technol. 2011, 102, 316–323. [Google Scholar] [CrossRef]
  9. Song, H.-L.; Zhu, Y.; Li, J. Electron transfer mechanisms, characteristics and applications of biological cathode microbial fuel cells—A mini review. Arab. J. Chem. 2019, 12, 2236–2243. [Google Scholar] [CrossRef] [Green Version]
  10. Clauwaert, P.; Rabaey, K.; Aelterman, P.; De Schamphelaire, L.; Ham, T.H.; Boeckx, P.; Boon, N.; Verstraete, W. Biological denitrification in microbial fuel cells. Environ. Sci. Technol. 2007, 41, 3354–3360. [Google Scholar] [CrossRef]
  11. Desloover, J.; Puig, S.; Virdis, B.; Clauwaert, P.; Boeckx, P.; Verstraete, W.; Boon, N. Biocathodic nitrous oxide removal in bioelectrochemical systems. Environ. Sci. Technol. 2011, 45, 10557–10566. [Google Scholar] [CrossRef] [PubMed]
  12. Kelly, P.T.; He, Z. Nutrients removal and recovery in bioelectrochemical systems: A review. Bioresour. Technol. 2014, 153, 351–360. [Google Scholar] [CrossRef] [PubMed]
  13. Arredondo, M.R.; Kuntke, P.; Jeremiasse, A.W.; Sleutels, T.H.J.A.; Buisman, C.J.N.; Ter Heijne, A. Bioelectrochemical systems for nitrogen removal and recovery from wastewater. Environ. Sci. Water Res. Technol. 2015, 1, 22–33. [Google Scholar] [CrossRef]
  14. Virdis, B.; Rabaey, K.; Yuan, Z.; Keller, J. Microbial fuel cells for simultaneous carbon and nitrogen removal. Water Res. 2008, 42, 3013–3024. [Google Scholar] [CrossRef]
  15. Virdis, B.; Rabaey, K.; Rozendal, R.A.; Yuan, Z.; Keller, J. Simultaneous nitrification, denitrification and carbon removal in microbial fuel cells. Water Res. 2010, 44, 2970–2980. [Google Scholar] [CrossRef]
  16. Li, W.-W.; Yu, H.-Q.; He, Z. Towards sustainable wastewater treatment by using microbial fuel cells-centered technologies. Energy Environ. Sci. 2014, 7, 911–924. [Google Scholar] [CrossRef] [Green Version]
  17. He, Z.; Shao, H.; Angenent, L.T. Increased power production from a sediment microbial fuel cell with a rotating cathode. Biosens. Bioelectron. 2007, 22, 3252–3255. [Google Scholar] [CrossRef]
  18. He, Z.; Kan, J.; Wang, Y.; Huang, Y.; Mansfeld, F.; Nealson, K.H. Electricity production coupled to ammonium in a microbial fuel cell. Environ. Sci. Technol. 2009, 43, 3391–3397. [Google Scholar] [CrossRef]
  19. Sayess, R.R.; Saikaly, P.E.; El-Fadel, M.; Li, D.; Semerjian, L. Reactor performance in terms of COD and nitrogen removal and bacterial community structure of a three-stage rotating bioelectrochemical contactor. Water Res. 2013, 47, 881–894. [Google Scholar] [CrossRef]
  20. Wang, H.; Liu, J.; He, W.; Qu, Y.; Li, D.; Feng, Y. Energy-positive nitrogen removal from reject water using a tide-type biocathode microbial electrochemical system. Bioresour. Technol. 2016, 222, 317–325. [Google Scholar] [CrossRef]
  21. Wang, H.; Liu, J.; He, W.; Qu, Y.; Li, D.; Jiang, Q.; Feng, Y. Enhanced power generation of oxygen-reducing biocathode with an alternating hydrophobic and hydrophilic surface. ACS Appl. Mater. Interfaces 2016, 8, 31995–32003. [Google Scholar] [CrossRef] [PubMed]
  22. Wu, C.-H.; Shih, J.-C.; Lin, C.-W. Continuous production of power using microbial fuel cells with integrated biotrickling filter for ethyl acetate-contaminated air stream treatment. Int. J. Hydrog. Energy 2016, 41, 21945–21954. [Google Scholar] [CrossRef]
  23. Lin, C.-W.; Tsao, C.-Y.; Jiang, S.-L.; Liu, S.-H. Enhanced gaseous ethyl acetate degradation and power generation by a bioelectrochemical system. Chem. Eng. J. 2018, 344, 270–276. [Google Scholar] [CrossRef]
  24. Liu, S.-H.; Lin, H.-H.; Wen, S.; Lin, C.-W. Performance of trickling bed microbial fuel cell treating isopropyl alcohol vapor: Effects of shock-load and shut-down episodes. Chemosphere 2019, 224, 168–175. [Google Scholar] [CrossRef]
  25. Bao, T.; Chen, T.; Tan, J.; Wille, M.-L.; Zhu, D.; Chen, D.; Xi, Y. Synthesis and performance of iron oxide-based porous ceramsite in a biological aerated filter for the simultaneous removal of nitrogen and phosphorus from domestic wastewater. Sep. Purif. Technol. 2016, 167, 154–162. [Google Scholar] [CrossRef] [Green Version]
  26. Feng, Y.; Yang, Q.; Wang, X.; Logan, B.E. Treatment of carbon fiber brush anodes for improving power generation in air–cathode microbial fuel cells. J. Power Sources 2010, 195, 1841–1844. [Google Scholar] [CrossRef]
  27. Lovley, D.R.; Phillips, E.J.P. Novel mode of microbial energy metabolism: Organic carbon oxidation coupled to dissimilatory reduction of iron or manganese. Appl. Environ. Microbiol. 1988, 54, 1472–1480. [Google Scholar] [CrossRef] [Green Version]
  28. Ahn, Y.; Logan, B.E. A multi-electrode continuous flow microbial fuel cell with separator electrode assembly design. Appl. Microbiol. Biotechnol. 2012, 93, 2241–2248. [Google Scholar] [CrossRef]
  29. Lu, L.; Xing, D.; Ren, N.; Logan, B.E. Syntrophic interactions drive the hydrogen production from glucose at low temperature in microbial electrolysis cells. Bioresour. Technol. 2012, 124, 68–76. [Google Scholar] [CrossRef]
  30. Pham, H.T.; Boon, N.; Aelterman, P.; Clauwaert, P.; De Schamphelaire, L.; Van Oostveldt, P.; Verbeken, K.; Rabaey, K.; Verstraete, W. High shear enrichment improves the performance of the anodophilic microbial consortium in a microbial fuel cell. Microb. Biotechnol. 2008, 1, 487–496. [Google Scholar] [CrossRef] [Green Version]
  31. Zhang, F.; Jacobson, K.S.; Torres, P.; He, Z. Effects of anolyte recirculation rates and catholytes on electricity generation in a litre-scale upflow microbial fuel cell. Energy Environ. Sci. 2010, 3, 1347–1352. [Google Scholar] [CrossRef]
  32. Yang, X.; Wang, S.; Zhou, L. Effect of carbon source, C/N ratio, nitrate and dissolved oxygen concentration on nitrite and ammonium production from denitrification process by Pseudomonas stutzeri D6. Bioresour. Technol. 2012, 104, 65–72. [Google Scholar] [CrossRef] [PubMed]
  33. Oh, J.; Silverstein, J. Oxygen inhibition of activated sludge denitrification. Water Res. 1999, 33, 1925–1937. [Google Scholar] [CrossRef]
  34. Nam, J.Y.; Kim, H.-W.; Lim, K.-H.; Shin, H.-S.; Logan, B.E. Variation of power generation at different buffer types and conductivities in single chamber microbial fuel cells. Biosens. Bioelectron. 2010, 25, 1155–1159. [Google Scholar] [CrossRef] [PubMed]
  35. Hashemi, J.; Samimi, A. Steady state electric power generation in up-flow microbial fuel cell using the estimated time span method for bacteria growth domestic wastewater. Biomass Bioenergy 2012, 45, 65–76. [Google Scholar] [CrossRef]
  36. Zhang, F.; Ge, Z.; Grimaud, J.; Hurst, J.; He, Z. In situ investigation of tubular microbial fuel cells deployed in an aeration tank at a municipal wastewater treatment plant. Bioresour. Technol. 2013, 136, 316–321. [Google Scholar] [CrossRef]
  37. Liu, X.W.; Wang, Y.-P.; Huang, Y.-X.; Sun, X.-F.; Sheng, G.-P.; Zeng, R.J.; Li, F.; Dong, F.; Wang, S.-G.; Tong, Z.-H. Integration of a microbial fuel cell with activated sludge process for energy-saving wastewater treatment: Taking a sequencing batch reactor as an example. Biotechnol. Bioeng. 2011, 108, 1260–1267. [Google Scholar] [CrossRef]
  38. Xia, X.; Tokash, J.C.; Zhang, F.; Liang, P.; Logan, B.E. Oxygen-reducing biocathodes operating with passive oxygen transfer in microbial fuel cells. Environ. Sci. Technol. 2013, 47, 2085–2091. [Google Scholar] [CrossRef]
  39. Kim, J.R.; Zuo, Y.; Regan, J.M.; Logan, B.E. Analysis of ammonia loss mechanisms in microbial fuel cells treating animal wastewater. Biotechnol. Bioeng. 2008, 99, 1120–1127. [Google Scholar] [CrossRef]
  40. Wrighton, K.C.; Virdis, B.; Clauwaert, P.; Read, S.T.; Daly, R.A.; Boon, N.; Piceno, Y.; Andersen, G.L.; Coates, J.D.; Rabaey, K. Bacterial community structure corresponds to performance during cathodic nitrate reduction. ISME J. Emultidisciplinary J. Microb. Ecol. 2010, 4, 1443–1455. [Google Scholar] [CrossRef] [Green Version]
  41. Li, C.; Ding, L.; Cui, H.; Zhang, L.; Xu, K.; Ren, H. Application of conductive polymers in biocathode of microbial fuel cells and microbial community. Bioresour. Technol. 2012, 116, 459–465. [Google Scholar] [CrossRef] [PubMed]
  42. Guo, J.; Cheng, J.; Li, B.; Wang, J.; Chu, P. Performance and microbial community in the biocathode of microbial fuel cells under different dissolved oxygen concentrations. J. Electroanal. Chem. 2019, 833, 433–440. [Google Scholar] [CrossRef]
  43. Chung, K.; Fujiki, I.; Okabe, S. Effect of formation of biofilms and chemical scale on the cathode electrode on the performance of a continuous two-chamber microbial fuel cell. Bioresour. Technol. 2011, 102, 355–360. [Google Scholar] [CrossRef] [PubMed]
  44. Reinhold-Hurek, B.; Hurek, T. Reassessment of the taxonomic structure of the diazotrophic genus Azoarcus sensu lato and description of three new genera and new species, Azovibrio restrictus gen. nov., sp. nov., Azospira oryzae gen. nov., sp. nov. and Azonexus fungiphilus gen. nov., sp. Int. J. Syst. Evol. Microbiol. 2000, 50, 649–659. [Google Scholar] [CrossRef]
  45. Narihiro, T.; Sekiguchi, Y. Microbial communities in anaerobic digestion processes for waste and wastewater treatment: A microbiological update. Curr. Opin. Biotechnol. 2007, 18, 273–278. [Google Scholar] [CrossRef]
  46. Sun, Y.; Wei, J.; Liang, P.; Huang, X. Microbial community analysis in biocathode microbial fuel cells packed with different materials. Amb Express 2012, 2, 21. [Google Scholar] [CrossRef] [Green Version]
  47. Zhou, M.; Chi, M.; Luo, J.; He, H.; Jin, T. An overview of electrode materials in microbial fuel cells. J. Power Sources 2011, 196, 4427–4435. [Google Scholar] [CrossRef]
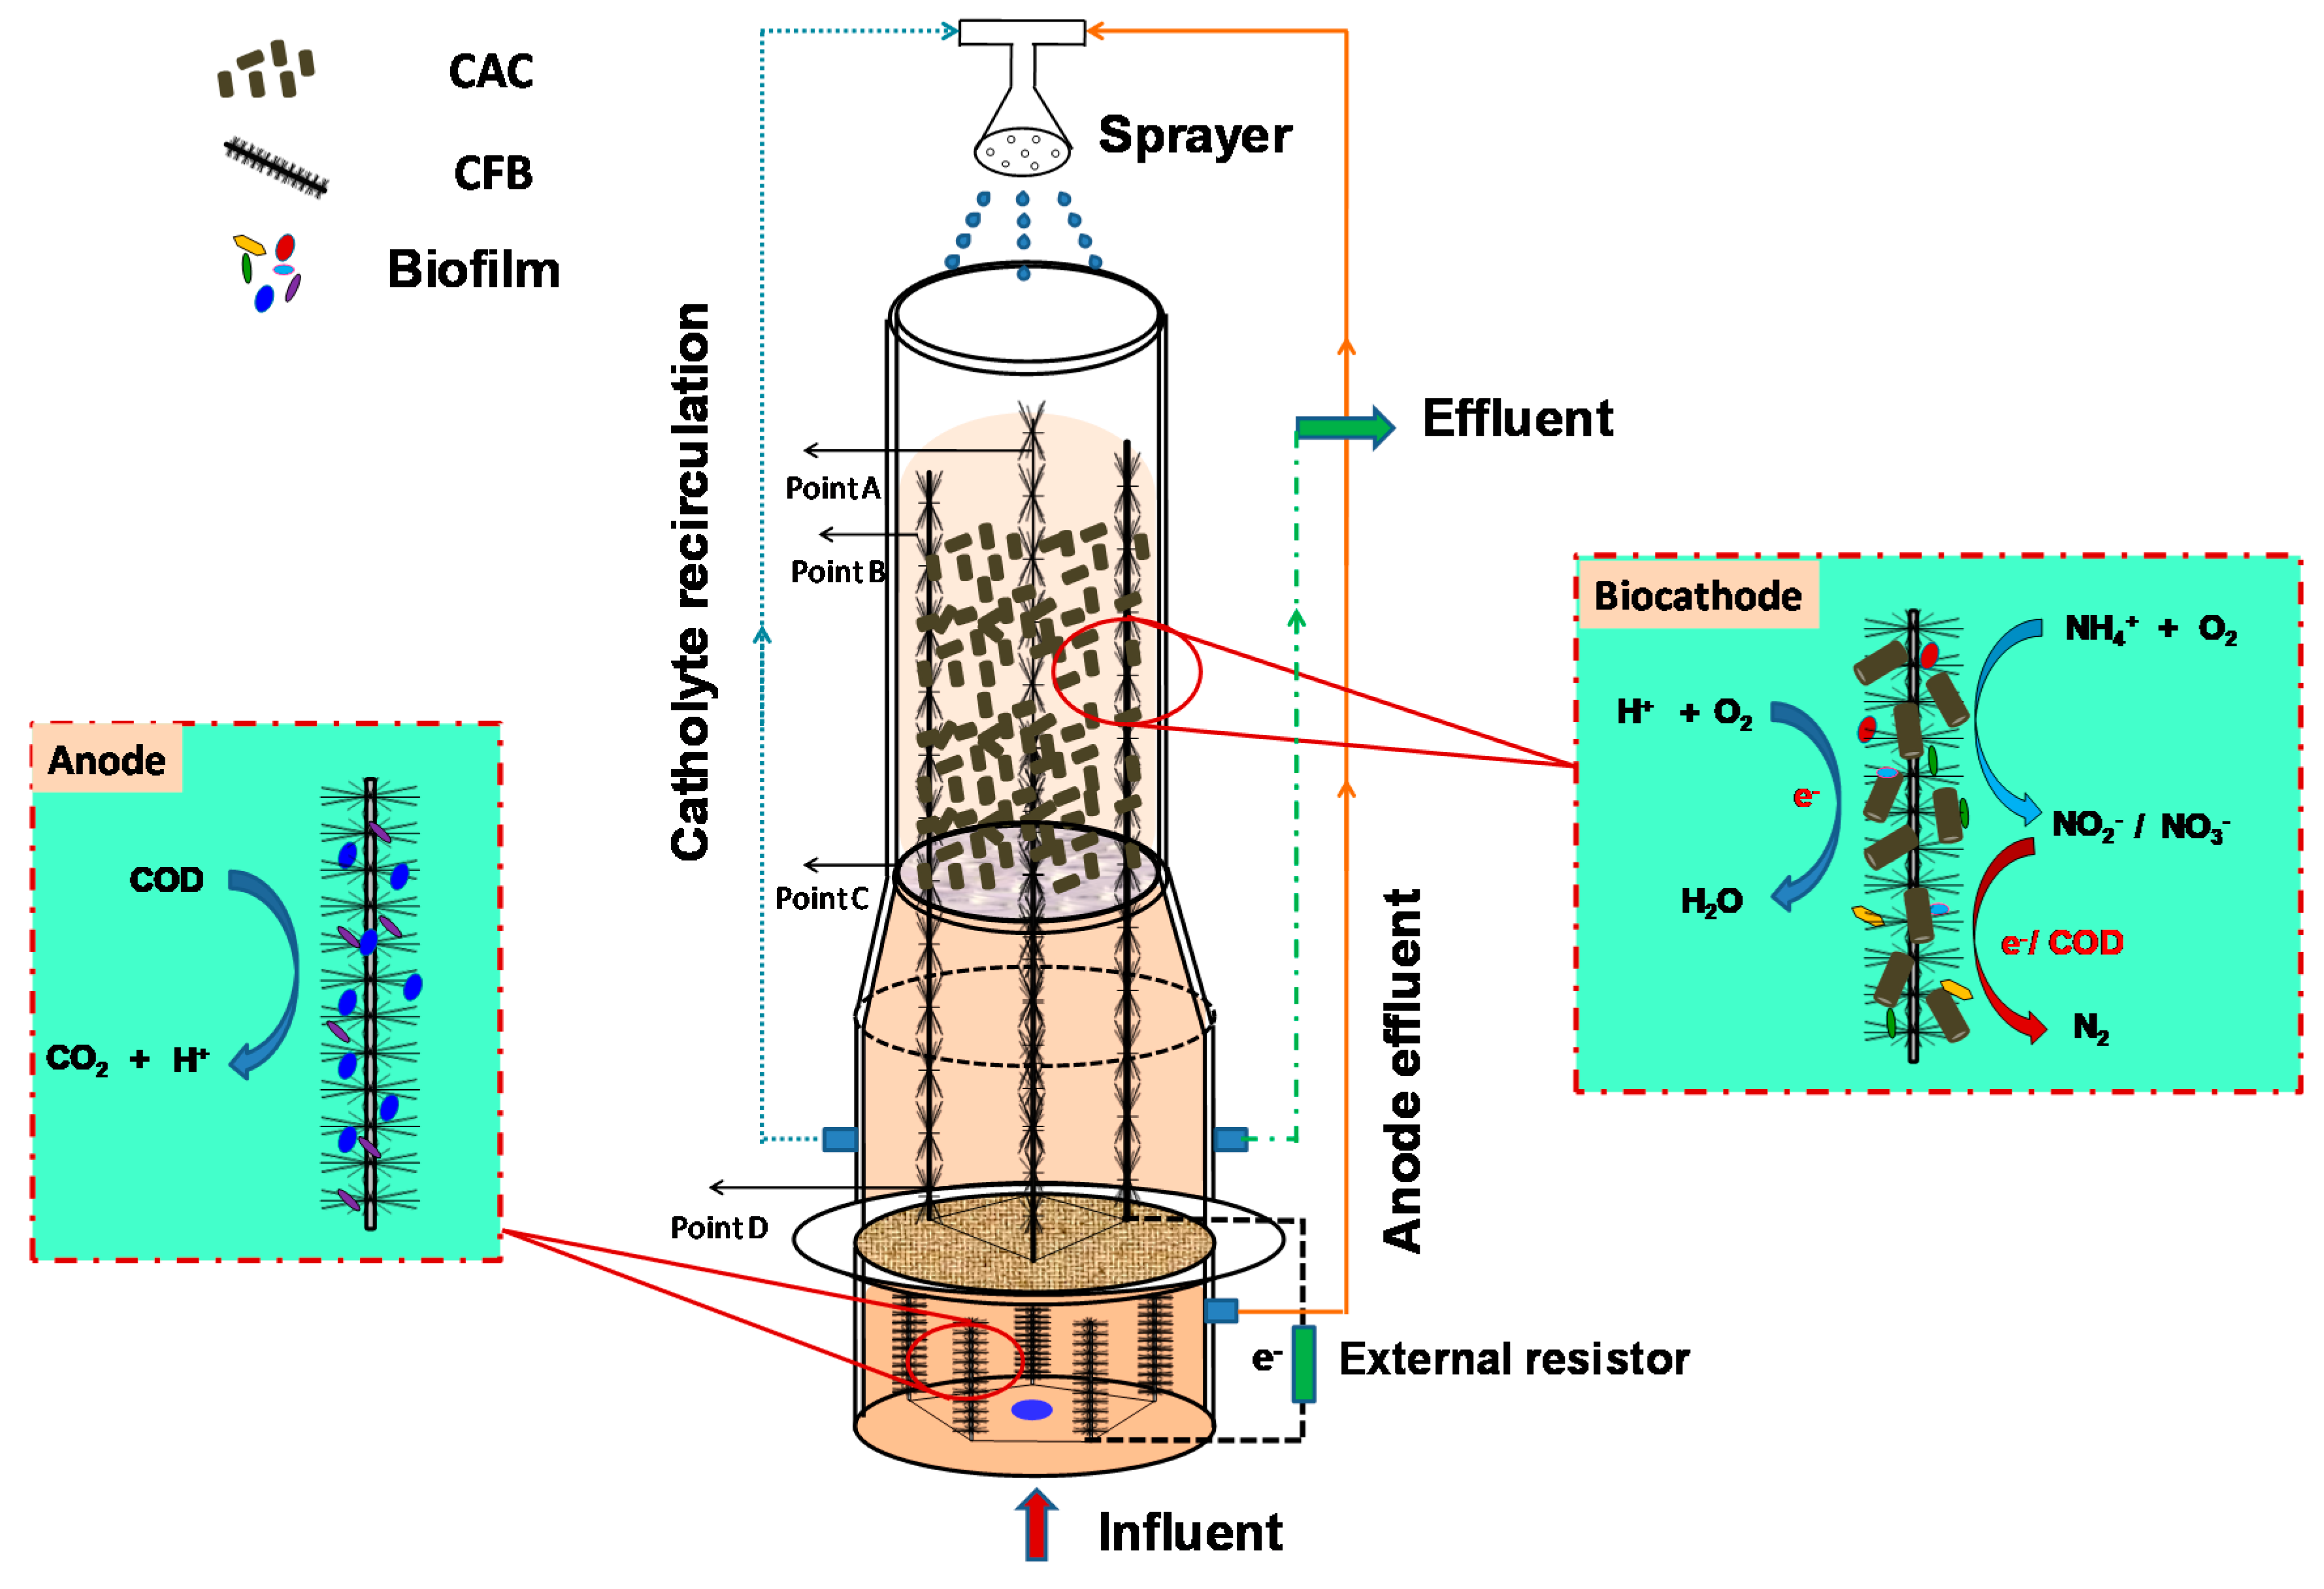
Figure 1. Schematic diagram of the trickling-bed biocathode microbial electrochemical system (TB-MES)(CAC: columnar activated carbon; CFB: carbon fiber brush).
Applsci 10 02989 g001
Figure 2. Power density and polarization curves of the TB-MES at different catholyte recirculation rate (V: voltage, P: power density, 50, 200, 400: 50 mL min−1, 200 mL min−1, 400 mL min−1).
Applsci 10 02989 g002
Figure 3. Variation of DO concentration on different part of the biocathode at each recirculation rate.
Applsci 10 02989 g003
Figure 4. Power density and polarization curve of the TB-MES treating domestic wastewater.
Applsci 10 02989 g004
Figure 5. Variation of (a) COD concentration and COD removal and (b) NH 4 + - N , NO 3 - N and NO 2 - N concentrations, as well as ammonium nitrogen removal and TN removal of TB-MES fed with domestic wastewater (Inf: influent, Eff: Effluent).
Applsci 10 02989 g005aApplsci 10 02989 g005b
Figure 6. Relative abundance of microbial reads retrieved from the CFBup, CFBbottom, CACup, and CACbottom classified at the (a) phylum and (b) genus level. Others refer to the phylum and genus with a relative abundance less than 1%.
Applsci 10 02989 g006
Table 1. Estimators for evaluation of microbial community diversity and richness.
CFBupCFBbottomCACupCACbottom
Sequencing reads
OUT
14706
1120
18726
1011
34133
1808
32657
1775
Shanon3.3737333.0201384.7851634.323434