Article

Strain Rate Dependencies and Competitive Effects of Dynamic Strength of Some Engineering Materials

by
Ivan Smirnov
1,* and
Alexander Konstantinov
2
1
Faculty of Mathematics and Mechanics, Saint Petersburg State University, Universitetskaya Emb. 7/9, St. Petersburg 199034, Russia
2
Research Institute of Mechanics, Lobachevsky State University of Nizhny Novgorod, Gagarin Avenue 23, Nizhny Novgorod 603950, Russia
*
Author to whom correspondence should be addressed.
Appl. Sci. 2020, 10(9), 3293; https://doi.org/10.3390/app10093293
Submission received: 13 April 2020 / Revised: 3 May 2020 / Accepted: 5 May 2020 / Published: 9 May 2020
(This article belongs to the Section Mechanical Engineering)

Abstract

:
Comparison of strength characteristics of engineering materials is usually based on comparison of data from quasi-static tests. However, under dynamic loads, strength characteristics of materials are unstable and the strength ratio of two materials can change dramatically. This paper presents a comparative study of the strain/stress rate dependencies of the critical stresses of various quasi-brittle and ductile engineering materials, as well as their various internal states. A case of continuously increasing load in compression and splitting tests is considered. Experimental results were obtained for bricks, mortar and limestone in dry, saturated and frozen states; copper and titanium in different structural states; and road bitumens with different modifiers. The results show that such dependencies can intersect, thereby realizing a strength competition effect. This means that one material can withstand higher stresses under a quasi-static load and lower stresses under a dynamic load in comparison with another material. Thus, such an intersection suggests that the choice of a material based on quasi-static parameters may be erroneous for structures intended for dynamic modes. The analysis of strain/stress rate dependencies of ultimate or yield strength is carried out on the basis of the incubation time approach. The introduction of dynamic strength characteristics with the dimension of time is considered. This parameter characterizes well the response of the materials to dynamic loading. The calculation results show the possibility of estimating the critical stresses and the strength competition effect at high rate loads using no more than three parameters, which can be easily used in engineering practice.

1. Introduction

The comparison of the mechanical parameters of materials usually begins with a comparison of stress–strain curve characteristics obtained by testing the materials for uniaxial tension or compression. These characteristics, for example, yield strength, tensile strength and modulus of elasticity are recorded in tables with the main characteristic properties of materials and used in practice to calculate the details of mechanisms and structures.
However, such an approach for assessing the strength properties of materials can usually be applied only for static or quasi-static loads. In this case, stress–strain curves exhibit stable values of the strength characteristics of the material, so that they can be taken as a material parameter. In the case of high-speed or shock loads, the ultimate strength and the yield strength exhibit unstable values [1,2,3,4,5]. Experiments with dynamic loads show a number of effects that are not explained by traditional notions of material strength, for example, the strain rate dependencies of the strength characteristics. A change in the strain rate of a material by six orders of magnitude can lead to a doubling of these strength characteristics. This can occur for various types of structural materials, including rocks and concrete [2], metals and alloys [4], polymers [5] and so on.
Thus, under dynamic loads, the strength of a material can no longer be characterized by a specific value of the critical stress. That is why, in view of the needs of modern technology, the problems of the behavior of materials and structures under conditions of fast high-intensity mechanical loads are fundamental for engineering applications. However, for the current state of dynamic fracture mechanics, there is a lack of common universal methods and approaches that could work effectively for a wide range of applied loads.
One of the ways to characterize the strength of a material under dynamic loads is to construct a diagram of critical stresses in a wide range of strain rates [6,7,8,9,10]. Such rate dependencies are often considered as a function of a material [2,11,12]. At the moment, this way has disadvantages, including the lack of generally accepted approaches to both dynamic testing methods and methods for evaluating the results of such tests [2,10,13,14,15,16,17,18]. This leads to dissimilar and sometimes contradictory results that make it difficult to develop a general theory of dynamic strength of materials. In addition to a wide variety of constructional materials, their properties can also be quite diverse, depending on, for example, heat treatment or moisture saturation. In the case of static and slow loads, this effect is well understood. The dynamic response of a particular material is usually investigated for a specific state or environmental condition. After that, it is assumed that the change in the obtained strain/stress dependence of critical stresses for other states of the material will take place analogously to quasi-static loads. For example, an increase in the strength in quasi-statics will lead to a similar increase in the dynamic strength over the entire range of loading rates. However, a number of studies show that this approach is not always justified [17,18]. Materials can have different strain rate sensitivities, meaning their advantages can vary with the rate of loading. Due to the lack of parameters that characterize the response of a material to dynamic loads, the advantages of one material over another in the range of dynamic loads are difficult to assess at the design stage of structures.
There is an obvious need to develop approaches that use new principles to predict dynamic strength characteristics. One promising approach is the structural–temporal approach based on the incubation time criterion [19,20,21]. The approach suggests the introduction of the characteristic of dynamic strength of a material with the dimension of time. This concept allows us to consider temporary processes in the structure of the material and is successfully used to calculate and model a number of dynamic problems, for example, critical spalling stresses [22], crack propagation [23] and strain rate dependence of yield stress [24].
This work sequentially considers two tasks. First, a comparative study of the strain/stress rate dependencies of the critical stresses of various engineering materials, as well as their various internal states, is carried out. This task is aimed at assessing changes in the strength advantages of one material over another with a change in the loading rate. Then, an analysis of the experimental data is carried out based on the approach of the incubation time criterion. This task is aimed at identifying material parameters that can help predict the behavior of critical stresses in a wide range of loading rates at the design stage.
The study provides consideration of the critical stress competition using the incubation time criterion for the examples of bricks, mortar and limestone in dry, saturated and frozen states; copper and titanium in different structural states; and road bitumens with different modifiers. A case of continuously increasing loads is considered. In experiments, the loading rate was varied to determine the strain/stress rate dependencies of the ultimate strength or yield strength.
It is shown that the strain rate dependencies of critical stresses of the materials under consideration can intersect. This intersection suggests that quasi-static strength parameters may not be enough for the correct selection of a material for structural elements designed for operation in dynamic modes. To calculate the strain rate dependence and estimate the competitive effect, a maximum of three parameters of the materials are used. One of them is the quasi-static ultimate stress. The second is the modulus of elasticity. The third is the incubation time, which is positioned as a characteristic of the dynamic strength of a material. As a result, the observed dynamic effects of the strength of materials can be estimated based on two strength parameters, one of which is already included in the table parameters of materials.
Thus, this paper is aimed at discussing the important issue of the practical mechanics of materials with the introduction of the additional strength parameter of a material with a time dimension, for example, the incubation time, into the table of mechanical parameters that can make it possible to evaluate the behavior of the material under dynamic loads without laborious and expensive experiments.

2. Materials and Methods

This work considered collected data obtained through various studies on the behavior of materials under dynamic loads. In addition to the general effect of increasing critical stresses with increasing strain rate, the competition effect of critical stresses was revealed in a number of results, which was the motivation for this study.
Three types of behavior (material) were considered, namely quasi-brittle, ductile and complex brittle–ductile rheology. The dependencies of dynamic strength on strain rate of quasi-brittle materials were considered for the examples of bricks, limestone and mortar. The strain rate dependencies of dynamic yield strength were compared for the examples of pure titanium and copper. Bitumens for asphalt mixtures were considered as materials with complex rheology. Bitumen was also considered in this paper because it is very sensitive to changes in temperature and loading rate, with the result that its plasticity can be replaced by brittle fracture.

2.1. Materials

The two batches of specimens for comparative research were made of ceramic and refractory brick. The bricks were bought at a building materials store. The ceramic brick was M150 grade, corresponding to a strength of at least 15 MPa for compression and 27 MPa for bending, according to standard GOST530-2012 [25]. The refractory (fireclay) bricks were SHB-5 grade, corresponding to a compressive strength of at least 15 MPa, according to standard GOST390-2018 [26]. The density was 1641 kg/m3 for the ceramic brick material and 2053 kg/m3 for the refractory brick material. We followed specified standards for all other technical data regarding the grades of bricks under consideration. The specimens were cut from the block of brick using a diamond core drill bit. The cylindrical specimens each had a diameter of 18 mm and a height of 16 mm. Forty specimens of each material were selected for compression (20 specimens) and splitting tensile (20 specimens) tests.
The other batch of specimens was made of mortar. The mortar was prepared based on a mixture of cement, sand (fraction of up to 2 mm) and water with the mix proportions 1:2.5:0.45, respectively. The cement was Portland cement type CEM I with a strength class of 32.5 in accordance with standard GOST31108-2016 [27]. According to the Russian technical regulation SP 82-101-98 [28], the mixture should provide the compressive strength of a mortar of at least 20 MPa. The mortar was cured for 28 days. After that, the mortar had density of 2361 kg/m3.
The limestone was purchased from a store with rocks for building and decoration. The material had a density of 2819 kg/m3 and a longitudinal elastic wave speed of 5462 m/s.
Dry, saturated and frozen states of the limestone and mortar were considered. Specimens for the tests were made in the form of a cylinder with a diameter of 20 mm and a length of 15 mm. The water saturation of the specimens was provided by placing the specimens in water for two weeks. The full saturation was 5% for the limestone and 6% for the mortar. Freezing of the specimens was achieved by placing the water-saturated specimens in a freezer at −15 to −10 °C for two days, after which the specimens were immediately tested. Ninety-six specimens of each material were selected for compression (16 specimens for each state) and splitting tensile (16 specimens for each state) test.
Commercially pure titanium Grade 4 (99.1%) and electrotechnical pure copper M1 (99.9%) with coarse-grained (CG) and ultrafine-grained (UFG) structures were also considered in this study. The materials initially had a CG structure. UFG structures were produced by equal-channel angular pressing (ECAP) [29]. A UFG structure can lead to a significant increase in yield strength and tensile strength. However, the dynamic behavior of materials with such a structure is still little studied. The specimens each had the form of a cylinder with a diameter of 8 mm and a length of 4 mm. A more detailed description of the parameters of the materials can be found in [30] for copper and in [31] for titanium. In this paper, the results were used for an individual consideration of the competition effect of yield strengths. Six specimens of each material were selected for compression tests.
Road bitumen with a penetration index of 60–90 mm (BND 60/90), polymer–bitumen binder with a penetration index of 60 (PBB 60) and rubber–bitumen binder (RBB) are discussed in this work. These materials were chosen in order to explore the dynamic behavior of the bitumen grades used for a roadway in northwestern Russia. PBB and RBB are modifications of BND bitumen due to the addition of polymer and rubber powders in order to reduce irreversible deformations and the brittleness temperature of the bitumen binder, depending on road conditions [32,33]. The specimens were prepared at an asphalt–concrete plant, ABZ No. 1, in St. Petersburg, Russia. Cylindrical specimens each with a diameter of 19 mm and a length of 14 mm were used. The results for uniaxial compression at room temperature (20 °C) and splitting at −15 to −10 °C are discussed here. In the second case, the specimens were kept in a freezer at −15 °C for one day, and then the specimens were immediately tested. In connection with this method, the temperature range was assumed to be between −15 and −10 °C. Eight specimens of each material were selected for dynamic compression tests at room temperature (4 specimens) and dynamic splitting tensile tests at −10 °C (4 specimens).

2.2. Experimental Methods

Uniaxial compression or splitting (indirect tension) tests of cylindrical specimens were considered in this study (Figure 1). Splitting tests are applicable only to brittle and quasi-brittle behaviors of materials. Therefore, both schemes were used only for quasi-brittle materials. Metallic materials were subjected only to compression tests. Tests of bitumen were considered only for the case of compression at room temperature and splitting at a negative temperature (−10 °C), because this is a typical loading of asphalt concrete under appropriate weather conditions.
The purpose of the experiments was to determine the critical stress leading to macro-failure for each loading rate. The measured loads and displacements made it possible to establish stresses in the cylindrical specimens according to known formulas for mechanics of materials [34,35] and fracture mechanics [36].
A standard testing machine consisting of a temperature chamber was used for tests under slow strain rates (10−3–10−2 1/s). At least three specimens were tested in the case of quasi-brittle materials for each loading scheme. Two samples of each metallic material were used in the compression tests. Quasi-static testing of bitumen was not considered in this paper.
For high strain rate testing, a split Hopkinson pressure bar (SHPB) setup and a drop tower impact tester machine (DTIM) (CEAST 9350, Instron, Turin, Italy) were used.
The DTIM allowed testing specimens at strain rates of 10–103 1/s. A flat-tipped impactor with a diameter of 50 mm was used for compression and splitting tests.
The SHPB allowed testing specimens at strain rates of 102–104 1/s. In the setup, aluminum rods (D16) with a diameter of 20 mm were used (SHPB-20). Details on material testing using the SHPB, requirements for specimens, data acquisition and processing are given in [2,37,38,39]. Mandatory requirements for testing and specimens to eliminate the influence of inertial effects in a specimen, lateral confinement and friction effect in the process of radial distribution of a specimen were met. The sizes of the specimens and the load pulse shape were selected to ensure an equilibrium state at both contacts specimen-bars and to minimize inertial effects.
Note that both dynamic test units provide continuous load growth, which is the same as a standard quasi-static test machine. Therefore, in this work we consider only cases when failure or plastic flow begins at the stage of load growth. Pulse loads, for example, as in the spall test procedure, should be considered in a separate study.
The loading/stress rate under dynamic loads varied as a result of a change in impactor speed. There are no generally accepted requirements for the number of specimens in dynamic tests; however, for these experiments, three specimens of a quasi-brittle material and two specimens of a metallic material were tested for each loading rate. Due to the technical features (acceleration of impactor, implementation of contact between the specimen and impactor, formation of a load wave, etc.) of the dynamic test equipment, it is difficult to ensure accurate repetition of a load profile. For this reason, along with the failure features of quasi-brittle materials, the loading or strain rate may differ for the same stipulated impactor speed.

3. Results

Figure 2 shows typical stress diagrams for dynamic testing of the quasi-brittle or ductile materials. In the case of quasi-brittle behavior of the materials, an increase in the load led to the nucleation, development and interaction of micro-defects in the structure of the materials. When the concentration of defects reached a critical level, visible macro-failure began, which was expressed by the beginning of a decrease in stress. These moments are indicated in Figure 2 by the critical stress σF and time before failure tF. Similar reasoning applies to the onset of plastic macro-flow, which was clearly expressed by the yield strength σY and time before it tY.
In this study, we refer to the failure stress or yield stress as the critical stress σcr. In addition, in order to avoid many notations, we use the same notation for compression and splitting tests. However, one must always understand what situation is being considered and imply the nature of the critical stress according to the problem. In the general case, the mechanisms for implementing a given failure or plastic strain for a particular test can differ greatly. However, the generalization of designations used in the framework of this study allows us to emphasize the generality of the considered effects of dynamic loading of constructional materials, regardless of their structural state and loading scheme.
The test results are presented in Figure 3, Figure 4 and Figure 5. The points are the experimental results, and the curves are a linear approximation (y = a + bx). The coefficients of determination R2 of the linear approximation are given in the figures. In almost all cases, the results showed a significant increase in critical stresses with increasing strain rate, especially for the quasi-brittle materials. Exceptions were the metals with the UFG structure. This may be due to the high density of dislocations, which significantly reduced the possibility for the development of dislocation processes, and as a consequence, changes in the flow stress.

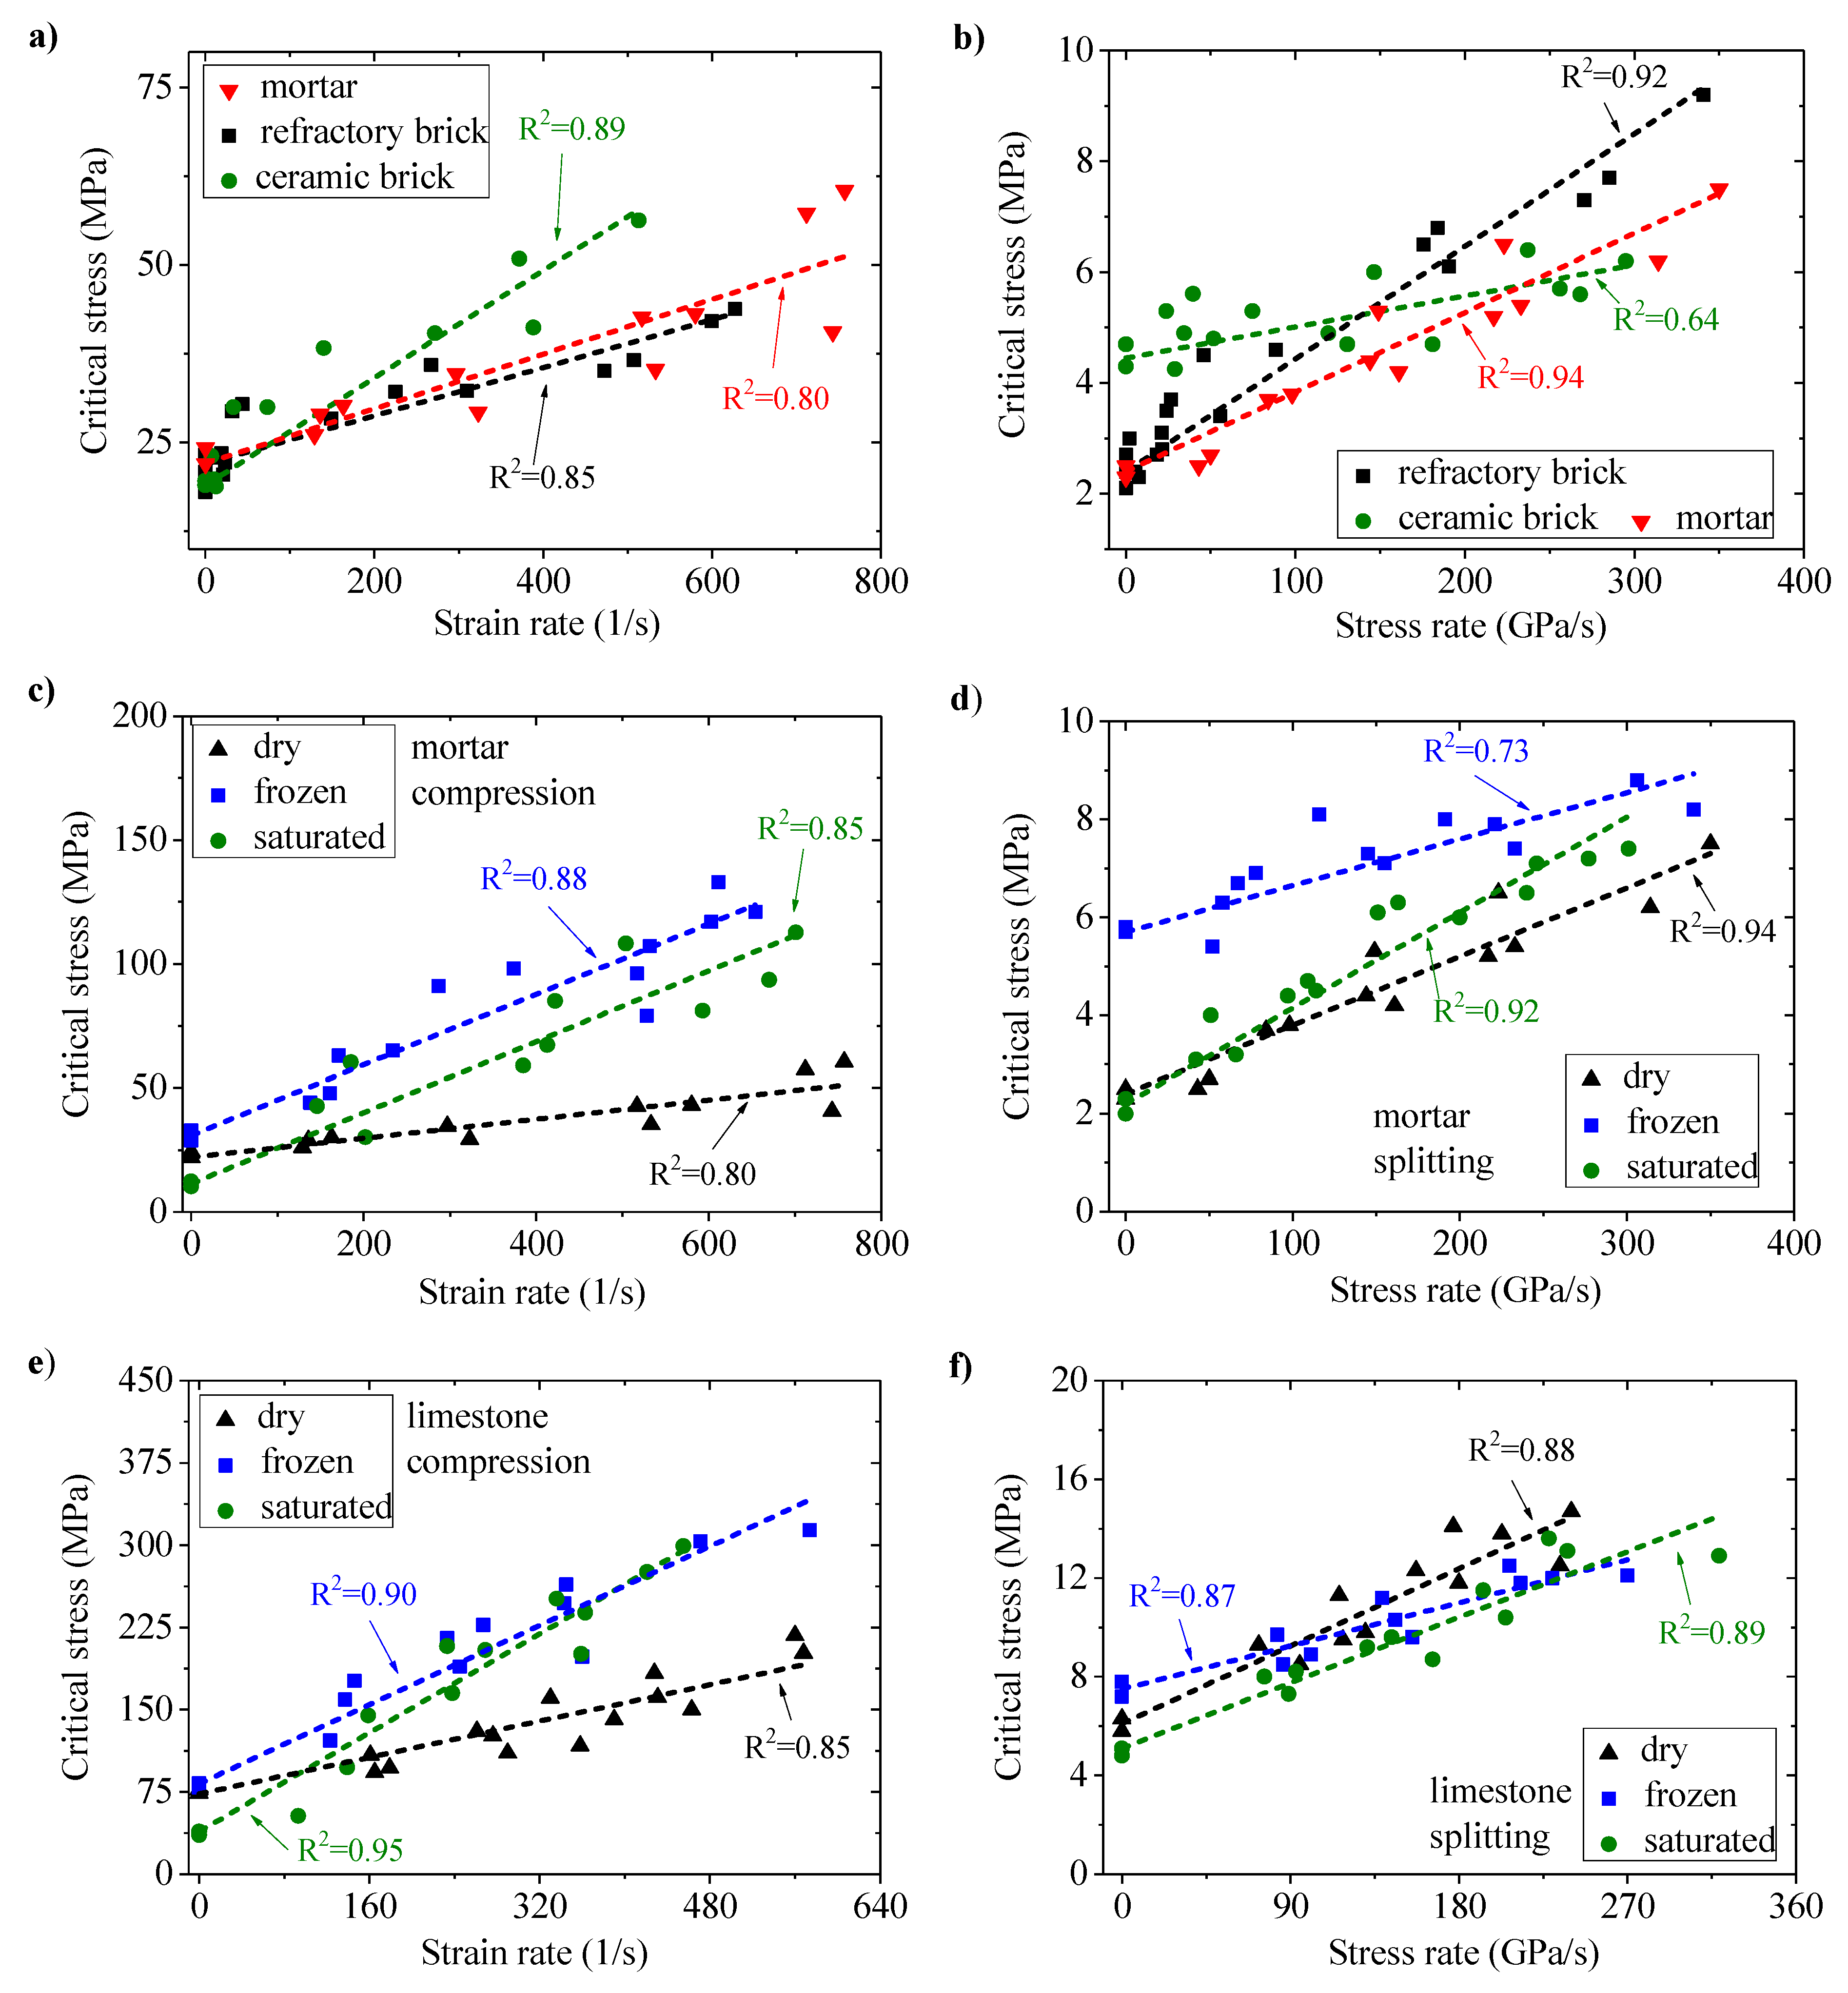
3.1. Comparison of Critical Stresses for Various Quasi-Brittle Materials

As can be seen from Figure 3a,b, widely used building materials had significantly different responses to dynamic loads. The ceramic brick showed the lowest quasi-static compressive strength, but its dynamic strength was significantly higher than the dynamic strength of the mortar and refractory bricks with deformation rates over 150 1/s. In the case of splitting, the same inversion of strength was manifested by the refractory bricks. This effect of strength competition is important when choosing materials for structures that should work in a dynamic mode with predominant compressive or tensile loads. It is obvious that by relying only on data on quasi-static strength, it is difficult to make the right choice of a material. In addition, processing of these materials is often performed using dynamic loads, like drilling, cutting and grinding. Understanding the behavior of the dynamic strength of the materials can help in choosing the right processing modes, thereby optimizing energy costs.

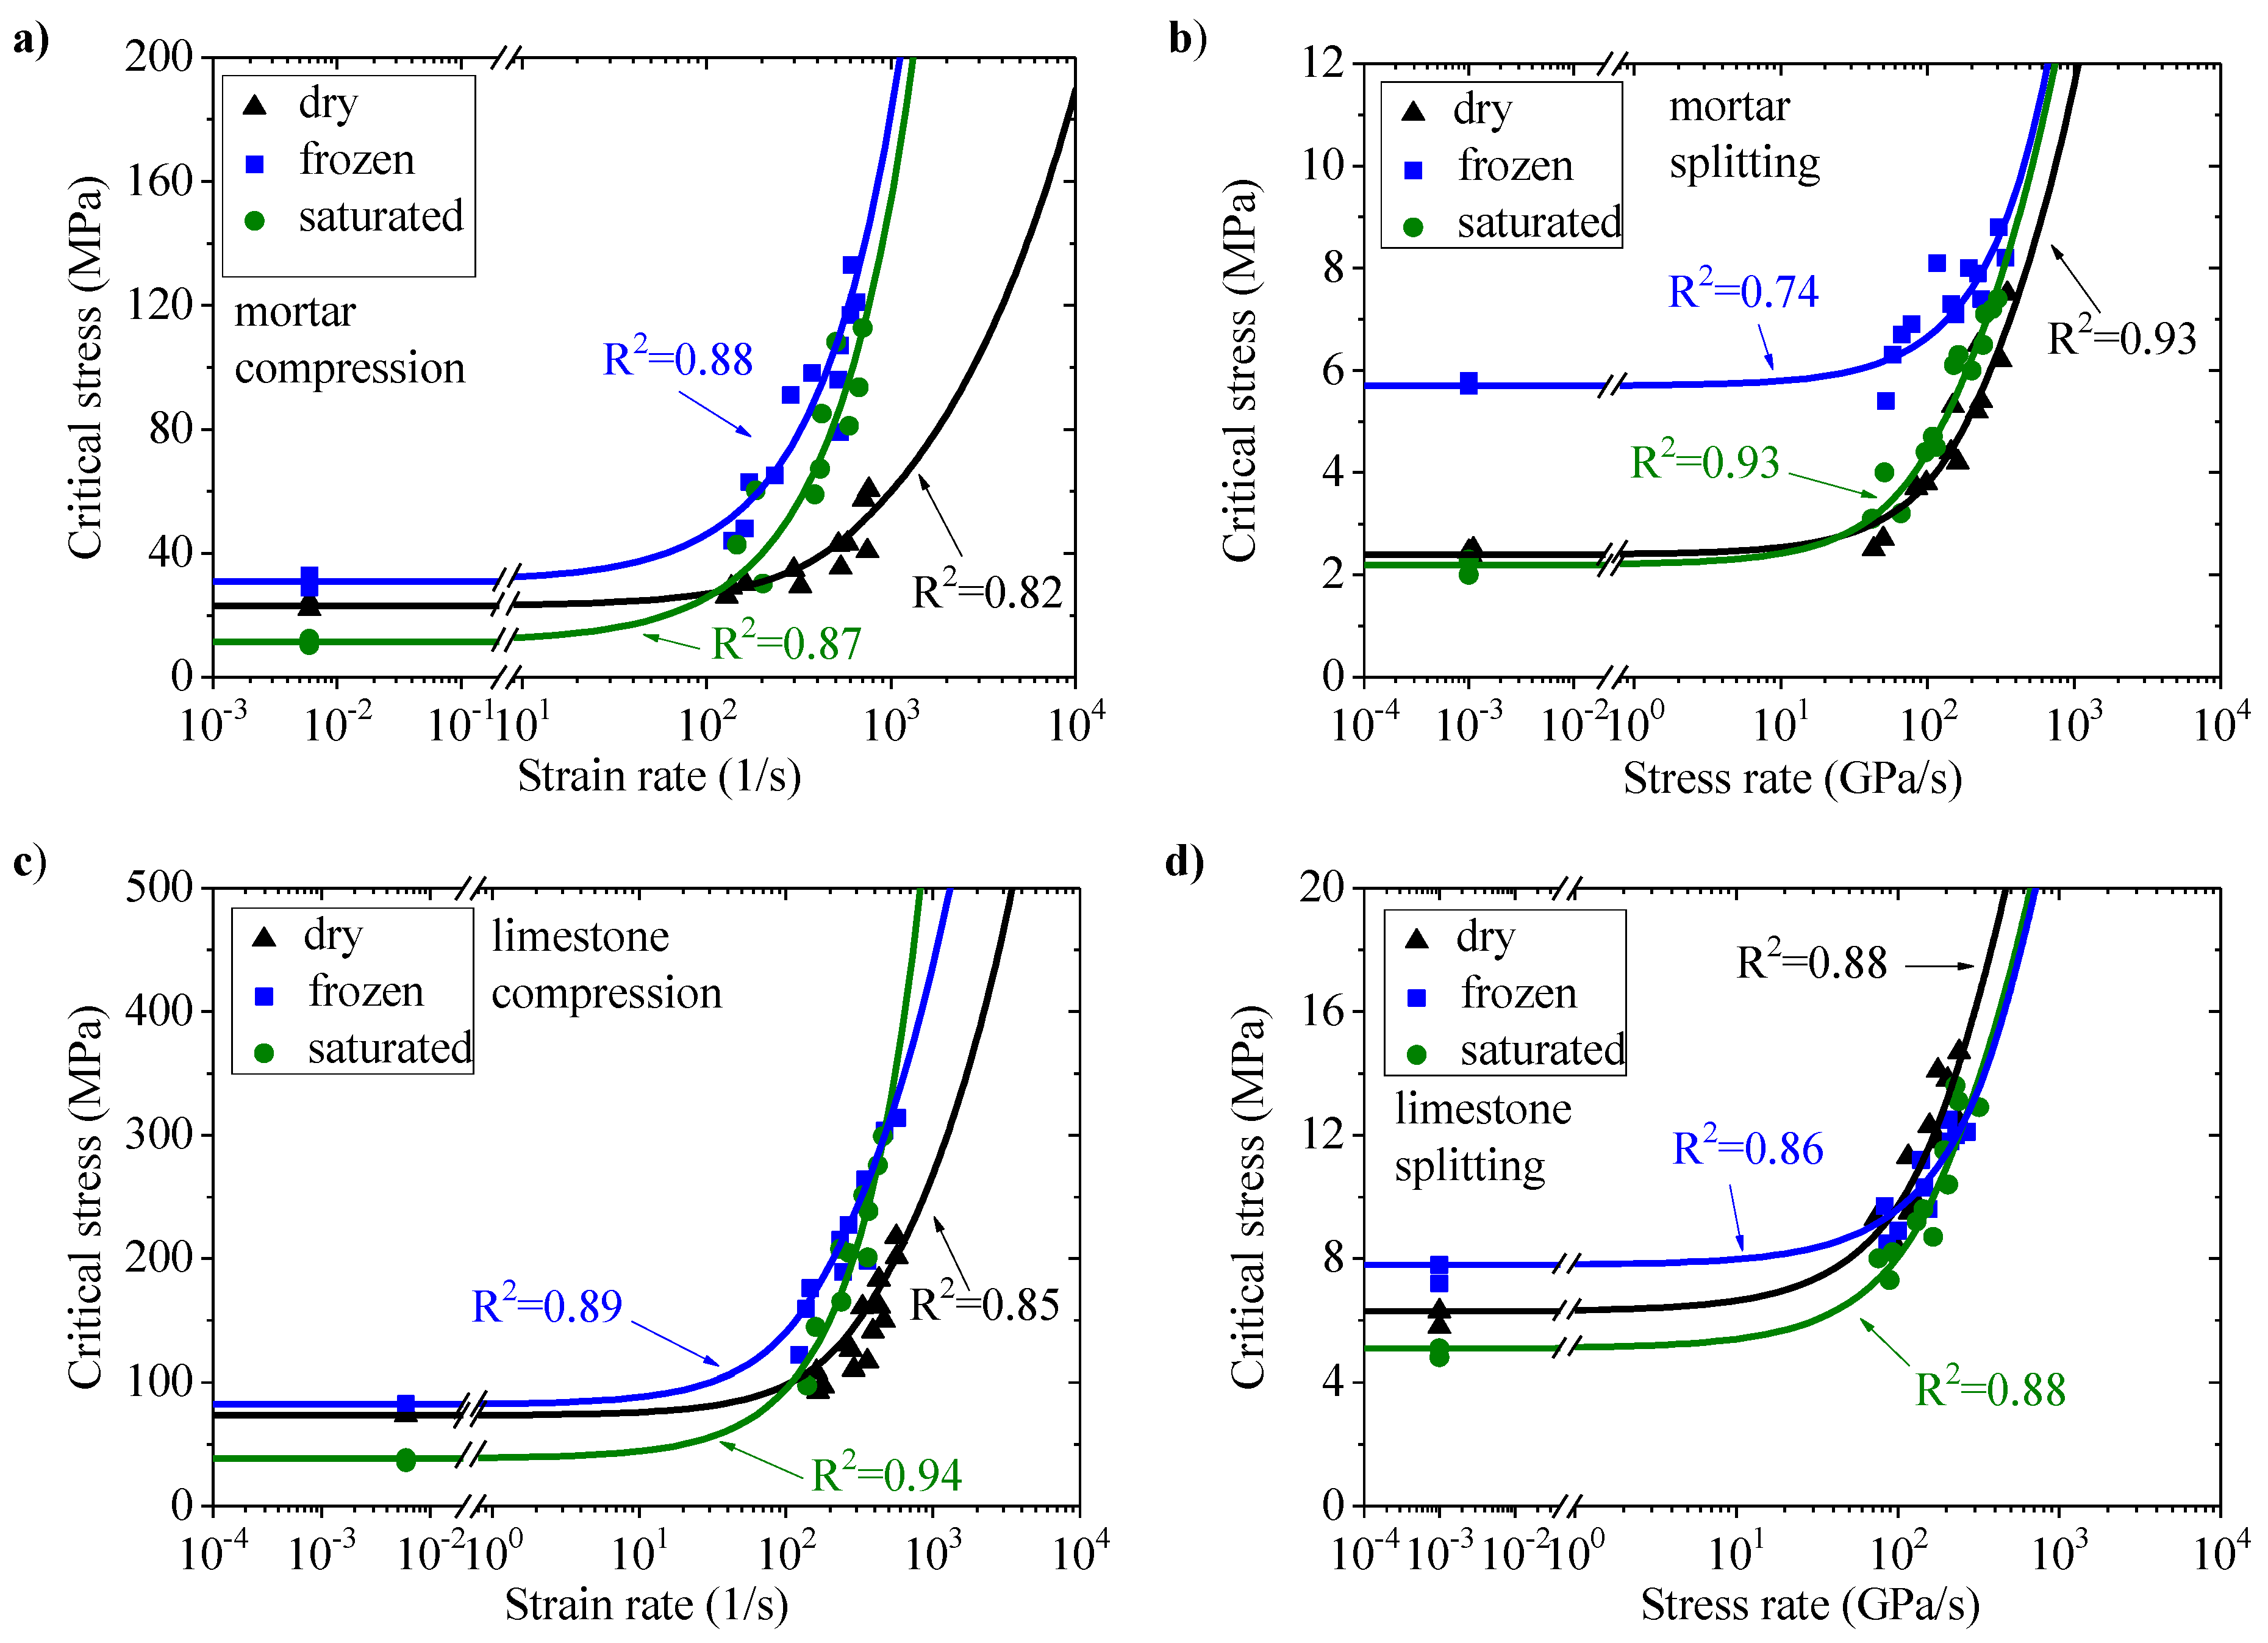
3.2. Comparison of Critical Stresses for Various States of Mortar and Limestone

Figure 3c–f show the strain/stress rate dependencies of critical stresses for dry, saturated and frozen mortar and limestone under compression and splitting. In the case of quasi-static conditions, the strength of mortar and limestone seriously decreased with water saturation and increased with freezing for both schemes of loading. However, the saturated limestone exhibited maximum critical stresses under compression at strain rates above 600 1/s, and the dry limestone showed maximum critical stresses under splitting stress rates above 100 GPa/s. The frozen limestone, which is the most durable under slow loading, showed the lowest critical stresses under splitting at loading rates over 250 GPa/s. A similar dynamic effect was observed for the mortar. The dry mortar showed the lowest critical stresses under compression at strain rates of more than 200 1/s and under splitting at stress rate of more than 100 GPa/s.
The question about the mechanisms of such competitive behavior of critical stresses for the various states of the materials remains open. It is necessary to consider the theoretical problems of the influence of liquid and ice in the pores and micro-cracks on the strength of rocks and mortar. For example, a liquid medium can break the bonds between structural components or act as a wedge, but under dynamic loads, it allows better transfer of stresses in the material by filling in micro-defects. However, it is already clear that the competition effect of critical stresses is of serious importance for practical calculations of structures. For instance, such strength behavior of various states of rock may be important in engineering calculations, for example, in deep-sea mining or mining in permafrost areas. Mortar is often used in climates where one condition may prevail or all climates equally. In both cases, dynamic loads can significantly affect the ratios of a design and its real strength.

3.3. Comparison of Critical Stresses for Metals with CG and UFG Structure

Figure 4 shows the strain rate dependences of critical stress (yield strength 0.2%) of titanium and copper with different structure states under compression. The UFG material showed significantly greater yield strength than the CG material. However, the strain rate sensitivity of the UFG is much less than the CG material. These effects may find an explanation in the mechanisms of dislocation mobility and hardening of materials during deformation [40]. Thus, UFG materials can lose their strength advantage under dynamic loads. Thermomechanical processing can increase the strength properties of metals under quasi-static loads, but this does not mean simultaneous increase in strength under dynamic loads.

3.4. Comparison of Critical Stresses for Bitumen Binders for Asphalt Mixes

The dynamic test results of the bitumen binders are presented in Figure 5. The critical stresses showed a strong dependence on strain/stress rate for both compression (at 20 °C) and splitting (at −10 °C). In the case of slow loads, the critical stresses were unable to be determined due to the plasticity of the materials. With an increase in the strain/stress rate, a viscous–brittle transition was realized. Under the dynamic loads, the bitumen binders, like rocks, were fractured in a quasi-brittle manner, namely fragmentation during compression and cracking during splitting.
Since it is not yet completely clear how to provide a criterion for a continuous viscous–brittle transition, we considered only these cases in this paper. However, even with this approach, one can observe the competition effect of critical stresses. BND bitumen was the strongest under compression to strain rates of 600 1/s but weaker after strain rates of 1300 1/s. RBB bitumen was the least durable to splitting at stress speeds up to 10 GPa/s and most durable with stress growth rates of more than 60 GPa/s.
Such features of the strength behavior of bituminous binders can be important when calculating a pavement for areas with different speed limits and traffic mass.

4. Discussion

4.1. Calculation of Critical Stress Dependencies on Strain and Loading Rates

Let us consider the obtained experimental results from the point of view of the incubation time approach. In the case of relatively slow loading, the condition for the transition of a material to a new state may be a condition for achieving a critical value σst of a certain loading parameter σ:
σ σ st
Such threshold characteristics (ultimate strength, yield strength, critical stress intensity factor and so on) are widely used in practical calculations and are included among the main characteristics of materials. Under conditions of high-speed and/or intense short-term loading, criteria like (1) become invalid. The threshold stress of failure or the transition of a material into a plastic state may exceed the quasi-static limit by several times.
The question arises of how to find ways to describe the dynamic behavior of a material and, as a consequence, the search for parameters that can characterize the behavior of a material and can be determined from experiments. This way can be the incubation time approach [19,20,21,22,23,24]. The approach allows for a smooth transition from quasi-static to dynamic loads. The main concept of this approach is that all structural processes in a material, be it failure or plastic flow, do not occur instantaneously, as is customary in quasi-static loads, but over a period of time. It is intuitively clear that the duration of these processes may be related to an intensity of a load, but the approach assumes that these durations can be characterized by a constant value, which is a parameter of the material.
The general form of the incubation time criterion, as well as its variants for various problems, can be found in [41]. To consider the critical stress competition effect in the experimental results at hand, it is enough to use the criterion in the form of:
J ( t ) J c r , J c r = σ s t τ and J ( t ) = t τ t σ ( x , t ) d t
where J(t) is the stress pulse, Jcr is the critical stress pulse, σ(x,t’) is the stress at a given point x in the medium at time t, σst is the quasi-static critical stress and τ is the incubation time associated with the dynamics of structural processes preceding the observed event and characterizing, therefore, the duration of the preparatory process for this event. The time tcr and place xcr of the event are defined as the moment and the point (in the material volume) of the fulfilment of condition (2).
Thus, condition (2) can be considered as a condition for input of a structural force pulse for a period τ sufficient for structural transformations (for example, failure or plastic flow) in the elementary volume of a material. The parameters σst and τ are parameters of the material, and τ does not depend on the shape and duration of loading.
Note again that despite the general notation, two cases are considered in this study. These cases need to be selected depending on the context of the problem. The first is when the failure occurs at the conditionally elastic stage of the stress–strain curve, that is, it is a case of brittle or quasi-brittle failure. Then, the quasi-static critical stress is the ultimate stress σFS and the incubation time is the incubation time of failure τF. The second is when the onset of plastic deformation is examined. In this case, the quasi-static critical stress is the yield stress σYS and the incubation time is the incubation time of plastic yield τY.
Since quasi-brittle fracture and plastic flow occurs on a portion of the stress–strain curve, which can be approximated by a linear function, simple analytical expressions can be obtained for calculating the strain rate dependences of critical stresses. The change of stress in the material can be represented as a linear function in time σ ( t ) = σ ˙ t H ( t ) = E ε ˙ t H ( t ) , where E is the modulus of elasticity, σ ˙ is the stress rate, ε ˙ is the strain rate, t is the time and H(t) is the Heaviside step function. By substituting this function into criterion (4), one can find the onset time tcr of failure or plastic deformation and the corresponding critical stress σcr:
t c r ( ε ˙ ) = { τ 2 + σ s t E ε ˙ 2 σ s t τ E ε ˙ and σ c r ( ε ˙ ) = { σ s t + E ε ˙ τ 2 ,     t c r τ , 2 σ s t E ε ˙ τ ,     t c r < τ .
It should be noted that with the exception of τ, all parameters in condition (2) can be determined from the experiments indicated in previous sections. The incubation time can be determined using an approximation of calculated curves to experimental points with a minimal deviation. In addition, the incubation time can be determined from the magnitude of the critical pulse received for the time to the process start less than the incubation time. However, the method for determining the incubation time directly from one experiment is still at a development stage. For example, some ideas are discussed in [24,41].
Observable experimental dependencies can be calculated using Equation (3). The quasi-static strength was determined as the average value of the test results at quasi-static loading. The dynamic strength (the incubation time of failure) was determined semi-empirically using the nonlinear approximation via the Levenberg–Marquardt algorithm, which is a combination of Newton’s method and a gradient descent method. The parameter τ was selected in such a way that theoretical curves (Equation (3)) fit the experimental points with minimal deviation in all considered ranges of stress/strain rates. The calculated curves and the corresponding coefficients of determination R2 are shown in Figure 6, Figure 7, Figure 8 and Figure 9. The material parameters used for the calculation are presented in Table 1, Table 2 and Table 3.
The identified change of the ranking of the materials for the maximum critical stress during the transition from quasi-statics to dynamics coincides with the ranking of the failure incubation times of these materials (see Table 1, Table 2 and Table 3). For example, the saturated limestone has a quasi-static strength less than that of the frozen limestone, but the incubation time of failure of the saturated limestone is higher than that of the frozen material. This means that under dynamic loads, the saturated limestone is more durable than the frozen limestone.
The arrows in Figure 8 indicate the region of the realization of the critical stress competition effect. As in the case of critical stresses for the quasi-brittle materials the ratio of yield strengths of the materials and their structural states at high strain rates can be estimated using the incubation times of plastic yield (see Table 2).
As mentioned above, the quasi-brittle failure behavior of the bituminous binders was observed only for a range of dynamic loads. However, the critical stress values for slow loads are necessary for calculations by criterion (2). For this purpose, the values of the critical stresses under dynamic loads were extrapolated to the quasi-static strain rate using a linear function. The results of the calculations using Equation (3) are presented in Figure 9. The curves break conditionally and do not apply to the region of quasi-static loads due to a lack of understanding of when the viscous–brittle transition occurred. Note, as in the case of the previous materials, the dynamic behavior of the critical stresses of the bitumen binders can be assessed based on a comparison of the incubation times of failure (see Table 3).

4.2. A Possible Way to Predict the Competition of Strength Characteristics

According to the considered examples, the competitive effect of strength characteristics can be observed for various materials. Even the same material but with a different organization of the microstructure can have different sensitivity of critical stresses to loading rate. In the case of assessing the strength or comparing materials according to the classical principle of comparing values of ultimate strength (or yield strength), calculation of a structure or a detail intended for operation in dynamic modes can prove to be unreliable and lead to damage of the structure or the equipment.
It becomes necessary to determine the possibility of the competitive effect of strength characteristics at the design stage. As shown above, this can be achieved based on a comparison of the critical stresses (ultimate strength or yield strength) under a quasi-static load and the incubation times (failure or plastic yield). For example, if one material has an ultimate strength and incubation time of failure that are greater than those of another material, then the competitive effect of critical stresses will not be realized. If one material has a greater ultimate strength and a shorter incubation time of fracture than those of another material, then, in the case of close modules of elasticity, the effect of critical stress competition may occur. In this case, the intersection point ( ε ˙ c e ,   σ c e ) of the strain/stress rate dependences of the critical stresses can be easily determined by the calculation of strain ε ˙ c e or stress σ ˙ c e rate and the corresponding stress σ c e using Equation (3).
ε ˙ c e = 2 ( σ s t I σ s t I I ) E I I τ I I E I τ I , σ c e = σ c r ( ε ˙ c e )   o r   σ ˙ c e = 2 ( σ s t I σ s t I I ) τ I I τ I , σ c e = σ c r ( σ ˙ c e ) .
Superscript I and II denote the compared materials I and II, respectively.
Thus, the competition of critical stresses can be estimated by introducing only one additional material parameter with the dimension of time. The incubation time approach allows one to estimate critical stresses at high loading rates based on simple calculations suitable for use in engineering applications. It opens up great opportunities for using the incubation time concept in analytical or computer modelling of dynamic processes of failure or plastic flow.

5. Conclusions

A comparative study of the strain/stress rate dependencies of the critical stresses of various engineering materials, as well as their various internal states, was completed. Experimental results were obtained on the example of ceramic and refractory bricks, mortar and limestone in dry, water-saturated and frozen states, as well as coarse-grained and ultrafine-grained pure copper and pure titanium and three grades of road bitumen binders at room and negative temperature. A case of continuously increasing load was considered. Compression and splitting tests were involved. Strain rates up to 103 1/s at compression and loading rates up to 102 GPa/s at splitting were considered. Analytical modelling and analysis of experimental results was carried out on the basis of the incubation time approach. The main conclusions follow.
A typical effect for dynamic loads is the competition effect of ultimate failure stress of brittle/quasi-brittle materials or yield strength of plastic materials. The effect is, when comparing the two materials, is that one material has a value of critical stress (ultimate failure stress or yield strength) that is higher under a quasi-static load and lower under a dynamic load than the other material. The use of quasi-static strength characteristics can lead to an erroneous choice of a material for structures and components operating under dynamic loads.
The analysis of the strain/stress rate dependences of critical stresses and the prediction of the competitive effect can be carried out on the basis of the incubation time approach. The introduction of only one additional strength characteristic with the time dimension permits not only an estimation of the sensitivity of critical stresses in the material to dynamics loads, but also a prediction of such a dynamic effect as the competition between critical stresses.
The proposed approach and analytical expressions have a simple record and can be easily applied for analytical analysis and modelling in engineering practice.

Author Contributions

Conceptualization, I.S. and A.K.; methodology, I.S.; validation, I.S. and A.K.; formal analysis, I.S. and A.K.; investigation, I.S. and A.K.; resources, I.S.; data curation, I.S. and A.K.; writing—original draft preparation, I.S.; writing—review and editing, I.S.; visualization, I.S.; supervision, I.S.; project administration, I.S.; funding acquisition, I.S. All authors have read and agreed to the published version of the manuscript.

Funding

This research was funded by the Russian Science Foundation, grant number 18-79-00193.

Acknowledgments

The authors are grateful to Yuri Petrov and Anatoly Bragov for useful discussions, as well as Dmitry Lamzin for help in conducting the experiments.

Conflicts of Interest

The authors declare no conflict of interest.

References

  1. Meyers, M.A. Dynamic Behavior of Materials; John Wiley & Sons, Inc.: Hoboken, NJ, USA, 1994. [Google Scholar] [CrossRef]
  2. Zhang, Q.B.; Zhao, J. A review of dynamic experimental techniques and mechanical behaviour of rock materials. Rock Mech. Rock Eng. 2014, 47, 1411–1478. [Google Scholar] [CrossRef] [Green Version]
  3. Remington, B.A.; Allen, P.; Bringa, E.M.; Hawreliak, J.; Ho, D.; Lorenz, K.T.; Lorenzana, H.; McNaney, J.M.; Meyers, M.A.; Pollaine, S.W.; et al. Material dynamics under extreme conditions of pressure and strain rate. Mater. Sci. Technol. 2006, 22, 474–488. [Google Scholar] [CrossRef]
  4. Armstrong, R.W.; Walley, S.M. High strain rate properties of metals and alloys. Int. Mater. Rev. 2008, 53, 105–128. [Google Scholar] [CrossRef]
  5. Chen, W.; Lu, F.; Cheng, M. Tension and compression tests of two polymers under quasi-static and dynamic loading. Polym. Test. 2002, 21, 113–121. [Google Scholar] [CrossRef]
  6. Brara, A.; Klepaczko, J.R. Experimental characterization of concrete in dynamic tension. Mech. Mater. 2006, 38, 253–267. [Google Scholar] [CrossRef]
  7. Johnson, G.R.; Holmquist, T.J. Evaluation of cylinder-impact test data for constitutive model constants. J. Appl. Phys. 1988, 64, 3901–3910. [Google Scholar] [CrossRef]
  8. Siviour, C.R.; Jordan, J.L. High strain rate mechanics of polymers: A review. J. Dyn. Behav. Mater. 2016, 2, 15–32. [Google Scholar] [CrossRef] [Green Version]
  9. Arab, A.; Chen, P.; Guo, Y. Effects of microstructure on the dynamic properties of TA15 titanium alloy. Mech. Mater. 2019, 137, 103121. [Google Scholar] [CrossRef]
  10. Ramesh, K.T.; Hogan, J.D.; Kimberley, J.; Stickle, A. A review of mechanisms and models for dynamic failure, strength, and fragmentation. Planet. Space Sci. 2015, 107, 10–23. [Google Scholar] [CrossRef]
  11. Campbell, J.D.; Eleiche, A.M.; Tsao, M.C.C. Strength of metals and alloys at high strains and strain rates. In Fundamental Aspects of Structural Alloy Design; Jaffee, R.I., Wilcox, B.A., Eds.; Springer: Boston, MA, USA, 1977; pp. 545–563. [Google Scholar] [CrossRef]
  12. Johnson, G.R.; Cook, W.H. Fracture characteristics of three metals subjected to various strains, strain rates, temperatures and pressures. Eng. Fract. Mech. 1985, 21, 31–48. [Google Scholar] [CrossRef]
  13. Forquin, P. Brittle materials at high-loading rates: An open area of research. Philos. Trans. R. Soc. A 2017, 375, 20160436. [Google Scholar] [CrossRef] [PubMed] [Green Version]
  14. Yoo, D.-Y.; Banthia, N. Impact resistance of fiber-reinforced concrete—A review. Cement Concr. Compos. 2019, 104, 103389. [Google Scholar] [CrossRef]
  15. Klepaczko, J.R. Behavior of rock-like materials at high strain rates in compression. Int. J. Plast. 1990, 6, 415–432. [Google Scholar] [CrossRef]
  16. Abrosimov, S.A.; Bazhulin, A.P.; Voronov, V.V.; Krasyuk, I.K.; Pashinin, P.P.; Semenov, A.Y.; Stuchebryukhov, I.A.; Khishchenko, K.V. Study of mechanical properties of aluminum, AMg6M alloy, and polymethyl methacrylate at high strain rates under the action of picosecond laser radiation. Dokl. Phys. 2012, 57, 64–66. [Google Scholar] [CrossRef]
  17. Armstrong, R.W.; Li, Q. Dislocation mechanics of high-rate deformations. Metall. Mat. Trans. A 2015, 46, 4438–4453. [Google Scholar] [CrossRef]
  18. Armstrong, R. Size effects on material yield strength/deformation/fracturing properties. J. Mater. Res. 2019, 34, 2161–2176. [Google Scholar] [CrossRef]
  19. Petrov, Y.V.; Utkin, A.A. Dependence of the dynamic strength on loading rate. Sov. Mater. Sci. 1989, 25, 153–156. [Google Scholar] [CrossRef]
  20. Petrov, Y.V.; Morozov, N.F. On the modeling of fracture of brittle solids. J. Appl. Mech. 2008, 61, 710–712. [Google Scholar] [CrossRef]
  21. Gruzdkov, A.A.; Petrov, Y.V.; Smirnov, V.I. An invariant form of the dynamic criterion for yield of metals. Phys. Solid State 2002, 44, 2080–2082. [Google Scholar] [CrossRef]
  22. Petrov, Y.V.; Smirnov, I.V.; Utkin, A.A. Effects of strain-rate strength dependence in nanosecond load duration range. Mech. Solids 2010, 45, 476–484. [Google Scholar] [CrossRef]
  23. Kazarinov, N.A.; Bratov, V.A.; Petrov, Y.V. Simulation of dynamic crack propagation under quasi-static loading. Dokl. Phys. 2014, 59, 99–102. [Google Scholar] [CrossRef]
  24. Borodin, E.N.; Mayer, A.E.; Petrov, A.A.; Gruzdkov, Y.V. Maximum yield strength under quasi-static and high-rate plastic deformation of metals. Phys. Solid State 2014, 56, 2470–2479. [Google Scholar] [CrossRef]
  25. Runorm. Ceramic Brick and Stone. General Specifications. GOST 530-2012; Runorm: Moscow, Russia, 2017. [Google Scholar]
  26. Runorm. General-Purpose Fireclay and Semiacidic Refractory Articles. Specifications. GOST 390-2018; Runorm: Moscow, Russia, 2018. [Google Scholar]
  27. Runorm. Common Cements. Specifications. GOST 31108-2016; Runorm: Moscow, Russia, 2016. [Google Scholar]
  28. Russian Federation Gosstroy. Manufacturing and Usage of Solutions in Construction Industry. SP 82-101-98; Russian Federation Gosstroy: Moscow, Russia, 1998. [Google Scholar]
  29. Valiev, R.Z.; Langdon, T.G. Principles of equal-channel angular pressing as a processing tool for grain refinement. Prog. Mater. Sci. 2006, 51, 881–981. [Google Scholar] [CrossRef]
  30. Smirnov, I.; Konstantinov, A. Influence of ultrafine-grained structure produced by equal-channel angular pressing on the dynamic response of pure copper. Procedia Struct. Integr. 2018, 13, 1336–1341. [Google Scholar] [CrossRef]
  31. Smirnov, I.V. Strength characteristics and fracture of ultrafine-grained titanium Grade 4 processed by equal channel cngular pressing—Conform. Tech. Phys. 2019, 64, 497–505. [Google Scholar] [CrossRef]
  32. Yildirim, Y. Polymer modified asphalt binders. Constr. Build. Mater. 2007, 21, 66–72. [Google Scholar] [CrossRef]
  33. Presti, D.L. Recycled tyre rubber modified bitumens for road asphalt mixtures: A literature review. Constr. Build. Mater. 2013, 49, 863–881. [Google Scholar] [CrossRef]
  34. Kolsky, H. An investigation of the mechanical properties of materials at very high rates of loading. Proc. Phys. Soc. Sect. B 1949, 62, 676–700. [Google Scholar] [CrossRef]
  35. Hibbeler, R.C. Mechanics of Materials, 10th ed.; Pearson: London, UK, 2017. [Google Scholar]
  36. Anderson, T.L. Fracture Mechanics: Fundamentals and Applications, 4th ed.; CRC Press: Boca Raton, FL, USA, 2017. [Google Scholar]
  37. Lifshitz, J.M.; Leber, H. Data processing in the split Hopkinson pressure bar tests. Int. J. Impact Eng. 1994, 15, 723–733. [Google Scholar] [CrossRef]
  38. Bragov, A.M.; Lomunov, A.K. Methodological aspects of studying dynamic material properties using the Kolsky method. Int. J. Impact Eng. 1995, 16, 321–330. [Google Scholar] [CrossRef]
  39. Malinowski, J.Z.; Klepaczko, J.R. A unified analytic and numerical approach to specimen behaviour in the Split-Hopkinson pressure bar. Int. J. Mech. Sci. 1986, 28, 381–391. [Google Scholar] [CrossRef]
  40. Mishra, A.; Martin, M.; Thadhani, N.N.; Kad, B.K.; Kenik, E.A.; Meyers, M.A. High-strain-rate response of ultra-fine-grained copper. Acta Mater. 2008, 56, 2770–2783. [Google Scholar] [CrossRef]
  41. Petrov, Y.V. Incubation time criterion and the pulsed strength of continua: Fracture, cavitation, and electrical breakdown. Dokl. Phys. 2004, 49, 246–249. [Google Scholar] [CrossRef]
Figure 1. Test schemes for cylindrical specimens: (a) compression; (b) splitting (σt is the tensile stress).
Applsci 10 03293 g001
Figure 2. Typical stress diagrams in the samples at dynamic tests on a split Hopkinson pressure bar (SHPB) installation. σF and σY are the critical stress (ultimate and yield stress for a given strain/stress rate), tF and tY are the onset of failure or plastic deformation, respectively. (a) Dry limestone under compression (532 1/s); (b) ultrafine-grained (UFG) copper under compression (3800 1/s); (c) polymer–bitumen binder with a penetration index of 60 (PBB 60) under splitting (65 GPa/s); (d) bitumen PBB 60 under compression (1073 1/s).
Applsci 10 03293 g002
Figure 3. Comparison of the critical stress dependencies on a strain rate in compression (a,c,e) and splitting (b,d,f) tests of cylindrical specimens of quasi-brittle constructional materials. (a,b) Different materials; (c,d) different states of mortar; (e,f) different states of limestone. R2 is the coefficients of determination.
Applsci 10 03293 g003
Figure 4. Comparison of the critical stress (yield strength 0.2%) dependencies on a strain rate in a compression test of cylindrical specimens of titanium and copper with coarse-grained (CG) and ultrafine-grained (UFG) structures. Structures UFG1 and UFG2 were obtained with 4 and 8 passages of equal-channel angular pressing (ECAP) [30]. R2 is the coefficients of determination.
Applsci 10 03293 g004
Figure 5. Critical stress dependencies on a strain rate under compression at room temperature (a) and splitting at a negative temperature (b) of bituminous binders. R2 is the coefficients of determination.
Applsci 10 03293 g005
Figure 6. Critical failure stresses in quasi-brittle materials versus strain rate under compression (a) and stress rate under splitting (b). Curves are calculated by Equation (3). R2 is the coefficients of determination.
Applsci 10 03293 g006
Figure 7. Critical failure stresses in mortar (a,b) and limestone (c,d) versus strain rate under compression (a,c) and stress rate under splitting (b,d). Curves are calculated by Equation (3). R2 is the coefficients of determination.
Applsci 10 03293 g007
Figure 8. Strain rate dependence of critical yield stress (stress at strain of 0.2%) in titanium and copper under compression. Curves are calculated by Equation (3). R2 is the coefficients of determination.
Applsci 10 03293 g008
Figure 9. Calculated dependences of critical stress in bitumen binders on strain rate at compression (room temperature) (a) and stress rate at splitting ( −10 °C) (b). Curves are calculated by Equation (3). R2 is the coefficients of determination.
Applsci 10 03293 g009
Table 1. Parameters of quasi-brittle materials: σ F S c o m p is the quasi-static compression strength; σ F S s p is the quasi-static splitting strength; τ F c o m p is the incubation time of failure under compression; τ F s p is the incubation time of failure under splitting. Mean (standard deviation).
MaterialEcomp (GPa) σ F S c o m p ( MPa ) σ F S s p ( MPa ) τ F c o m p ( μ s ) τ F s p ( μ s )
refractory brick2.9 (0.3)20.7 (2.6)2.4 (0.3)25 (5.0)46 (6.7)
ceramic brick3.6 (0.4)19.3 (0.7)4.5 (0.4)41 (8.7)14 (6.3)
mortar dry3.4 (0.6)23.0 (1.2)2.4 (0.2)22 (6.5)28 (4.9)
mortar saturated4.4 (0.5)11.4 (0.9)2.2 (0.2)65 (12.6)44 (5.4)
mortar frozen5.6 (0.5)30.9 (1.6)5.7 (0.4)58 (9.6)19 (6.0)
limestone dry7.2 (0.8)73.7 (4.0)6.3 (0.7)57 (12.8)68 (11.6)
limestone saturated10.7 (0.9)38.9 (2.4)5.1 (0.4)105 (16.4)59 (7.6)
limestone frozen15.5 (1.0)82.5 (3.5)7.8 (1.0)75 (18.0)36 (8.0)
Table 2. Parameters of titanium and copper: σ Y S c o m p is the quasi-static compression yield stress (at 0.2% strain); τ Y c o m p is the incubation time of plastic yield under compression; Ecomp is the modulus of elasticity under compression. Mean (standard deviation).
MaterialStateEcomp (GPa) * σ Y S c o m p ( MPa ) τ Y c o m p ( μ s )
titaniumCG110640 (28)1.07 (0.33)
titaniumUFG1101014 (9)0.35 (0.14)
copperCG128258 (9)0.20 (0.04)
copperUFG1128349 (3)0.04 (0.01)
copperUFG2128365 (15)0.18 (0.05)
* According to the specification of these materials.
Table 3. Parameters of bitumen binders: σ F S c o m p is the quasi-static compression strength; σ F S s p is the quasi-static splitting strength; τ F c o m p is the incubation time of failure under compression; τ F s p is the incubation time of failure under splitting; C—compression; S—splitting; R—room temperature; M—temperature of −10 °C. Mean (standard deviation).
MaterialConditionE (GPa) σ F S c o m p ( MPa ) σ F S s p ( MPa ) τ F c o m p ( μ s ) τ F s p ( μ s )
PBBC, R0.76 (0.07)2.6 *-38 (0.9)-
RBBC, R0.70 (0.06)1.4 *-29 (1.4)-
BNDC, R0.65 (0.08)6 *-28 (0.8)-
PBBS, M--1.1 *-75 (0.4)
RBBS, M--0.5 *-102 (24.2)
BNDS, M--0.8 *-62 (5.1)
* The conditional value determined by the extrapolation of dynamic data to the quasi-static regime.

