Article

Quantitative Ultrasound Texture Analysis to Assess the Spastic Muscles in Stroke Patients

1
Graduate Institute of Biomedical Engineering, National Chung Hsing University, Taichung 402, Taiwan
2
Fall Prevention Center and Department of Physical Medicine & Rehabilitation, Changhua Christian Hospital, Changhua 500, Taiwan
3
Department of Biomedical Engineering, Da-Yeh University, Changhua 515, Taiwan
*
Author to whom correspondence should be addressed.
Appl. Sci. 2021, 11(1), 11; https://doi.org/10.3390/app11010011
Submission received: 20 November 2020 / Revised: 19 December 2020 / Accepted: 19 December 2020 / Published: 22 December 2020
(This article belongs to the Special Issue Selected Papers from ISET 2020 and ISPE 2020)

Abstract

:
This study aimed to investigate the feasibility of sonoelastography for determining echotexture in post-stroke patients. Moreover, the relationships of muscle echotexture features, muscle stiffness, and functional performance in spastic muscle were explored. The study population comprised 22 males with stroke. The echotexture features (entropy and energy) of the biceps brachii muscles (BBM) in both arms were extracted by local binary pattern (LBP) from ultrasound images, whereas the stiffness of BBM was assessed by shear wave velocity (SWV) in the transverse and longitudinal planes. The Fugl–Meyer assessment (FMA) was used to assess the functional performance of the upper arm. The results showed that echotexture was more inhomogeneous in the paretic BBM than in the non-paretic BBM. SWV was significantly faster in paretic BBM than in non-paretic BBM. Both echotexture features were significantly correlated with SWV in the longitudinal plane. The feature of energy was significantly negatively correlated with FMA in the longitudinal plane and was significantly positively correlated with the duration from stroke onset in the transverse plane. The echotexture extracted by LBP may be a promising approach for quantitative assessment of the spastic BBM in post-stroke patients.

1. Introduction

Spasticity is a commonly observed syndrome post-stroke and causes considerable long-term motor impairments in stroke survivors. The muscle properties and motor function in impaired limbs are known to gradually change, which negatively impacts the quality of life of stroke survivors. Post-stroke reduction in muscle volume, shortening of muscle fibers, increase in intramuscular fat (IMF) and extracellular matrix, and connective tissue accumulation in the spastic muscles have been reported [1,2,3]. However, spasticity is a complex interaction with neuro and mechanical parts (soft tissue altered). In clinical practice, it is difficult to distinguish each other and often makes the failure of treatment. Therefore, developing a highly reliable method to monitor these changes in spastic muscle and identify muscle quality is important for early interventions in clinical practice.
Quantitative ultrasound imaging is commonly used to assess muscle quality and structure, e.g., muscle thickness and fiber orientation [4]. Altered muscle architecture and disrupted fiber orientation caused by the infiltration of fat and the development of fibrosis increase reflections of the ultrasound beam, resulting in an increased echo intensity (EI) of spastic muscles. Therefore, quantitative assessment of muscle EI using gray-scale of a region of interest (ROI) is widely employed to estimate muscle quality and distinguish the neuromuscular disease [5]. However, EI is highly dependent on the operator, ultrasound device, and settings [6].
In contrast to EI, textural descriptors are less affected by ultrasound scanner settings and may have an advantage of providing more complete description of tissue composition [7]. Several texture features, such as the Haralick and Galloway features, are useful for the diagnosis, characterization, and detection of neuromuscular diseases [8,9,10,11]. Another potential technique for texture analysis is the local binary pattern (LBP), which has been used for face recognition, characterization, and classification of fatty liver [12], plaques in the carotid artery [13], breast tumors [14], and knee osteoarthritis [15]. Its advantages include ease of implementation, invariance to illumination changes, and low computational complexity. However, little is known about its applications for muscle texture analysis.
In recent years, sonoelastography becomes commonly used as a surrogate tool to define post-stroke muscle stiffness by estimating shear wave velocity (SWV) in the muscle [16,17]. Stiffness is a commonly used factor to describe the material property of muscle. However, the correlation between echotexture and sonoelastography post-stroke has not been reported.
Based on the facts of imaging texture is influenced by acoustic parameters (speed, attenuation, and backscatter amplitude), which are closely related to muscle properties [18]. We hypothesize that echotexture features can be used to interpret the uniformity of the muscle pattern. To address this gap, the present study investigated the feasibility of sonoelastography for the determination of echotexture and muscle stiffness in post-stroke patients. Moreover, we assessed the relationships among sonoelastography findings, muscle echotexture features, and functional performance in spastic muscle.

2. Materials and Methods

2.1. Subjects

Subjects who met the following criteria were recruited from the rehabilitation ward of a medical center: (i) male, age of >30 years, (ii) no history of cervical radiculopathy symptoms or other neurologic deficits of the upper limbs, (iii) bilateral passive elbow flexion from 0 to 145°, and (iv) more than 1 month post-stroke. Exclusion criteria were (i) botulinum toxin injection and (ii) history of upper limb surgery.
A total of 22 subjects were recruited in this study. The power analysis of this study was used by G*Power [19]. The minimal sample size was calculated by setting an alpha of 0.05, a power of 0.80, a large effect size (dz = 0.8), and two tails. Based on these assumptions, the desired sample size was 15. This study protocol was approved by the hospital research ethics committee and institutional review board (CCH IRB 061203) and written informed consent was obtained from all subjects.

2.2. Testing Position

For ultrasound imaging, subjects were placed in the supine position and instructed to relax the elbow. A low-temperature premade arm splint was used to standardize arm position and minimize muscle activity. The shoulder was placed such that the humerus was abducted at 45° and the elbow positioned at 90°.

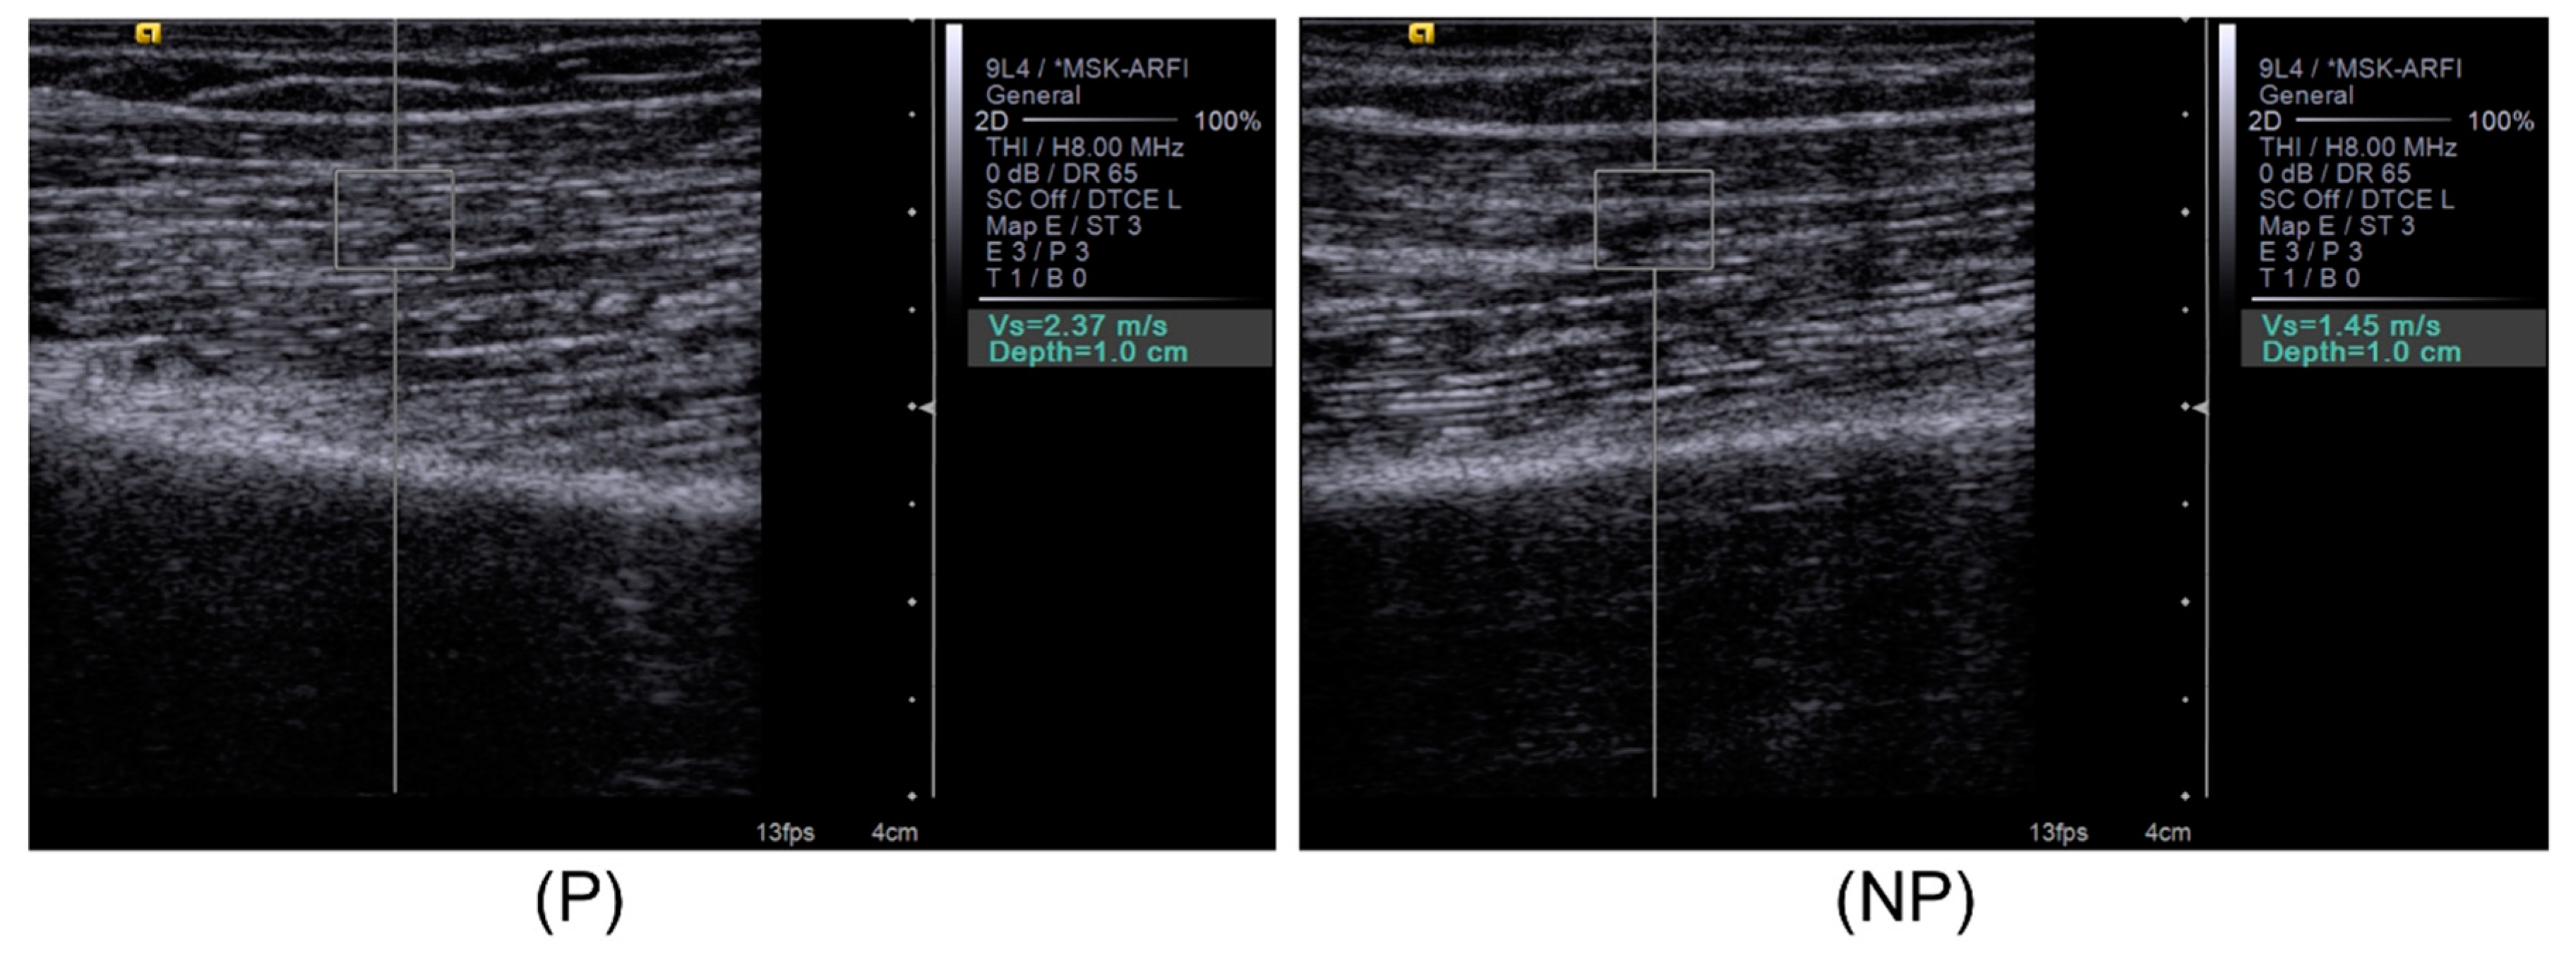
2.3. Bicep Brachii Muscle Shear Wave Velocity and Gray Scale Image Capture

The SWV values were captured from both elbows using an Acuson S2000 acoustic radiation force impulse ultrasonography system (Siemens, Munich, Germany) equipped with a 7–9 MHz linear transducer (9L4, Siemens). To avoid operator error, a rehabilitation physician with 10 years’ experience in musculoskeletal ultrasound performed all image capture. Furthermore, for proper transducer pressure during SWV acquisition, a “quality index” >80 ensures a reliable test value [20]. Biceps brachii muscle (BBM) scans were acquired by placing the transducer at two-thirds the distance from the acromion to the antecubital crease. The probe was oriented parallel to the muscle fibers to obtain SWV measurements in the longitudinal axis and rotated 90° for the transverse axis. A manufacture’s default box size (142 × 142 pixels) of the region of interest (ROI) was manually set to the mid-portion of the BBM thickness for calculating the quantitative SWV value. A 8-bit gray-scale image of the BBM was stored in a TIFF format and then cropped at the same position with equal size ROI at which the SWV measured for further image extraction of echotexture features offline (Figure 1). The SWV values and BBM gray-scale images were taken each BBM for three times in both the transverse and longitudinal planes. The mean value of SWVs of the BBM in each axis was calculated for further analysis.

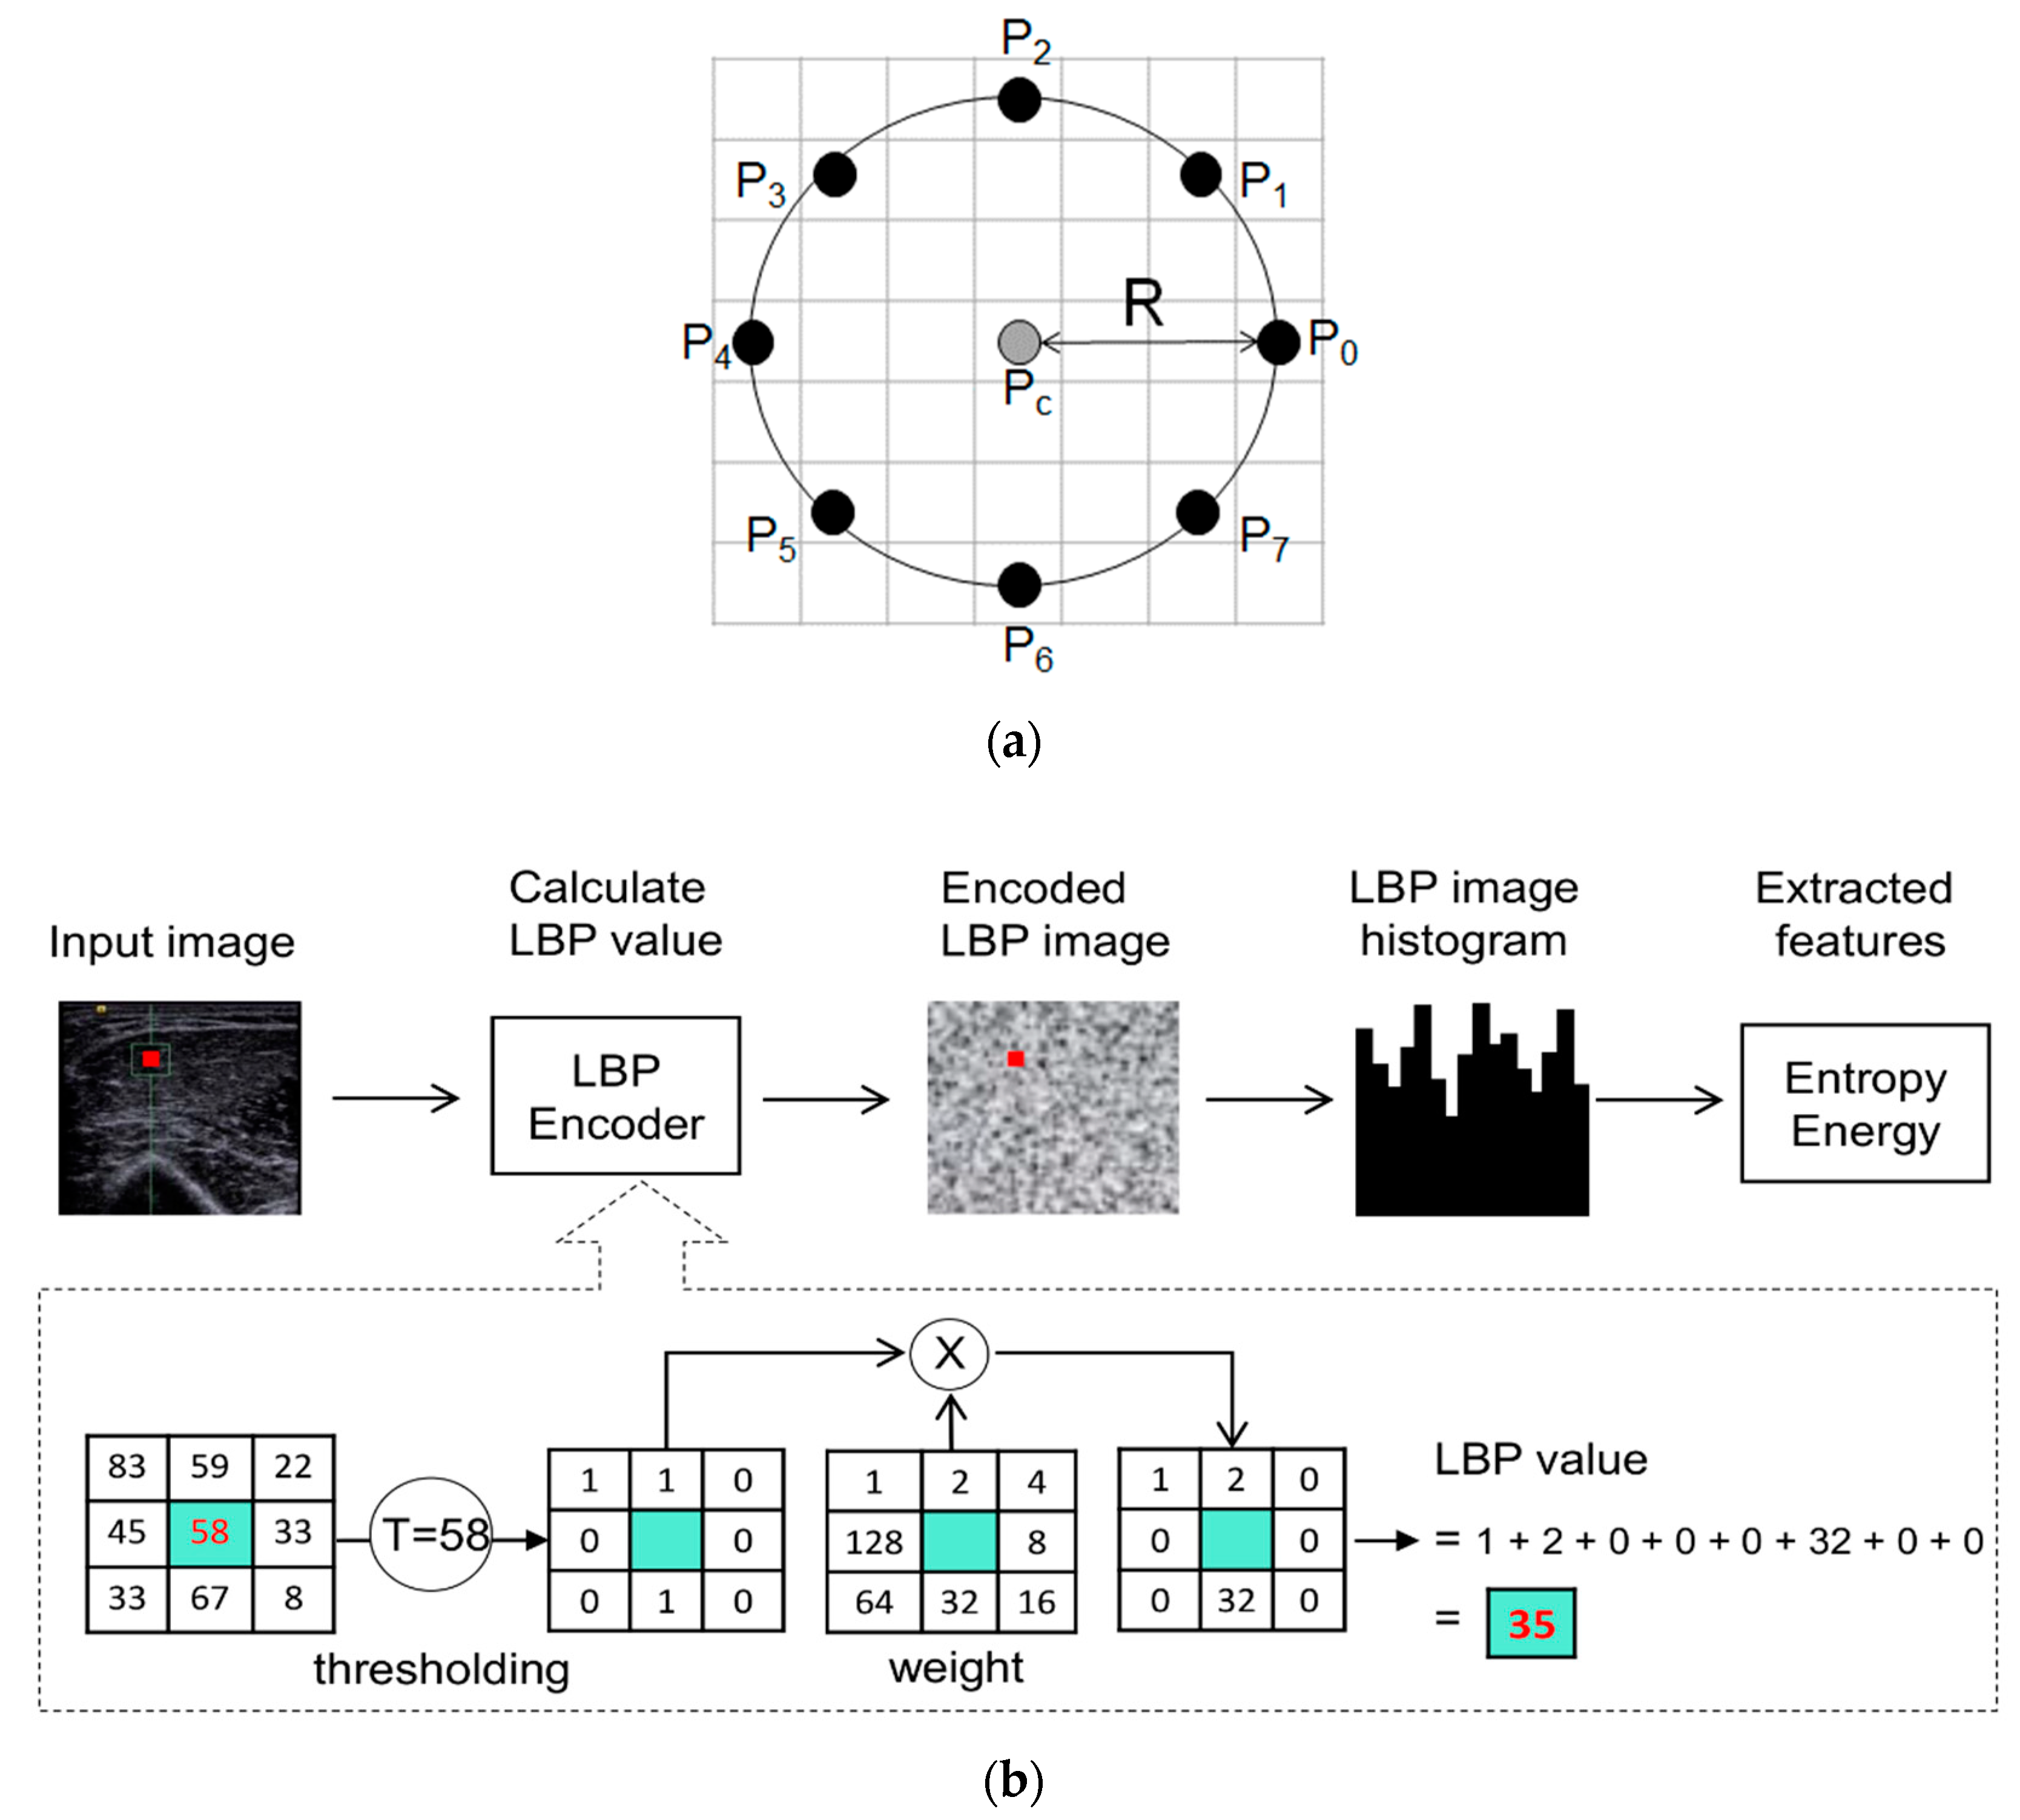
2.4. Image Processing

The local binary pattern (LBP) operator is based on the local neighborhood pixel (Pi) by comparing the intensity difference between the gray value of the central pixel (Pc) from the gray values of its circular neighborhood of radius (R). The central pixel intensity is used to be the threshold value. The neighborhood pixel is allocated binary “1”, if its intensity exceeds the threshold and binary “0”, if it is lower. This comparison produces a binary sequence from the neighborhood pixels then a unique LBP value can be defined as follows (1): [21]
LBP value = i = 0 7 ( P i P c ) · 2 i
The LBP operator converted each pixel into a new LBP value to form the LBP image. To obtain the multiscale analysis of the original image, the LBP image was constructed over three different scales, R = 1, 2, and 3 (Figure 2a). In this work, a statistical method was then used to extract the two useful features: entropy (ENT) and energy (ENG) from each LBP image. The formulas for computing ENT and ENG are as follows (2), (3):
Entropy (ENT) = −Σ (fi) × log2 (fi)
Energy (ENG) = Σ (fi)2
where (fi) is the relative occurrence frequency of the histogram derived for LBP values of all image pixels [10]. The scheme of feature extraction is shown in Figure 2b. The ENT represents the randomness of the image, whereas the ENG is the uniformity of the image in the local region. Therefore, an inhomogeneous image will reveal higher entropy and lower energy or vice versa. In total, 6 LBP features (2 features × 3 scales, namely ENT1, ENT2, ENT3, ENG1, ENG2, and ENG3) were generated per ROI. All these texture parameters were calculated by custom-written software in MATLAB (The MathWorks, Natick, MA, USA).

2.5. Assessment of Functional Performance

Elbow flexor muscle tone was graded using the Modified Ashworth Scale (MAS) [22]. The patient was in a supine position and the tested elbow joint was placed the joint in a maximally flexed position and move to a position of maximal extension over one second. Score 0 is for no increase in muscle tone, and score 4 is for rigid in extension.
Post-stroke changes in motor impairment after stroke were assessed by the Fugl–Meyer Assessment for upper extremity (FMA) [23]. The assessed domains include movement, coordination, and reflex action. The full score is 66 points. The better the performance, the higher the score.

2.6. Statistical Analysis
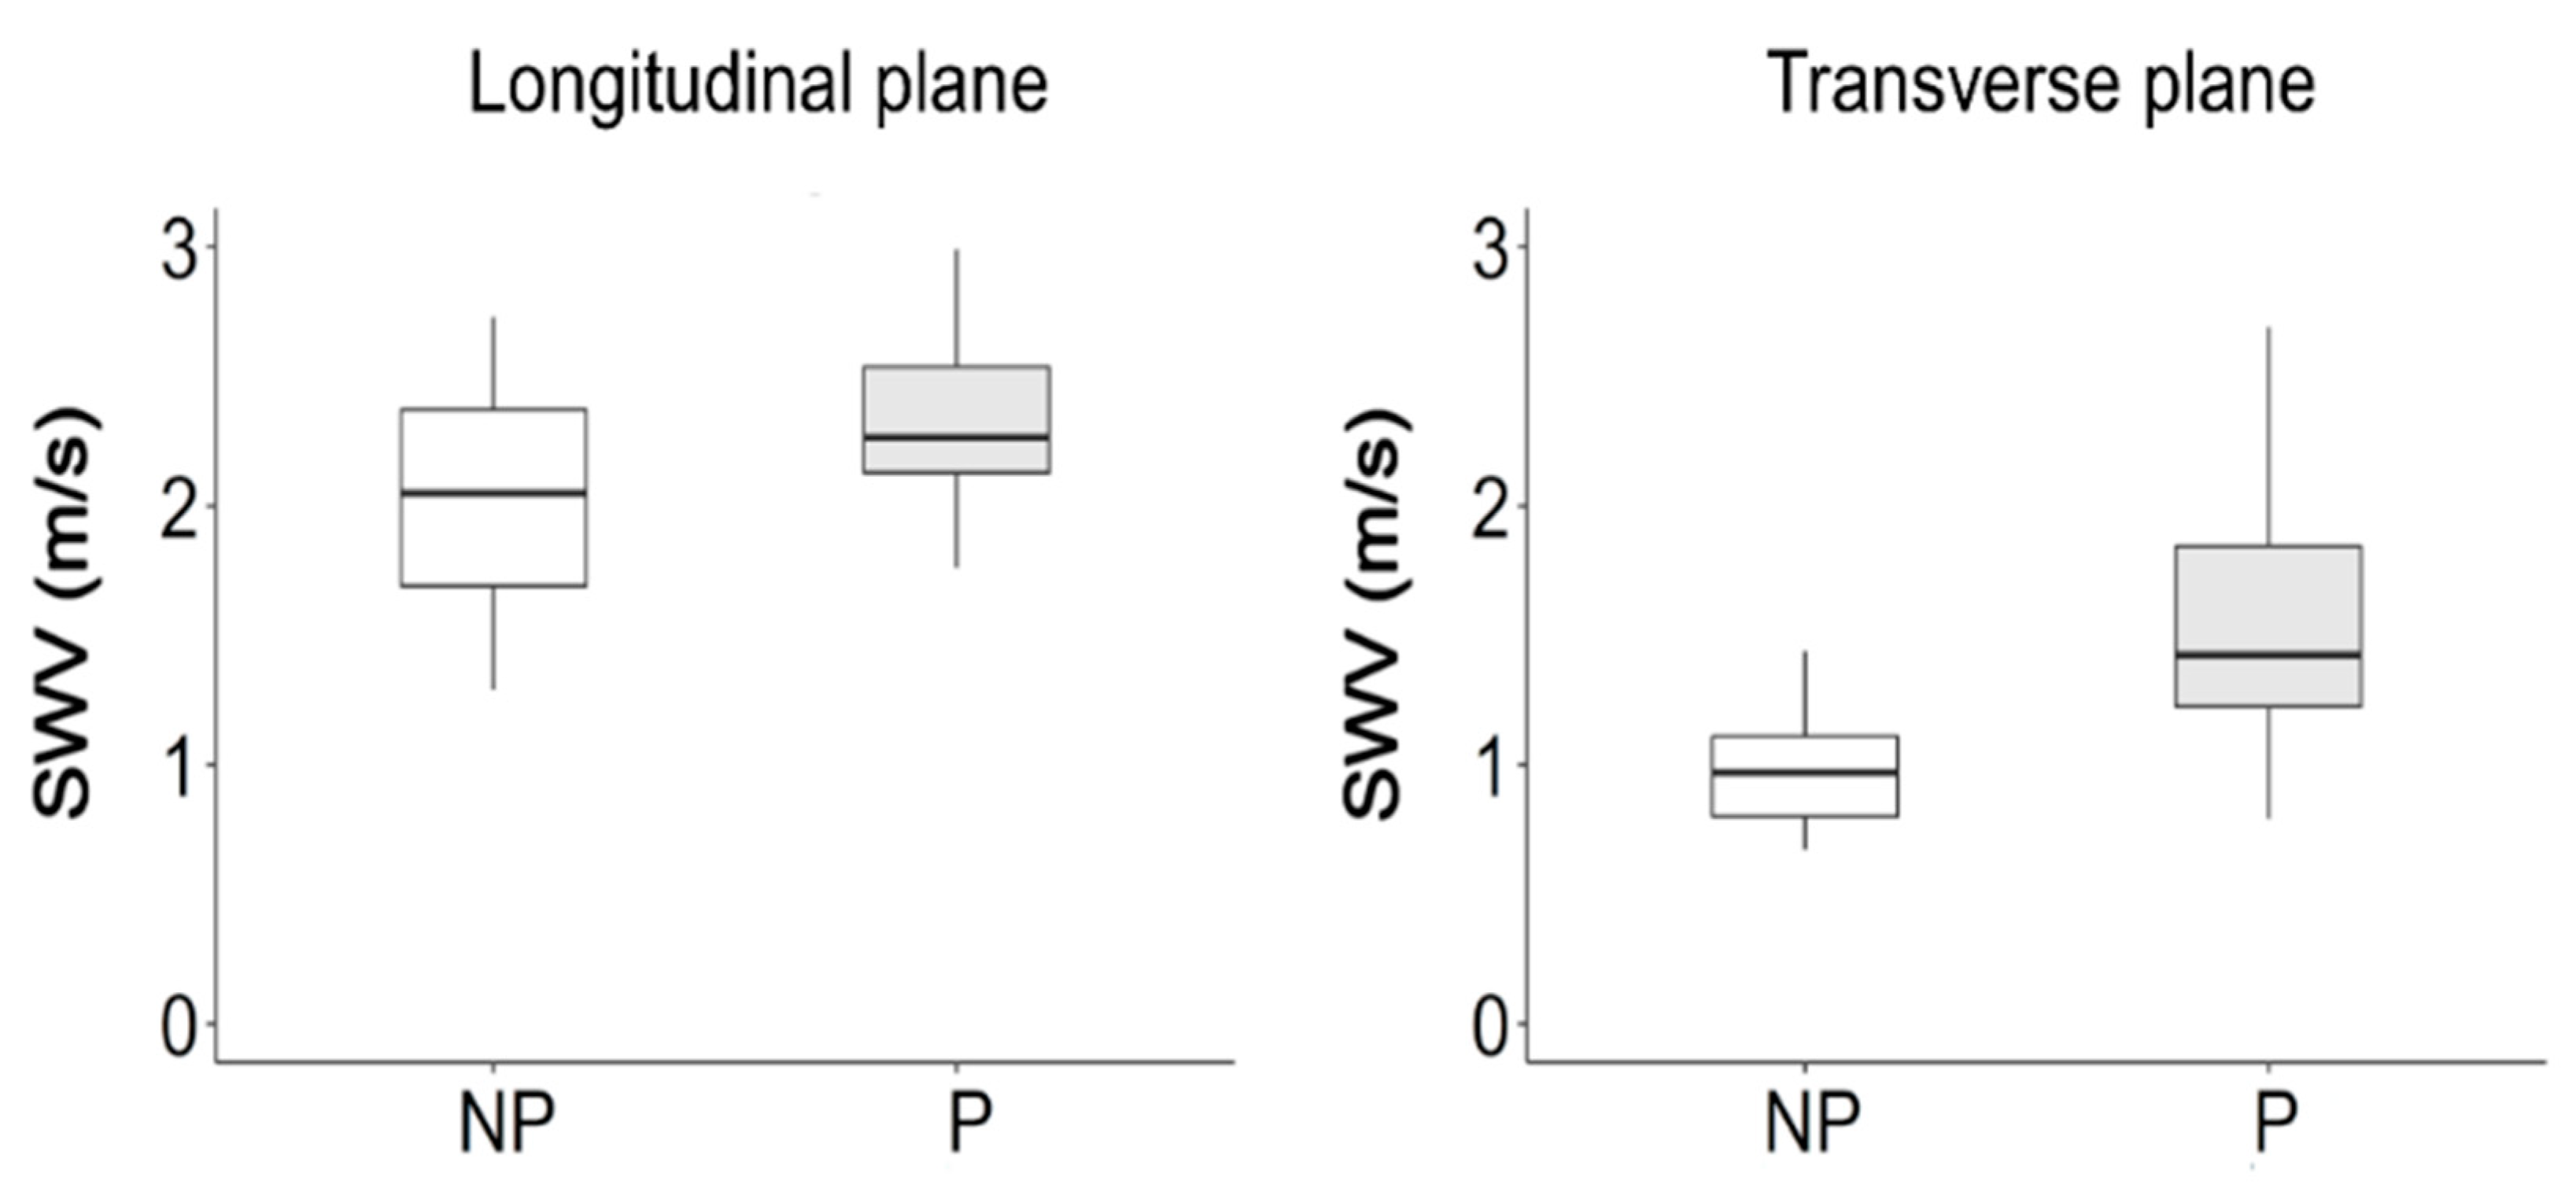
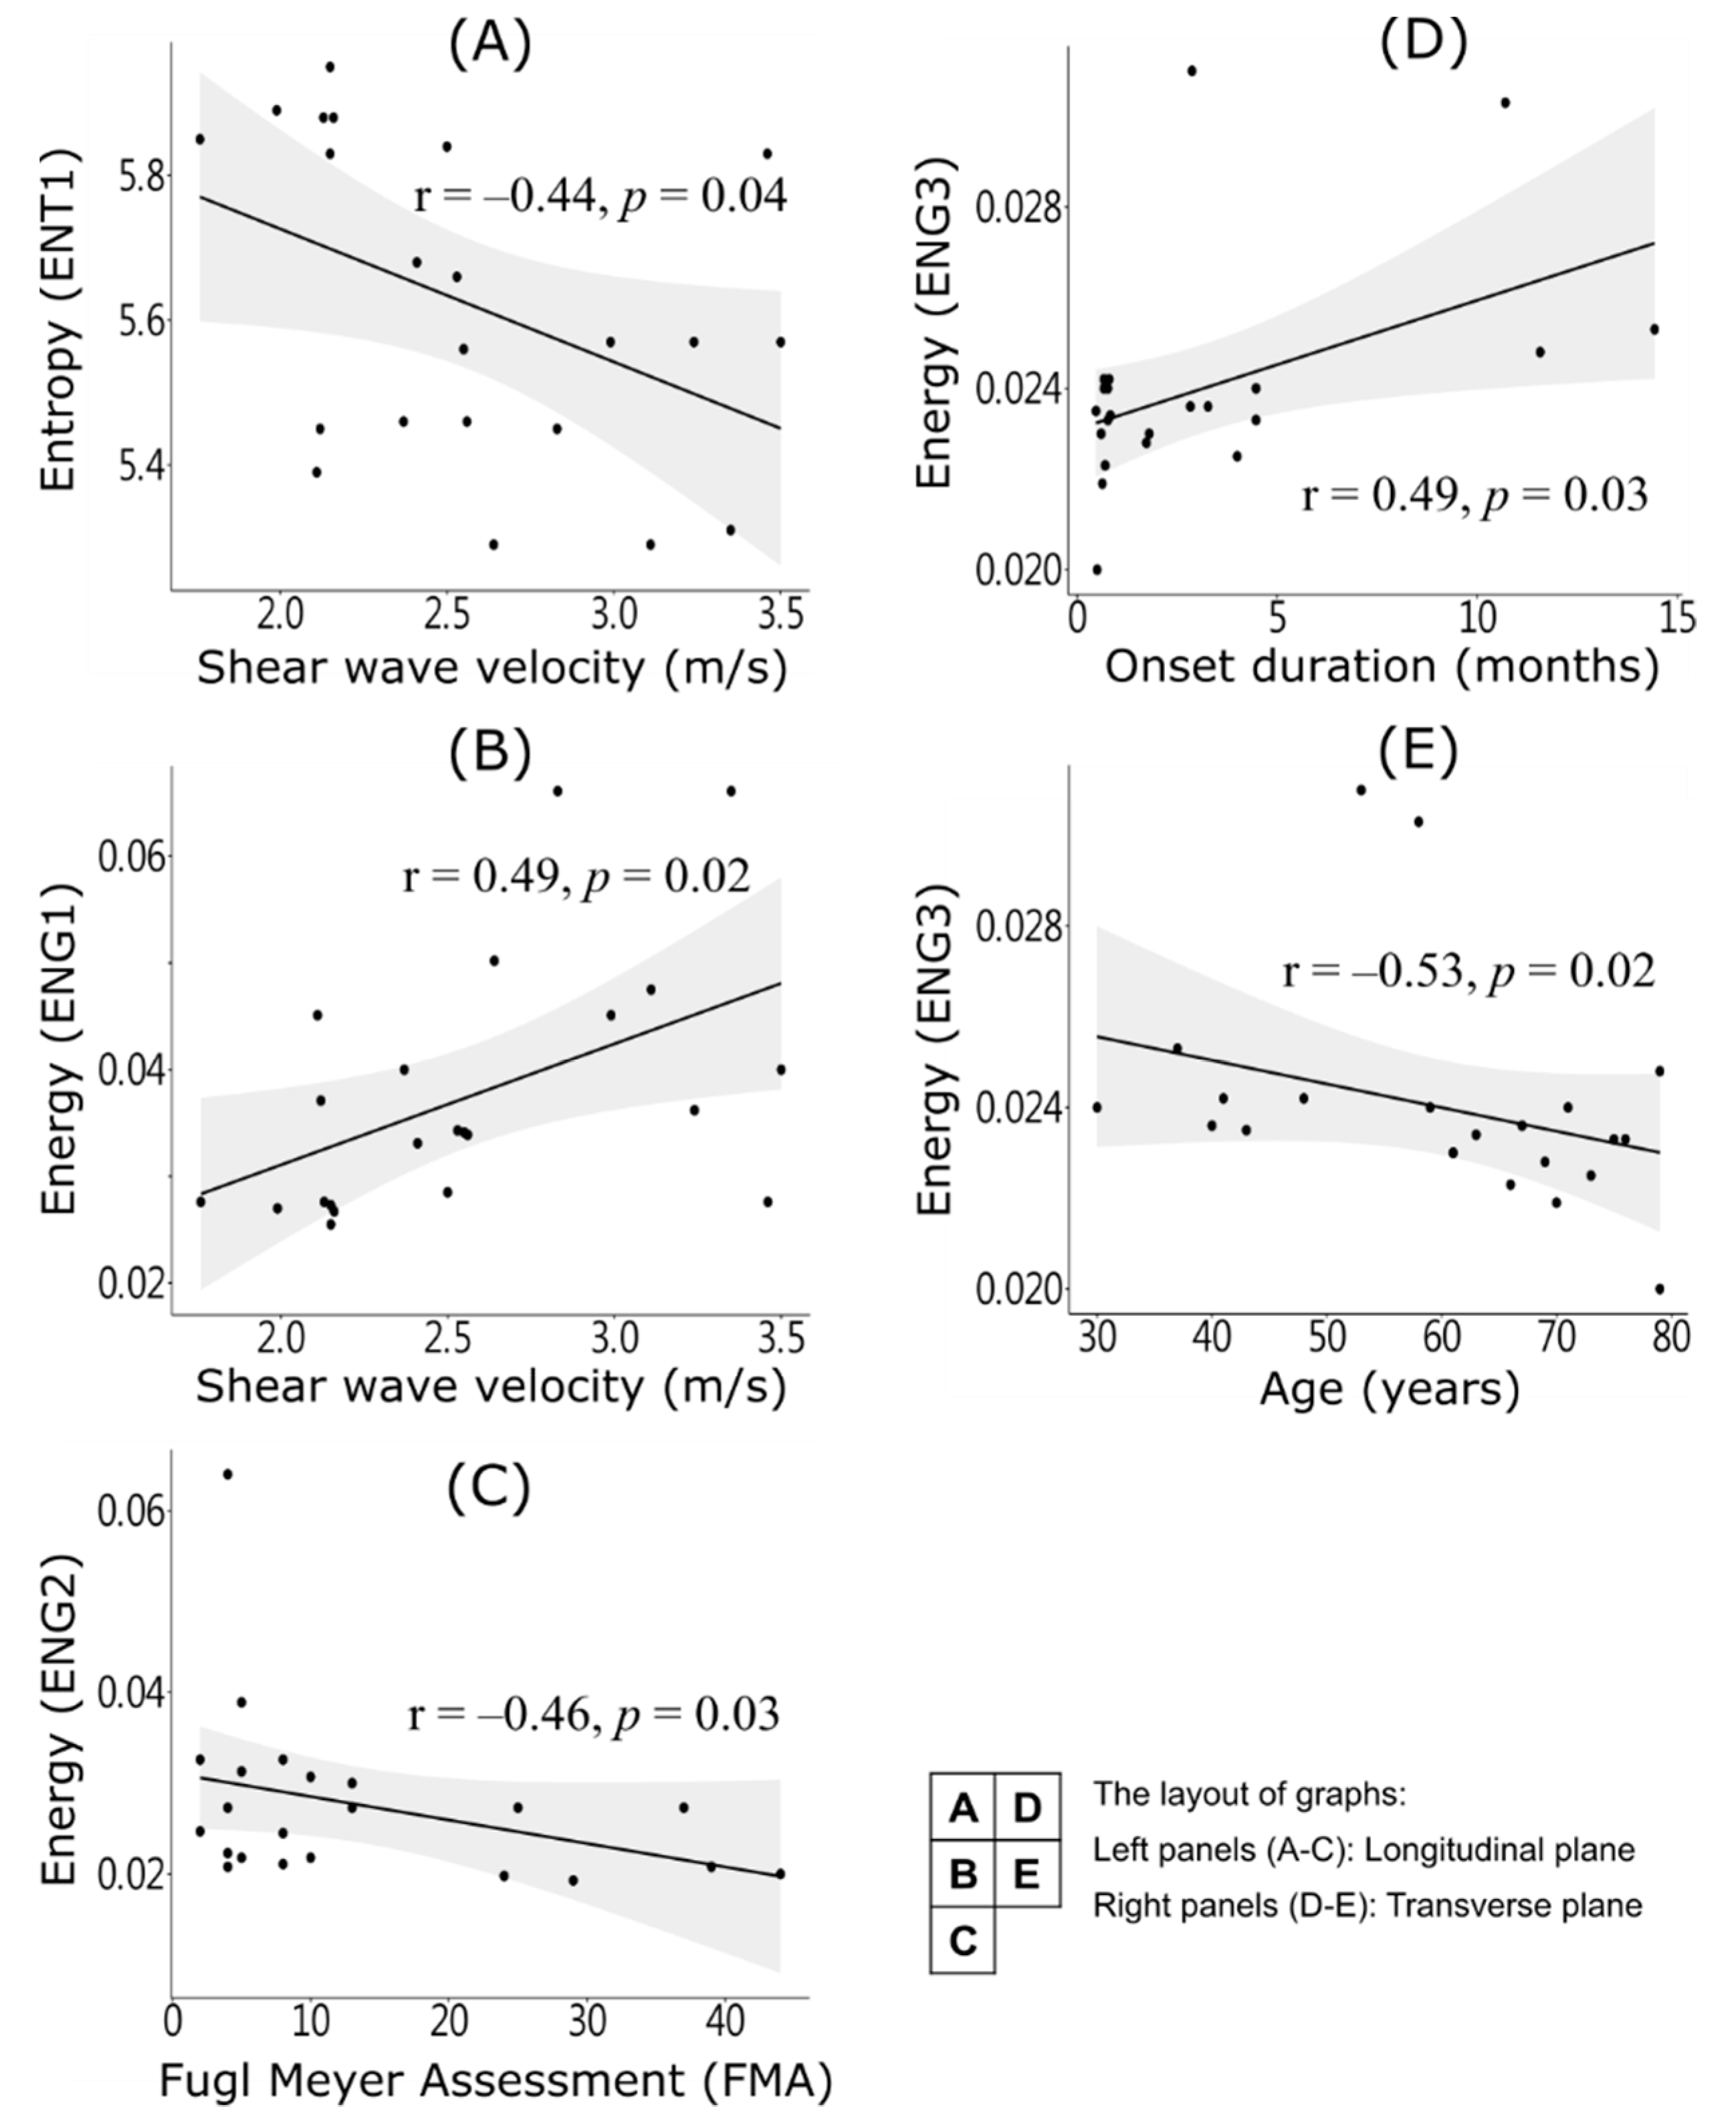
Descriptive statistics (mean, standard deviation, and range) are presented for all variables. The Wilcoxon signed-rank test was used to compare echotexture and muscle stiffness between the paretic and non-paretic BBM sides. The Spearman rank correlation coefficient was used to assess linear relationships among echotexture, muscle stiffness, and functional performance. The level of statistical significance was set at p < 0.05. Statistical analysis was performed using SPSS® v. 19 software (IBM Corp.).

3. Results

A total of 22 stroke patients with a mean age of 59.1 ± 14.6 years completed sonoelastographic BBM measurements and clinical evaluations. Patients’ demographic data and functional assessments are summarized in Table 1. Figure 3 showed that SWV was significantly faster in paretic BBM than in non-paretic BBM in the transverse and the longitudinal planes (all p values were <0.001). The overall echotexture features (ENG and ENT) were more inhomogeneous in paretic BBM than in the non-paretic BBM on both planes (Figure 4). The ENT2 (p = 0.05) was higher in paretic BBM than non-paretic BBM in the longitudinal plane. The ENT1 (p = 0.016) and ENG1 (p = 0.025) were significantly different between paretic BBM and non-paretic BBM in the transverse plane. Overall, the SWV was negatively correlated with ENT1 (r = ‒0.44, p = 0.04) and was positively correlated with ENG1 (r = 0.49, p = 0.02) in the longitudinal plane. The ENG2 was negatively correlated with FMA (r = −0.46, p = 0.03) in the longitudinal plane. The ENG3 was positively correlated with duration from stroke onset (r = 0.49, p = 0.03) and was negatively correlated with age (r = −0.53, p = 0.02) in the transverse plane. All of the correlation graphs were shown in Figure 5.

4. Discussion

After a stroke, muscle microstructures and muscle quality changed progressively. In this study, the LBP texture descriptor was used as a biomarker to differentiate echotexture features between paretic and non-paretic muscle in stroke patients. The results showed that echotexture was more inhomogeneous in the paretic muscle than in the non-paretic BBM. The features of ENT and ENG were correlated significantly with muscle stiffness (SWV), functional performance, and duration from stroke onset. The radius (R) is a factor that influences the echotexture feature extraction results. Our results demonstrate that LBP could be a considerable assessment for quantification of muscle quality change and auxiliary diagnostic aid in the evaluation of the muscle property.

4.1. In-Homogenous Muscle Texture

In the present study, we found that the LBP operator provided a quantifying method related to the differences in muscle quality between paretic and non-paretic BBM while considering the specific size of ROI and muscle scanning planes. Because the interactions of ultrasonic signals between structure and composition of soft tissue are changed post-stroke, it is quite straightforward to explain that paretic BBM shows different echotexture features than normal muscle. The spastic muscles are characterized by increased variability in the size and type of muscle fiber, decreased sarcomeres, muscle fiber morphology changes, and shortened muscle fiber length [2]. Furthermore, increased fat infiltration and an increased collagen concentration in the extracellular matrix have been reported post-stroke [17]. Increased local fibrosis or IMF may cause local changes in sound speed, density, and muscle stiffness, causing scatter in paretic muscle to exhibit higher variability. Considering these possible relations among textural features, tissue composition, and scatter distribution, the inhomogeneous echotexture in spastic BBM may indicate that localized heterogeneity causes muscle stiffness. After the stroke, prolonged immobilization and reduced extremity activity are commonly seen in stroke patients and result in muscle stiffness. The ultrasound is convenient for bedside use. Therefore, it is recommended to intervene as early as possible for monitoring muscle echotexture change and response to treatment.
In this study, we used SWV to confirm the muscle stiffness of BBM. The results showed that SWV was greater in the spastic muscle, which represented that the paretic muscle in stroke is stiffer. This result is consistent with a previous study reporting 69.5% greater muscle stiffness in stroke survivors [17].
Previous ultrasonography study also reported a strong correlation (r2 = 0.703) between muscle stiffness and echo intensity of paretic muscles [2]. This evidence showed that the interactions between muscle composition and wave reflections were changed post-stroke. It further supported that the altered muscle composition changes the muscle properties.
Texture descriptors, such as LBP and high order, have recently been used to distinguish muscle type and sex in the healthy population and those with neuromuscular disorders [10,24]. In the present study, ENT and ENG, which are powerful texture features of the LBP descriptor, were used to distinguish the echotexture features between paretic and non-paretic BBM. Because ultrasonic signals are interactions between structure and composition, pathological muscle shows different echotexture features than normal muscle. Increased local fibrosis or IMF may cause local changes in sound speed, density, and muscle stiffness, causing scatter in spastic muscle to exhibit higher variability. Considering these possible relations among textural features, tissue composition, and scatter distribution, the inhomogeneous echotexture in spastic BBM may indicate that spasticity causes localized heterogeneity.
Interestingly, ENT texture (ENT1) was negatively correlated with muscle stiffness in the longitudinal plane. Our results also showed that ENG (ENG3) texture (homogeneity) was positively correlated with time factors (duration from stroke onset) in the transverse plane. These patterns could occur because alterations in muscle quality are progressive. Tsui et al. [25] proposed a simulated model to obtain the relationship between texture inhomogeneity and the arrangement of scatters in various tissues. In a homogeneous medium, such as liver or breast, as the density of the scatter increases, increased interaction of the acoustic waves with scatter causes high ENT. By contrast, in the non-homogeneous medium such as muscle, the local variability in tissue composition is relatively high. Therefore, the local density of scatters and variability of the local amplitude of the ultrasonic signal increase, and the width of the probability distribution of the signal is reduced to result in low ENT, indicating high homogeneity. Similarly, Turo [26] found that symptomatic (active) myofascial trigger points of chronic stiff neck muscle have a more homogeneous texture (low ENT) and heterogeneous stiffness than normal muscle. A likely explanation for this finding is that sustained muscle contraction is associated with local stiffness, which could disrupt local fiber orientation. The transformation of echotexture from inhomogeneous to homogenous may thus be an indicator of the severity of spasticity or stage of abnormal muscle quality. However, we did not find correlations between echotexture and abnormal muscle tone (MAS) in our study, which may be due to the different testing protocols, i.e., echotexture was captured in a resting position, whereas MAS was measured by passive stretching of the muscle.

4.2. Fiber Orientation and Shear Wave Velocity

Normal fiber orientation is disrupted after alterations in muscle architecture and muscle quality. Our results showed that ENT in the longitudinal plane is correlated with functional performance, whereas ENG is correlated with time factors (age, duration from stroke onset) in the transverse plane. Moreover, SWV was slower in the transverse plane than in the longitudinal plane, consistent with the reports of previous studies [17,27]. These findings could be owing to the nature of muscle anisotropy, which is related to the angle between the axis of the scanning probe and fiber orientation. Therefore, in our study, echotexture was sensitive to altered muscle structure in the longitudinal plane and reflected the subject’s functional performance status. In the transverse plane, echotexture was sensitive to a more speckled appearance owing to reflections caused by increased perimysial connective tissue and IMF. Because the shear wave propagation speed is affected by the fiber orientation. Previous studies have attempted to use asymmetry of SWV with fiber orientation to determine anisotropy in muscle fibers, suggesting that disorientated fiber architecture may be a useful feature for distinguishing active myofascial trigger points [28] and Duchenne muscular dystrophy from normal muscle [7]. Although SWV is feasible for measuring spasticity, most SWV algorithms are designed assuming that soft tissues are elastic, isotropic, and locally homogeneous. However, the spastic muscle can be affected by the anisotropic nature of muscle and neural complexities. In the future, the SWV estimation algorithm should include the characteristics of echotexture, viscoelasticity, and anisotropy to simulate a more complex muscle model that could improve the accuracy of muscle stiffness.

4.3. Region of Interest (ROI) Size

ROI size is one of the key factors that determine the power of feature identification. Previous studies have reported that the amount of texture feature information increases with ROI size; however, local characteristics of the image may be lost [29]. Because the same texture can be perceived as different in distinct scales, multi-resolution analysis is often used to enhance the discriminative power of the resulting features. Our study found that a radius (R) of <3 had a better ability to discriminate spastic muscle. Similarly, Dubois et al. reported that texture indicators have less variability than gray-scale indicators tested with different sized ROIs [7]. Because LBP is computationally simple and less sensitive to changes in illumination than many descriptors, it can be combined with the multiscale descriptor to develop a method for encoding fine details. Future studies could combine LPB with multiple textural features extracted from high order texture descriptors (e.g., gray level co-occurrence matrix and Haralick) to provide an ultrasound texture-based real-time computer-aided diagnosis system for determining the mechanical properties of spastic muscles and differentiating neuromuscular diseases.

4.4. Limitations

This study is subject to several limitations. First, due to the small number of subjects, it may reduce the strength of correlation between tested variables and hinder the consistency of the significant differences between bilateral BBM in different planes and radius. In addition, a previous study reported that EI is affected by sex and muscle type, we only recruited males with stroke to prevent the influence of gray intensity. Therefore, sex, as well as age and duration from stroke onset, should be investigated in a larger population to confirm the validity of these results and their generalizability. Secondly, the histopathological assessment was not performed to confirm post-stroke muscle quality. Thirdly, electromyography was not used to monitor muscle relaxation. Fourthly, as the primary purpose of this study was to verify the usefulness of this method in stroke patients, healthy individuals were not assessed. Lastly, we did not test the repeatability of LBP echotexture analysis; however, several studies have reported that echo texture analysis is a repeatable and valid method for quantifying skeletal muscle characteristics [30]. There are still no standard test methods for assessing muscle texture. As texture factors can be influenced by system factors (ultrasonic setting and probe tilt angle) and personal factors (age, sex, muscle type, and disease type), standardized procedures are needed.

5. Conclusions

In conclusion, LBP was shown to differentiate the echotexture of spastic BBM and non-affected BBM, suggesting an association between ultrasound echotexture image and muscle stiffness. Combining quantitative echotexture biomarkers and SWV will allow improved investigation of muscle changes and assessment of therapeutic interventions.

Author Contributions

Conceptualization, writing—original draft preparation, P.-T.L.; writing—review and editing, supervision, C.T.-S.C.; Methodology, project administration, T.-S.W. All authors have read and agreed to the published version of the manuscript.

Funding

This research was funded by Changhua Christian hospital, grant number: 061203.

Acknowledgments

We would like to thank Huihua Chiang for the technical suggestion and Yujun Chang for statistical assistance.

Conflicts of Interest

The authors declare no conflict of interest.

References

  1. Maurits, N.M.; Bollen, A.E.; Windhausen, A.; De Jager, A.E.J.; Van Der Hoeven, J.H. Muscle ultrasound analysis: Normal values and differentiation between myopathies and neuropathies. Ultrasound Med. Biol. 2003, 29, 215–225. [Google Scholar] [CrossRef]
  2. Lee, S.S.; Spear, S.; Rymer, W.Z. Quantifying changes in material properties of stroke-impaired muscle. Clin. Biomech. 2015, 30, 269–275. [Google Scholar] [CrossRef]
  3. Fridén, J.; Lieber, R.L. Spastic muscle cells are shorter and stiffer than normal cells. Muscle Nerve 2003, 27, 157–164. [Google Scholar] [CrossRef] [PubMed]
  4. Li, L.; Tong, K.Y.; Hu, X. The Effect of Poststroke Impairments on Brachialis Muscle Architecture as Measured by Ultrasound. Arch. Phys. Med. Rehabil. 2007, 88, 243–250. [Google Scholar] [CrossRef] [PubMed]
  5. Khoury, V.; Cardinal, É.; Brassard, P. Atrophy and Fatty Infiltration of the Supraspinatus Muscle: Sonography Versus MRI. Am. J. Roentgenol. 2008, 190, 1105–1111. [Google Scholar] [CrossRef] [PubMed] [Green Version]
  6. Pillen, S.; Tak, R.O.; Zwarts, M.J.; Lammens, M.M.; Verrijp, K.N.; Arts, I.M.; Van Der Laak, J.A.; Hoogerbrugge, P.M.; Van Engelen, B.G.; Verrips, A. Skeletal Muscle Ultrasound: Correlation Between Fibrous Tissue and Echo Intensity. Ultrasound Med. Biol. 2009, 35, 443–446. [Google Scholar] [CrossRef] [PubMed]
  7. Dubois, G.J.; Bachasson, D.; Lacourpaille, L.; Benveniste, O.; Hogrel, J. Local Texture Anisotropy as an Estimate of Muscle Quality in Ultrasound Imaging. Ultrasound Med. Biol. 2018, 44, 1133–1140. [Google Scholar] [CrossRef] [PubMed]
  8. König, T.; Steffen, J.; Rak, M.; Neumann, G.; Von Rohden, L.; Tönnies, K.D. Ultrasound texture-based CAD system for detecting neuromuscular diseases. Int. J. Comput. Assist. Radiol. Surg. 2014, 10, 1493–1503. [Google Scholar] [CrossRef] [PubMed]
  9. Martínez-Payá, J.J.; Ríos-Díaz, J.; Tembl-Ferrairó, J.I.; Vázquez-Costa, J.F.; Del Baño-Aledo, M.E.; Medina-Mirapeix, F. Quantitative Muscle Ultrasonography Using Textural Analysis in Amyotrophic Lateral Sclerosis. Ultrason. Imaging 2017, 39, 357–368. [Google Scholar] [CrossRef]
  10. Molinari, F.; Caresio, C.; Acharya, U.R.; Mookiah, M.R.K.; Minetto, M.A. Advances in Quantitative Muscle Ultrasonography Using Texture Analysis of Ultrasound Images. Ultrasound Med. Biol. 2015, 41, 2520–2532. [Google Scholar] [CrossRef]
  11. Sogawa, K.; Nodera, H.; Takamatsu, N.; Mori, A.; Yamazaki, H.; Shimatani, Y.; Izumi, Y.; Kaji, R. Neurogenic and Myogenic Diseases: Quantitative Texture Analysis of Muscle US Data for Differentiation. Radiology 2017, 283, 492–498. [Google Scholar] [CrossRef] [PubMed]
  12. Acharya, U.R.; Faust, O.; Molinari, F.; Sree, S.V.; Junnarkar, S.P.; Sudarshan, V. Ultrasound-based tissue characterization and classification of fatty liver disease: A screening and diagnostic paradigm. Knowl. Based Syst. 2015, 75, 66–77. [Google Scholar] [CrossRef]
  13. Acharya, U.R.; Sree, S.V.; Krishnan, M.M.R.; Molinari, F.; Saba, L.; Ho, S.Y.S.; Ahuja, A.T.; Ho, S.C.; Nicolaides, A.; Suri, J.S. Atherosclerotic Risk Stratification Strategy for Carotid Arteries Using Texture-Based Features. Ultrasound Med. Biol. 2012, 38, 899–915. [Google Scholar] [CrossRef] [PubMed]
  14. Abdel-Nasser, M.; Melendez, J.; Moreno, A.; Omer, O.A.; Puig, D. Breast tumor classification in ultrasound images using texture analysis and super-resolution methods. Eng. Appl. Artif. Intell. 2017, 59, 84–92. [Google Scholar] [CrossRef]
  15. Hirvasniemi, J.; Thevenot, J.; Immonen, V.; Liikavainio, T.; Pulkkinen, P.; Jämsä, T.; Arokoski, J.; Saarakkala, S. Quantification of differences in bone texture from plain radiographs in knees with and without osteoarthritis. Osteoarthr. Cartil. 2014, 22, 1724–1731. [Google Scholar] [CrossRef] [PubMed] [Green Version]
  16. Gao, J.; He, W.; Du, L.-J.; Chen, J.; Park, D.; Wells, M.; Fowlkes, J.B.; O’Dell, M. Quantitative Ultrasound Imaging to Assess the Biceps Brachii Muscle in Chronic Post-Stroke Spasticity: Preliminary Observation. Ultrasound Med. Biol. 2018, 44, 1931–1940. [Google Scholar] [CrossRef] [PubMed] [Green Version]
  17. Wu, C.-H.; Ho, Y.-C.; Hsiao, M.-Y.; Chen, W.-S.; Wang, T.-G. Evaluation of Post-Stroke Spastic Muscle Stiffness Using Shear Wave Ultrasound Elastography. Ultrasound Med. Biol. 2017, 43, 1105–1111. [Google Scholar] [CrossRef]
  18. Abouelkaram, S.; Suchorski, K.; Buquet, B.; Berge, P.; Culioli, J.; Delachartre, P.; Basset, O. Effects of muscle texture on ultrasonic measurements. Food Chem. 2000, 69, 447–455. [Google Scholar] [CrossRef]
  19. Faul, F.; Erdfelder, E.; Lang, A.-G.; Buchner, A. G*Power 3: A flexible statistical power analysis program for the social, behavioral, and biomedical sciences. Behav. Res. Methods 2007, 39, 175–191. [Google Scholar] [CrossRef]
  20. Wu, C.-H.; Chen, W.-S.; Park, G.-Y.; Wang, T.-G.; Lew, H.L. Musculoskeletal Sonoelastography: A Focused Review of its Diagnostic Applications for Evaluating Tendons and Fascia. J. Med. Ultrasound 2012, 20, 79–86. [Google Scholar] [CrossRef] [Green Version]
  21. Ojala, T.; Pietikäinen, M.; Harwood, D. A comparative study of texture measures with classification based on featured distributions. Pattern Recognit. 1996, 29, 51–59. [Google Scholar] [CrossRef]
  22. Bohannon, R.W.; Smith, M.B. Interrater Reliability of a Modified Ashworth Scale of Muscle Spasticity. Phys. Ther. 1987, 67, 206–207. [Google Scholar] [CrossRef] [PubMed]
  23. Fugl-Meyer, A.R.; Jääskö, L.; Leyman, I.; Olsson, S.; Steglind, S. The post-stroke hemiplegic patient. 1. a method for evaluation of physical performance. Scand. J. Rehabil. Med. 1975, 7, 13–31. [Google Scholar] [PubMed]
  24. Pillen, S.; Van Alfen, N. Skeletal muscle ultrasound. Neurol. Res. 2011, 33, 1016–1024. [Google Scholar] [CrossRef] [Green Version]
  25. Tsui, P.-H. Ultrasound Detection of Scatterer Concentration by Weighted Entropy. Entropy 2015, 17, 6598–6616. [Google Scholar] [CrossRef] [Green Version]
  26. Turo, D.; Otto, P.; Shah, J.P.; Heimur, J.; Gebreab, T.; Zaazhoa, M.; Armstrong, K.; Gerber, L.H.; Sikdar, S. Ultrasonic Characterization of the Upper Trapezius Muscle in Patients with Chronic Neck Pain. Ultrason. Imaging 2013, 35, 173–187. [Google Scholar] [CrossRef] [Green Version]
  27. Gennisson, J.; Deffieux, T.; Mace, E.; Montaldo, G.; Fink, M.; Tanter, M. Viscoelastic and Anisotropic Mechanical Properties of in vivo Muscle Tissue Assessed by Supersonic Shear Imaging. Ultrasound Med. Biol. 2010, 36, 789–801. [Google Scholar] [CrossRef]
  28. Bird, M.; Le, D.; Shah, J.; Gerber, L.; Tandon, H.; DeStefano, S.; Sikdar, S. Characterization of local muscle fiber anisotropy using shear wave elastography in patients with chronic myofascial pain. In Proceedings of the 2017 IEEE International Ultrasonics Symposium IUS, Washington, DC, USA, 6–9 September 2017; pp. 1–4. [Google Scholar]
  29. Liu, L.; Fieguth, P.; Guo, Y.; Wang, X.; Pietikäinen, M. Local binary features for texture classification: Taxonomy and experimental study. Pattern Recognit. 2017, 62, 135–160. [Google Scholar] [CrossRef] [Green Version]
  30. Júnior, N.D.S.P.; Matta, T.T.; Alvarenga, A.V.; Pereira, W.C.D.A.; De Oliveira, L.F. Reliability of ultrasound texture measures of Biceps Brachialis and Gastrocnemius Lateralis muscles’ images. Clin. Physiol. Funct. Imaging 2015, 37, 84–88. [Google Scholar] [CrossRef]
Figure 1. Measurement of shear wave velocity (SWV) in the bilateral biceps brachii muscles (BBM) of a 76-year-old male at 1 month post-hemorrhagic stroke. SWV of paretic (P) BBM (2.37 m/s) was higher than that of non-paretic (NP) BBM (1.45 m/s) in the longitudinal plane.
Applsci 11 00011 g001
Figure 2. (a) Central pixel (Pc) and its P circularity neighbors (P1–P7) with radius R (R = 1, 2, 3); (b) Schematic representation of the computation of echotexture feature extraction using the local binary pattern.
Applsci 11 00011 g002
Figure 3. Box-and-whisker plots of shear wave velocity (SWV). The results reveal differences in SWV of the biceps brachii muscle (BBM) between the paretic (P) and non-paretic (NP) arm in the longitudinal and transverse planes. All SWVs of P BBM were significantly higher than of NP BBM in both planes (all p values < 0.001).
Applsci 11 00011 g003
Figure 4. The local binary pattern (LBP) features with multiscale analysis. The entropy (ENT) and energy (ENG) of the LBP were extracted by the different radius (R = 1, 2, 3) and compared between paretic (P) and non-paretic (NP) biceps brachii muscle in the longitudinal and transverse planes.
Applsci 11 00011 g004
Figure 5. Relationships between muscle stiffness, echotexture features, functional performance, age and onset duration in the longitudinal plane (left panels: AC) and transverse plane (right panels: D,E).
Applsci 11 00011 g005
Table 1. Demographic and clinical data of all subjects.
VariablesValueRange
Hemiplegic type (hemorrhage/infraction)5/17
Hemiplegic side (L/R)12/10
MAS
03
18
210
31
Age (years)59.1 ± 14.6(30–79)
Body height (cm)163.9 ± 7.2(149–179)
Body weight (kg)66.6 ± 8.8(50–83)
Duration from stroke onset (months)3.2 ± 4.0(0.47–14.43)
FMA18.1 ± 14.8(2–44)
Data show the number of patients or mean ± standard deviation. MAS: Modified Ashworth Scale, FMA: Fugl–Meyer assessment.
Publisher’s Note: MDPI stays neutral with regard to jurisdictional claims in published maps and institutional affiliations.

