Article

Organizational Factors That Drive to BIM Effectiveness: Technological Learning, Collaborative Culture, and Senior Management Support

by
Francisco Villena-Manzanares
1,*,
Tatiana García-Segura
2 and
Eugenio Pellicer
2
1
Design Engineering Department, Polytechnic School, University of Seville, 41011 Sevilla, Spain
2
Construction Project Management Research Group, School of Civil Engineering, Universitat Politècnica de València, 46022 València, Spain
*
Author to whom correspondence should be addressed.
Appl. Sci. 2021, 11(1), 199; https://doi.org/10.3390/app11010199
Submission received: 15 November 2020 / Revised: 3 December 2020 / Accepted: 17 December 2020 / Published: 28 December 2020
(This article belongs to the Special Issue Building Information Modelling (BIM): From Theories to Practices)

Abstract

:
Senior management support is a key dynamic capacity for design companies in the architecture, engineering, and construction (AEC) industry, given the fact that they must identify changes in the competitive environment, which are increasingly becoming more and more technological. In addition, senior management support is obliged to react in the most efficient and effective way. Currently, the project design teams that have adopted building information modeling (BIM) are subject to constant changes in the technological environment, of which the activity is influenced by the behavior of senior management support. This research focuses on this issue by analyzing the role played by the variables of technological learning, collaborative culture, and support provided by senior management as precedents of BIM technology effectiveness. The data set has been obtained from 92 AEC companies in Spain. Using partial least squares (PLS), this research finds evidence of the previously mentioned relationships and the existence of partial mediation effects generated by technological learning and collaborative culture within the support of senior management in BIM technology effectiveness. In addition, this model achieves an appropriate level of predictive validation to explain BIM technology effectiveness in engineering project designs. The results highlight that senior management support needs to promote a technological learning and collaborative culture to improve the technological capabilities. The contribution and original value of the paper is to provide empirical evidence that the effectiveness of BIM factors in project design teams is influenced by the behavior of top management support.

1. Introduction

Design teams in the architecture, engineering, and construction (AEC henceforth) industry are subjected to highly dynamic, complex environments with technological uncertainty [1,2]. Technological advances have led certain companies in the construction industry to adopt and use building information modeling (BIM) technologies in the design of infrastructure projects [3,4], for both the vertical (buildings) and the horizontal (linear) infrastructure industries, such as roads, bridges, and pipelines.
The technology acceptance model (TAM) is one of the most effective and widely used theoretical frameworks for information systems to predict how it is accepted by users in different organizations [5,6,7,8]. The TAM studies the relationship between perceived utility, perceived ease of use, and future use of technology from a technology-user point of view. The TAM explains that user satisfaction is key to new technology adoption. Several studies have chosen the TAM in order to explain the acceptance of BIM in countries such as Korea [9,10], China [11], Ghana [12], United Kingdom [13], and Peru [14]. The BIM adoption has significantly increased around the globe, particularly in developed countries, over the past years [15].
Among the BIM benefits, the following are highlighted: (1) improving the effectiveness and accuracy of existing conditions’ documentation [16]; (2) simplifying design reviews leading to a sustainable design [17]; (3) enhancing energy efficiency [3]; (4) resolving design clashes earlier through visualizing the model [18]; and (5) enabling a faster and more accurate cost estimation [17]”.
Nowadays, design projects in Spain are slowly and gradually starting to use BIM technology despite technological barriers not having been overcome by many companies in the AEC sector [19]. The main barriers that impede BIM technology acceptance are as follows: legal and intellectual property issues [20], cultural reasons and resistance to change [21], lack of the collaboration between those involved in the projects [22], lack of training [23], and problems with software and hardware [24]. Therefore, BIM acceptance and adoption is a complex phenomenon, affected by multiple industry-specific variables and remains an unsolved issue [25]. The literature evidences that AEC companies who adopt BIM improve their final project design, making them more competitive [3,4,15]. This study is focused on AEC companies who design projects with BIM as well as assessing how certain organizational factors can influence BIM effectiveness. The purpose is to provide empirical evidence that the effectiveness of BIM in project design teams is influenced by organizational cultures fostered by top management support.
In this regard, this study focuses on assessing the organizational factors that could influence BIM technology effectiveness in AEC companies. The technological capabilities are abilities required for the effective use of technological knowledge [26]. BIM is a tool for designing projects with different technological capabilities: virtual vision (3D), planning (4D), costs (5D), energy simulation (6D), and facility maintenance (7D). BIM is a technology that allows the integration of project information. AEC companies that carry out projects with BIM use it for different purposes. On the other hand, effectiveness is the ability to achieve the desired result. Therefore, in this research, the effectiveness of BIM is defined as the ability to properly use BIM by project teams for the objectives set.
In this study, the term “team members” refers to the company staff who work with BIM technology, and the term “project agents” includes the participants in the project who can use BIM information.
Key organizational factors included in this study are as follows: support offered by senior management, collaborative culture fostered by senior management and the encouragement of technological learning, and factors relating to the application of BIM methodology. This way, senior management in different companies who have adopted BIM technology show that, by encouraging certain organizational factors, it is possible to improve BIM technology effectiveness in engineering project designs. More specifically, this study aims to provide answers to the following research questions for companies that have adopted BIM:
(1)
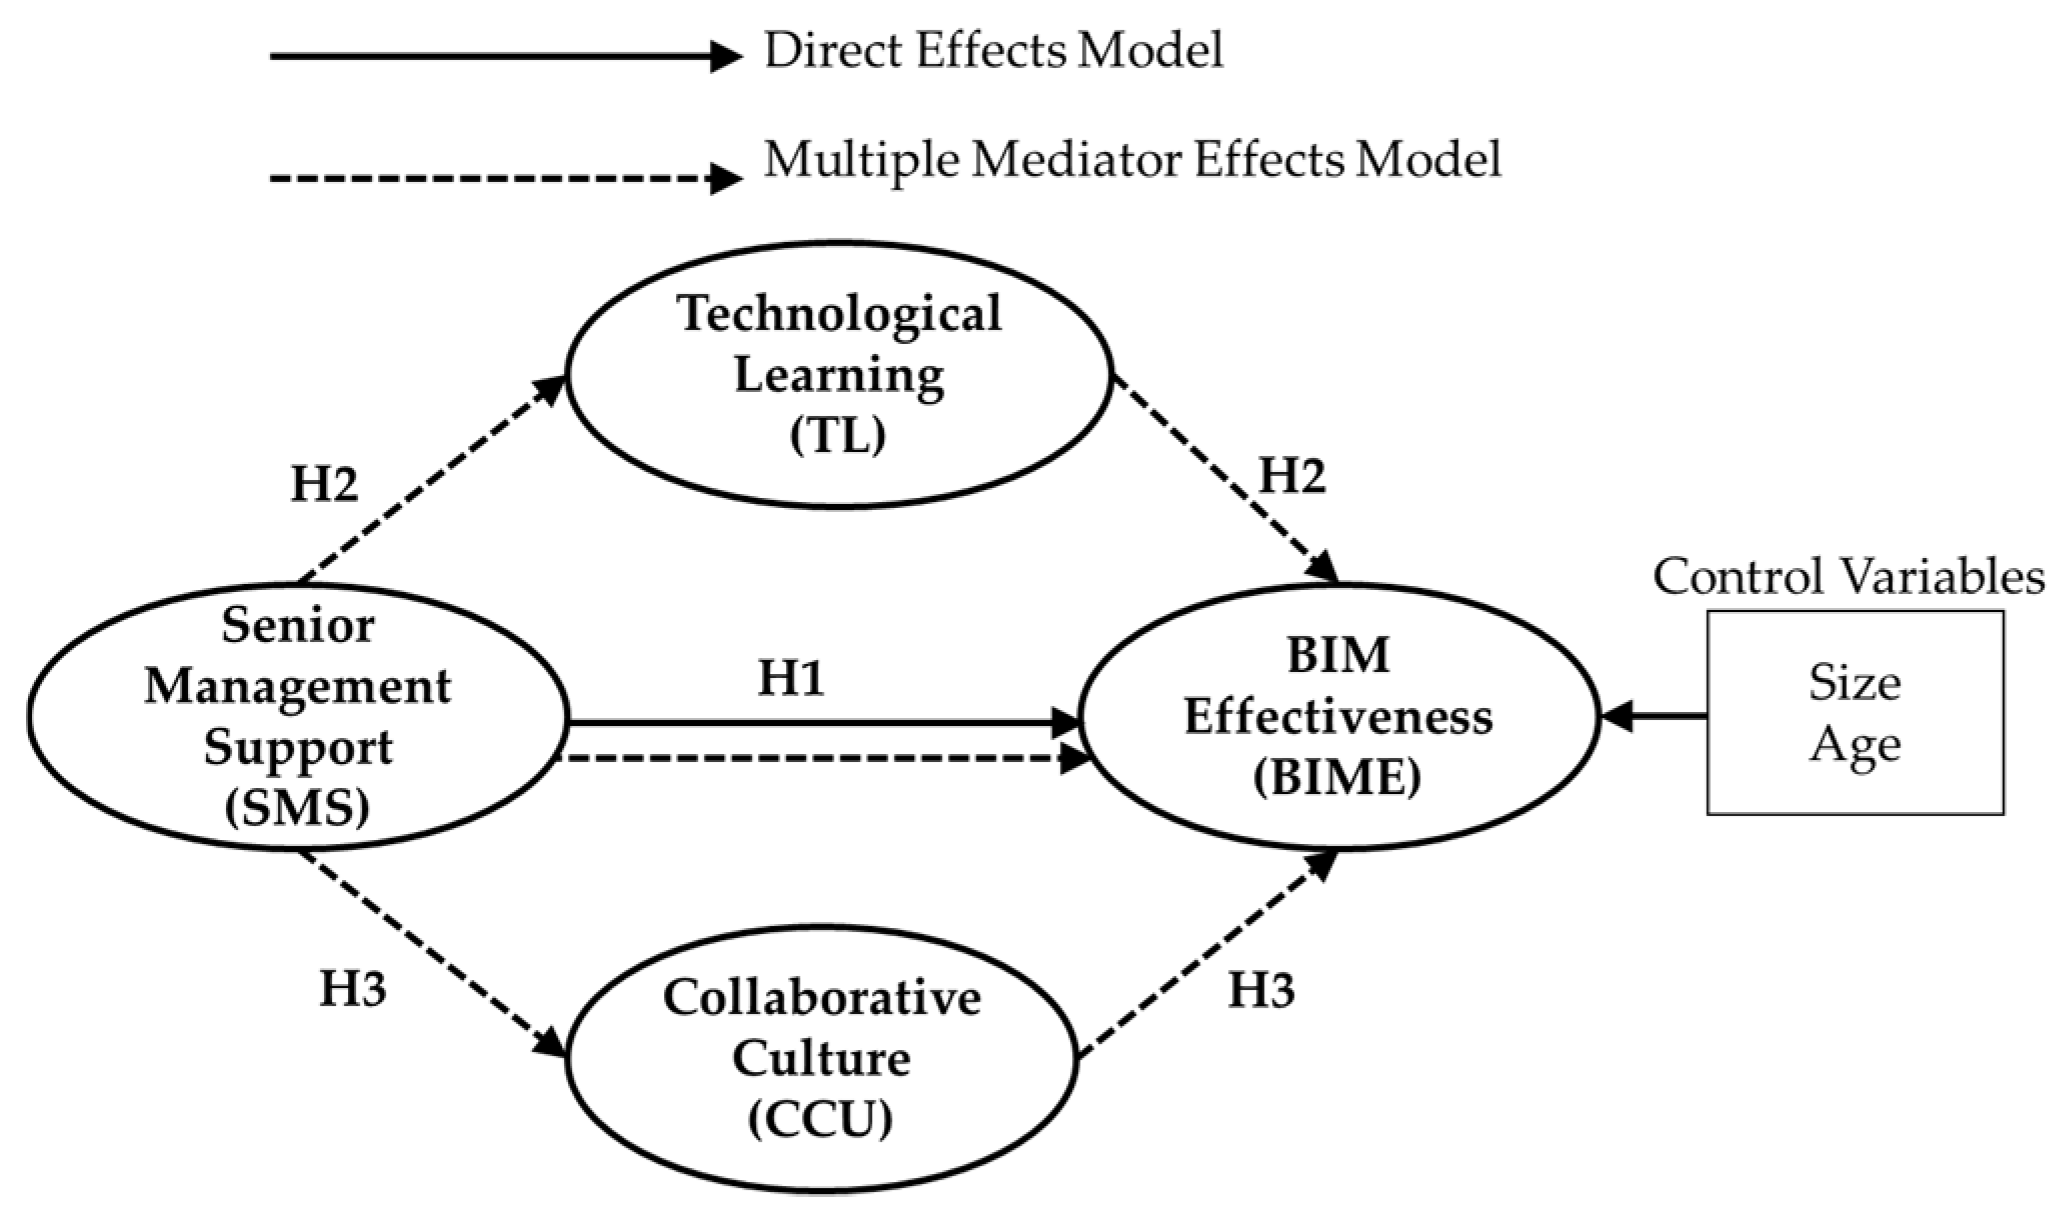
What are the links between senior management support, collaborative culture, technological learning, and BIM technology effectiveness?
(2)
How does senior management support influence BIM technology effectiveness in the presence of relationships between the aforementioned variables?
Therefore, the goal of this research is to examine the impact that certain organizational factors, encouraged by senior management, have on BIM effectiveness in AEC companies who design their projects with BIM. In order to achieve this goal, Section 2 shows a review of the theory as well as the research model and the hypotheses raised. The next section includes a description of the research methodology, followed by data analysis performance results and the discussion of the results. The final section explains the conclusions, including contributions, limitations, and future research.

2. Literature Review and Research Hypotheses

2.1. BIM: Barriers and Factors

BIM is a design tool that enables the process of editing, creating and using digital models for design, construction, and maintenance of infrastructure projects throughout their whole life cycle [15,27]. BIM is not only a 3D digital representation of project designs, but also provides a lot of information about the model itself, such as the amount of needed material, cost estimates, and energy simulations. In addition, the coordination of BIM design connects with different disciplines (structures, facilities, energy efficiency, health and safety, etc.) through the industry foundation classes (IFC) information standard. In BIM, the IFC serves as a data exchange format between agents, processes, and applications, which is defined by the ISO 16739:2013 Standard. The IFC is a particular data format that allows the exchange of an informational model without loss or distortion of data or information. It is an open, neutral format, which is not controlled by software producers, and planned to facilitate interoperability between various operators [28]. The IFC has been designed to produce all the information about the project.
Therefore, the large amounts of information found in construction information models can be used for several purposes [29]. The potential application of BIM occurs throughout all phases of the infrastructure life cycle, so experience is key in these phases and also for further modifications and improvements of the model. Therefore, technological learning perception and experience using BIM are vital skills [30], because BIM experience contributes to a higher knowledge assimilation, through technological learning.
There are a number of contributions regarding the adoption and implementation of BIM [21,22,31,32]. These studies are important in order to represent the adoption of BIM in different phases of the project, as well as diverse countries. The existing technological barriers have been investigated with the general objective of identifying strategies to increase their adoption [1,2]. Several studies analyze BIM as an information system and have focused on assessing user satisfaction [33,34]. It is generally accepted that BIM is a technological tool and is needed so as to improve competitiveness while adding value to companies [3,4].
The theoretical framework of BIM aims to promote the understanding of this technology in the AEC sector. To be able to do this, BIM is analyzed by different research models from many different perspectives. In general, BIM is recognized as an effective tool to eliminate design errors and reduce cost and time [31,32]. Nevertheless, from a technological standpoint, some contextual organizational factors, equally or even more relevant than its actual adoption, have been neglected when researching BIM. As pointed out [10,35], there are few studies that promote the understanding of the technologies through variables of an organizational nature.
In addition, the literature revealed that barriers in BIM adoption are as follows: (1) a deficiency of capital, BIM benefits not outweighing implementation costs, unwillingness to start new workflows, and BIM being too risky from a liability perspective [36]; (2) the lack of client interest, insufficient expertise, lack of training, and unavailability of standardized tools, protocols, and issues related to data ownership [37]; (3) cultural resistance, longer processes, high investment costs, lack of awareness, and demand and uncertainly about return on investment (ROI) [38]; (4) the sub-contractors not having sufficient knowledge about BIM, clients’ lack of awareness about BIM benefits, high cost of BIM implementation, high cost of training, and unwillingness to change current construction culture [39]; and (5) high initial costs, training issues, and cultural resistance [40].
Therefore, this paper explores BIM as a technological tool in the design phase, where its effectiveness may well derive from organizational factors. Several organizational factors (i.e., collaborative culture, technological learning, and support from senior management) are considered key to influencing BIM effectiveness. Collaborative culture is fundamental given the fact that BIM is a functional organizational structure, which adds value to collaboration from the early and subsequent phases of the life cycle [41]. Since both technological learning and experience are essential to be able to use BIM to begin with, they must also be assessed [30].

2.2. BIM Technology Effectiveness

Nowadays, the concept of technological capabilities was interchangeable with other concepts used for the same purpose, such as technological effort [42,43] or technological ability [43,44], and it has become a widely accepted term. Previous contributions have developed several industry-level BIM maturity models to help the AEC sector measure the performance of its BIM effectiveness [45] and to be able to make comparisons of maturity models between countries. In the design phase, BIM implementation has made possible the decrease of design errors, which means reducing the cost of the project and the time spent on the design, as well as generating benefits for the designer, the contractor, and the owner [33,34].
In the BIM literature, as a high-tech information system, the term “dimension” is used to indicate the information-processing capability of this technology [46]. It has been demonstrated that BIM is ahead of CAD, as it is able to turn physical properties into virtual models. In fact, it has been named the 3D BIM construction model. The fourth dimension 4D BIM added on was time in order to carry out study plans. Then, 5D BIM added price as its fifth dimension with the aim to study the cost of projects [47,48]. Sustainability analysis was the sixth dimension to be added to 6D BIM, allowing energy and sustainable simulation studies to be carried out in projects [49]. Later on, 7D BIM added a seventh dimension in order to include any information or documentation that may be required for systems to be managed in the most suitable way [50]. Finally, 8D BIM was incorporated so as to carry out studies of labor risk prevention in models throughout the design phase [51].
BIM is a technology that allows the integration of project information. AEC companies that carry out projects with BIM use it for different purposes. On the other hand, effectiveness is the ability to achieve the desired result. Therefore, in this research, the effectiveness of BIM is defined as the ability to properly use BIM by project teams for the objectives set.

2.3. Senior Management Support

BIM can be understood as an information system, which an organization needs to maintain their ability to compete, will produce quality information and needs senior management as a key factor for its successful implementation [52]. In this study, senior management support is defined as the extent to which the manager engages with their team in order to succeed in technological projects [53], due to the fact that greater encouragement from the top management leads to increased BIM adoption benefits [54]. The specific ways in which managers behave in terms of supporting their team may vary [55,56], but they tend to set action plans and project progress, communicate project vision, obtain project resources, attend project meetings and establish any structural changes that may be needed in the organization [53].
Currently, design teams that work with BIM technology are subject to constant changes in the technological environment. Their performance is being influenced by different behaviors and by the support received from senior management. Therefore, this support can improve the performance or capabilities of the project team [57].

2.4. Technological Learning

For decades, researchers have shown that learning is a clear organizational factor in order to succeed, as learning affects the development of technology and industry [57,58]. Learning can be described as a variety of processes from which individuals gain knowledge and technical skills [43]. The concept of technological capabilities was interchangeable with other concepts used for the same purpose, such as technological effort [42,43] or technological ability [43,59], until it has nowadays become a widely accepted term. Learning has also been described as the ways in which companies build, complement and organize knowledge and routines around their activities within their cultures, adapting and developing organizational efficiency, through the best use of general skills and those of their staff [32].
Technological capabilities are the set of resources required to generate and manage technical change, including skills, knowledge, and experience [60]. Technological capabilities are defined as the ability to make effective use of technological knowledge by assuming, using, adapting and changing existing technologies [61]. BIM is a technological and procedural change which requires a broad domain of knowledge within the AEC industry [62]. For other authors, BIM is considered a disruptive technology [63], which involves not only technological change, but also a change process in BIM [3] that forces AEC organizations who carry out their projects in BIM to adapt to new cultural changes.

2.5. Collaborative Culture

Some studies suggest that organizational factors such as company culture, leadership, and knowledge management can affect the creation of technological knowledge [64]. Culture is the character and personality of the organization. Positive workplace culture attracts talent, drives engagement, impacts happiness and satisfaction and affects performance. In addition, studies carried out in construction projects show that encouraging the team to work collaboratively in a positive way brings them much closer and as a result, the team becomes much more united [65,66]. If project success is to be studied in the construction industry, it is important for senior management to foster a suitable environment for people to collaborate so as to have a successful project [67]. In the construction industry, collaboration in technological environments is essential for people to manage technology at its fullest [68].

2.6. Research Hypothesis

This study examines whether senior management support can improve team performance [57]. It is suggested that technological capabilities depend on learning processes and the organizational culture such as the collaborative environment and the environment itself, which are influential factors regarding team productivity. Therefore, this study postulates the following hypotheses arising from the theoretical review carried out:
Hypothesis 1 (H1).
There is a positive link between senior management support and BIM technology effectiveness when carrying out design projects.
Hypothesis 2 (H2).
The effect senior management support has on BIM effectiveness when carrying out design projects is positively mediated through technological learning.
Hypothesis 3 (H3).
The effect senior management support has on BIM effectiveness when carrying out design projects is positively mediated through a collaborative culture.
From these hypotheses, a research model were formulated. The variables were obtained from the literature exposed in the previous sections, and the indicators used to measure the variables are presented in Section 3.3. The proposed model (Figure 1) had an independent variable “senior management support” (SMS), two mediating variables “technological learning” (TL) and “collaborative culture” (CCU), and one dependent variable “BIM effectiveness” (BIME).
Control variables were those variables which monitored the behavior of the dependent variable. The direct effect was used to test the model without the mediating variables, while multiple effects were used to test the model with mediating variables.

3. Research Method

3.1. Overall Approach

Once the literature were reviewed and the theoretical foundations were laid, the research method used in the study could be explained. First of all, the target population of this study and the selection of samples were explained. Next, the survey design as well as the empirical research and the data gathered for it was described as well as the variables to be studied and the equipment used in order to measure them. Subsequently, the statistical technique chosen for data analysis was justified.
This research follows an exploratory design [69], as it is used for the purpose of exploring the proposed research problem, which, given its characteristics, requires a predictive causal method. The research model is empirically contrasted using structural equations to explain its objective. Partial least squares (PLS) is suitable for this research for several reasons: (1) it is particularly useful, when mediating analysis is performed and the sample size is small [70]; (2) it is mainly intended for causal predictive analysis, where the problems explored are complex and previous theoretical knowledge is scarce [71]; (3) it is robust for small to moderate sample sizes [72]; (4) it does not require data distribution assumptions and uses a main component based on an estimation approach [73]; (5) it is adequate for formative constructions [74]; and (6) it is a predictive causal approach that emphasizes prediction when estimating statistical models of which the structures are designed to provide causal explanations [75]. PLS can be used for both predictive and exploratory research [76].

3.2. Sample and Data Collection

The target population of this study, on which the research hypotheses were tested, are companies in the AEC sector that carry out projects with BIM technology in Spain. The sample was made up of 92 architectural and engineering design companies. To collect data, a survey was used, which included components that gathered information about the company, as well as a series of questions related to the main variables of the model, which were grouped by topic. The questions related to the model variables were designed and adapted from previous contributors by the researchers (Table 1). The questionnaire was reviewed by academic experts, and then, a pilot study was conducted in five companies. Professional architect and engineer associations in Spain distributed the survey to the managers or CEOs of companies who used BIM in their projects. The researchers also contacted companies via telephone in order for the survey to be directly emailed to managers. Respondents were able to access the survey through a link (URL address) which was sent by email. According to [77], if the interest of the research is to link behavior variables of a company, key informants such as managers or high-level executives are able to provide this information to researchers. On the other hand, studies that use organizational behavior information must take into account the different methods of bias that can influence the response process [78], which is previously taken care of in the research design [77]. The field work was carried out from November 2019 to April 2020. One hundred and six completed surveys were received and 92 were validated, as some of them were not appropriately completed.

3.3. Variables

The proposed model contained the following constructs: SMS, TL, CCU and BIME. A previous review of the literature was needed to build the indicators used to measure the variables studied. All variables used in this study were measured by constructs with scales of measurement, which represented the manager’s perception regarding the model variables. The indicators were established based on a five-item Likert scale (1 = totally disagree, 2 = disagree, 3 = neutral, 4 = agree, 5 = totally agree), except BIME5 which is dichotomous, except SMS5, TL4, and BIME7 which are ordinals and BIME6 which is categorical.
The following were included as control variables: age (measured by the number of years the company had been in the market since its foundation) and size (number of employees). This way, its effects on the dependent variable (BIM effectiveness) were neutralized. Table 1 shows the indicators for each variable in this study.
To conceptualize senior management support (from SMS1 to SMS5), questions were designed to assess how a project team’s new skills, innovative mindset and risk-taking, as well as new ideas in the project design, manager performance in team meetings, and the percentage of solved problems, which had been raised by the project team [52,57]. On the other hand, a collaborative environment is understood to be adequate for people to collaborate so as to succeed in the project [67].
To conceptualize technological learning (from TL1 to TL4), questions were designed to assess information regarding gained learning, that is, the acquisition of new knowledge in BIM technology gained in different phases of the project and also assessing their experience with BIM [26,60].
To conceptualize collaborative culture fostered by management (from CCU1 to CCU5), questions were designed to assess support amongst team members and their willingness to share responsibilities, support offered by all those involved in the project, collaboration with other companies to carry out the project, and the use of professional collaboration networks [65,66,68].
Finally, to conceptualize BIM use effectiveness with regards to the project team (from BIME1 to BIME7), questions were designed to assess BIM effectiveness in terms of design, planning, costs, and energy efficiency throughout the different phases of the project (from 3D BIM to 6D BIM), the use of BIM tools for the study of interferences between facilities, and the percentage of the project carried out only with BIM tools [46,47,48,49].

3.4. Data Analysis

Relationships raised in the research model were assessed by the selected data, for which the chosen method of analysis was the modeling of structural equations through PLS. According to the characteristics of the model (predictive) and the sample (less than 250 observations), the minimum sample size depended on the number of relationships between variables in the research model [79,80]. In this case, at least 70 observations were suggested for 5 relationships. This sample complied with this condition, having a sample size of 92, which was suggested by G-Power software for a medium effect size (f2 = 0.15), at a power of 0.8 for an alpha level of 0.05.
This study used SmartPLS 3 software [81]. The estimation of the model was completed in two steps [82]. In the first step, the measurement model was analyzed, where the link between indicators and the variable they represent was verified. In the second step, the structural model was analyzed to examine how valid the relationships between the proposed variables in the model were. To test the measurement model in the first step, the nature of the direction of causality between the indicator and the construct should be analyzed. In our model, all variables had a formative specification, since the indicators directly helped create the variable. In other words, the direction of causality went from the indicators to the variable being measured or from the indicators to the construct. A variable with formative indicators implied that the indicators did not need to be highly correlated with each other, because each indicator collected different aspects of the variable which can occur independently [83].
For the structural model, relationships between the variables proposed in the research model were validated through the path coefficient (β) and their level of statistical significance with a Bootstrap test using 5000 subsamples and also illustrated the variance R2 of the variables explained. In order to contrast the hypotheses of mediation, the first thing to be assessed were the direct effects caused to the model without introducing any mediating variables. After that, the mediating variables were introduced in order to assess the indirect effects the mediation relationships had on the mode to then calculate the VAF value.

4. Results

Table 2 shows the descriptive statistics of the sample. Companies that use BIM to carry out architectural and engineering projects have been examined. It should be noted that 68.1% of company samples are micro-companies, 63.4% of the sample had been using BIM for over three years, and 40.4% of the companies carry out more than 80% of their projects with BIM. As for the type of projects, approximately 50% of the companies carry out building projects, 30% engineering facilities, and 20% civil engineering and architecture.
Table 3 shows the result of the measurement model with formative indicators, where the content validity of variable indicators, represented in weight and statistical significance, were assessed. To ensure the absence of the collinearity between the indicators and their construct, VIF (variance inflation factor) was assessed, needing its value to be less than 3 [84]. In our case, all VIF values obtained were under 3, except for CUB3 being 3.17, which was eliminated in order to avoid collinearity problems. The indicators that obtained weights very close to zero were also eliminated from the model, since they were not statistically significant, except for TT1 and BIME5 since they conceptually contribute to the construction of the variable they represent, despite not being significant. Control variables age and size were found not to be statistically significant due to β coefficients being very close to zero and also being eliminated from the study, although it is important as a previous step to use control variables to see their influence on the dependent variable to be explained BIM effectiveness.
Structural analysis assessed the strength of the relationships established between the different variables in the model. To do this, the level of statistical significance of the “β” or path coefficients and the R2 for the dependent variables were assessed. In Table 4, the results of the structural model and the results of the mediation analysis are shown. The control variables (size and age) were eliminated, as they were not significant for the dependent variable. To contrast the hypotheses of mediation, the direct effects model (Figure 2) between senior management support and BIM effectiveness was first assessed, which was certainly significant. Secondly, the model with mediated effects was evaluated (Figure 3), introducing the following mediating variables: technological learning and collaborative culture. Finally, the VAF (variance accounted for) value was calculated in the mediator model to determine the mediation strength.
Figure 3 represents the model of mediated effects to contrast hypotheses H2 (+) and H3 (+). Table 4 shows the results of the structural model with direct effects (Figure 2) and with mediated effects (Figure 3). Again, Table 4 shows that there was no collinearity between the variables of the model, since the VIF values were under 3. The results in Table 4 were obtained under a one-tailed Student’s t test distribution, because the hypotheses with a (+) sign were stated. In addition, shown in Table 4 are the values of the path coefficients “β” (T-value) for each path. To estimate the path coefficients, a Bootstrap resampling procedure was performed with 5000 subsamples. Table 4 shows the R2 value for technological learning (R2 = 0.350), collaborative culture (R2 = 0.451), and BIM effectiveness (R2 = 0.648). The higher the value of R2, the more predictive power exists in the model. According to [85], R2 values (0.67, 0.33, and 0.10) were considered as prediction reference values (substantial, moderate, and weak). According to [86], R2 values (0.75, 0.50, and 0.25) were considered as values (substantial, moderate, and weak). Therefore, the values obtained are relevant to explain BIM effectiveness.
The model with mediated effects verified that H1 (+) was proved in the model with direct effects and H2 (+) and H3 (+) were demonstrated in the model with mediated effects. Table 5 shows the contrast of hypotheses for the model of mediated effects, and the VAF value was calculated to know the type of mediation. The strength of the mediation was calculated through VAF. According to [87], if the VAF value is greater than 80% it is complete mediation and if the VAF value is between 20% and 80% it is partial mediation. Therefore, as the VAF value was 68.15%, the relationship between senior management support and BIM effectiveness was a partially mediated relationship by technological learning and by the collaborative culture in a multiple way.
The direct effects model explained 48.7% of the variance of BIM effectiveness, and the model with mediating effects explained 68.4% of the variance of BIM effectiveness. Therefore, it is very important that management support not only technological projects, but also a collaborative culture and technological learning, as it has been demonstrated that, if management fosters both in the BIM team, the capacities to use this technology improve.
The results indicated that the proposed hypotheses were well supported, and the causal relationships among the postulated constructs in the model were analyzed. The model in our study provides an elaborated explanation of the key factors influencing BIM technology effectiveness when the manager engages with their team in order to succeed in technological projects.

5. Discussion

In the construction sector in Spain, digitalization has caused an increase in the demand for projects carried out with BIM both for public projects where its use is mandatory and private projects. Adopting BIM technology requires internal adjustment and corporate redesign, where improving employee productivity is a priority in the transformation from CAD to BIM [14].
According to recent research to investigate the reasons for low BIM adoption among architectural firms in India [10], it was concluded that top management support and BIM expertise promote BIM adoption but do not inquire about which variables can influence BIM effectiveness from top management support. In order to do this, senior management support must promote adequate culture and values, enhancing technological learning [26,60] and a collaborative culture amongst members of a project team [65,66,68]. For an effective BIM implementation to exist, senior management support must make decisions to improve the work process, defining objectives and establishing the responsibilities of each person involved. Senior management support must establish leadership throughout the BIM implementation process, which allows monitoring and coordinating all activities of a project team, avoiding errors and misunderstandings [33,34].
Finally, for BIM performance to be appropriate, it must have a well-defined hierarchical and collaborative structure, as well as fluid and determined work processes in addition to having adequate technological resources [26]. With all of the above, BIM effectiveness will be enhanced for competitive improvement and differentiation in the market.

6. Conclusions

From a theoretical perspective, the TAM validates the acceptance or use of new technology but did not inform on how to improve its technology. This study has shown that, once a new technology is accepted, its effectiveness can improve with senior management support. For that to happen, senior management support must promote both a collaborative culture and technological learning amongst members of a project team. It has been proven that senior management support exerts an influence with direct effects on BIM effectiveness (R2 = 0.487). In the same way, evidence with indirect effects has been found, proving that technological learning and collaborative culture are mediating variables between senior management support and BIM effectiveness. These mediation effects improve the explanation of BIM effectiveness (R2 = 0.648). It can be concluded that the development of technological capabilities depends on the learning processes and the environment, as established by the literature review, and it is proven that BIM technology is also met. Senior management support alone does not improve technological capabilities, and management must also promote both technological learning and the collaborative culture in a project team simultaneously. In this way, the ability to use BIM technology among team members is desired. It has been shown that the size of the company and its age do not influence BIM technology effectiveness. This is an advantage, as any manager can improve their competitiveness in the market by offering equal opportunities. Through these results, the following question can be answered: Why do companies who adopt BIM to carry out projects obtain different levels of effectiveness if they are being done at the same time? It can be seen that the answer is hidden in managerial behaviors and intangible organizational factors that explain the phenomenon. Therefore, BIM requests the need for theoretical frameworks that distribute knowledge to promote business strategies where senior management promotes better performance in project design.
A possible limitation of this study is that the survey was restricted to AEC design companies using BIM in Spain, which could raise questions about the extent to which the results can be generalized in other countries. Testing the external validation of the findings would require the replication of this study in other countries. The study also used a cross-sectional research design, which could be criticized for not capturing the temporary dynamics incorporated in the model. Thus, future work should consider a lengthwise design that provides insight into these relationships over time. It would also be interesting to undertake the same study analyzing BIM effectiveness by type of project design (architecture, civil construction, and industrial construction). Finally, it can be said that, from this study, future lines of research related to this topic are opened, creating the possibility of expanding the analysis with different variables or organizational factors that are not included in this research. For example, the role that organizational variables may cause from the perspective of employees, such as team entrepreneurship, needs to be investigated to analyze their influence on the ability to use BIM technology. The results of this study are intended to help managers and professionals gain a better understanding of the importance of fostering technology learning and collaborative culture to ensure the potential benefits of technological capabilities.

Author Contributions

This paper represents a result of teamwork. All of the authors jointly designed the research methodology. F.V.-M. and T.G.-S. analyzed the results. All of the authors jointly worked on the discussion. F.V.-M. drafted the manuscript. Finally, E.P. reviewed and edited the manuscript. All authors have read and agreed to the published version of the manuscript.

Funding

This research received no external funding.

Acknowledgments

Many thanks to the following professional associations for their co-operation: COAS, COIICV, COIIM, COIIAR, COIIEX, COPITI Andalusia and COPITI Extremadura.

Conflicts of Interest

The authors declare no conflict of interest.

References

  1. Suermann, P.; Issa, R. Evaluating industry perceptions of building information modeling (BIM) impact on construction. Electron. J. Inf. Technol. Constr. 2009, 14, 574–594. [Google Scholar]
  2. Kassem, M.; Brogden, T. Dawood. N. BIM and 4D planning: A holistic study of the barriers and drivers to widespread adoption. J. Constr. Eng. Proj. Manag. 2012, 2, 1–10. [Google Scholar] [CrossRef] [Green Version]
  3. Eastman, C.M.; Teicholz, P.; Sacks, R.; Liston, K. BIM Handbook: A Guide to Building Information Modelling for Owners, Managers, Designers, Engineers and Contractors; John Wiley and Sons, Inc.: Hoboken, NJ, USA, 2011. [Google Scholar]
  4. Sabongi, F.J. The Integration of BIM in the Undergraduate Curriculum: An Analysis of Undergraduate Courses. In Proceedings of the 45th ASC Annual International Conference on EEUU, Gainesville, FL, USA, 1–4 April 2009. [Google Scholar]
  5. Davis, F.D. Perceived usefulness, perceived ease of use and user acceptance of information technology. MIS Q. 1989, 13, 319–340. [Google Scholar] [CrossRef] [Green Version]
  6. Holden, R.J.; Karsh, B.T. The Technology Acceptance Model: Its past and its future in health care. J. Biomed. Inform. 2010, 43, 159–172. [Google Scholar] [CrossRef] [Green Version]
  7. Lee, Y.; Kozar, K.A.; Larsen, K.R. The Technology Acceptance Model: Past, Present, and Future. Commun. Assoc. Inf. Syst. 2003, 12, 750–782. Available online: http://aisel.aisnet.org/cgi/viewcontent.cgi?article=3217&context=cais (accessed on 21 March 2020). [CrossRef]
  8. Li, L. A Critical Review of Technology Acceptance Literature; Grambling State University: Grambling, LA, USA, 2010; p. 19. Available online: http://www.swdsi.org/swdsi2010/sw2010_preceedings/papers/pa104.pdf (accessed on 6 July 2020).
  9. Lee, S.; Yu, J. Comparative Study of BIM Acceptance between Korea and the United States. J. Constr. Eng. Manag. 2016, 142, 5015016. [Google Scholar] [CrossRef]
  10. Ahuja, R.; Jain, M.; Sawhney, A.; Arif, M. Adoption of BIM by architectural firms in India: Technology–organization–environment perspective. Archit. Eng. Des. Manag. 2016, 12, 311–330. [Google Scholar] [CrossRef] [Green Version]
  11. Xu, H.; Feng, J.; Li, S. Users-orientated evaluation of building information model in the Chinese construction industry. Autom. Constr. 2014, 39, 32–46. [Google Scholar] [CrossRef]
  12. Acquah, R.; Eyiah, A.K.; Oteng, D. Acceptance of building information modelling: A survey of professionals in the construction industry in Ghana. J. Inf. Technol. Constr. 2018, 23, 75–91. Available online: https://www.itcon.org/2018/4 (accessed on 16 February 2019).
  13. Ahmed, A.L.; Kassem, M. A unified BIM adoption taxonomy: Conceptual development, empirical validation and application. Autom. Constr. 2018, 96, 103–127. [Google Scholar] [CrossRef]
  14. Sanchís, P.; Vizcarra, A.C.; Leal Rodríguez, A.L. BIM: A technology acceptance model in Peru. J. Inf. Technol. Constr. 2020, 25, 99–108. [Google Scholar]
  15. Ullah, K.; Lill, I.; Witt, E. An Overview of BIM Adoption in the Construction Industry: Benefits barriers. In Proceedings of the 10th Nordic Conference on Construction Economics and Organization (Emerald Reach Proceedings Series, Vol. 2); Emerald Publishing Limited: Bingley, UK, 2019; pp. 297–303. [Google Scholar] [CrossRef]
  16. Kjartansdottir, I.B.; Mordue, S.; Nowak, P.; Philp, D.; Snæbjörnsson, J.T. Building Information Modelling-BIM; Civil Engineering Faculty of Warsaw University of Technology: Warsaw, Poland, 2017. [Google Scholar]
  17. Khosrowshahi, F.; Dastbaz, M.; Gorse, C.; Moncaster, A. Building Information Modelling (BIM) a Paradigm Shift in Construction. In Building Information Modelling, Building Performance, Design and Smart Construction; Springer: Cham, Switzerland, 2017; pp. 47–64. [Google Scholar]
  18. Latiffi, A.A.; Mohd, S.; Rakiman, U.S. Potential improvement of building information modeling (bim) implementation in Malaysian construction projects. In Proceedings of the 12th IFIP International Conference on Product Lifecycle Management, Doha, Qatar, 19–21 October 2015. [Google Scholar]
  19. Latorre, U.A.; Sanz, C.; Sánchez, B. Aplicación de un modelo Lean-BIM para la mejora de la productividad en redacción de proyectos de edificación. Inf. Constr. 2019, 71, 313. [Google Scholar] [CrossRef] [Green Version]
  20. Lu, N.; Korman, T. Implementation of Building Information Modeling (BIM) in Modular Construction: Benefits and Challenges. Constr. Res. Congr. 2010, 8, 1136–1145. [Google Scholar] [CrossRef] [Green Version]
  21. Gu, N.; London, K. Understanding and facilitating BIM adoption in the AEC industry. Autom. Constr. 2010, 19, 988–999. [Google Scholar] [CrossRef]
  22. Gurevich, U.; Sacks, R.; Shrestha, P. BIM adoption by public facility agencies: Impacts on occupant value. Build. Res. Inf. 2017, 45, 610–630. [Google Scholar] [CrossRef]
  23. Lee, S.; Yu, J. Discriminant model of BIM acceptance readiness in a construction organization. J. Civil Eng. 2016, 21. [Google Scholar] [CrossRef]
  24. Gilligan, B.; Kunz, J. VDC Use in 2007: Significant Value, Dramatic Growth, and Apparent Business Opportunity. CIFE, Stanford University Center for Integrated Facility Engineering. Available online: http://cife.stanford.edu (accessed on 18 April 2009).
  25. Hongping, Y.Y.; Yu, Y.; Xiaolong, X. Promoting Owners’ BIM Adoption Behaviors to Achieve Sustainable Project Management. Sustainability 2019, 11, 3905. [Google Scholar] [CrossRef] [Green Version]
  26. Dodgson, M. Organizational Learning: A Review of Some Literatures. Organ. Stud. 1993, 14, 375–394. [Google Scholar] [CrossRef]
  27. McGraw-Hill Construction. The Business Value of BIM in North America: Multi-Year Trend Analysis and User Ratings (2007–2012); Smart Market Report; McGraw-Hill Construction: Bedford, MA, USA, 2012; p. 18. [Google Scholar]
  28. Weirui, X.; Yaow, W.; Qingpeng, M. Research on information models for the construction schedule management based on the IFC standard. J. Ind. Eng. Manag. 2015, 8, 615–635. [Google Scholar] [CrossRef] [Green Version]
  29. Lee, G.; Borrmann, A. BIM policy and management. Constr. Manag. Econ. 2020, 3, 413–419. [Google Scholar] [CrossRef] [Green Version]
  30. Mahamadu, A.M.; Mahdjoubi, L.; Booth, C.A. Critical BIM qualification criteria for construction pre-qualification and selection. Archit. Eng. Des. Manag. 2017, 13, 326–343. [Google Scholar] [CrossRef]
  31. Arayici, Y.; Kiviniemi, A.; Coates, S.; Koskela, L.; Kagioglou, M.; Usher, C.; O’Reilly, K. BIM implementation and adoption process for an architectural practice. Struct. Surv. 2011, 29, 7–25. [Google Scholar] [CrossRef] [Green Version]
  32. Alwisy, A.; Mohamed, A.H.; Jibouri, S. BIM Approach for Automated Drafting and Design for Modular Construction Manufacturing. In Proceedings of the ASCE International Conference on Computing in Civil Engineering, Clerawater Beach, FL, USA, 17–20 June 2012. [Google Scholar] [CrossRef]
  33. Song, J.; Migliaccio, G.; Wang, G.; Lu, H. Exploring the Influence of System Quality, Information Quality, and External Service on BIM User Satisfaction. J. Manag. Eng. 2017, 33, 4017036. [Google Scholar] [CrossRef]
  34. Liu, H.L.; Song, J.L.; Wang, G.B. User satisfaction of building information modeling (BIM) and its influencing factors in AEC industry. J. China Civ. Eng. 2019, 52, 118–128. [Google Scholar]
  35. Orlikowski, W. Using Technology and Constituting Structures: A Practice Lens for Studying Technology in Organizations. Organ. Sci. 2000, 11, 404–428. [Google Scholar] [CrossRef]
  36. Elmualim, A.; Gilder, J. BIM: Innovation in design management, influence and challenges of implementation. Archit. Eng. Des. Manag. 2014, 10, 183–199. [Google Scholar] [CrossRef]
  37. Hore, A.; McAuley, B.; West, R. Building Information Modelling in Ireland 2017. In Lean and Computing in Construction Congress (LC3): Volume I Ð Proceedings of the Joint Conference on Computing in Construction (JC3), Heraklion, Greece, 4–7 July 2017; BIM Innovation Capability Programme, Cita Ltd.: Dublin, Ireland, 2017; pp. 759–766. [Google Scholar]
  38. Ismail, N.A.A.; Chiozzi, M.; Drogemuller, R. An overview of BIM uptake in Asian developing countries. AIP Conf. Proc. 2017, 1903, 080008. [Google Scholar] [CrossRef] [Green Version]
  39. Hosseini, M.R.; Banihashemi, S.; Chileshe, N.; Oraee, M.; Udeaja, C.; Rameezdeen, R.; McCuen, T. BIM adoption within Australian small and medium-sized enterprises (SMEs): An innovation diffusion model. Constr. Econ. Build. 2016, 16, 71–86. [Google Scholar] [CrossRef] [Green Version]
  40. Harrison, C.; Thurnell, D. BIM implementation in a New Zealand consulting quantity surveying practice. Int. J. Constr. Supply Chain. Manag. 2015, 5, 1–15. [Google Scholar] [CrossRef]
  41. Broquetas, M.; Bryde, D.; Volm, J. The project benefits of Building Information Modelling (BIM). Int. J. Proj. Manag. 2013, 31, 971–980. [Google Scholar] [CrossRef] [Green Version]
  42. Lall, S. Learning to Industrialize: The Acquisition of Technological Capability by India; Macmillan Press: London, UK, 1987. [Google Scholar]
  43. Bell, M. Learning and the Accumulation of Industrial Technological Capacity in Developing Countries. In Technological Capacity in the Third World; King, K., Fransman, M., Eds.; Macmillan: London, UK, 1984; pp. 187–209. [Google Scholar]
  44. Scott, K.D.; Bell, M. Technological Capacity and Technical Change: Case Studies, Report on a Study of Technology Transfer in Manufacturing Industry in Thailand; Working Paper; Science Policy Research Unit, University of Sussex: Brighton, UK, 1985. [Google Scholar]
  45. Yilmaz, G.; Akcamete, A.; Demirors, O. A reference model for BIM capability assessments. Autom. Constr. 2019, 101, 245–263. [Google Scholar] [CrossRef]
  46. Koutamanis, A. Dimensionality in BIM: Why BIM cannot have more than four dimensions? Autom. Constr. 2020, 114, 103153. [Google Scholar] [CrossRef]
  47. Mayouf, M.; Gerges, M.; Cox, S. 5D BIM: An investigation into the integration of quantity surveyors within the BIM process. J. Eng. Des. 2019, 17, 537–553. [Google Scholar] [CrossRef]
  48. Mesároš, P.; Smetanková, J.; Mandičák, T. The Fifth Dimension of BIM–Implementation Survey. In Proceedings of the IOP Conference Series: Earth and Environmental Science 222, Brno, Czech Republic, 17–19 October 2018. [Google Scholar] [CrossRef]
  49. Oti, A.; Kurul, E.; Cheung, F.; Tah, J. The utilization of BMS in BIM for facility management. In Proceedings of the CIB World Building Congress, Tampere, Finland, 30 May–3 June 2016. [Google Scholar] [CrossRef]
  50. Ghaffarianhoseini, A.; Tookey, J.; Ghaffarianhoseini, A.; Naismith, N.; Azhar, S.; Efimova, O.; Raahemifar, K. Building Information Modelling (BIM) uptake: Clear benefits, understanding its implementation, risks and challenges. Renew. Sustain. Energy Rev. 2016, 75, 1046–1053. [Google Scholar] [CrossRef]
  51. Kamardeen, I. 8D BIM modelling tool for accident prevention through design. In Proceedings of the 26th Annual Association of Researchers in Construction Management (ARCOM) Conference, Leeds, UK, 6–8 September 2010; pp. 281–289. [Google Scholar]
  52. Ragu-Nathan, B.S.; Apigian, C.H.; Ragu-Nathan, T.S.; Tu, Q. A path analytic study of the effect of top management support for information systems performance. Omega 2004, 32, 459–471. [Google Scholar] [CrossRef]
  53. Mahoney, M.L. An Examination of the Determinants of Top Management Support of Information Technology Projects. Ph.D. Thesis, ProQuest LLC, Ann Arbor, MI, USA, 2011. [Google Scholar]
  54. Cao, D.; Wang, G.; Li, H.; Skitmore, M.; Huang, T.; Zhang, W. Practices and effectiveness of building information modelling in construction projects in China. Autom. Constr. 2015, 49, 113–122. [Google Scholar] [CrossRef] [Green Version]
  55. Sharma, R.; Yetton, P. The contingent effects of management support and task interdependence on successful information systems implementation. MIS Q. 2003, 27, 533–555. [Google Scholar] [CrossRef]
  56. Young, R.; Jordan, E. Top management support: Mantra or necessity? Int. J. Proj. Manag. 2009, 26, 713–725. [Google Scholar] [CrossRef] [Green Version]
  57. Khan, K.A.; Turner, J.R.; Maqsood, D. Factors that influence the success of public sector projects in Pakistan. In Proceedings of the IRNOP XI 2013 Conference, Oslo, Norway, 17–19 June 2013. [Google Scholar]
  58. Rosenberg, N. On Technological Expectations. Econ. J. 1976, 86, 523–535. [Google Scholar] [CrossRef]
  59. Scott, K.D.; Bell, M. Technological Dynamism and Technological Content of Collaboration: Are Indian Firms Missing Opportunities? Econ. Political Wkly. 1985, 20, 1991–2004. Available online: http://www.jstor.org/stable/4375021 (accessed on 5 June 2020).
  60. Bell, M.; Pavitt, K. The Development of Techological Capabilities. In Trade, Technology and International Competitiveness; Haque, I.U., Ed.; The World Bank: Washington, DC, USA, 1995; Volume 22, pp. 69–101. [Google Scholar]
  61. Kim, L. The Dinamics of Sansung’s Technological Learning in Semiconductors. CA Manag. Rev. 1997, 39, 86–100. [Google Scholar]
  62. Succar, B Building information modelling framework: A research and delivery foundation for industry stakeholders. Autom. Constr. 2009, 18, 357–375. [CrossRef]
  63. Sacks, R.; Eastman, C.; Lee, G.; Teicholz, P. BIM Handbook: A Guide to Building Information Modelling for Owner, Managers, Designers, Engineers, Contractors and Facility Managers; John Wiley and Sons, Inc.: Hoboken, NJ, USA, 2018. [Google Scholar]
  64. Figueiredo, P.N. Technological Learning and Competitive Performance; Edward Elgar Publishing: Cheltenham, UK; Northampton, UK, 30 December 2001. [Google Scholar]
  65. Baiden, B.K.; Price, A.; Dainty, A. The extent of team integration within construction projects. Int. J. Proj. Manag. 2006, 24, 13–23. [Google Scholar] [CrossRef]
  66. Dietrich, P.; Eskerod, P.; Dalcher, D.; Sandhawalia, B. The Role of Project Collaboration Quality and Knowledge: Integration Capability in Multi-Partner Projects. Presented at PMI® Research Conference: Defining the Future of Project Management, Washington, DC, USA, 14 July 2010; Project Management Institute: Newtown Square, PA, USA; pp. 1–38. [Google Scholar]
  67. Chan, A.P.; Scott, D.; Chan, A.P. Factors affecting the success of a construction project. J. Constr. Eng. Manag. 2004, 130, 153–155. [Google Scholar] [CrossRef] [Green Version]
  68. Weippert, A.; Kajewski, S. AEC Industry Culture: A Need for Change. In CIB World Building Congress 2004: Building for the Future; Elmahdy, H., Ed.; CIB (International Council for Research and Innovation Building and Construction): Toronto, ON, Canada, May 2004; pp. 1–10. [Google Scholar]
  69. Creswell, J.; Clark, V.P. Designing and Conducting Mixed Methods Research; Sage: Thousand Oaks, CA, USA, 2007. [Google Scholar]
  70. Roldán, J.L.; Sánchez, F.M.J. Variance-based structural equation modeling: Guidelines for using partial least squares in information systems research. In Research Methodologies, Innovations and Philosophies in Software Systems Engineering and Information Systems; Mora, M., Gelman, O., Steenkamp, A., Raisinghani, M., Eds.; Information Science Reference: Hershey, PA, USA, 2012; pp. 193–221. [Google Scholar]
  71. Lévy, J.; Varela, J. Modelación con Estructuras de Covarianzas en Ciencias Sociales; Editores Netbiblo: Madrid, Spain, 2006. [Google Scholar]
  72. Cassel, C.; Hackl, P.; Westlund, A. Robustness of Partial Least-Squares Method for Estimating Latent Variable Quality Structures. J. Appl. Stat. 1999, 26, 435–446. [Google Scholar] [CrossRef]
  73. Chin, W. How to write up and report PLS analyses. In Handbook of Partial Least squares: Concepts, Methods and Applications; Vinzi, E., Chin, W., Henseler, J., Wang, H., Eds.; Springer: Berlín, Germany, 2010; pp. 655–690. [Google Scholar]
  74. Hair, J.; Ringle, C.; Sarstedt, M. Partial Least Squares Structural Equation Modeling: Rigorous Applications, Better Results and Higher Acceptance. Long Range Plan. 2013, 46, 1–12. [Google Scholar] [CrossRef]
  75. Hair, J.; Risher, J.; Sarstedt, M.; Ringle, C.M. When to use and how to report the results of PLS-SEM. Eur. Bus. Rev. 2018, 31, 1–24. [Google Scholar] [CrossRef]
  76. Henseler, J.; Hubona, G.; Ray, P. Using PLS path modeling new technology research: Updated guidelines. Ind. Manag. Data Syst. 2016, 116, 2–20. [Google Scholar] [CrossRef]
  77. Podsakoff, P.; MacKenzie, S.; Lee, J.Y.; Podsakoff, N.P. Common Method Biases in Behavioral Research: A Critical Review of the Literature and Recommended Remedies. J. Appl. Psychol. 2003, 88, 879–903. [Google Scholar] [CrossRef]
  78. Meade, A.W.; Watson, A.M.; Kroustalis, C.M. Assessing Common Methods Bias in Organizational Research. In Proceedings of the 22nd Annual Meeting of the Society for Industrial and Organizational Psychology, New York, NY, USA, 15–17 April 2007. [Google Scholar]
  79. Reinartz, W.; Haenlein, M.; Henseler, J. An empirical comparison of the efficacy of covariance-based and variance-based SEM. Int. J. Res. Mark. 2009, 26, 332–344. [Google Scholar] [CrossRef] [Green Version]
  80. Marcoulides, G.; Saunders, C. PLS: A silver bullet? Manag. Inf. Syst. Q. 2006, 30, 3–9. [Google Scholar] [CrossRef]
  81. Ringle, C.M.; Wende, S.; Becker, J.M. SmartPLS 3. Boenningstedt: SmartPLS GmbH. Available online: http://www.smartpls.com (accessed on 21 April 2020).
  82. Chin, W.; Marcolin, B.; Newsted, P. A Partial Least Squares Latent Variable Modeling Approach for Measuring Interaction Effects: Results from a Monte Carlo Simulation Study and an Electronic-Mail Emotion/Adoption Study. Inf. Syst. Res. 2003, 14, 189–217. [Google Scholar] [CrossRef] [Green Version]
  83. Podsakoff, N.; Shen, W.; Podsakoff, P. The Role of Formative Measurement Models in Strategic Management Research: Review, Critique, and Implications for Future Research. Res. Methodol. Strategy Manag. 2006, 3, 197–252. [Google Scholar] [CrossRef]
  84. Hair, J.F.; Sarstedt, M.; Ringle, C.M. Rethinking some of the rethinking of partial least squares. Eur. J. Mark. 2019, 53, 566–584. [Google Scholar] [CrossRef]
  85. Chin, W. The Partial Least Square Approach to Structural Equation Modelling; Marcoulides, E.G., Ed.; Modern Methods for Business Research, Lawrence Erlbaum: Mahawah, NJ, USA, 1998; pp. 295–369. [Google Scholar]
  86. Hair, J.; Hult, G.; Ringle, C.; Sarstedt, M. A Primer on Partial Least Square Structural Equation Modeling (PLS-SEM); Sage: Thousand Oaks, CA, USA, 2017. [Google Scholar]
  87. Hair, J.; Sarstedt, M.H.; Hopkins, L.; Kuppelwieser, V.G. Partial Least Squares Structural Equation Modeling (PLS-SEM): An Emerging Tool for Business Research. Eur. Bus. Rev. 2014, 26, 106–121. [Google Scholar] [CrossRef]
Figure 1. The research model and hypotheses.
Applsci 11 00199 g001
Figure 2. Direct effects model.
Applsci 11 00199 g002
Figure 3. Mediated effects model.
Applsci 11 00199 g003
Table 1. Variables (constructs)/indicators.
Senior Management SupportSupporting Contributions: [52,53,57].
SMS1: Project team members are rewarded for learning new skills.
SMS2: BIM effectiveness has promoted innovate mindsets and risk-talking.
SMS3: New ideas originated in project design by clients/promoter/contractor/are easy to implement. SMS4: Meetings where problems and alternative solutions are raised are frequently held.
SMS5: Show the approximate percentage of success in problems raised by the project team.
Technological LearningSupporting Contributions: [26,60].
TL1: The project team has gained knowledge in BIM technology by attending external training courses.
TL2: Thanks to internally hiring experts, the project team gains knowledge in BIM technology.
TL3: Any knowledge gained from BIM technology is applied to all stages of the building or infrastructure life cycle (design, construction, and operation).
TL4: Indicate the number of years using BIM technology when carrying out projects.
Collaborative CultureSupporting Contributions: [65,66,67,68].
CCU1: The project team supports and helps each other during the development of the project.
CCU2: There is a willingness to share responsibilities in the event of failure.
CCU3: The relationships between the different project agents have improved with the BIM methodology.
CCU4: The company tries to expand mutual collaboration with other design companies.
CCU5: Professional social networks (LinkedIn, etc.) are normally used to collaborate with other companies in carrying out projects.
BIM EffectivenessSupporting Contributions: [46,47,48,49].
BIME1: The project team knows the functionality of BIM applications regarding 3D modeling and design.
BIME2: The project team knows the functionality of BIM 4D applications to carry out time planning.
BIME3: The project team knows the functionality of BIM 5D applications for cost and budget studies.
BIME4: The project team knows the functionality of BIM 6D applications for the study of energy efficiency and sustainability (energy savings).
BIME5: Tools are used to detect interferences between services and project facilities.
BIME 6: Indicate which dimensions of BIM you are using in the company.
BIME7: Indicate the approximate percentage of the project completion with BIM tools.
Table 2. Descriptive statistics of the sample.
Type of BIM CompanyPercentageNumber of Years Using BIMPercentage
Architecture48.9%Under 19.7%
Engineering facilities30.4%1–216.1%
Civil engineering Architecture20.7%2–310.8%
Company SizePercentageOver 363.4%
Micro companies (under 10)68.1%Project Fulfillment with BIM ToolsPercentage
Small companies (11–50)22.3%Under 20%8.5%
Medium companies (51–250)8.5%20–40%12.8%
Big companies (over 250)1.1%40–60%21.3%
Annual Turnover € Million (Euros)Percentage60–80%17%
Under 280.4%Over 80%40.4%
2–1015.2%
10–503.9%
Over 500.5%
Table 3. Measurement model results.
Senior Management SupportWeightT-ValueVIFTechnological LearningWeightT-ValueVIF
SMS10.224 *1.6461.658TL10.104 NS0.9041.126
SMS20.591 ***3.8821.660TT2---
SMS3---TT30.720 ***5.7981.062
SMS40.362 **2.5541.614TT40.623 ***4.8281.148
SMS5---
Collaborative CultureWeightT-ValueVIFBIM EffectivenessWeightT-ValueVIF
CCU10.530 ***4.1921.204BIME10.255 *1.7541.812
CCU2---BIME2---
CCU30.613 ***5.4231.233BIME3---
CCU4---BIME40.307 *2.2391.421
CCU50.211 *2.1541.033BIME50.186 NS1.3981.570
BIME60.235 *1.9431.205
BIME70.427 ***3.4641.523
*** p < 0.001, ** p < 0.01, * p < 0.05, NS: not significant (based on t (4999), one-tailed test), t(0.05, 4999) = 1.645; t(0.01, 4999) = 2.327; t(0.001, 4999) = 3.092.
Table 4. Structural model results.
Direct Effects ModelPath Coefficient “β” (T-Value)
VIF (SMS → BIME) = 2.1263C = 0.698 *** (14.959)
BIM EffectivenessR2 = 0.487
Mediated effects modelCoefficient Path “β” (T-valor)
VIF (SMS → TL) = 1.0000
VIF (TL → BIME) = 1.6145
VIF (SMS → CCU) = 1.0000
VIF (CCU → BIME) = 1.9113
VIF (SMS → BIME) = 2.1263
A = 0.672 *** (11.325)
B = 0.310 ** (2.090)
a’ = 0.592 *** (10.512)
b’ = 0.418 *** (4.254)
c’ = 0.213 NS (1.560)
Technological learningR2 = 0.350
Collaborative cultureR2 = 0.451
BIM effectivenessR2 = 0.648
*** p < 0.001, ** p < 0.01, * p < 0.05, NS: not significant (based on t (4999), one-tailed test), t(0.05, 4999) = 1.645; t(0.01, 4999) = 2.327; t(0.001, 4999) = 3.092.
Table 5. Hypothesis testing and mediation analysis.
H2(+): SMS → TL → BIME
β (SMS → TL)
p = 0.0000
Percentile 95% confidence intervalβ (AT → BIME)
p = 0.0000
95% confidence interval
0.672 ***(0.4533–0.6545)0.310 **(0.2399–0.5547)
H3(+): SMS → CCU → BIME
β (SMS → BIME)
p = 0.0000
Percentile 95% confidence intervalβ (CCU → BIME)
p = 0.0178
95% confidence interval
0.592 ***(0.5280–0.7442)0.418 ***(0.0208–0.5076)
VAF = (Indirect effect/Total effect) × 100 = 68.15%
Indirect effect = (a × b) + (a’ × b’)
Total effect = direct effect + indirect effect = c’+ (a × b) + (a’ × b’)
*** p < 0.001, ** p < 0.01, * p < 0.05, NS: not significant (based on t(4999), one-tailed test), t(0.05, 4999) = 1.645; t (0.01, 4999) = 2.327; t (0.001, 4999) = 3.092.
Publisher’s Note: MDPI stays neutral with regard to jurisdictional claims in published maps and institutional affiliations.

