Article

Modification of Olive Leaves’ Surface by Ultrasound Cavitation. Correlation with Polyphenol Extraction Enhancement

by
Natacha Rombaut
1,
Tony Chave
2,*,
Sergey I. Nikitenko
2,
Mohamed EI Maâtaoui
3,
Anne Sylvie Fabiano-Tixier
1 and
Farid Chemat
1,*
1
INRAE, UMR 408, GREEN Extraction Team, Avignon University, F-84000 Avignon, France
2
ICSM, CEA, CNRS, University Montpellier, ENSCM, F-30207 Bagnols-sur-Cèze, France
3
UMR Qualisud, Avignon University, F-84000 Avignon, France
*
Authors to whom correspondence should be addressed.
Appl. Sci. 2021, 11(1), 232; https://doi.org/10.3390/app11010232
Submission received: 6 December 2020 / Revised: 22 December 2020 / Accepted: 25 December 2020 / Published: 29 December 2020
(This article belongs to the Collection Ultrasound in Extraction Processing)

Abstract

:

Featured Application

There are more than 1000 articles in literature dealing with positive impacts of Ultrasound-Assisted Extraction (UAE) such as reduction of extraction time, diminution of solvent and energy used, enhancement in yield and even selectivity, intensification of diffusion, and eliminating wastes. The study permits to highlight how ultrasound impacted olive leaves by a single or different mechanisms in function of ultrasound power, and therefore, it will permit for a better design for industrial reactors.

Abstract

We investigated the impact of ultrasound at 20 kHz on olive leaves to understand how acoustic cavitation could increase polyphenol extraction. Application of ultrasound to whole leaf from 5 to 60 min enabled us to increase extraction from 6.96 to 48.75 µg eq. oleuropein/mL of extract. These results were correlated with Environmental Scanning Electron Microscopy, allowing for leaf surface observation and optical microscopy of treated leaf cross sections to understand histochemical modifications. Our observations suggest that the effectiveness of ultrasound applied to extraction is highly dependent on plant structure and on how this material will react when subjected to acoustic cavitation. Ultrasound seems to impact the leaves by two mechanisms: cuticle erosion, and fragmentation of olive leaf surface protrusions (hairs), which are both polyphenol-rich structures.

1. Introduction

Green technologies such as ultrasound are being increasingly investigated, aiming both at process intensification and meeting the goals of sustainable processes [1,2,3]. Extraction of natural products (e.g., bioactive compounds such as essential oil, antioxidants, oil, and dyes) implies the recovery of compounds that are often of low occurrence in a plant matrix [4,5]. In this field, the understanding of solid–liquid extraction, and how green technologies can improve extraction, appear as key issues for an enhanced control of extraction.
The effectiveness of ultrasound for natural product extraction has been widely reviewed [5,6,7,8,9,10,11]. In fact, when submitted into a liquid, ultrasonic irradiation can induce the nucleation, growth, and collapse of bubbles filled with solvent vapor and dissolved gas [12]. This phenomenon, known as acoustic cavitation, is actually at the origin of various physical and chemical effects due to the extreme local conditions obtained during the bubble collapse [13,14]. Applied during extraction, ultrasound reduces extraction duration to 30 min instead of hours, and increases the yield by 5 to 30%, of monitored compounds compared with conventional extraction processes such as maceration.
Reported mechanisms for this mass-transfer enhancement are generally attributed to cell disruption correlated with implosion of cavitation bubbles on a vegetable surface. A previous research team demonstrated that power ultrasound (20 kHz) specifically impacts cellular structures such as excretion hairs of pot marigold [15]. This research team also highlighted that ultrasound improves the swelling of plants immersed in a solvent [16]. In a more recent review, several mechanisms impacting plant structure were identified (sonoporation, detexturization, erosion, fragmentation, local shear stress, and sonocapillarity) [17]. However, the relationship between the physical impacts of ultrasound on plant matrices and extraction enhancement has rarely been investigated.
Within this objective, we investigated the impact of ultrasound at 20 kHz on polyphenol extraction, taking the example of olive leaves. Olive leaves contain valuable polyphenols such as oleuropein, tyrosol, and hydroxytyrosol, which can be valorized after an extraction step. The positive impact of ultrasound on polyphenol extraction from olive leaves in an organic solvent (e.g., ethanol/water mixtures) or in olive oil has been reported in previous studies [18,19,20,21].
To understand further the mechanical action of ultrasound, a multiscale analysis of the leaf correlated with polyphenol extraction yield is needed. For this, we exposed a single leaf to an ultrasonic field. The extraction solvent was analyzed to determine its polyphenol content. The treated leaf was examined by Environmental Scanning Electron Microscopy (ESEM) for surface observation and a histochemical study was conducted to evaluate modifications generated by ultrasound at the tissue level. This study aims to observe how ultrasound affects whole olive leaves from a histological point of view, and assess if those observations are correlated with polyphenol extraction.

2. Materials and Methods

2.1. Raw Material and Chemicals

Dried olive leaves (Olea europaea L.) were collected in Avignon and used without any preparation prior to the extraction process. The initial moisture content of leaves was determined by dehydration at 105 °C, using a moisture analyzer (MB35, OHAUS, Nanikon, Switzerland), and was found to be 8.13% ± 0.03%. For the extraction solvent, demineralized water with a resistivity higher than 18.2 MΩ cm at 25 °C (Milli-Q system, Merck Millipore, Danvers, MA, USA) and food-grade ethanol 96° (Cristalco, France Alcools, Paris, France) were used. Standards for HPLC analysis used were oleuropein (≥98% purity, Sigma-Aldrich, Burlington, MA, USA), hydroxytyrosol (99.5% purity, Chromadex, Los Angeles, CA, USA), and tyrosol (≥99% purity, Extrasynthèse, Paris, France). For extract solubilization and total polyphenol assay, analytical-grade methanol from VWR (Los Angeles, CA, USA), Na2CO3, and Folin–Ciocalteu reagent (Merck Millipore, Berlin, Germany) were used. For HPLC analysis, solvents used were all HPLC grade: acetonitrile, water, methanol, formic acid, and trifluoroacetic acid (TFA, Sigma-Aldrich, Danvers, MA, USA). For histology, historesine (Technovit 7100, Heraeus Kulzer GmbH, Berlin, Germany) was used.

2.2. Extraction Procedures

All extractions were performed using EtOH/H2O (80/20, mL/mL) as solvent, as this ratio classically allows for recovery of olive leaves’ polyphenols [22,23].

2.2.1. Ultrasound-Assisted Extraction (UAE)

To evaluate the effect of acoustic cavitation on olive leaves, one single leaf was subjected to an ultrasonic field and further characterized in order to evaluate the physical impacts on the leaf. Leaves were sonicated systematically on the lower surface side (abaxial). The experimental sample holder used in this study allowed for the reproducible exposition of the central part of the leaf to an ultrasonic field (Figure 1).
Sonication of the leaf was achieved using 20 kHz ultrasound equipment (Vibra-Cell VCX-750, 750 W, Sonics, Newtown, CT, USA), equipped with a titanium alloy probe of 1 cm² irradiating surface area. Once the leaf was placed in the reactor, the probe was placed reproducibly at 0.5 cm above the leaf. The reactor was filled with 200 mL of solvent (EtOH/H2O, 80/20, mL/mL). Maximal amplitude (100%) was set on the ultrasound equipment to continuous mode, corresponding to a measured specific delivered energy of 0.36 W/mL. Solvent temperature was maintained at 20 °C ± 3 °C using a chiller (Ministat 240 CC, Huber, Berching, Germany) connected to the double jacket of the reactor. UAE experiments were performed for 3 durations: 5 min, 15 min, and 60 min to highlight a progressive impact of ultrasound on the leaf. An impacted zone exposed to the ultrasonic field was clearly identified (at the center of the leaf). Leaf-surface analysis was conducted on this zone. This way, the impact of acoustic cavitation could be specifically investigated. All extractions and analyses were performed at least three times.

2.2.2. Control Extraction: Stirring

Control extractions were made using the same apparatus and leaf fixation as described in Section 2.2.1. After leaf positioning, the reactor was filled with 200 mL of solvent (EtOH/H2O, 80/20, mL/mL). The ultrasound probe was replaced by a stirring blade fixed to a motorized stirrer (RW16 basis, Ika, Berlin, Germany) set at 200 rpm. Solvent temperature was maintained at 20 °C by a chiller (Ministat 240, Huber, Berching, Germany). Control experiments without ultrasonic irradiation were carried out for two durations: 5 min and 60 min, so as to assess the effect of stirring alone for the chosen extremum duration conditions.
All extraction solvents from UAE and control extraction experiments were recovered after extraction (200 mL ± 10 mL). Each solvent was evaporated at 40 °C under vacuum to concentrate the extract until dryness. For polyphenol determination, the dried extract was solubilized in 2 mL of MeOH/H2O, and homogenized using an ultrasonic bath for 5 min.

2.3. Characterization Procedures

2.3.1. Total Polyphenol Content Assay

Total polyphenol content in concentrated (ethanolic) extracts dissolved in methanol was quantified using the Folin–Ciocalteu assay adapted from Singleton et al. (1999) [24]. To 50 µL of extract was added 1250 µL of Folin–Ciocalteu reagent (diluted 5-fold in distilled water). The mixture was vortexed for 5 s and left still for 1 min. One milliliter of Na2CO3 (100 g/L) was added to the mixture and vortexed for 5 s. The mixture was placed in the dark at ambient temperature for 45 min. After filtration at 0.45 µm, the absorbance of samples was measured at 760 nm using a UV-Vis spectrophotometer (UV-1800, Shimadzu, Japan). Quantification was made by external calibration using an oleuropein standard. Results are expressed as micrograms of Oleuropein Equivalent (eq. O) per mL of extract.

2.3.2. Oleuropein, Tyrosol, and Hydroxytyrosol Assay by HPLC

The apparatus used was an HPLC (Agilent 1100, Agilent Technologies, Santa Clara, CA, USA) equipped with a Diode Array Detector (DAD). For oleuropein, the sample (2 μL injected) was eluted through a C18 column (1.8 µm, 4.6 mm × 50 mm, Zorbax Eclipse XDB-C18, Agilent Technologies, Santa Clara, USA) maintained at a constant temperature of 40 °C. Separation of oleuropein was made by a binary solvent (A and B), at 1.5 mL/min. Solvent A was composed of water: TFA (trifluoroacetic acid) (99.9:0.1, mL/mL), and solvent B was acetonitrile: TFA (99.9:0.1, mL/mL). The elution gradient was (percentages of solvent B are indicated): 0 to 2.6 min: 20%, 2.6 to 2.7 min: 100%, and 2.7 to 3.5 min: 100%.
For tyrosol and hydroxytyrosol, the sample (10 μL injected) was eluted through a C18 column (3 µm, 4.6 mm × 150 mm, Luna C18, Agilent Technologies, Santa Clara, CA, USA) maintained at a constant temperature of 25 °C. Separation of tyrosol and hydroxytyrosol was made by a binary solvent (A and B) at 0.5 mL/min. Solvent A was composed of water: formic acid (99.9:0.1, v/v), and solvent B was acetonitrile (100%). The elution gradient was (percentages of solvent B are indicated): 0 to 25 min: 10%, and 25 to 30 min: 100%. Oleuropein, tyrosol, and hydroxytyrosol were detected at a wavelength of 280 nm and quantification was made by external calibration. Analysis of oleuropein, tyrosol, and hydroxytyrosol was performed only once.

2.4. Microscopic Analyses: Histochemical and Structural Analysis

2.4.1. Environmental Scanning Electron Microscopy

Whole leaf (untreated, after stirring and after UAE) without preliminary preparation was observed by Environmental Scanning Electron Microscopy (ESEM). ESEM was performed on a FEI Quanta 200 FEG (Fei Company, OR, USA) operated at 15 kV, under vacuum (39.7 Pa). All images presented in this study were taken using back-scattered electron imaging mode.

2.4.2. Histochemistry

Histological comparison of untreated leaf, leaf submitted to stirring, and to UAE was assessed using 3 µm-thick microtome sections stained with Toluidine Blue O (TBO), which is a phenol-revealing histochemical dye [25]. Sample preparation was made as previously described [26]. Samples were sectioned by a microtome (Supercut 2065, Reichert-Jung, Leica Microsystems, Berlin, Germany) and mounted on glass microscope slides as previously described [27]. Slides containing sections were dehydrated (at 35 °C, overnight in an oven),stained for 5 min in 0.05% TBO, and examined using a light microscope (Leica DM 2000, Leica Microsystems, Berlin, Germany) equipped with a digital camera (DFC 300 FX, Leica Microsystems, Berlin, Germany) for image capture. Fourteen (14) tissue fragments were examined for each treatment to check representativeness and the clearest image was selected for this paper.

3. Results and Discussion

3.1. Impact of Ultrasound on Extraction Performances

The effect of acoustic cavitation on extraction performances of phenolic compounds was assessed by submitting the leaves to increasing sonication durations (5 min, 15 min, and 60 min). Control experiments were performed using stirring to evaluate the impact of the immersion of solvent on the leaves. Results expressed in terms of extraction yield and extract composition in phenolic compounds are presented in Table 1. Results show an increase in polyphenol concentration in extract with increasing sonication duration (from 6.96 µg eq. O/mL to 48.75 µg eq. O/mL for sonication duration from 5 min to 60 min, respectively). Given the yields obtained by stirring extractions (0.36 and 1.46 µg eq. O/mL for stirring durations from 5 to 60 min), it can be concluded that ultrasound led to a sharp increase in polyphenol extraction. This effect has been reported by other authors for extraction of polyphenol from olive leaves [28,29].
Polyphenol composition indicates that oleuropein was the major polyphenol extracted (up to a concentration of 28.16 µg/mL for 60 min of sonication, Table 1). Hydroxytyrosol extraction seemed to be mainly impacted by the type of process used: hydroxytyrosol concentration in extracts is close to zero for stirring and for all durations of ultrasound-assisted extraction, its concentration is comprised between 0.20 and 0.26 µg/mL. Tyrosol concentrations in extracts are very low, which could be due to the fact that the batch of leaves contained low amounts of tyrosol. In the literature, oleuropein is reported as the major polyphenol extracted from olive leaves and hydroxytyrosol, in a lesser proportion, is also a characteristic phenolic in olive leaves [30,31]. Oleuropein and hydroxytyrosol account for less than 50% of total phenolic compounds extracted (Table 1). Other phenolic compounds have been identified in olive leaf extracts in previous studies (e.g., verbascoside, apigenin-7-glucoside, and luteolin-7-glucoside [30,31]).

3.2. Investigations on the Effect of Ultrasound on the Structure of an Olive Leaf

3.2.1. Examination of Leaf Surface

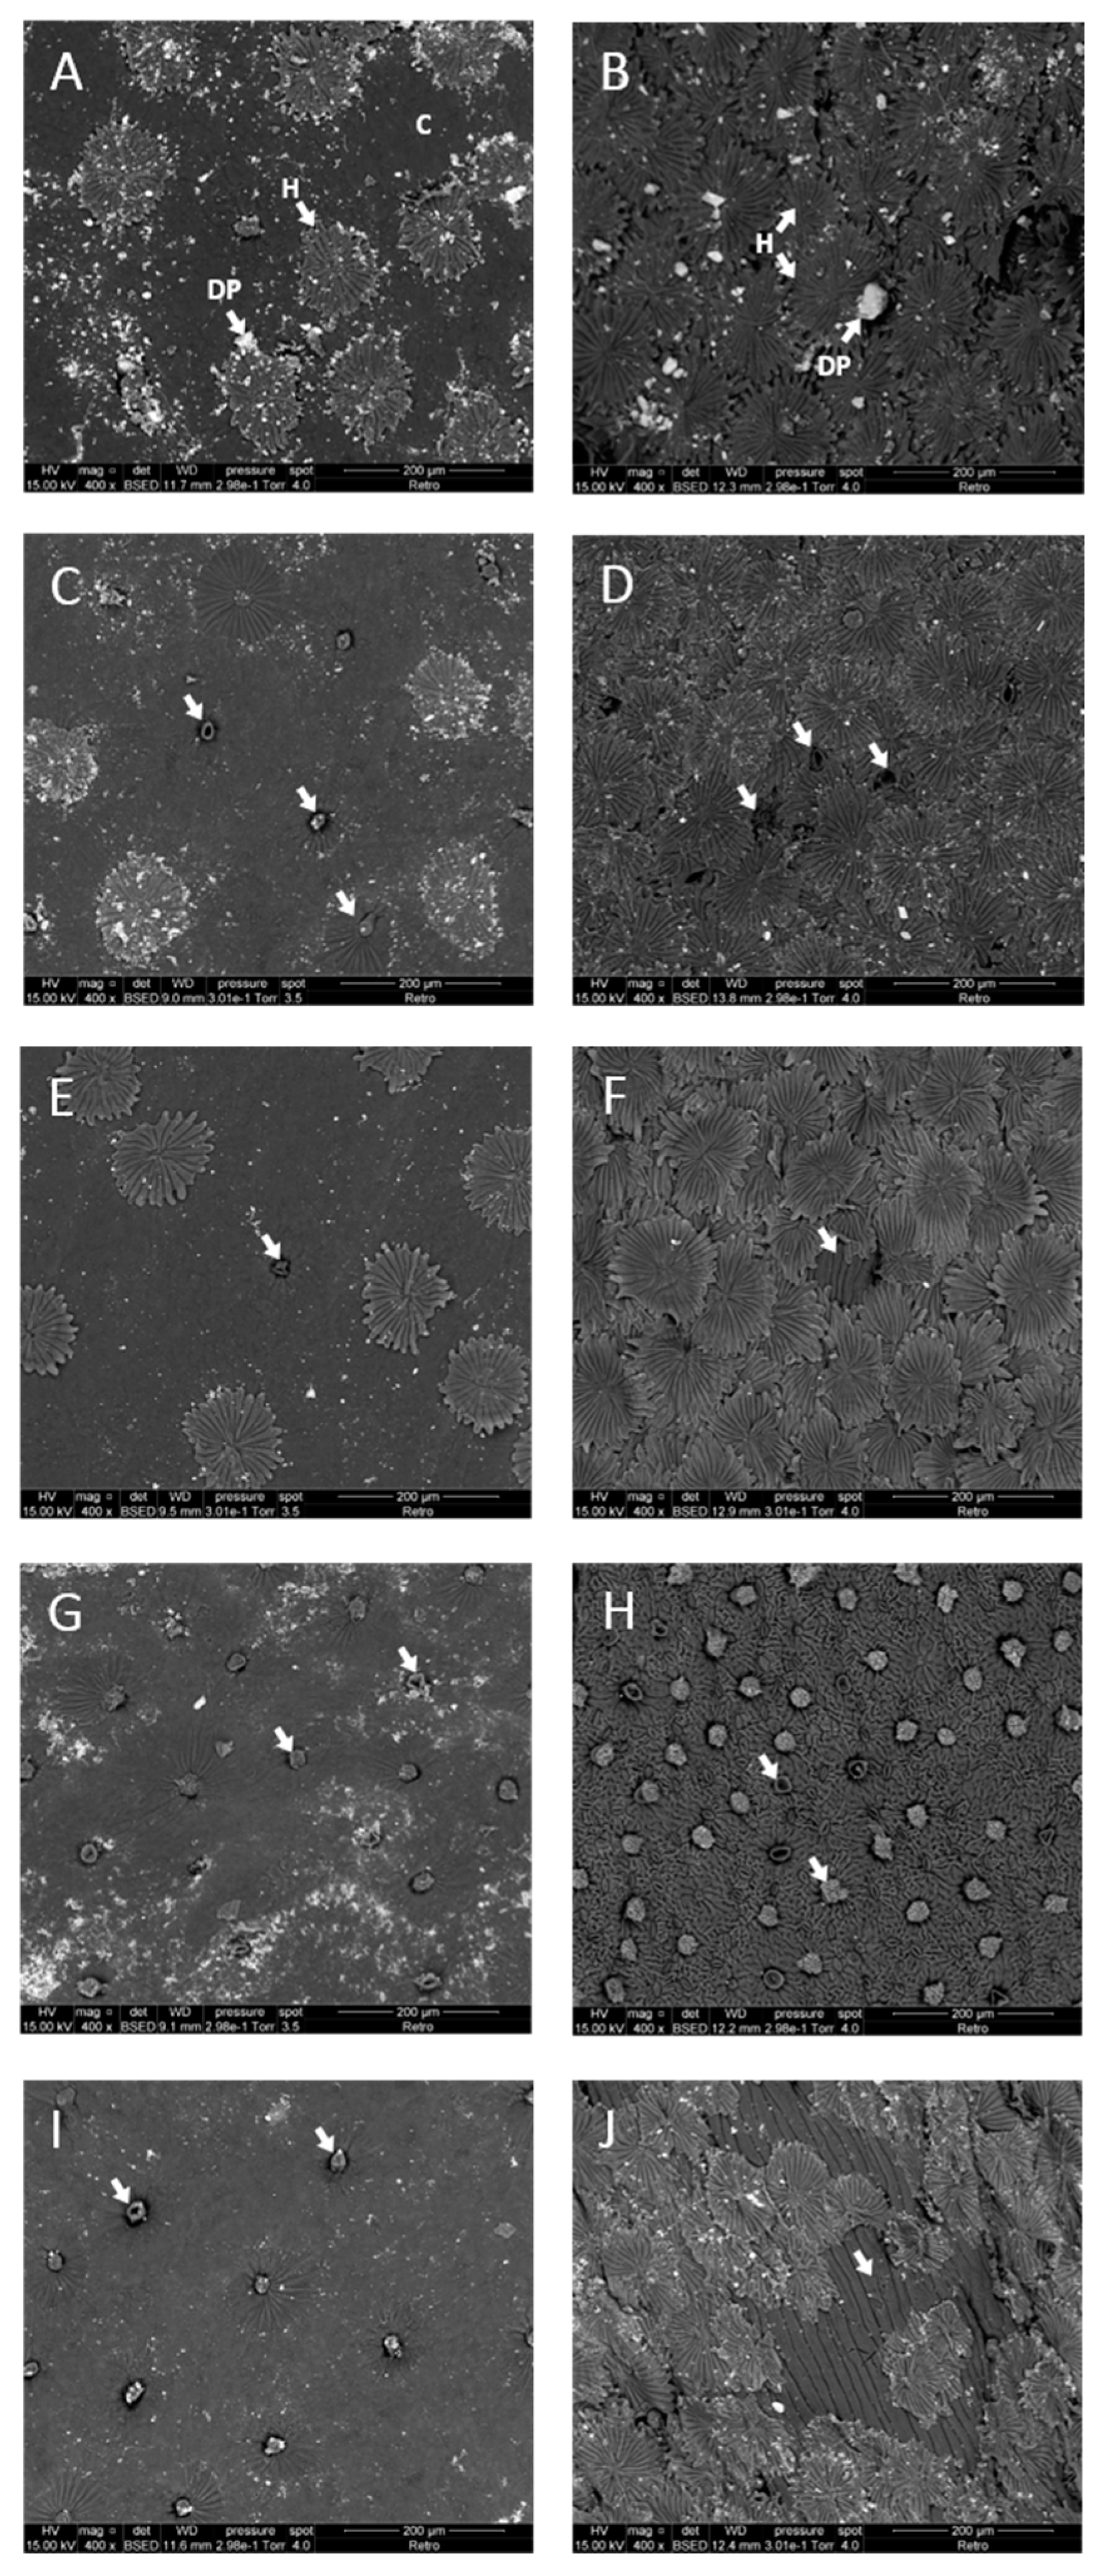
Leaf surfaces were examined using ESEM, which does not require any preparation, so a whole leaf could be observed as is. In order to evaluate the impact of ultrasound on leaves, we compared an untreated leaf, a control leaf (after 60 min of stirring), and leaves treated by ultrasound for 5 min, 15 min, and 60 min (Figure 2). Leaves were observed on both surfaces: adaxial (upper surface) and abaxial (lower surface). Observations were conducted on the center of the leaf, corresponding to the exposed area to the ultrasonic field.
On the control leaf, it was noted the presence of umbrella-like structures, referred to in the literature as non-glandular multicellular hairs [32]. On the abaxial surface, such structures overlapped and recovered the surface of the leaf (Figure 2B), which was not the case on the adaxial surface where hairs were less numerous and more spaced (Figure 2A). Olive leaf hairs are reported to be protective against UV, water loss, and probably insect and pathogen attacks [33]. Furthermore, white particles could be noted on both surfaces of the leaf, which could be dust particles (Figure 2A,B). After 60 min of stirring, it was noted the removal of a few hairs on both surfaces of the leaves (Figure 2C,D), implying that the sole action of solvent stirring led to a partial removal of some hairs. As for the control leaf, dust-like particles were still present on both surfaces of the leaf (Figure 2C,D).
For leaves submitted to ultrasound, a gradual effect was noticed (Figure 2E–J). Increasing sonication duration from 5 min to 60 min led to sharp modifications of the leaf surface in terms of hair coverage and structure. On the adaxial surface, it appeared that increasing sonication duration resulted in increasing hair removal: after 5 min of sonication, the majority of hairs were still present on the leaf surface (Figure 2E), while after 15 min and 60 min of sonication, the surface was cleared of hairs (Figure 2G,I). A different trend was noticed on the abaxial surface. If after 5 min of sonication, no modification of hair coverage was noticed (Figure 2F), 15 min of sonication led to a complete removal of all hairs (Figure 2H), whereas it was not the case for 60 min of sonication. In the latter case, a partial removal of hairs was noted (Figure 2J). For all ultrasound-treated leaves, dust-like particles were less numerous, suggesting that ultrasound induced local erosion. It is well-known that ultrasound can be used to mechanically remove small particles [34], which also seems to have been the case in our experiments. Overall, we could not notice impacts on the cuticle due to the implosion of cavitation bubbles, and unlike other studies, it could not be concluded that cavitation leads to cell breakage [35]. In our experimental conditions, it appeared that the predominant effect of ultrasound was the removal of plant structures occurring on the surface of the leaves, which is in accordance with the findings of Toma et al. [15].

3.2.2. Histological Structure of the Leaf

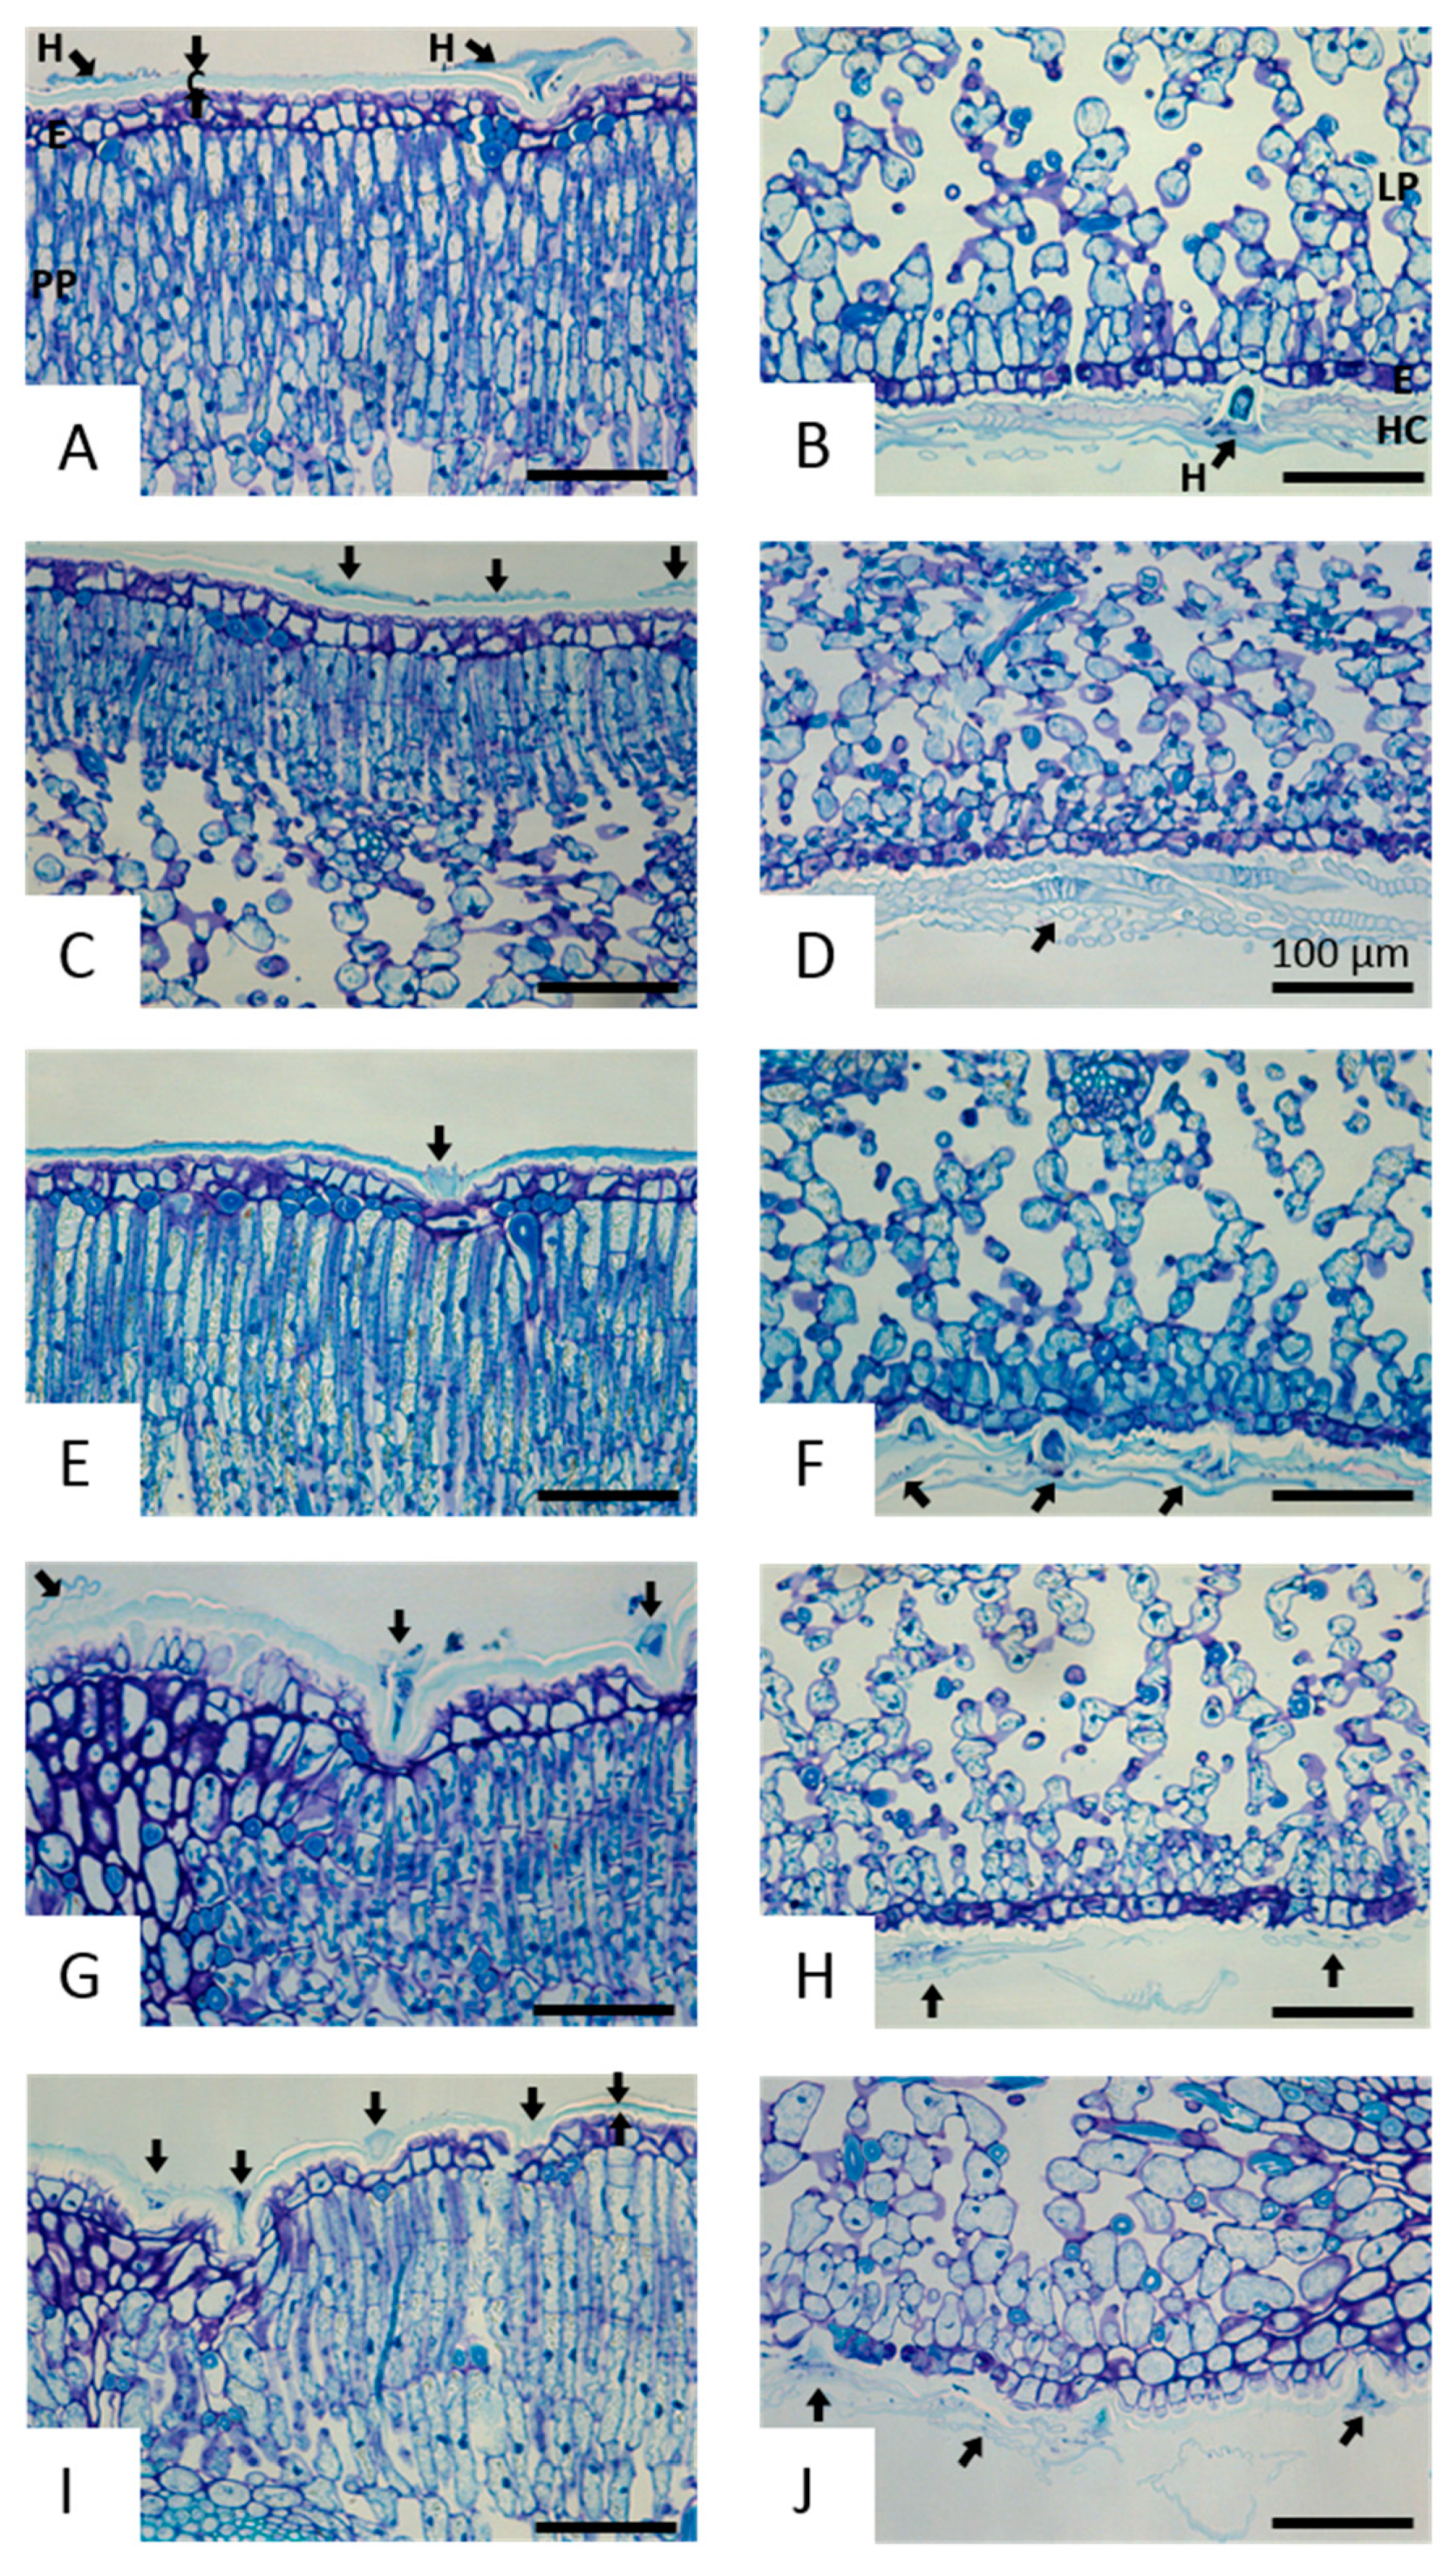
To establish a link between polyphenol extraction enhancement by ultrasound and modifications noticed on the leaf surface, a histology study was conducted. Leaf sections were stained with toluidine blue O (TBO) to localize phenolic compounds. For homogeneity, the leaves from the same experimental conditions as ESEM were compared in Figure 3.
For the control leaf, TBO stained the hair as well as the cuticle (Figure 3A). As shown in ESEM observations, the abaxial surface was covered with hairs (Figure 3B). From the coloration intensity distribution with TBO, we concluded that the feet of hairs were particularly rich in phenolics. Flavonoids have been identified in hairs and in the epicuticular wax of olive leaves [33,36]. The authors also showed that in mature olive leaves, phenolic compounds tend to be concentrated in the wall of cells composing the hairs [33], converging towards the hypothesis of a protective action of hairs against UV. Both parenchymas (palisadic and spongy) were also strongly stained with TBO (Figure 3A,B). The structure of the control leaf (Figure 3C,D) was identical to the one of the untreated leaf.
The histology of ultrasound-treated leaves showed modifications located at the surface of the leaves. A 5 min ultrasound duration seemed to impact the adaxial surface with hair removal (Figure 3E); however, on the abaxial surface, the hair coverage was still high (Figure 3F). After 15 min of sonication, modifications of hair structure occurred. On the adaxial surface, hairs seemed to be dissociated (Figure 3G) or otherwise totally removed (Figure 3I). Additionally, the cuticle thickness seemed to be reduced on the leaf sonicated for 60 min (Figure 3I). On the abaxial surface, for both 15 min and 60 min of sonication, hairs seem to be emptied, destructured, and less numerous (Figure 3H,J). These observations have never been reported, and the majority of published studies were performed on olives’ leaves ground prior to extraction.
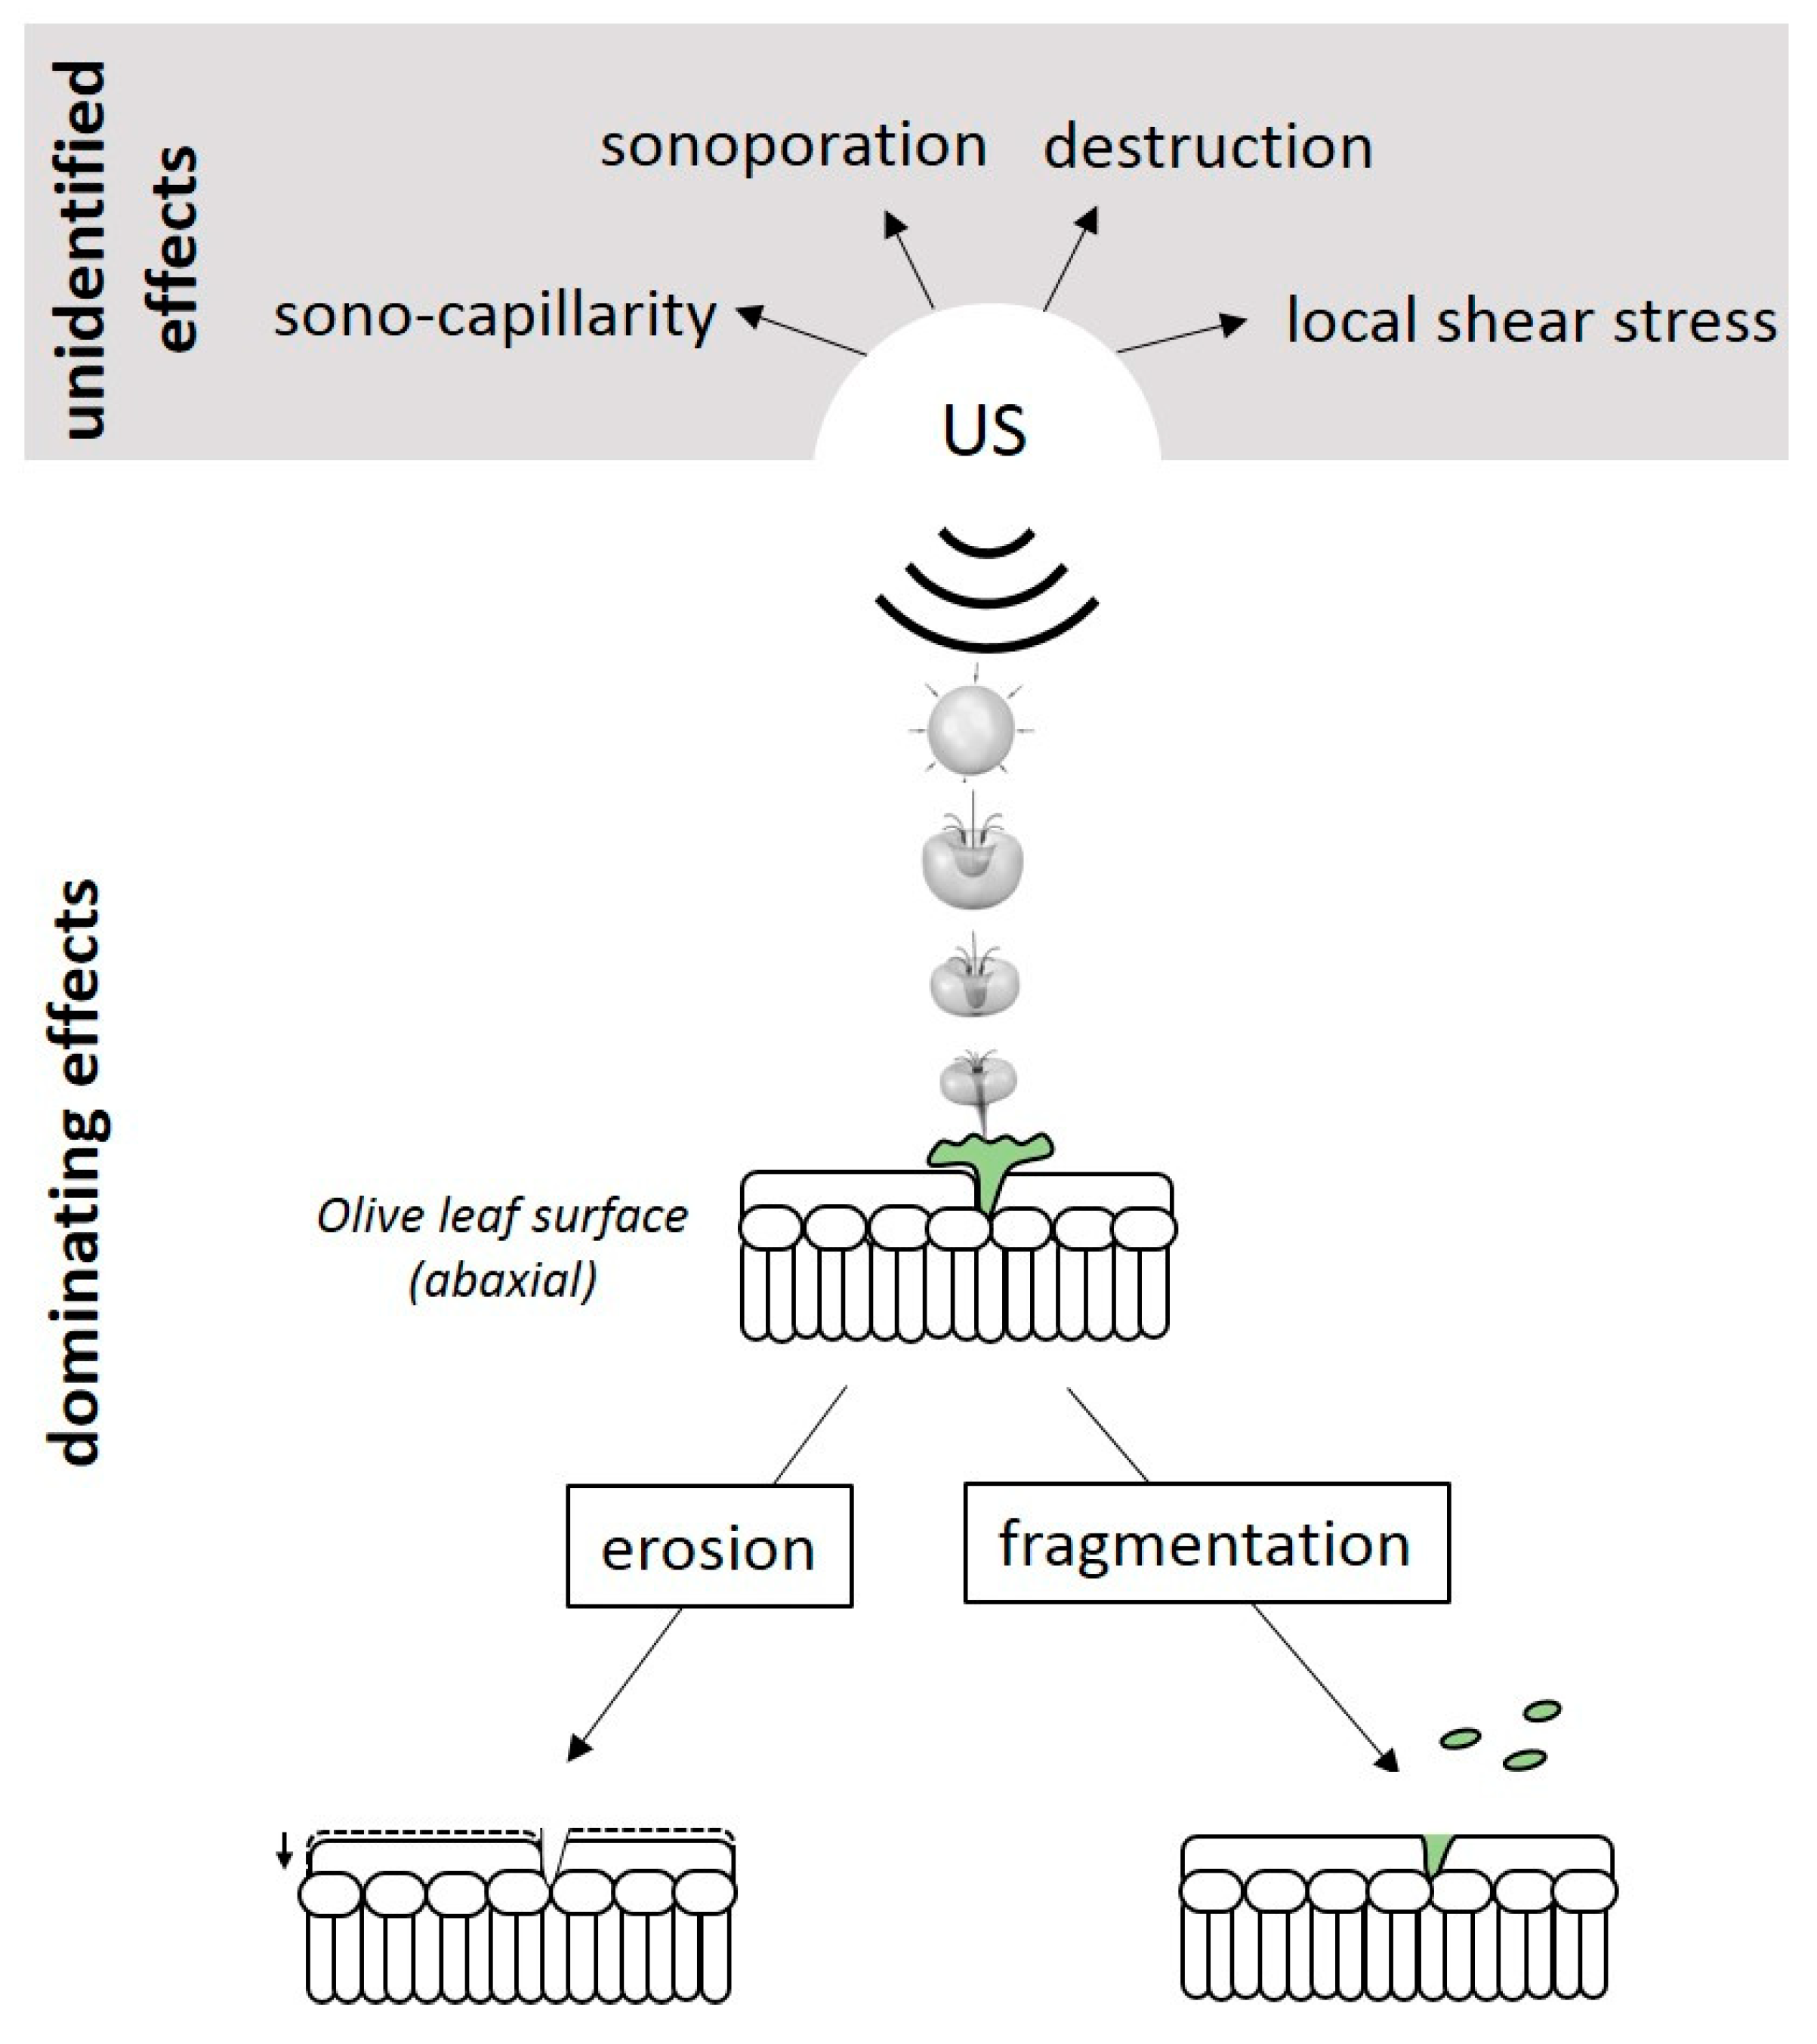
Considering leaf surface observations and the histological structure of tissues stained with TBO, we can suggest two types of mechanisms occurring when ultrasound is applied: erosion and fragmentation (Figure 4) [17]. Observations point out that on nongrinded leaves, ultrasound acts mainly on the surface of the leaves; impacted structures are hairs and probably the cuticular layer of the adaxial surface of the leaves. Ultrasound tends to sever hairs, leaving their foot (probably rich in phenolic compounds given that they are strongly stained in blue by TBO) accessible to solvent and hence unveiling the cuticle beneath the hairs. This implies that ultrasound contributes to maximize the surface area of phenolic-containing structures and hence to enhance the accessibility of phenolics to the solvent.
The effect of ultrasound was noticed after 5 min of sonication, but an increasing sonication duration (up to 60 min) led to the complete removal of hairs on the adaxial surface. On the abaxial surface, only a partial removal of hairs was noted after 60 min of sonication. Correlating these observations with polyphenol extraction, it could be concluded that the yield increase was probably due to a mechanical action of cavitation bubble implosion on the adaxial surface rather than on the abaxial surface although the latter was exposed to ultrasound.
When applying power ultrasound, there are different effects like microstreaming, cavitation, a “sponge effect”, and mechanical “opening” of canals in treated tissue [4]. Usually, researchers have reported the formation of free radicals, efficient release of compounds from intracellular space, faster drying, and faster freezing when using ultrasound as a pretreatment method. There is novel knowledge about macroscopic and microscopic effects of plant material. The authors studied the application of ultrasound in the extraction from rosemary leaves, Rosmarinus officinalis L. [37]. They suggested mechanisms and identify changes during ultrasound treatments of leaf structures. Ultrasound was compared to conventional processes, and the surfaces of untreated and treated leaves were examined by Scanning Electron Microscopy (SEM) and Environmental Scanning Electron Microscopy (ESEM). The authors also performed a cyto-histochemical study to analyze ultrasound-induced alterations on the inner structures. Considering macroscopic and microscopic investigation of leaf surface and cyto-histochemical study of tissues, we can suggest six types of mechanisms upon ultrasound treatment of plant tissue: erosion, shear forces, sonoporation, fragmentation, capillary effect, and detexturation. These mechanisms followed each other during ultrasound treatment, resulting in the gradual physical damage of tissues’ structure. Another study analyzed the effect of ultrasound on almond skin cells. SEM analysis of treated almond skins showed a noticeable impact of ultrasound on skin cells [38]. In the study with an ultrasound bath, the optimization of ultrasound process parameters (time, frequency, and solvent) was studied to obtain high extraction yields, and the recovery of phlorotannins and total phenols from Fucus vesiculosus [39]. Another aim was to assess the damage caused by ultrasound on algal cell surfaces using SEM analysis. From SEM images, it was shown that the cell surface of the initial seaweed biomass was intact and surrounded by other impurities and residual materials, while the cell surfaces of the control samples (without ultrasound treatment) appeared to be smooth with an increased number of pores that allowed for diffusion of bioactive compounds to the media. At the end of these studies, we can see that the effect of ultrasound depends on the type of plant material studied and that there is no standard procedure [40].

4. Conclusions

This study aimed at understanding structural modifications of olive leaves submitted to ultrasound irradiation at 20 kHz, and to correlate modifications with polyphenol extraction enhancement. Stirring during 60 min leads to low polyphenol extraction (1.46 µg eq. oleuropein/mL of extract), compared with sonication during 60 min (48.75 µg eq. oleuropein/mL of extract). ESEM and histology observations were performed to understand ultrasound’s impact on leaf surfaces. No structural changes were noticed on the leaf after stirring, unlike ultrasound-treated leaves. Ultrasound impacted the leaves’ surfaces by two mechanisms: cuticle erosion and hair fragmentation, which are both polyphenol-rich structures of olive leaves.

Author Contributions

Conceptualization, N.R., T.C., A.S.F.-T., S.I.N., M.E.M., and F.C.; methodology, N.R., T.C., A.S.F.-T., S.I.N., M.E.M., and F.C.; validation, N.R., T.C., A.S.F.-T., S.I.N., M.E.M., and F.C.; formal analysis, N.R., T.C., A.S.F.-T., S.I.N., M.E.M., and F.C.; investigation, N.R., T.C., A.S.F.-T., S.I.N., M.E.M., and F.C.; resources, N.R., T.C., A.S.F.-T., S.I.N., M.E.M., and F.C.; writing—review and editing, N.R., T.C., A.S.F.-T., S.I.N., M.E.M., and F.C.; funding acquisition, N.R., T.C., A.S.F.-T., S.I.N., M.E.M., and F.C. All authors have read and agreed to the published version of the manuscript.

Funding

No Funding.

Institutional Review Board Statement

Not applicable.

Informed Consent Statement

Not applicable.

Data Availability Statement

Not applicable.

Acknowledgments

The authors are grateful to Frédéric Fernandez from the Analytical and Electron Microscopy facility of the Montpellier 2 University for performing the ESEM study. This research did not receive any specific grant from funding agencies in the public, commercial, or not-for-profit sectors.

Conflicts of Interest

The authors declared no conflict of interest.

References

  1. Chemat, F.; Abert-Vian, M.; Cravotto, G. Green extraction of natural products: Concept and principles. Int. J. Mol. Sci. 2012, 13, 8615–8627. [Google Scholar] [CrossRef] [Green Version]
  2. Both, S.; Ditz, R.; Tegtmeier, M.; Jenelten, U.; Strube, J. Process engineering and product design for green extraction. In Green Extraction of Natural Products; Chemat, F., Strube, J., Eds.; Wiley-VCH: Singapore, 2015; pp. 37–70. [Google Scholar]
  3. Chemat, F.; Abert-Vian, M.; Fabiano-Tixier, A.-S.; Strube, J.; Uhlenbrock, L.; Gunjevic, V.; Cravotto, G. Green extraction of natural products. Origins, current status, and future challenges. TrAC Trends Anal. Chem. 2019, 118, 248–263. [Google Scholar] [CrossRef]
  4. Chemat, F.; Abert Vian, M.; Fabiano-Tixier, A.-S.; Nutrizio, M.; Režek Jambrak, A.; Munekata, P.E.S.; Lorenzo, J.M.; Barba, F.J.; Binello, A.; Cravotto, G. A review of sustainable and intensified techniques for extraction of food and natural products. Green Chem. 2020, 22, 2325–2353. [Google Scholar] [CrossRef] [Green Version]
  5. Croteau, R.; Kutchan, T.M.; Lewis, N.G. Natural products (secondary metabolites). In Biochemistry and Molecular Biology of Plant; Buchanan, W.G.B., Jones, R., Eds.; American Society of Plant Physiologists: Rockville, MD, USA, 2000; pp. 1250–1318. [Google Scholar]
  6. Cavalcanti, R.N.; Forster-Carneiro, T.; Gomes, M.T.M.S.; Rostagno, M.A.; Prado, J.M.; Meireles, M.A.A. Chapter 1 Uses and applications of extracts from natural sources. In Natural Product Extraction: Principles and Applications; Rostagno, M.A., Prado, J.M., Eds.; The Royal Society of Chemistry: Dorchester, UK, 2013; pp. 1–57. [Google Scholar]
  7. Tiwari, B.K. Ultrasound: A clean, green extraction technology. TrAC Trends Anal. Chem. 2015, 71, 100–109. [Google Scholar] [CrossRef]
  8. Proestos, C.; Komaitis, M. Ultrasonically assisted extraction of phenolic compounds from aromatic plants: Comparison with conventional extraction technics. J. Food Qual. 2006, 29, 567–582. [Google Scholar] [CrossRef]
  9. Cravotto, G.; Boffa, L.; Mantegna, S.; Perego, P.; Avogadro, M.; Cintas, P. Improved extraction of vegetable oils under high-intensity ultrasound and/or microwaves. Ultrason. Sonochem. 2008, 15, 898–902. [Google Scholar] [CrossRef]
  10. Vinatoru, M. An overview of the ultrasonically assisted extraction of bioactive principles from herbs. Ultrason. Sonochem. 2001, 8, 303–313. [Google Scholar] [CrossRef]
  11. Esclapez, M.D.; García-Pérez, J.V.; Mulet, A.; Cárcel, J.A. Ultrasound-assisted extraction of natural products. Food Eng. Rev. 2011, 3, 108–120. [Google Scholar] [CrossRef]
  12. Mason, T.J.; Lorimer, J.P. General Principles. In Applied Sonochemistry: Uses of Power Ultrasound in Chemistry and Processing; Mason, T.J., Lorimer, J.P., Eds.; Wiley-VCH: Weinheim, Germany, 2002; pp. 25–74. [Google Scholar]
  13. Leighton, T.G. The Acoustic Bubble; Academic Press: London, UK, 1994; pp. 439–565. [Google Scholar]
  14. Suslick, K.S.; Didenko, Y.; Fang, M.M.; Hyeon, T.; Kolbeck, K.J.; McNamara, W.B.; Mdleleni, M.M.; Wong, M. Acoustic cavitation and its chemical consequences. Philos. Trans. R. Soc. Lond. 1999, 357, 335–353. [Google Scholar] [CrossRef]
  15. Toma, M.; Vinatoru, M.; Paniwnyk, L.; Mason, T.J. Investigation of the effects of ultrasound on vegetal tissues during solvent extraction. Ultrason. Sonochem. 2001, 8, 137–142. [Google Scholar] [CrossRef]
  16. Saleh, I.A.; Vinatoru, M.; Mason, T.J.; Abdel-Azim, N.S.; Aboutabl, E.A.; Hammouda, F.M. A possible general mechanism for ultrasound-assisted extraction (UAE) suggested from the results of UAE of chlorogenic acid from Cynara scolymus L. (artichoke) leaves. Ultrason. Sonochem. 2016, 31, 330–336. [Google Scholar] [CrossRef]
  17. Chemat, F.; Rombaut, N.; Sicaire, A.-G.; Meullemiestre, A.; Fabiano-Tixier, A.-S.; Abert-Vian, M. Ultrasound assisted extraction of food and natural products. Mechanisms, techniques, combinations, protocols and applications. A review. Ultrason. Sonochem. 2017, 34, 540–560. [Google Scholar] [CrossRef] [PubMed]
  18. Şahin, S.; Şamlı, R. Optimization of olive leaf extract obtained by ultrasound-assisted extraction with response surface methodology. Ultrason. Sonochem. 2013, 20, 595–602. [Google Scholar] [CrossRef]
  19. Cifá, D.; Skrt, M.; Pittia, P.; Di Mattia, C.D.; Polkar Ulrih, N. Enhanced yield of oleuropein from olive leaves using ultrasound-assisted extraction. Food Sci. Nutr. 2018, 6, 1128–1137. [Google Scholar] [CrossRef] [PubMed]
  20. Irakli, M.; Chatzopoulou, P.; Ekateriniadou, L. Optimization of ultrasound-assisted extraction of phenolic compounds: Oleuropein, phenolic acids, phenolic alcohols and flavonoids from olive leaves and evaluation of its antioxidant activities. Ind. Crop. Prod. 2018, 124, 382–388. [Google Scholar] [CrossRef]
  21. Tarchoune, I.; Sgherri, C.; Eddouzi, J.; Zinnai, A.; Quartacci, M.F.; Zarrouk, M. Olive leaf addition increases olive oil nutraceutical properties. Molecules 2019, 24, 545. [Google Scholar] [CrossRef] [PubMed] [Green Version]
  22. Abaza, L.; Taamalli, A.; Nsir, H.; Zarrouk, M. Olive tree (Olea europeae L.) leaves: Importance and advances in the analysis of phenolic compounds. Antioxidants 2015, 4, 682–698. [Google Scholar] [CrossRef] [PubMed]
  23. Lee, O.-H.; Lee, B.-Y.; Lee, J.; Lee, H.-B.; Son, J.-Y.; Park, C.-S.; Shetty, K.; Kim, Y.-C. Assessment of phenolics-enriched extract and fractions of olive leaves and their antioxidant activities. Bioresour. Technol. 2009, 100, 6107–6113. [Google Scholar] [CrossRef]
  24. Singleton, V.L.; Orthofer, R.; Lamuela-Raventos, R.M. Analysis of total phenols and other oxidation substrates and antioxidants by means of Folin-Ciocalteu reagent. In Methods in Enzymology; Packer, L., Ed.; Academic Press Inc.: San Diego, CA, USA, 1999; pp. 152–178. [Google Scholar]
  25. O’Brien, T.P.; McCully, M.E. The Study of Plant Structure: Principles and Selected Methods; Termarcarphi Pty. Ltd.: Melbourne, Australia, 1981. [Google Scholar]
  26. Achat, S.; Tomao, V.; Madani, K.; Chibane, M.; El Maâtaoui, M.; Dangles, O.; Chemat, F. Direct enrichment of olive oil in oleuropein by ultrasound-assisted maceration at laboratory and pilot plant scale. Ultrason. Sonochem. 2012, 19, 777–786. [Google Scholar] [CrossRef]
  27. Wahib, W.; Maingonnat, J.-F.; Fleury, U.; El-Maataoui, M.; Renard, M.G.C. Evolution of cherries texture in brine: Impact of harvest conditions during long-time storage. LWT Food Sci. Technol. 2017, 75, 243–250. [Google Scholar] [CrossRef]
  28. Ahmad-Qasem, M.H.; Cánovas, J.; Barrajón-Catalán, E.; Micol, V.; Cárcel, J.A.; García-Pérez, J.V. Kinetic and compositional study of phenolic extraction from olive leaves (var. Serrana) by using power ultrasound. Innov. Food Sci. Emerg. Technol. 2013, 17, 120–129. [Google Scholar] [CrossRef]
  29. Japón-Luján, R.; Luque-Rodríguez, J.M.; Luque de Castro, M.D. Dynamic ultrasound-assisted extraction of oleuropein and related biophenols from olive leaves. J. Chromatogr. A 2006, 1108, 76–82. [Google Scholar] [CrossRef] [PubMed]
  30. Benavente-García, O.; Castillo, J.; Lorente, J.; Ortuño, A.; Del Rio, J.A. Antioxidant activity of phenolics extracted from Olea europaea L. leaves. Food Chem. 2000, 68, 457–462. [Google Scholar] [CrossRef]
  31. Silva, S.; Gomes, L.; Leitão, F.; Coelho, A.V.; Boas, L.V. Phenolic compounds and antioxidant activity of Olea europaea L. fruits and leaves. Food Sci. Technol. Int. 2006, 12, 385–395. [Google Scholar] [CrossRef]
  32. Liakopoulos, G.; Stavrianakou, S.; Karabourniotis, G. Trichome layers versus dehaired lamina of Olea europaea leaves: Differences in flavonoid distribution. UV-absorbing capacity, and wax yield. Environ. Exp. Bot. 2006, 55, 294–304. [Google Scholar] [CrossRef]
  33. Karabourniotis, K.G.; Fasseas, C.; Liakoura, V.; Drossopoulos, I. Polyphenol deposition in leaf hairs of Olea europaea (Oleaceae) and Quercus ilex (Fagaceae). Am. J. Bot. 1998, 85, 1007–1012. [Google Scholar] [CrossRef]
  34. Mason, T.J. Ultrasonic cleaning: An historical perspective. Ultrason. Sonochem. 2016, 29, 519–523. [Google Scholar] [CrossRef]
  35. Xie, P.J.; Huang, L.-X.; Zhang, C.-H.; You, F.; Zhang, Y.I. Reduced pressure extraction of oleuropein from olive leaves (Olea europaea L.) with ultrasound assistance. Food Bioprod. Process. 2015, 93, 29–38. [Google Scholar] [CrossRef]
  36. Liakopoulos, G.; Stavrianakou, S.; Karabourniotis, G. Analysis of epicuticular phenolics of Prunus persica and Olea europaea Leaves: Evidence for the chemical origin of the uv-induced blue fluorescence of stomata. An. Bot. 2001, 87, 641–648. [Google Scholar] [CrossRef] [Green Version]
  37. Khadhraoui, B.; Turk, M.; Fabiano-Tixier, A.S.; Petitcolas, E.; Robinet, P.; Imbert, R.; El Maâtaoui, M.; Chemat, F. Histo-cytochemistry and scanning electron microscopy for studying spatial and temporal extraction of metabolites induced by ultrasound. Towards chain detexturation mechanism. Ultrason. Sonochem. 2018, 42, 482–492. [Google Scholar] [CrossRef]
  38. Tabib, M.; Tao, Y.; Ginies, C.; Bornard, I.; Rakotomanomana, N.; Remmal, A.; Chemat, F. A One-Pot Ultrasound-Assisted Almond Skin Separation/Polyphenols Extraction and its Effects on Structure, Polyphenols, Lipids, and Proteins Quality. Appl. Sci. 2020, 10, 3628. [Google Scholar] [CrossRef]
  39. Ummat, V.; Tiwari, B.K.; Jaiswal, A.K.; Condon, K.; Garcia-Vaquero, M.; O’Doherty, J.; O’Donnell, C.; Rajauria, G. Optimisation of Ultrasound Frequency, Extraction Time and Solvent for the Recovery of Polyphenols, Phlorotannins and Associated Antioxidant Activity from Brown Seaweeds. Mar. Drugs 2020, 18, 250. [Google Scholar] [CrossRef] [PubMed]
  40. Khadhraoui, B.; Fabiano-Tixier, A.-S.; Petitcolas, E.; Robinet, P.; Imbert, R.; El Maâtaoui, M.; Chemat, F. Microscopic imaging as a tool to target spatial and temporal extraction of bioactive compounds through ultrasound intensification. Ultrason. Sonochem. 2019, 53, 214–225. [Google Scholar] [CrossRef] [PubMed]
Figure 1. Abstract figure ((A), picture of the experimental setup, and sample holder, (B), experimental methodology).
Applsci 11 00232 g001aApplsci 11 00232 g001b
Figure 2. Comparison of leaf surface by Environmental Scanning Electron Microscopy (ESEM) for an untreated leaf, a control leaf (60 min stirring), and ultrasound treated leaves (5 min, 15 min, and 60 min). Legend (Figure 2): Cuticle (C), Hairs (H), and Dust Particles (DP). All observations were made at a magnification of 400 × the original picture’s scale and the scale is 200 µm. Non labeled arrows designate observations of leaf structures discussed in the Results section. (A,B) Untreated olive leaf abaxial and adaxial side, respectively. (C,D) Control leaf, after 60 min of stirring at 20 °C, abaxial and adaxial side, respectively. (E,F) Leaf treated with ultrasound for 5 min at 20 °C, abaxial and adaxial side, respectively. (G,H) Leaf treated with ultrasound for 15 min at 20 °C, abaxial and adaxial side, respectively. (I,J) Leaf treated with ultrasound for 60 min at 20 °C, abaxial and adaxial side, respectively.
Applsci 11 00232 g002
Figure 3. Comparison of olive leaf cross sections tainted in toluidine blue by optical microscopy for untreated leaf, control leaf (60 min stirring), and ultrasound-treated leaves (5 min, 15 min, and 60 min). Legend (Figure 3): Cuticle (C), Epidermis (E), Hair (H), Palisadic Parenchyma (PP), Lacunary Parenchyma (LP), Hair Layer (HC). All observations were made at a magnification of 20 × the original picture’s scale. Bars: 100 µm. Non labeled arrows designate observations of leaf structures discussed in the result section. (A,B) Untreated olive leaf abaxial and adaxial side, respectively. (C,D) Control leaf, after 60 min of stirring at 20 °C, abaxial and adaxial side, respectively. (E,F) Leaf treated with ultrasound for 5 min at 20 °C, abaxial and adaxial side, respectively. (G,H) Leaf treated with ultrasound for 15 min at 20 °C, abaxial and adaxial side, respectively. (I,J) Leaf treated with ultrasound for 60 min at 20 °C, abaxial and adaxial side, respectively.
Applsci 11 00232 g003
Figure 4. Evidenced mechanisms of the effect of acoustic cavitation on leaf surface modification.
Applsci 11 00232 g004
Table 1. Comparison of extraction performances (yield and polyphenol composition of extracts) for stirring and ultrasound.
Extract Composition *
Extraction ProcessExtraction DurationTotal Polyphenol Content *OleuropeinTyrosolHydroxytyrosol
(-)(min)(µg eq. O/mL) **(µg/mL)(µg/mL)(µg/mL)
stirring5 min0.360.100.000.00
60 min1.460.360.000.04
ultrasound5 min6.962.750.020.24
15 min22.4413.090.000.20
60 min48.7528.160.020.26
* n = 3, ** µg eq. O/mL: micro equivalent Oleuropein/mL of extract.
Publisher’s Note: MDPI stays neutral with regard to jurisdictional claims in published maps and institutional affiliations.