Effect of Soccer Ball Panels on Aerodynamic Characteristics and Flow in Drag Crisis


Abstract
:Featured Application
Abstract
1. Introduction
2. Materials and Methods
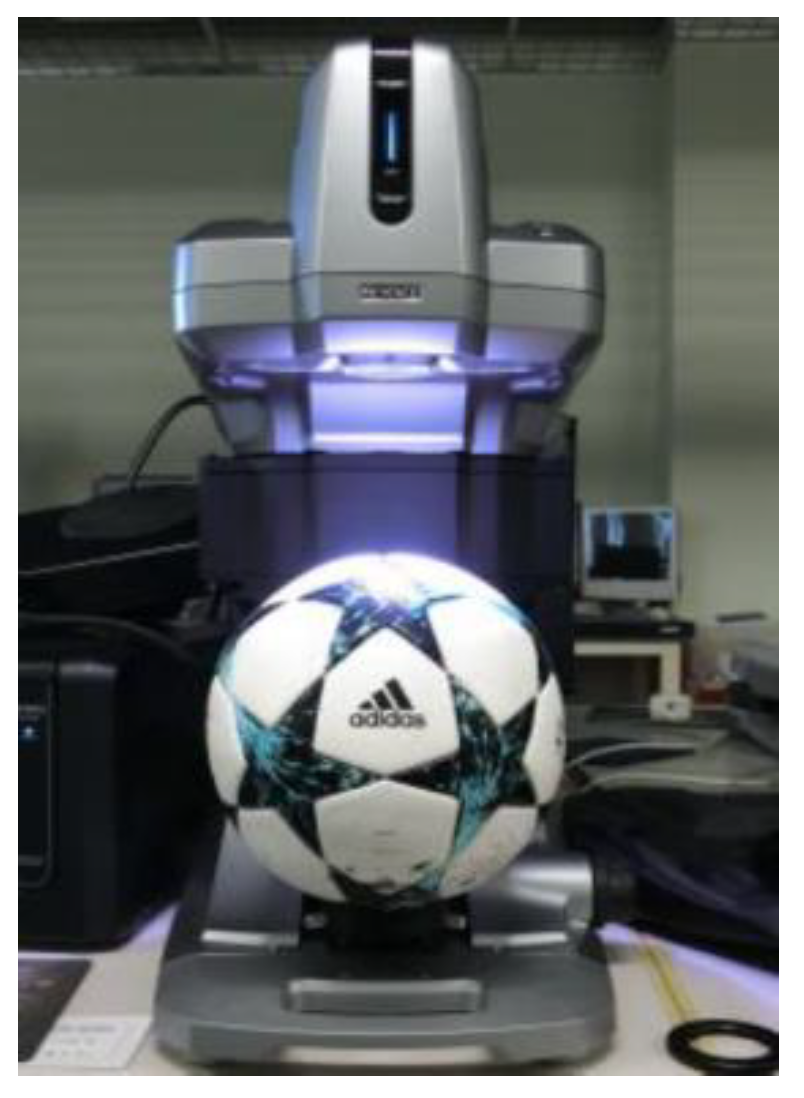
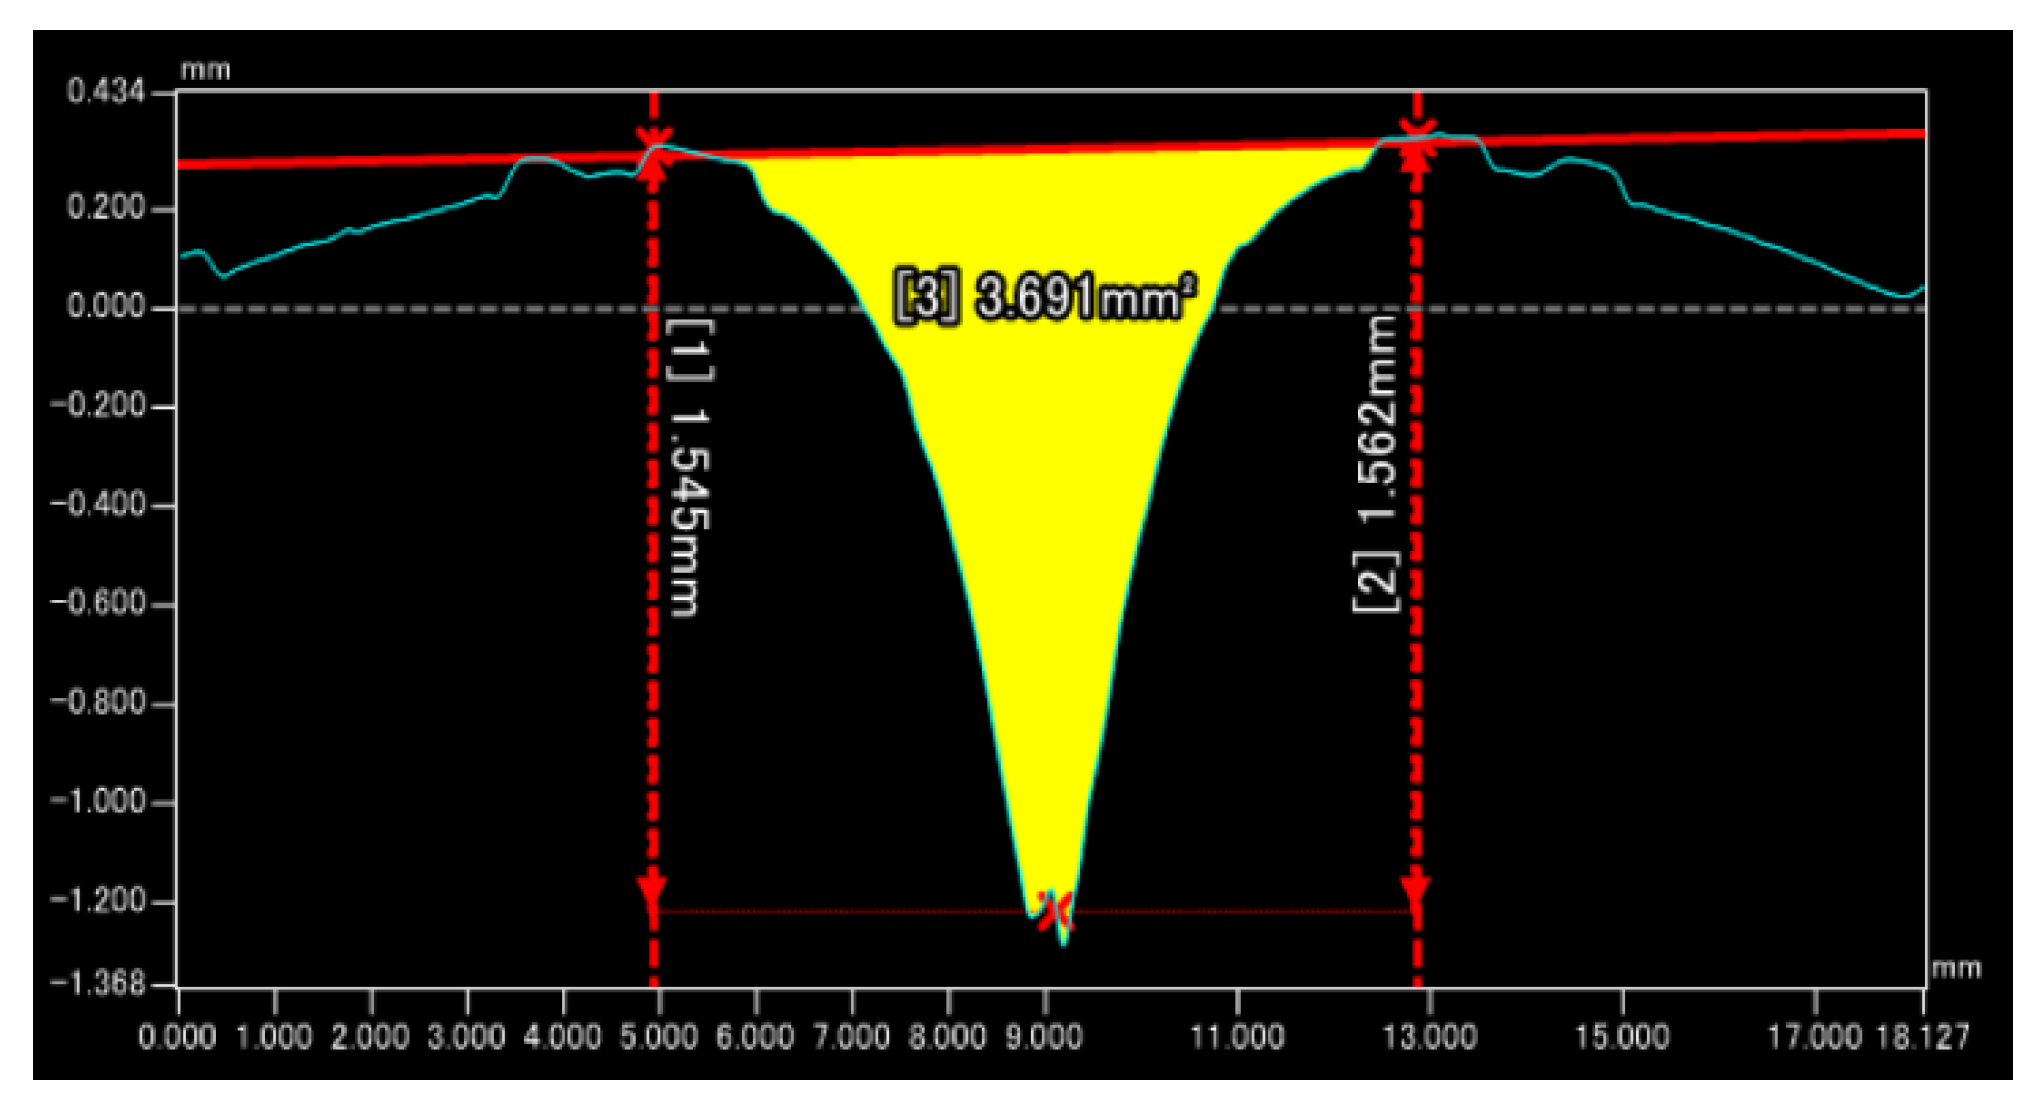
2.1. Groove Shape Measurement
2.2. Fluid Force Measurement
2.3. Measurement of Separation Point by Oil Film Experiments
2.4. 2D-PIV Measurement
3. Results and Discussion
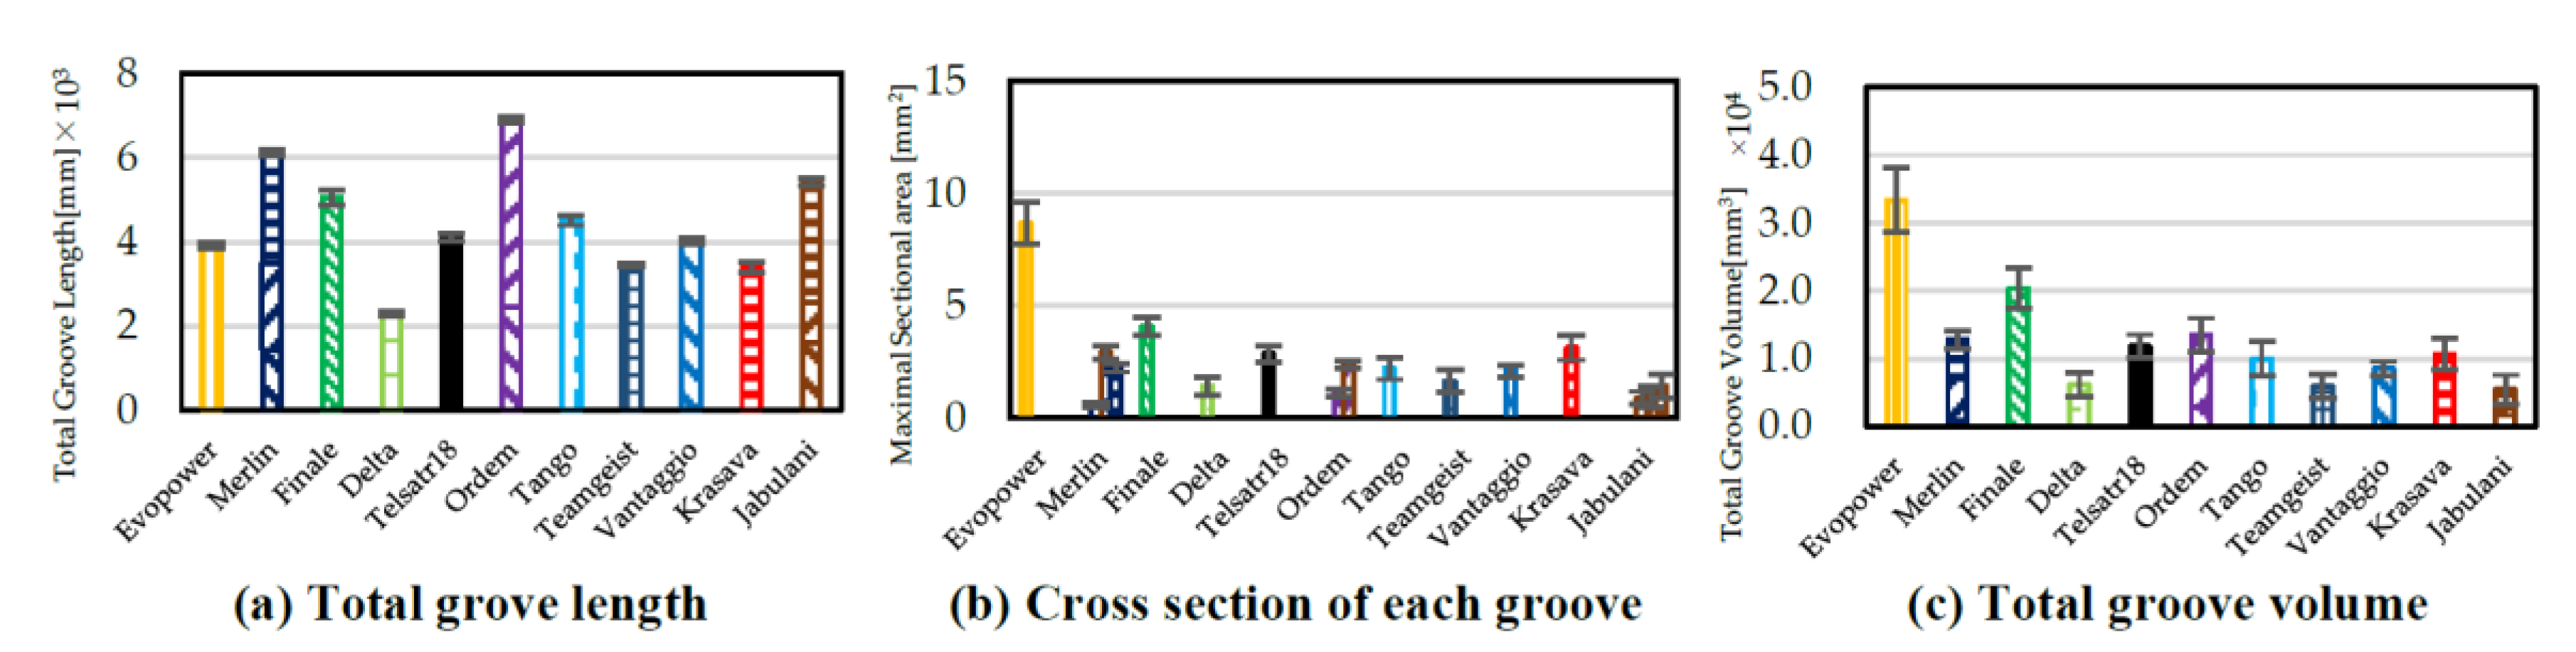
3.1. Groove Shape Measurement
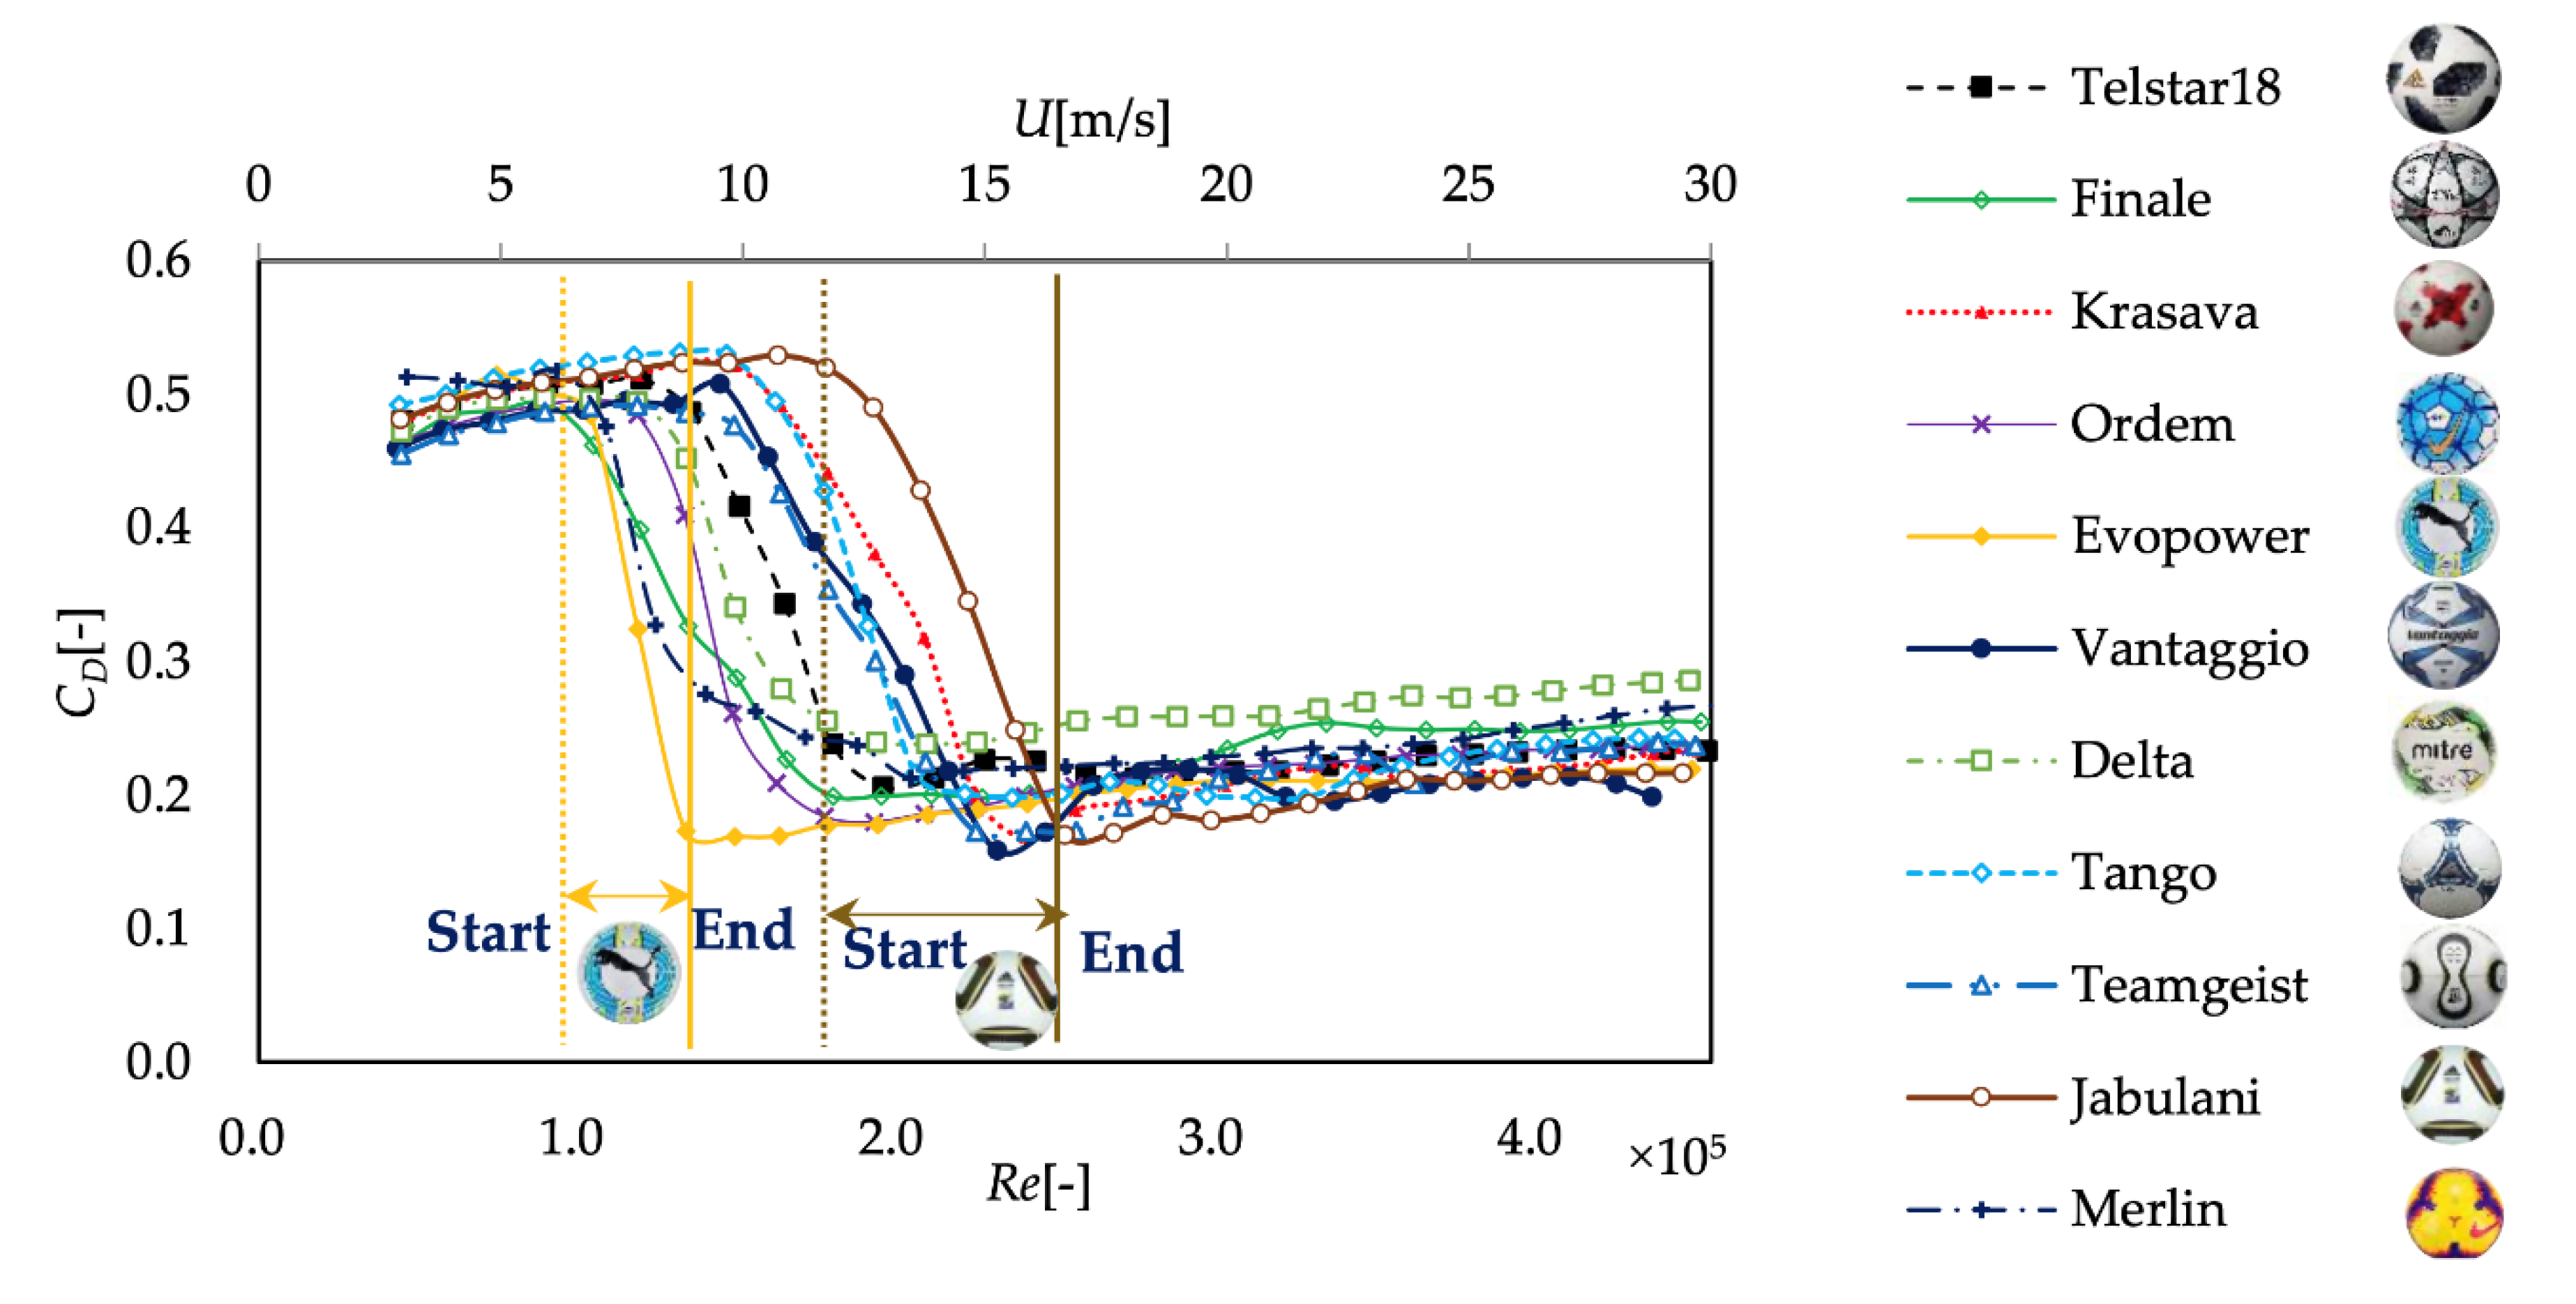
3.2. Fluid Force Experiment
3.3. Oil Film Experiments
3.4. 2D-PIV Measurement
4. Conclusions
- The dependence of the drag coefficient of each ball on the Reynolds number was measured. In addition to the magnitude of drag coefficients, the Reynolds number of the drag crisis was different for each panel shape.
- As the total volume of panel grooves increased, the Reynolds number at which the drag crisis occurred and the Reynolds number at which it ended tended to be smaller.
- Although smaller than in the critical region, in the laminar and turbulent regions, there was ball dependence and panel dependence on the location of the separation point of the flow.
- In the critical region, laminar and turbulent flows coexist on the ball, and the separation point of the flows varies greatly depending on the panel surface. Such an uneven flow would affect the formation of the soccer ball’s jet and its irregular flight path.
- Immediately after the ball is kicked, its velocity is large, and it flies in a supercritical state. The ball is slowed down by aerodynamic drag during its flight, but when the total volume of the grooves is large, the supercritical state is more likely to continue, and the CD value and flow conditions do not change much. On the other hand, when the total volume of the groove is small, the critical state is entered earlier, and the CD value and flow conditions change significantly. Therefore, to keep the ball on a stable trajectory, the ball should be designed so that the volume of the grooves is large.
Author Contributions
Funding
Conflicts of Interest
References
- Passmore, M.; Rogers, D.; Tuplin, S.; Harland, A.; Lucas, T.; Holmes, C. The aerodynamic performance of a range of FIFA-approved footballs. J. Sports Eng. Technol. 2012, 226, 61–70. [Google Scholar] [CrossRef] [Green Version]
- Kray, T.; Franke, J.; Frank, W. Magnus effect on a rotating soccer ball at high Reynolds numbers. J. Wind Eng. Ind. Aerodyn. 2014, 124, 46–53. [Google Scholar] [CrossRef]
- Alam, F.; Chowdhury, H.; Moria, H.; Fuss, F.K. A comparative study of football aerodynamics. Procedia Eng. 2010, 2, 2443–2448. [Google Scholar] [CrossRef] [Green Version]
- Taneda, S. Visual observations of the flow past a sphere at Reynolds numbers between 104 and 106. J. Fluid Mech. 1979, 85, 187–192. [Google Scholar] [CrossRef]
- Murakami, M.; Kondoh, M.; Iwai, Y.; Seo, K. Measurement of aerodynamic forces and flow field of a soccer ball in a wind tunnel for knuckle effect. Procedia Eng. 2010, 2, 2467–2472. [Google Scholar] [CrossRef] [Green Version]
- Hiratsuka, M.; Ito, S.; Miyasaka, K.; Konno, A. Stereo three-dimensional particle image velocimetry measurement and aerodynamic force analysis of non-spinning soccer balls. Proc. Inst. Mech. Eng. Part P J. Sports Eng. Technol. 2020, 234, 146–153. [Google Scholar] [CrossRef]
- Ito, S.; Kamata, M.; Asai, T.; Seo, K. Factors of unpredictable shots concerning new soccer balls. Procedia Eng. 2012, 34, 152–157. [Google Scholar] [CrossRef] [Green Version]
- Goff, J.E.; Asai, T.; Hong, S. A comparison of Jabulani and Brazuca non-spin aerodynamics. J. Sports Eng. Technol. 2014, 228, 188–194. [Google Scholar] [CrossRef] [Green Version]
- Goff, J.E.; Hong, S.; Asai, T. Aerodynamic and surface comparisons between Telstar 18 and Brazuca. J. Sports Eng. Technol. 2018, 232, 342–348. [Google Scholar] [CrossRef]
- Hong, S.; Goff, J.E.; Asai, T. Effect of a soccer ball’s surface texture on its aerodynamics and trajectory. Proc. Inst. Mech. Eng. Part P J. Sports Eng. Technol. 2019, 233, 67–74. [Google Scholar] [CrossRef]
- Hong, S.; Sakamoto, K.; Washida, Y.; Nakayama, M.; Asai, T. The influence of panel orientation on the aerodynamics of soccer balls. Procedia Eng. 2014, 72, 786–791. [Google Scholar] [CrossRef] [Green Version]
- Hong, S.; Asai, T. Effect of panel shape of soccer ball on its flight characteristics. Sci. Rep. 2015, 4, 5068. [Google Scholar] [CrossRef]
- Alam, F.; Chowdhury, H.; Stemmer, M.; Wang, Z.; Yang, J. Effects of surface structure on soccer ball aerodynamics. Procedia Engineering. 2012, 34, 146–151. [Google Scholar] [CrossRef] [Green Version]
- Goff, J.E. A review of recent research into aerodynamics of sport projectiles. Sports Eng. 2013, 16, 137–154. [Google Scholar] [CrossRef]
- Hong, S.; Asai, T. Aerodynamic effects of dimples on soccer ball surfaces. Heliyon 2017, 3, e00432. [Google Scholar] [CrossRef]
- Goff, J.E.; Carr, M.J. Trajectory analysis of a soccer ball. Am. J. Phys. 2009, 77, 1020–1027. [Google Scholar] [CrossRef]
- Myers, T.G.; Mitchell, S.L. A mathematical analysis of the motion of an in-flight soccer ball. Sports Eng. 2013, 16, 29–41. [Google Scholar] [CrossRef]
- Mizota, T.; Kurogi, K.; Ohya, Y.; Okajima, A.; Naruo, T.; Kawamura, Y. The strange flight behavior of slowly spinning soccer balls. Sci. Rep. 2013, 3, 1871. [Google Scholar] [CrossRef]
- Hong, S.; Asai, T.; Seo, K. Visualization of air flow around soccer ball using a particle image velocimetry. Sci. Rep. 2015, 5, 15108. [Google Scholar] [CrossRef] [Green Version]
- Hong, S.; Asai, T.; Seo, K. Flow Visualization Around Panel Shapes of Soccer Ball. Procedia Eng. 2015, 112, 391–394. [Google Scholar] [CrossRef] [Green Version]
- Asai, T.; Seo, K. Aerodynamic drag of modern soccer balls. SpringerPlus 2013, 2, 171. [Google Scholar] [CrossRef] [Green Version]
- Goff, J.E.; Hobson, C.M.; Asai, T.; Hong, S. Wind-tunnel Experiments and Trajectory Analyses for Five Nonspinning Soccer Balls. Procedia Eng. 2016, 147, 32–37. [Google Scholar] [CrossRef] [Green Version]
- Kiratidis, A.L.; Leinweber, D.B. An aerodynamic analysis of recent FIFA world cup balls. Eur. J. Phys. 2018, 39, 034001. [Google Scholar] [CrossRef] [Green Version]


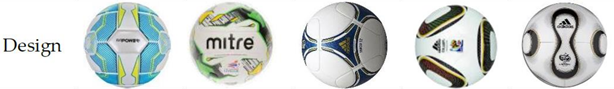
| Name | Merlin | Telstar18 | Krasava | Ordem | Finale | Vanaggio |
 | ||||||
| Oil film | ○ | ○ | ○ | ○ | ||
| 2D-PIV | ○ | |||||
| Name | Evopower | Delta | Tango12 | Jabulani | Teamgeist | |
 | ||||||
| Oil film | ||||||
| 2D-PIV | ○ | ○ | ○ | |||
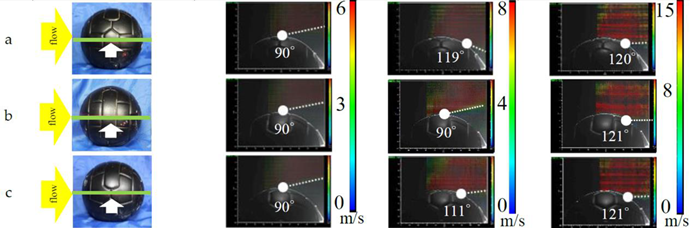
| No. | Panel Orientation and Laser Position | Subcritical (6 m/s) Re = 9.3 × 10⁴ | Critical (8 m/s) Re = 1.2 × 10⁵ | Supercritical (15 m/s) Re = 2.2 × 10⁵ |
|---|---|---|---|---|
 | ||||
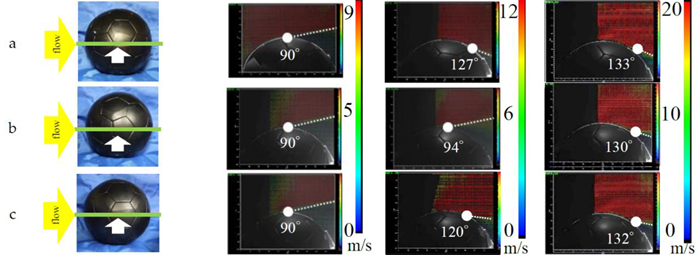
| No. | Panel Orientation and Laser Position | Subcritical (9 m/s) Re = 1.3 × 10⁵ | Critical (12.5 m/s) Re = 1.8 × 10⁵ | Supercritical (15 m/s) Re = 2.9 × 10⁵ |
|---|---|---|---|---|
 | ||||
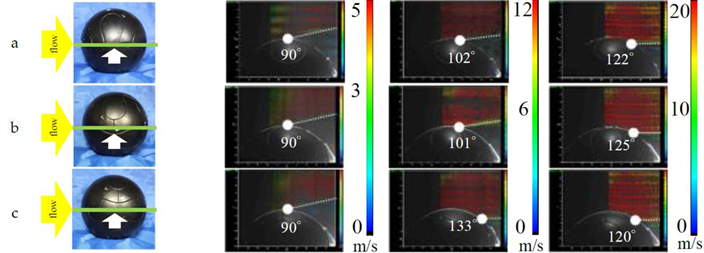
| No. | Panel Orientation and Laser Position | Subcritical (5 m/s) Re = 7.3 × 10⁴ | Critical (14 m/s) Re = 2.1 × 10⁵ | Supercritical (20 m/s) Re = 2.9 × 10⁵ |
|---|---|---|---|---|
 | ||||
| No. | Panel Orientation and Laser Position | Subcritical (5 m/s) Re = 7.3 × 10⁴ | Critical (12.5 m/s) Re = 1.8 × 10⁵ | Supercritical (20 m/s) Re = 2.9 × 10⁵ |
|---|---|---|---|---|
 | ||||
Publisher’s Note: MDPI stays neutral with regard to jurisdictional claims in published maps and institutional affiliations. |
© 2020 by the authors. Licensee MDPI, Basel, Switzerland. This article is an open access article distributed under the terms and conditions of the Creative Commons Attribution (CC BY) license (http://creativecommons.org/licenses/by/4.0/).
Share and Cite
Sakamoto, Y.; Hiratsuka, M.; Ito, S. Effect of Soccer Ball Panels on Aerodynamic Characteristics and Flow in Drag Crisis. Appl. Sci. 2021, 11, 296. https://doi.org/10.3390/app11010296
Sakamoto Y, Hiratsuka M, Ito S. Effect of Soccer Ball Panels on Aerodynamic Characteristics and Flow in Drag Crisis. Applied Sciences. 2021; 11(1):296. https://doi.org/10.3390/app11010296
Chicago/Turabian StyleSakamoto, Yuki, Masaki Hiratsuka, and Shinichiro Ito. 2021. "Effect of Soccer Ball Panels on Aerodynamic Characteristics and Flow in Drag Crisis" Applied Sciences 11, no. 1: 296. https://doi.org/10.3390/app11010296
APA StyleSakamoto, Y., Hiratsuka, M., & Ito, S. (2021). Effect of Soccer Ball Panels on Aerodynamic Characteristics and Flow in Drag Crisis. Applied Sciences, 11(1), 296. https://doi.org/10.3390/app11010296