1. Introduction
At present time—the age of informatization and integration of information and communication tools into human life—education is becoming highly technological.
This technological development and improvement have also brought us new trends in education, especially in the field of distance education. The original idea of distance education was to make it accessible to those people who could not learn face-to-face, whether due to distance, lack of time or finances. With the development of programming languages, several educational systems have emerged that have sought to computerize pedagogical activities to facilitate student’s access to education and professional training without having to be physically present [
1]. Various new terms for this type of education have started to emerge, such as e-learning, m-learning (Mobile Learning), online education, Massive Open Online Course (MOOC), Computer Assisted Teaching (CAT), virtual education, combined education, flexible learning, etc.
Connectivism [
2] is one of the latest theories, that responds quickly to the rapid development of information and communication technologies. Connectivism was the first theory to adopt a dynamic view of brain function. It surpasses the current individual approach of all other theories. It views education as a property of the network that goes beyond the individual (the increasing amount of information leads to the need to divide knowledge among more individuals). It also tries to respond to the shortcomings of previous theories—learning and exchange of knowledge, information, and information resources take place through social networks [
3].
In connectivism, there is no real concept of transferring or building knowledge [
4]. It focuses more on the development and growth of society itself, which is done through the activities that we undergo in order to learn something new (e.g., to carry out own pedagogical research).
From the point of view of education in the university environment, it was e-learning that found the widest application in the field of distance education [
5]. The logical and expected consequence of the implementation of e-learning is the “virtualization” of education, as e-learning essentially means providing courses via the Internet without time and space constraints imposed on participants [
6]. E-learning is based on the concept of Computer-Assisted Learning (CAL). With technological progress and the growing interest of educational institutions in this way of education, e-learning has evolved into several creative forms such as educational network platforms or online self-learning services. The first mentioned platforms help students to consolidate the educational material after class, on the contrary, self-learning services are primarily intended for training special skills.
The aim of e-learning education is the same as the aim of face-to-face education, just with the difference that the methods used are significantly different. On the other hand, education in a virtual environment provides new dimensions and opens new opportunities for study. Virtual education is not traditional, which means for its existence does not need traditional means such as offices, classrooms, buildings and broad campuses, libraries, and large staffing. However, it needs a much more powerful computer network that will be able to subserve challenging tasks and respond flexibly to the changing needs of this type of education. The level of information and communication technologies used has a significant impact on the overall concept of virtual education [
7]. New virtual educational platforms have also their cons such as insufficient interaction, problems with platforms adaptability, and other technical problems leading to students’ dissatisfaction that must be improved [
8].
The emergence of virtual education is due to the need to acquire and provide knowledge. The aim of it is to provide such education to the widest possible group of people or community that does not have access to the traditional way, to support non-traditional forms of education such as non-formal or community education or education in a MOOC environment [
9]. Typical elements of virtual education are communication and cooperation and also participating in group problem-solving activities [
7].
Over the years, one of the most important e-learning initiatives has been the creation and implementation of MOOCs, which offer open, non-formal, and community-based learning. The term MOOC was first used by Dave Cormier, who refers to it as an action or event where people are present who are interested in a particular topic and they are working on or discussing it together. All their content is freely exchanged (shared) without distinction—the student’s work, his comments in discussions, essays, or study materials of facilitators [
10].
MOOCs are one of the opportunities to acquire and develop knowledge during lifelong learning. In their form, they support the student’s independence, encourage her/him to create her/his own learning environment and maintain the connection she/he has built during the course with other participants, and which she/he can easily maintain even after the course. It is the network of connections that is one of the main items that the participants acquire in the course. All blogs, discussion posts, articles, tweets, and tags are linked. A side effect of these courses is also the fact that the courses themselves are becoming a kind of distributed base of knowledge on the Internet. They become a repository of knowledge for course participants [
11].
The key aspects of the MOOC consist of the following parts: Massive: a large scale of people from all over the world. Open: free of charge or other special requirements per participant. Online: accessible anytime, anywhere, synchronous and asynchronous communication. Courses: learning materials, assessments, networking tools, learning analytics tools [
12].
The first MOOC course was a course called Connectivism and Connective Knowledge (referred to as CCK08). It was offered by the University of Manitoba in Canada in 2008 and was led by George Siemens and Stephen Downes, authors of the theory of connectivism. The key concepts of this theory are openness, interactivity, student independence and diversity. Interest was unexpectedly high. 24 students enrolled in a standard university course and more than 2200 participants in the online version [
13]. The MOOC course called Introduction into Artificial Intelligence, which corresponded to the content of the same compulsory subject for full-time students at Stanford University in California recorded groundbreaking participation. The free online courses were led by professors Sebastian Thrun and Peter Norvig. The course was based on instructional videos explaining the material and on exercises and questions to verify their understanding. For all its participants, it was synchronized in real-time, in case of delay, the student’s participation was immediately terminated. Even with the obvious complexity of the course, it was completed by 23,000 participants from the 160,000 registered candidates [
4].
The article aims to support students in pedagogical research using a MOOC, which is focused on the solution of causal research problems in the domain of learning theory in informatics. The aim is to verify whether the effective use of information and communication technologies, in the form of MOOC, informal and open educational activities, has a potential to improve students’ knowledge and foster their skills in pedagogical research (a positive effect on stimulation of students in research results and their applications as well as in the realization of their own research in learning theory in informatics).
The article is organized as follows:
Section 1 consists of a description of distance learning and e-learning.
Section 2 presents a theoretical background focused on the massive open online course.
Section 3 describes the created MOOC course, dataset and methods used to process the experimental data.
Section 4 offers detailed processing of the experiment results and the identification of problem phases in solving a causal research problem.
Section 5 discusses the results of the research and the last
Section 6 is the conclusions.
2. Theoretical Background—MOOC
In recent years, MOOCs are becoming a very popular form of teaching for people of all ages. In most cases, MOOCs are made available through specialized systems that help course providers spread them among students while helping them to find courses they are interested in. The year 2017 represents the sixth year since the MOOC trend was established and for the first time according to statistics, this year marks a slowdown of inflow of new students [
14]. In 2017, for the first time, approximately 23 million new students enrolled in their first MOOC, with the total number of students increasing to 81 million. These numbers are similar to the statistics from 2016, which confirms the stagnation of the inflow of new students. However, although user growth has been relatively flat over the past period, new courses are still being created. Shah [
14] states that at the end of 2018, more than 900 universities were offering 11,400 MOOCs and the number of people who were studying online was 101 million.
In present days, universities around the world use MOOC platforms such as Coursera, Udacity, and edX. Coursera, one of the most important MOOC platforms, has 185 partners (including universities and organizations) in 28 countries and it offered 3449 courses in March 2019 [
15].
In terms of the number of registered users, the top five MOOCs in 2018 included Courser with 37 million users, edX with 18 million, XuetangX with 14 million, Udacity with 10 million, and FutureLearn with 8.7 million users [
14].
Andrew Ng, a founding member of Google Brain, registered more than 1.7 million students in his first machine learning course by the end of February 2019 [
16].
According to Stephen Downes and George Siemens, MOOCs can be primarily divided into cMOOCs and xMOOCs [
17]. cMOOC (connectivist MOOC, based on connectivist principles, openness, and participatory teaching) and xMOOC (extended MOOC, aims to transfer knowledge to the student, teacher-centered, and based on the behaviorist learning theory [
18].
2.1. cMOOC
cMOOC is based on creating an educational community. The main idea of the cMOOC is that students acquire and create knowledge themselves by connecting information through online tools, such as various social networks, blogs, or discussions, i.e., teaching takes place in a network. Its main benefit consists of cooperation among students. Participants are directly involved in the preparation of lessons through social networks. Students determine for themselves the goals and intensity in which they want to participate. Thanks to these properties, the so-called many-to-many approach has emerged. There is also much greater connectivism is present than in xMOOCs and they are also characterized by the mutual exchange of knowledge among students [
12]. While cMOOCs focus on knowledge creation and generation, xMOOCs focus on knowledge duplication [
19]. X-extended courses have emerged later than cMOOC and nowadays they are more common in online courses.
2.2. xMOOC
The most MOOCs belong in xMOOC, where there is no emphasis on connectivism and social constructivism, as is the case with cMOOC. xMOOCs are provided by the largest learning platforms, such as Coursera, EdX, or Udacity. The courses have their own curriculum, which usually consists of reading, completing various tasks and of course online lessons. The whole teaching is conducted in a rather informal way. In the case of xMOOCs, the teacher is placed in the center, in the so-called one-to-many position. Thanks to this position, it is possible to reach a large number of enrolled students. Students also participate in online discussions and forums, filling out tests to prove their acquired knowledge from available materials [
12].
Pachenko [
20] summarized the differences between cMOOC and xMOOC (
Table 1).
Pachenko [
20] realized a comparative analysis of three providers of MOOCs—Coursera, Udacity and edX, concluding that the benefits of the MOOCs are [
20] (p. 13):
participation is free of charge,
opportunity for on-the-job advanced training,
introduction to individual teaching styles of the leading professors of some well-known universities,
possibility to compare the methodological basis of different courses,
distance learning experience in the role of a student,
participation in forum discussions,
experience of peer assessment practices,
broadening one’s horizons and knowledge of teaching methodology,
opportunity to expand the courses taught at the university incorporating knowledge of MOOC,
intercultural competency development,
English listening, reading, and writing skills enhancement,
expanding the range of software,
establishing new professional contacts,
reflecting on one’s own educational activity from a new angle.
With the gradual increase of influence and popularity, MOOCs are also becoming part of face-to-face teaching at universities, which had to be moved to the online space in 2020 due to the limitation of full-time teaching due to COVID-19. In addition to all the above-mentioned benefits of MOOCs, the current situation has highlighted two main problems in applying MOOCs in education.
The first problem with MOOCs is the number of successfully completed graduates. Murray [
21] states that during five years (2013–2018) up to 96 per cent of students left this form of study. Hew and Cheung [
22]) state the following reasons for leaving: lack of motivation, inability to understand the content and having no one to ask for help and having other priorities to fulfil. According to them [
22] (p. 51), the biggest difference between face-to-face courses and MOOCs is “the large and diverse student enrolment in MOOCs, the high drop-out rate of MOOCs compared to that of traditional courses, and relatively the lack of instructor presence or support in MOOCs compared to traditional courses”.
The second related problem or obstacle to better access to MOOC content is the language barrier, as most of the content is in English [
23]. Wu and Bai [
24] argue that the language barrier has reduced students’ interest in studying online and it is one of the important factors in the high rate of early school leaving.
The most time-consuming process in the implementation of MOOCs is the creation of their content. The MOOC as a building block of virtual education determines its quality, therefore high demands are placed on it by creating. By defining evaluation criteria, it helps us to identify the strengths and weaknesses of the MOOC. The result of measuring these evaluation criteria is information that helps us to determine whether or not the course meets our expectations. For this reason, the article focuses on creating the content of a professional course in the mother tongue.
3. Materials and Methods
3.1. MOOC—Experimental Data Processing
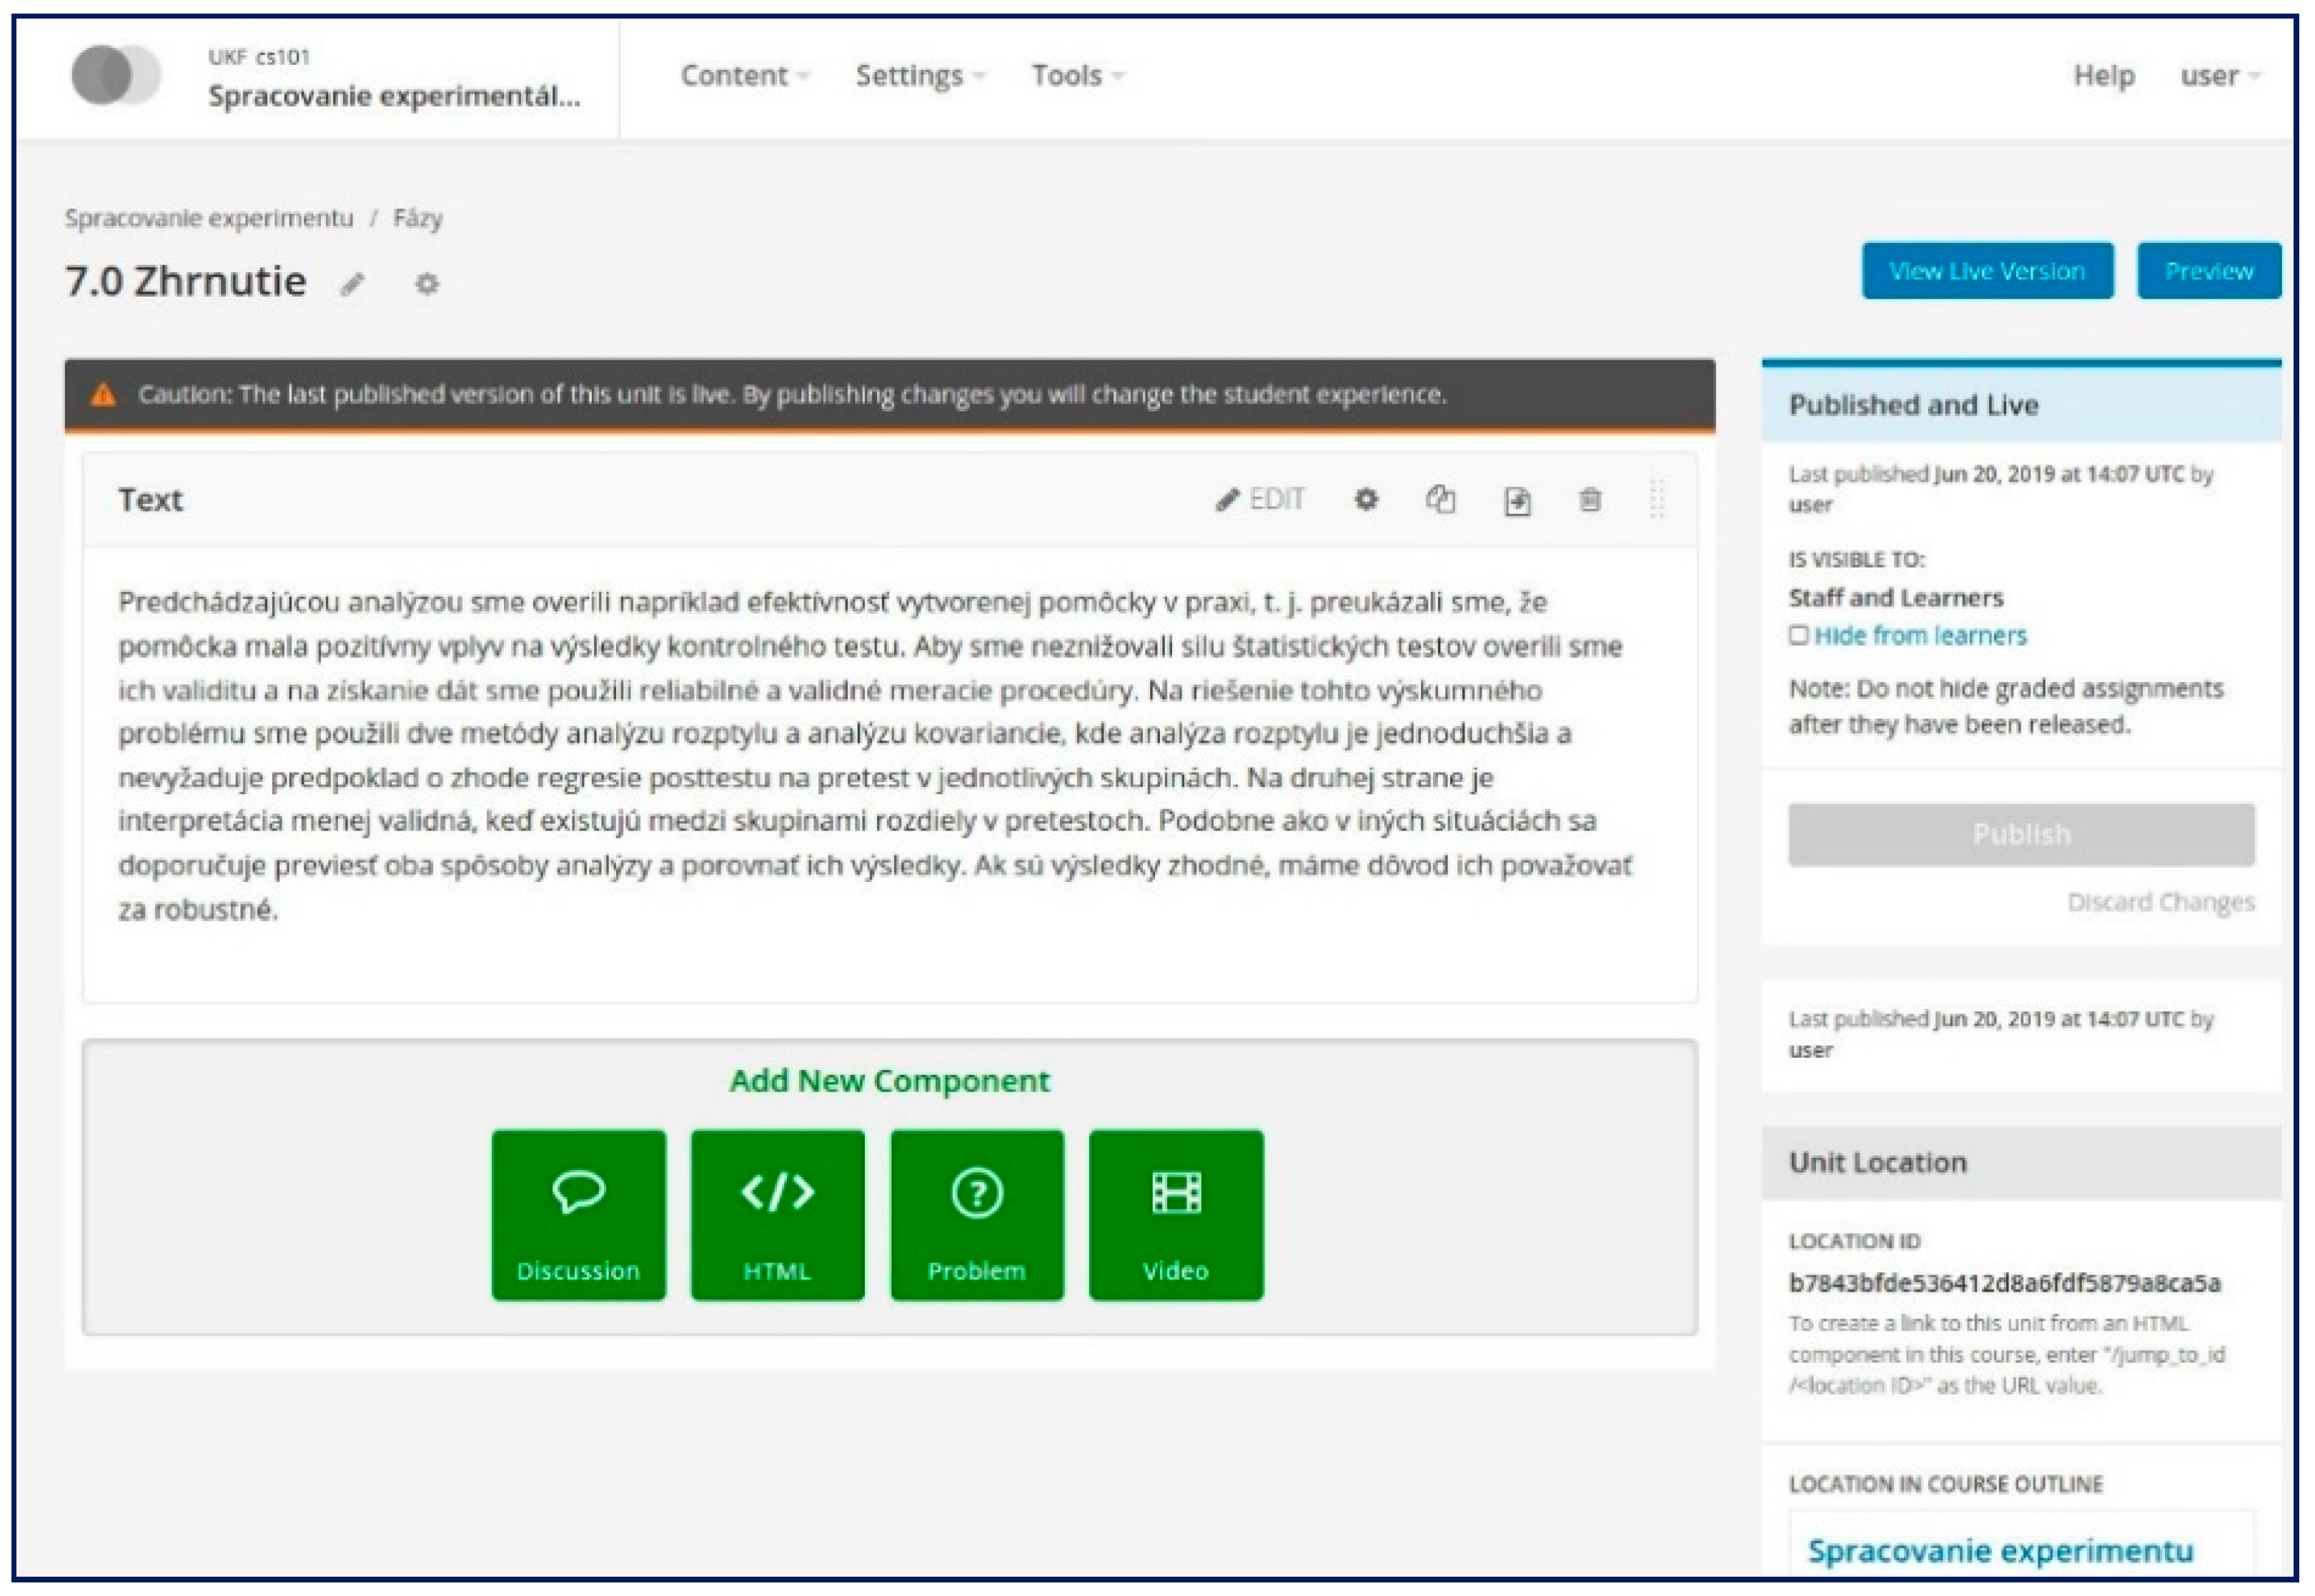
We created the course in the Open edX environment in a virtual server supported by Bitnami. The most visible part of Open edX is the LMS. Through it, students can access to educational content and it also provides the necessary management tools to users with administrator, instructor or teacher privileges. LMS uses several data repositories or databases. The educational content, texts, images, and other materials are stored in the MongoDB database, videos are displayed on YouTube or Amazon S3. The data of course participants and their activities are stored in a MySQL database. The Open edX environment (
Figure 1) is fully supported for mobile environments, the support for iOS and Android allows access to complete educational content.
The created course Experimental data processing was placed on the website of the Department of informatics UKF in Nitra, Slovakia. The course aimed to clarify the particular phases of the statistical processing of the experiment.
The phases of the experiment:
Creating of control and experimental group.
Creating of reliable and valid measuring procedures.
Realization of the experimental plan.
Understanding the data.
Verifying the validity of the used statistical methods.
Data analysis and interpreting the results.
The course is designed as a guide to the various stages of processing the experiment. Gradually, the participant gets become acquainted with the procedure of processing the experiment, from the creating of experimental and control groups to the actual processing and interpretation of the results. It introduces various methods of verifying the reliability and validity of didactic tests and also it offers the user several experimental plans for the experiment. It emphasizes the understanding of data, which means to focus on the calculation of descriptive characteristics and confidence intervals and based on these results to build a null statistical hypothesis. From the methods for verifying the defined hypothesis, we chose the two most commonly used methods, the analysis of variance and the analysis of covariance. The course also deals with the assumptions of using both methods. The main parts of the course form the particular phases of the experiment.
The structure of the course:
Introduction
Creating of control and experimental group
- 1.1
Random selection
- 1.2
Example
Creating of reliable and valid didactic tests
- 2.1
Calculation of reliability
- 2.2
Calculation of concurrent validity
- 2.3
Overview of estimates to assess the quality of the measurement
- 2.4
Example
- 2.5
Analysis of the reliability of the electronic didactic test: Case study
- 2.6
Calculation algorithm
Experiment
- 3.1
Realization of the experimental plan
- 3.2
Example
Understanding the data
- 4.1
Descriptive statistics
- 4.2
Confidence interval
- 4.3
Visualization of descriptive characteristics
- 4.4
Example
Verification of the validity of the statistical methods used
- 5.1
Assumptions for using the analysis of variance
- 5.2
Assumptions for using the analysis of covariance
- 5.3
Example
Data analysis and interpreting the results
- 6.1
The analysis of variance and the analysis of covariance
- 6.2
Example
- 6.3
Evaluation of user interfaces for creating database requests: A case study
- 6.4
Calculation algorithm
Summary
The course is designed as an aid in processing the experiment, it has the character of an electronic teaching aid, which means students are expected to work independently with this material. The user does not have to memorize the course content, they only need to be able to work with this material and use it as an aid in the statistical processing of the experiment. Almost every part is supplemented with visual material such as pictures, graphs, tables, and animations for a better understanding of the issue. As this is a MOOC, the essential parts were also videos that clearly present the educational content, interpret graphs and tables as well as illustrate how to realize the calculation in the program TIBCO Statistica or Microsoft Excel. The selected parts were supplemented by short quizzes for better learning. The course also includes several case studies, which from our point of view best illustrate the issue discussed on concrete examples and from the pedagogical point of view we consider them to be the most valuable. We can consider our course as cMOOC, students used a discussion forum and social networks when compiling the final project or the used them as a space for consulting with peers and solving the tasks concerning the final project. We assume that in solving these issues, there was further dissemination of knowledge through social networks.
The examples from the course environment are shown in (
Figure 2).
3.2. Dataset
We have realized our experiment on a sample of 114 bachelor’s and master’s degree students in both, full-time and extra-mural study. This sample also included 14 PhD students. The MOOC was realized at the end of the winter semester in the academic year 2019/2020 at the Constantine the Philosopher University in Nitra. Five students did not attend the study or interrupted their studies, we excluded them from the data file. The sample was divided into two groups, control (CON) with 68 participants and experimental (EXP) with 41 participants:
bachelor studies, full-time study—CON (57 participants)
bachelor studies, extramural study—EXP (17 participants),
master studies, full-time study—EXP (10 participants),
master studies, extramural study—CON (11 participants),
doctoral studies (PhD.)—EXP (14 participants).
In the case of bachelor and master students, the sampling was selected based on availability. The project was assigned to students during the ongoing subjects focused on data analysis. In the case of PhD students, the sampling was selected based on voluntary.
The control group was educated conventionally, the experimental group completed the above mentioned MOOC called Experimental Data Processing focused on statistical processing of the experiment. Each participant completed the pretest before the start of the experiment and after its completion had to work out a project according to the assignment (posttest). The pretest represented the final mark from the solved tasks in statistics (A-FX), where A (1) means excellent knowledge and FX (3.5) insufficient knowledge. The posttest was performed after the end of the experiment and takes values in the interval 0 to 1, where 0 is 0% success and 1 is 100% success of the submitted project solution (
Table 2).
The posttest was the evaluation of the submitted project (
Figure 3) focused on the processing of experimental data. The participants had to correctly realize and interpret the following phases from the processing of the experiment:
the analysis of reliability/items + descriptive statistics, correlation,
ANOVA + descriptive statistics, assumptions,
ANCOVA + descriptive statistics, assumptions.
3.3. Methods
The analysis of covariance combines elements of the analysis of variance and multiple regression. One or more quantitative factors—covariates/covariate variables—are added to the analysis of variance model, which examines the dependence of the intensive/quantitative variable on nominal factors.
The regression model for the analysis of covariance in the case of two groups and one covariance variable
X
where
Z denotes the value of the indicator-dummy variable. It takes the values 0 or 1 depending on whether the measurement belongs to the first or second group. The coefficient
β2 reflects the effect of the nominal factor. The coefficient
β1 evaluates the influence of the covariance variable. The coefficient
β3 represents the presence of an interaction between the covariate and the nominal factor.
The model of equal value of the analysis of covariance with one nominal factor and one covariate
where
µ is the mean,
αi is the contribution of the
i-th level of factor A and
eij is the residual. The parameters
µ, αi,
i = 1, 2, ...,
I are unknown and
eij i = 1, 2, ...,
I,
j = 1, 2, ...,
ni are independent variables with distribution
N (0,
σ2). If the relationship between
X and
Y is significant, then the model of the analysis of covariance explains more of the variability of the variable
Y than the model of the analysis of variance. The analysis of covariance tests whether the adjusted group means are different. The means are adjusted as if the quantitative factor had the same value in all groups.
4. Analyses and Results
In this section, we will verify the didactic effectiveness of the course created by the method of the analysis of covariance, while we will also take into account the degree of study. Subsequently, we will identify the problems in solving causal research problems.
4.1. The Analysis of Covariance with the Pretest Control
Table 3 contains descriptive statistics such as the mean, the standard deviation, the standard error and 95% confidence interval of the mean. From the means we can see slight differences in the pretest score between the groups, the standard deviations indicate that the variability of the test score is approximately the same in both groups.
From
Table 4 of the descriptive statistics we see the differences in the posttest score between the groups in favor of the experimental group, the standard deviations are approximately the same which means also the variability in both groups and the error obtain values close to zero.
To find whether the posttest values were not affected by any other variable, we apply the analysis of covariance for the pretest and the posttest data. Using this analysis, we find out whether the variable of the posttest is not dependent on the variable of the pretest (covariate), which means whether the existing knowledge of the participants before the experiment did not affect the results in the posttest.
We have identified only small deviations from the normality. For this reason, in addition to parametric tests (Hartley F-max = 1.168, Cochran C = 0.538, Bartlett Chi-Sqr. = 0.296, p = 0.5865) we also used a nonparametric Levene’s test (F = 1.457, p = 0.2301) to verify the assumptions of the equality of variances.
Assumptions for using the analysis of covariance:
the assumptions of the analysis of variance are valid,
the regression coefficient Beta is the same in all groups.
We have fulfilled the assumptions of the analysis of variance. To verify the assumption of the equality of variances, we also use the parametric multivariate Box M test designed for the analysis of covariance (Box M = 5.677, Chi-Sqr. = 5.552, df = 3, p = 0.1356). The test is statistically insignificant, so the hypothesis of the equality of variances (homogeneity of variance-covariance matrices) is not rejected. We can state that there was no violation of the assumption.
The easiest way to verify the condition of the equality of the regression coefficient in the groups is to check the categorized correlation graph for each factor level (
Figure 4a,b). There is a quantitative factor on the horizontal axis, the dependent variable depends on the vertical axis. If the particular lines have approximately the same slope, the condition is met.
The curves have the same slope, which means the regression coefficient is approximately the same in both groups.
From
Table 5 we can see that the relationship between the posttest and the pretest is statistically significant (
p < 0.05), which means the pretest results affected the posttest results. We reject the null hypothesis stating that the difference in the posttest score between the experimental and the control groups is not statistically significant, which means the dependent variable posttest depends on the group factor.
It can be seen from the
Figure 5 that even after taking the pretest into account, the differences between the two groups are still significant, although not as much as without checking the pretest variable (
Table 4), but this difference can still be considered statistically significant.
4.2. The Analysis of Covariance with the Pretest Control and Taking into Account the Degree of Study
We decided to reapply the analysis of covariance to our data, but this time we took into account the degree of study that the course participants are currently completing or have achieved before the experiment. We will examine whether the results in the posttest were not affected by the degree of study.
From
Table 6 of descriptive statistics, we can see that the best in the pretest was the group expPhD—colleagues with PhD (experimental), expM—masters (experimental), expBc—bachelors (experimental), the standard deviations indicate that the variability of the pretest score is approximately the same and the errors obtain values close to zero.
From
Table 7 of the descriptive statistics we can see that in the posttest all experimental groups achieved better results, the standard deviations are similar in all cases and the errors obtain values close to zero.
To determine whether the posttest values were affected by any other variable, we apply the analysis of covariance for the pretest and posttest data. Using this analysis, we find out whether the variable posttest is not dependent on the variable pretest (covariate), which means whether the existing knowledge of the participants before the experiment did not affect the results in the posttest.
We have identified only small deviations from the normality. For this reason, in addition to parametric tests (Hartley F-max = 1.729, Cochran C = 0.271, Bartlett Chi-Sqr. = 1.441, p = 0.8371), we also used a nonparametric Levene’s test (F = 1.915, p = 0.1135) to verify the assumption of the equality of variances.
We have fulfilled the assumptions of the analysis of variance. To verify the assumption of the equality of variances, we also use the parametric multivariate Box M test designed for the analysis of covariance (Box M = 17.622, Chi-Sqr. = 16.481, df = 12, p = 0.1702). The test is statistically insignificant, so the hypothesis of the equality of variances (homogeneity of variance-covariance matrices) is not rejected. We can state that there was no violation of the assumption.
From the graphs (
Figure 6a–e) we verify the condition of the equality of the regression coefficient in the groups. If the particular lines have approximately the same slope, the condition is met.
The curves are similar, which means the regression coefficient is approximately the same in all groups.
From
Table 8 we can see that the relationship between the posttest and the pretest is statistically significant (
p < 0.05), which means that the pretest results affected the posttest results. We reject the null hypothesis stating that the difference in the posttest score between the conBc, expBc, conM, expM, and expPhD groups is not statistically significant, which means that the dependent variable posttest depends on the factor group.
It can be seen from
Figure 7 that even after taking into account the pretest, there are statistically significant differences between the groups. We can see that all experimental groups. expBc, expM, and expPhD, have achieved better results in the posttest.
From the multiple comparisons (
Table 9), we have identified three homogeneous groups (
p > 0.05): the control (conBc, conM), the experimental (expBc, expM), and the experimental with PhD education. We assume that the higher level of knowledge achieved in the expPhD group was due to motivation and greater interest in knowledge in the field of statistical processing of research data, as it is a group of students whose interest in research is natural.
4.3. The Identification of the Problem Phases in Solving a Causal Research Problem
The identification of the problem phases was carried out on the experimental group of bachelor, master, and PhD students. For each participant from these groups, the particular phases of the experiment processing (posttest: project) were evaluated with a value of 0 or 1, where 1 means a successfully completed phase and 0 an unsuccessfully completed phase. To identify the problem phases, we used Friedman test and Cochran Q-test [
25], through which we test whether there are differences in the evaluation of the particular phases of experimental processing. We used a non-parametric method for the analysis since the data come from an unknown distribution and the variables (evaluations of the particular phases) are dichotomous.
Based on the results of the Friedman test (N = 4, df = 8, ANOVA Chi-Sqr. = 51.565, p < 0.001), we reject the null hypothesis at the 0,001 significance level that there is no statistically significant difference in the evaluations of the particular phases. Considering that the examined variables are dichotomous, we will rely mainly on the results of the Cochran Q test, which is a valid method considering the nature of the data.
Based on the Cochran Q test, we reject the null hypothesis at the 0.001 significance level (
Q = 51.565,
df = 8,
p < 0.001), which states that there is no statistically significant difference in the success of processing the particular phases of the experiment. The results are identical, we can consider them robust. It is clear from
Figure 8 that the participants had the least problem with the analysis of reliability, the analysis of variance and with the analysis of covariance. They had some problems with the parts concerning the verification of the assumptions for the analysis of variance, the analysis of covariance and the part concerning the correlation matrix, which we could include among the assumptions of the analysis of reliability. They understood this part a little less. The biggest problems for them were the sections with descriptive statistics, especially with the interpretation of descriptive statistics, although the success rate ranged from 58% to 73%, which is not the worst result at all. Overall, it can be said that the participants managed the project very well. The analyzes themselves were successful with 92% to 97%, but they did not quite understand it, the mentioned weaker parts with descriptive statistics tell us about it.
The Kendall Coefficient of Concordance obtains values from the range 0–1, where 0 means mismatch and 1 means absolute agreement. In our case, the value of the coefficient of the agreement is small, which confirms the results of the Cochran Q-test. After rejecting the H0, we are interested in which pairs are statistically significant. It can be seen from the
Table 10 that there is no statistically significant difference in success between the sections on assumptions and the data analysis itself. The difference can be seen only in the success of descriptive statistics for ANOVA and ANCOVA and especially in success of the part of descriptive statistics for the analysis of reliability.
5. Discussion
A large part of the educational content has already moved to the virtual environment, the distance education has risen strongly, and it seems that this trend will accelerate under the influence of the current climate change, the global epidemiological measures, and other influences [
26].
Abad-Segura [
27] have analyzed trends in global research on digital transformation and have shown the improvements that digital technologies entail, both in the quality of higher education, as in teacher training and professional development.
We have focused our view on MOOCs, which are very popular among the forms of distance non-formal education. The MOOCs combine education based on the principles of freedom and sharing with elements of community education and online webcast lectures or videos, supplemented by classic educational materials and links to available resources and literature.
Based on the results, we found out that the course, which aimed to teach students to carry out the experiment and clarify the various stages of statistical processing of the experiment has a positive impact on the knowledge needed to solve causal research problems, which are considered the most challenging and valuable in the field of didactics.
Thanks to the analysis of covariance we found out that the positive impact of the course on the results of the participants was not influenced by their knowledge of statistics obtained before the experiment. The analysis showed that even after taking into account the pretest, the positive impact of the course is obvious, although the differences between the two groups in the achieved knowledge have slightly decreased.
As our sample was divided into three stages of education, we decided to analyze the results of the course according to this parameter.
By the second analysis of covariance, we verified whether the achieved knowledge in the posttest did not depend on the pretest and at the same time we also took into account the degree of education achieved. It was reaffirmed that the statistically significant differences between the control and experimental groups were significant, especially in favor of the experimental ones. The differences between the particular groups after taking into account the results of the pretest have decreased, but they are still so significant that they point out to a positive effect compared to the control group.
In the last part of this article, we focused on the identification of the problematic phases in the course by project analysis (posttest). By multiple comparisons, we found out which phases appeared to be problematic and with which, on the contrary, they had no problems or they had only minor problems. The participants had the greatest problems in understanding the data in all three analyzes: reliability, variance, and covariance. They were much successful at verifying the assumptions and had almost no problems with the analyzes’ results. It follows that the participants of all experimental groups were able to cope very well with the results of analysis, a little worse, but they were still very good in making assumptions, but they had significant problems with understanding the data. The surprising finding was that the participants had the most problems with data exploration. The importance of the data understanding was underestimated when creating the course. Although this phase is the least computationally demanding, it is very important, given that it is subsequently associated with the correct determination of null statistical hypotheses as well as when choosing the right statistical tests. The students did not understand the meaning and did not realize the importance of this phase. The key phase of experimental data processing was underestimated by the course creators as well as by the students themselves, who focused more on the more computationally demanding phases of experimental processing.
The analysis shows that it is necessary to pay attention to this part of the course and focus on reworking this part of the course, choose another form, explain, etc.
6. Conclusions
The content of the course created by us called Processing of experimental data was to teach the participants to realize the experiment and to clarify the particular phases of statistical processing of the experiment. The environment of the MOOC, which offers open, non-formal and community education and currently represents the most popular educational opportunity on the Internet, seemed to us to be the most suitable for the realization of our plan. We decided to verify the effectiveness of the course according to the achieved degree of study of the course participant to better evaluate its effectiveness and impact. Subsequently, the project (posttest) was analyzed in order to identify the problematic parts of the course as well as the process of processing experimental data.
Our aim was to create a didactically effective MOOC to support the solution of causal research problems in the domain of learning theory in informatics, designed mainly for the community of students and teachers of informatics (final thesis, attestation, and research works), which was reflected in the quality of knowledge of the course participants. We see the benefit in arousing the interest of the course participants in the results of the research and processing of experimental data, especially by the PhD students. The knowledge achieved in this field by the groups of bachelor and master student can also be considered significant, but their motivation or interest in research was weaker. Therefore, we can say that our hypothesis about the using MOOC has a potential to improve students’ knowledge and foster their skills in pedagogical research has been confirmed. Furthermore, the increased interest in the results of the research of one of the groups as well as in the realization of their own research was also confirmed.


