Article

A New Coking Coal Charging Method for 6 m Top-Charged Coke Oven: System Design and Experiment

School of Environment Science and Engineering, Tianjin University, Tianjin 300350, China
*
Author to whom correspondence should be addressed.
Appl. Sci. 2021, 11(1), 33; https://doi.org/10.3390/app11010033
Submission received: 1 December 2020 / Revised: 17 December 2020 / Accepted: 20 December 2020 / Published: 23 December 2020
(This article belongs to the Section Applied Industrial Technologies)

Abstract

:
Coking with low moisture coal is an important link of energy conservation and coke quality improvement in the coking industry. Aiming at the problems of dust emission and bad accumulation in the coking chamber during coal charging, a new system of coking coal charged into 6 m top-charge coke oven was studied and designed, in which a cylinder with telescopic and high temperature resistance was used to fill the coking chamber with a dense phase continuous flow. The coal transport characteristics, dust emission, and accumulation characteristics were studied through the actual operation of the equipment. The results found that the matching of spiral feeding speed and cylinder lifting speed had an important influence on the transport characteristics, when moisture was 5%, and the control dense phase transport conditions were—cylinder lifting speed of 0.02 m/s and spiral feeding speed control range of [0.31 m/s, 0.50 m/s]. The new device was found to reduce dust emission by 90% per square meter, compared to the traditional. The influence of controllable factors on the accumulation characteristics of coal was studied, and the essential conditions for optimal repose angle and bulk density were obtained through an orthogonal test, the prediction model of accumulation characteristics was established.

1. Introduction

Coal moisture control belongs to the coking coal pretreatment technology, in which the raw coking coal is dehydrated in the dryer before charging into the coking chamber. This technique is used to reduce and stabilize its moisture, then select a target value before charging the furnace for coking [1,2]. Through moisture regulation, it can reduce the heat dissipation, shorten the coking time, improve the coke quality, increase coke oven capacity, and reduce energy consumption [3,4,5,6]. According to research in China and abroad, the effect of coking is best when the moisture content of coal drops to 5% or 6% [7,8].
However, we found that there are serious problems during coal charging into coking chamber after desiccation pretreatment. In Figure 1, the charging process of low-moisture coal would produce a lot of particle dust due to thermal buoyancy, which would be discharged through the charging port in a short time. The dust emission from coking coal charging accounts for 35–40% of total pollutant emission in the whole coking process [9]. In addition, coal dust produced in the coking chamber would be mixed with the waste gas and discharged through the pipeline. With the increase of coking times, the corrosion and blockage of pipeline are caused. According to the current dust removal technology, dust suppression or dust removal equipment are mostly used to solve the dust problem. C.R. Copeland [10,11] found that improving suppressant longevity and using a hygroscopic reagent led to an average 85–86% reduction in PM10 concentrations. However, under the condition of 800–1000 °C in the coking chamber, the dust suppressant will evaporate or lose its viscosity at high temperature, thus losing its effect. In addition, the application of dust suppressant and dust removal equipment is not easy to prevent dust escaping into the coking chamber. Through further studies, scientists developed the separation of fine particles from raw coal during coal drying [12,13,14,15], the equivalent diameter of fine particles was increased by granulation after dust removal, then mixed with coarse particles and charged into the furnace. The process controls the increase of dust in the waste gas and tar, while keeping the low moisture content of the coking coal in the furnace, but at the same time, it also leads to high energy consumption in the dust removal process and frequent replacement of the dust removal bag [16]. Segregation is easy to occur during coal charging, after mixing fine granule and coarse granule [17,18,19,20].
Focusing on the problem, we start with the coking coal charging method and proposed a new coal charging method in the top-charged coke oven, the equipment mainly consists of spiral feeding and high temperature resistant telescopic feeding device, this method was mainly inspired by the method of feeding flour bags with cylindrical filling pipe [21].
In theory, the technology of this device mainly controls the amount of dust brought by reducing the falling height of the coal particles with low-moisture and limiting the escape of particles under the action of the cylinder wall during the coking chamber [22,23]. In addition, the repose angle and bulk density of coal in the coking chamber were optimized by the method of adjusting the lifting speed of the cylinder and increasing the guide plate at the blanking outlet. Through the above research and analysis, the main contributions of this paper are as follows:
(1)
Choose suitable high-temperature resistant materials.
(2)
Design an experimental study of a new coal charging device based on the 6 m industrial top-charged coke oven. Then, run the device in the cold mode and no coal charging conditions; observe and research the feasibility of the device in terms of mechanical properties.
(3)
During coal charging with the new equipment, the dust emission and distribution range were tested and simulated, and compared with the traditional top charging method.
(4)
During coal charging with the new equipment, the transportation mode of coal was analyzed to explore the laws and control conditions of different phase flow.
(5)
The influence of controllable factors on the accumulation characteristics of coal was studied, then necessary conditions of optimal repose angle and bulk density were determined.
(6)
The prediction model of accumulating characteristics during coking coal charging was established.
In short, the key point was to optimize the low moisture coking coal top charging technology in the coke oven. This would provide technical support and theoretical reference for the promotion and application of top-charged coke oven.

2. Materials and Methods

2.1. Experiment Materials and Equipment

2.1.1. Materials

The raw material was coking coal from the Xingtai area of the Hebei province, the particle size distribution was less than 3 mm, its moisture content was about 11%. Physical and chemical properties of the principal components are shown in Table 1. It was compared with the other three coal production bases in China, the physical and chemical properties of coal were compared [24].
According to Table 1, ash content in Xingtai was lower, the adhesion and expansion were better after heating. Sulfur is also relatively low, thus acid corrosion of flue gas occurs not easily. Compared to other coal samples, its volatiles were slightly higher, C, H, N were flat with other area.

2.1.2. Experimental Instruments

Platform experimental instruments mainly included—thermal mechanical simulation testing machine, particulate sampler, electric constant temperature drying oven, electronic scales, digital display angle ruler, distance measuring tape, electronic hoist scale, data acquisition and analysis system, etc. During the testing process, the integrated functions of the process control, online monitoring, data recording and data output were realized, and interfaces for other devices were designed online.

2.1.3. Coal Charging Equipment

The coal charging experiment simulation of 6 m top-charged coke oven was carried out on the self-made coal charging device in the laboratory. The experimental platform included screw feeder, telescopic cylinder, and a control cabinet, as shown in the Figure 2. The telescopic part consisted of four cylinders, the height of each cylinder was 1.5 m. The conveying capacity of the screw feeder was 3000 kg/min. Coking chamber size—length× width × height = 15 m × 0.5 m × 2.0 m.

2.2. Methods

2.2.1. Equipment Principle and Operation

Design Ideas and Schemes

The decrease of coal moisture in the furnace would lead to an increase in coal dust taken out of the waste gas, which would cause the gas transmission system resistance to increase, and the spray pipe of the primary cooler to be blocked by the lump of coal and tar. According to the low moisture coking coal into furnace problems, we start with the following objectives:
(1)
Establish a new method and technology for low moisture coal into furnace.
(2)
The high temperature of the coking chamber needs high requirements for equipment.
(3)
Simplified equipment structure, easy operation.
(4)
Low dust emission in the coal charging process
(5)
Convenient feeding and continuous charging.
(6)
Good accumulation effect at the bottom of the coking chamber.
(7)
The flow of coal towards the length of the coking chamber to reduce its pressure on the furnace wall.
A B.B. Feng et al. study showed that the cylindrical filling pipe blanking used by reducing the height of the blanking could effectively control the dust [21]. In addition, referring to the device principle and characteristics of powder pneumatic conveying, it not only reduces dust discharge and raw material waste, but is also convenient for conveying and is simple to operate [25,26]. Due to the limitation of pipeline space, dust particles cannot escape the external space.
Based on the above analysis, a high-temperature resistant cylinder inserted into the coking chamber is designed to realize low moisture content of coking coal into furnace and low dust production, the design principle is shown in Figure 3. This method requires that the charging process is fast and the guiding structure promotes the flow of coal towards the length of the coking chamber, simple structure, easy operation, convenient feeding, and continuous charging.

Operating Principle and Equipment Characteristics

The charging of coal in the new equipment mainly consists of two stages. (1) Extend the retractable cylinder from the charging hole of the furnace to the bottom of the coking chamber. (2) The coal is fed from the bottom of the coal hopper to the top of the cylinder through the screw feeder and then into the coking chamber through the cylinder blanking port. The specific operation process and principle are as follows:
After the loader with the dried coking coal is moved above the charging hole in the coking chamber of the coke oven. Open the charging hole and the coal cylinder drop switch immediately, the charging cylinder extends from the charging hole into the coking chamber by its own weight; then start the screw feeder and feed the coking coal into the cylinder and lead it into the bottom of the coking chamber. As the cylinder is lifted upward, the coal flows from the outlet at the bottom of the cylinder into the chamber mainly in the direction of the length of the chamber, until all ordered coal flows into the carbonization chamber, and the coal loading process is complete; at the same time, the cylinder should be taken back and the coal charging hole should be covered, this completes the charging process. The details of this operating principle in Figure 4. In the Figure, VL is the charging speed of coal, VT is the cylinder lifting speed.
The equipment has the following characteristics:
(1)
The coal charging system is compact and simple.
(2)
The bottom of the cylinder is provided with a guide plate. The coal can flow along the length of the coking chamber, reduce the pressure of coal accumulation towards the width of the furnace wall, and form a better accumulation effect; the details are in Figure 5.
(3)
The cylinder is a single-layer wall, a sliding block and a sliding groove are arranged between the adjacent cylinders. A large diameter cylinder might be moved up or down along the axis of a small diameter cylinder.
(4)
The top of the cylinder is provided with a reinforcing rib, which can prevent the cylinder from easily deforming.

Key Parts Design and Selection

The main key parts of the equipment include four parts—(1) screw feeder; (2) winch hoist; and (3) cylinder materials.
Among them, the transporting capacity of the spiral feeder is designed according to the time required to complete a coal loading in a 6 m top-charged coke oven. The final selected transporting capacity is 300 m3/h. The rotating speed of the winch hoist mainly affects the lifting speed of the cylinder, and then directly influences the charging time, according to the coking coal, charging time shall not exceed five minutes in the 6 m top-charged coke oven, the hoisting speed range of hoist was selected: 0.01–0.05 m/s.
The most important and critical is the high-temperature resistance of the material used to make the cylinder, it depends on whether the cylinder can successfully complete the whole process of loading coal into the carbonization chamber. By selecting different high-temperature resistant materials and material thickness, the thermal deformation experiment of materials was carried out in the thermal mechanical simulation testing machine. The material thickness was set as 1.0 mm, 1.5 mm, 2.0 mm, 2.5 mm, and 3.0 mm, respectively. According to the internal temperature range of the industrial coke oven, the experimental temperature was set at 1000 °C. Then, the thermal deformation of various materials over time were observed and studied, the time range was set as 0–10 min. Finally, appropriate materials were selected according to the experimental results. The detailed test design is in Table 2.

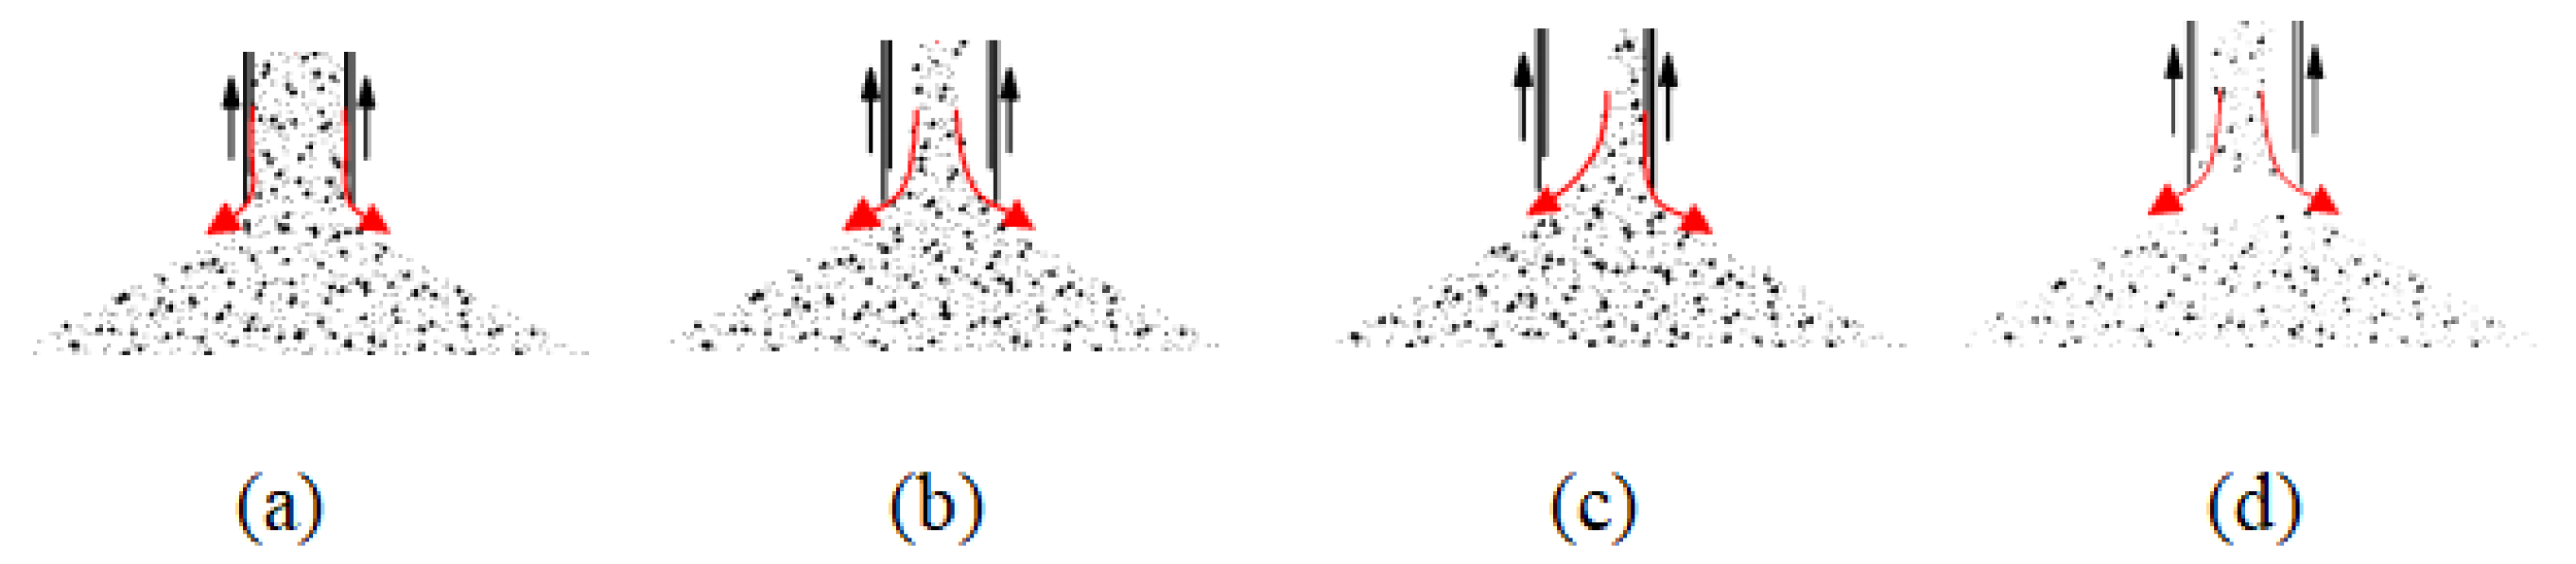
2.2.2. Characteristics of the Coal Transport with the New Charging Method

During the material transport process, the ideal transport condition is that the coal is continuously charged into the carbonization chamber along the cylinder blanking outlet, under the action of the screw extrusion pressure of the screw conveyor. This principle is similar to that of pneumatic transmission, therefore, coal transporting modes could also be divided into a dense phase and dilute phase. When the coal moves in a plunger shape within the cylinder, it could be regarded as the dense phase flow. When the coal in the cylinder are dispersed among each other, the transporting can be regarded as dilute phase flow [27].
During the experiment, the feeding speed of the screw conveyor and the lifting speed of the cylinder are matched and adjusted, to select a reasonable mode of coal transport.

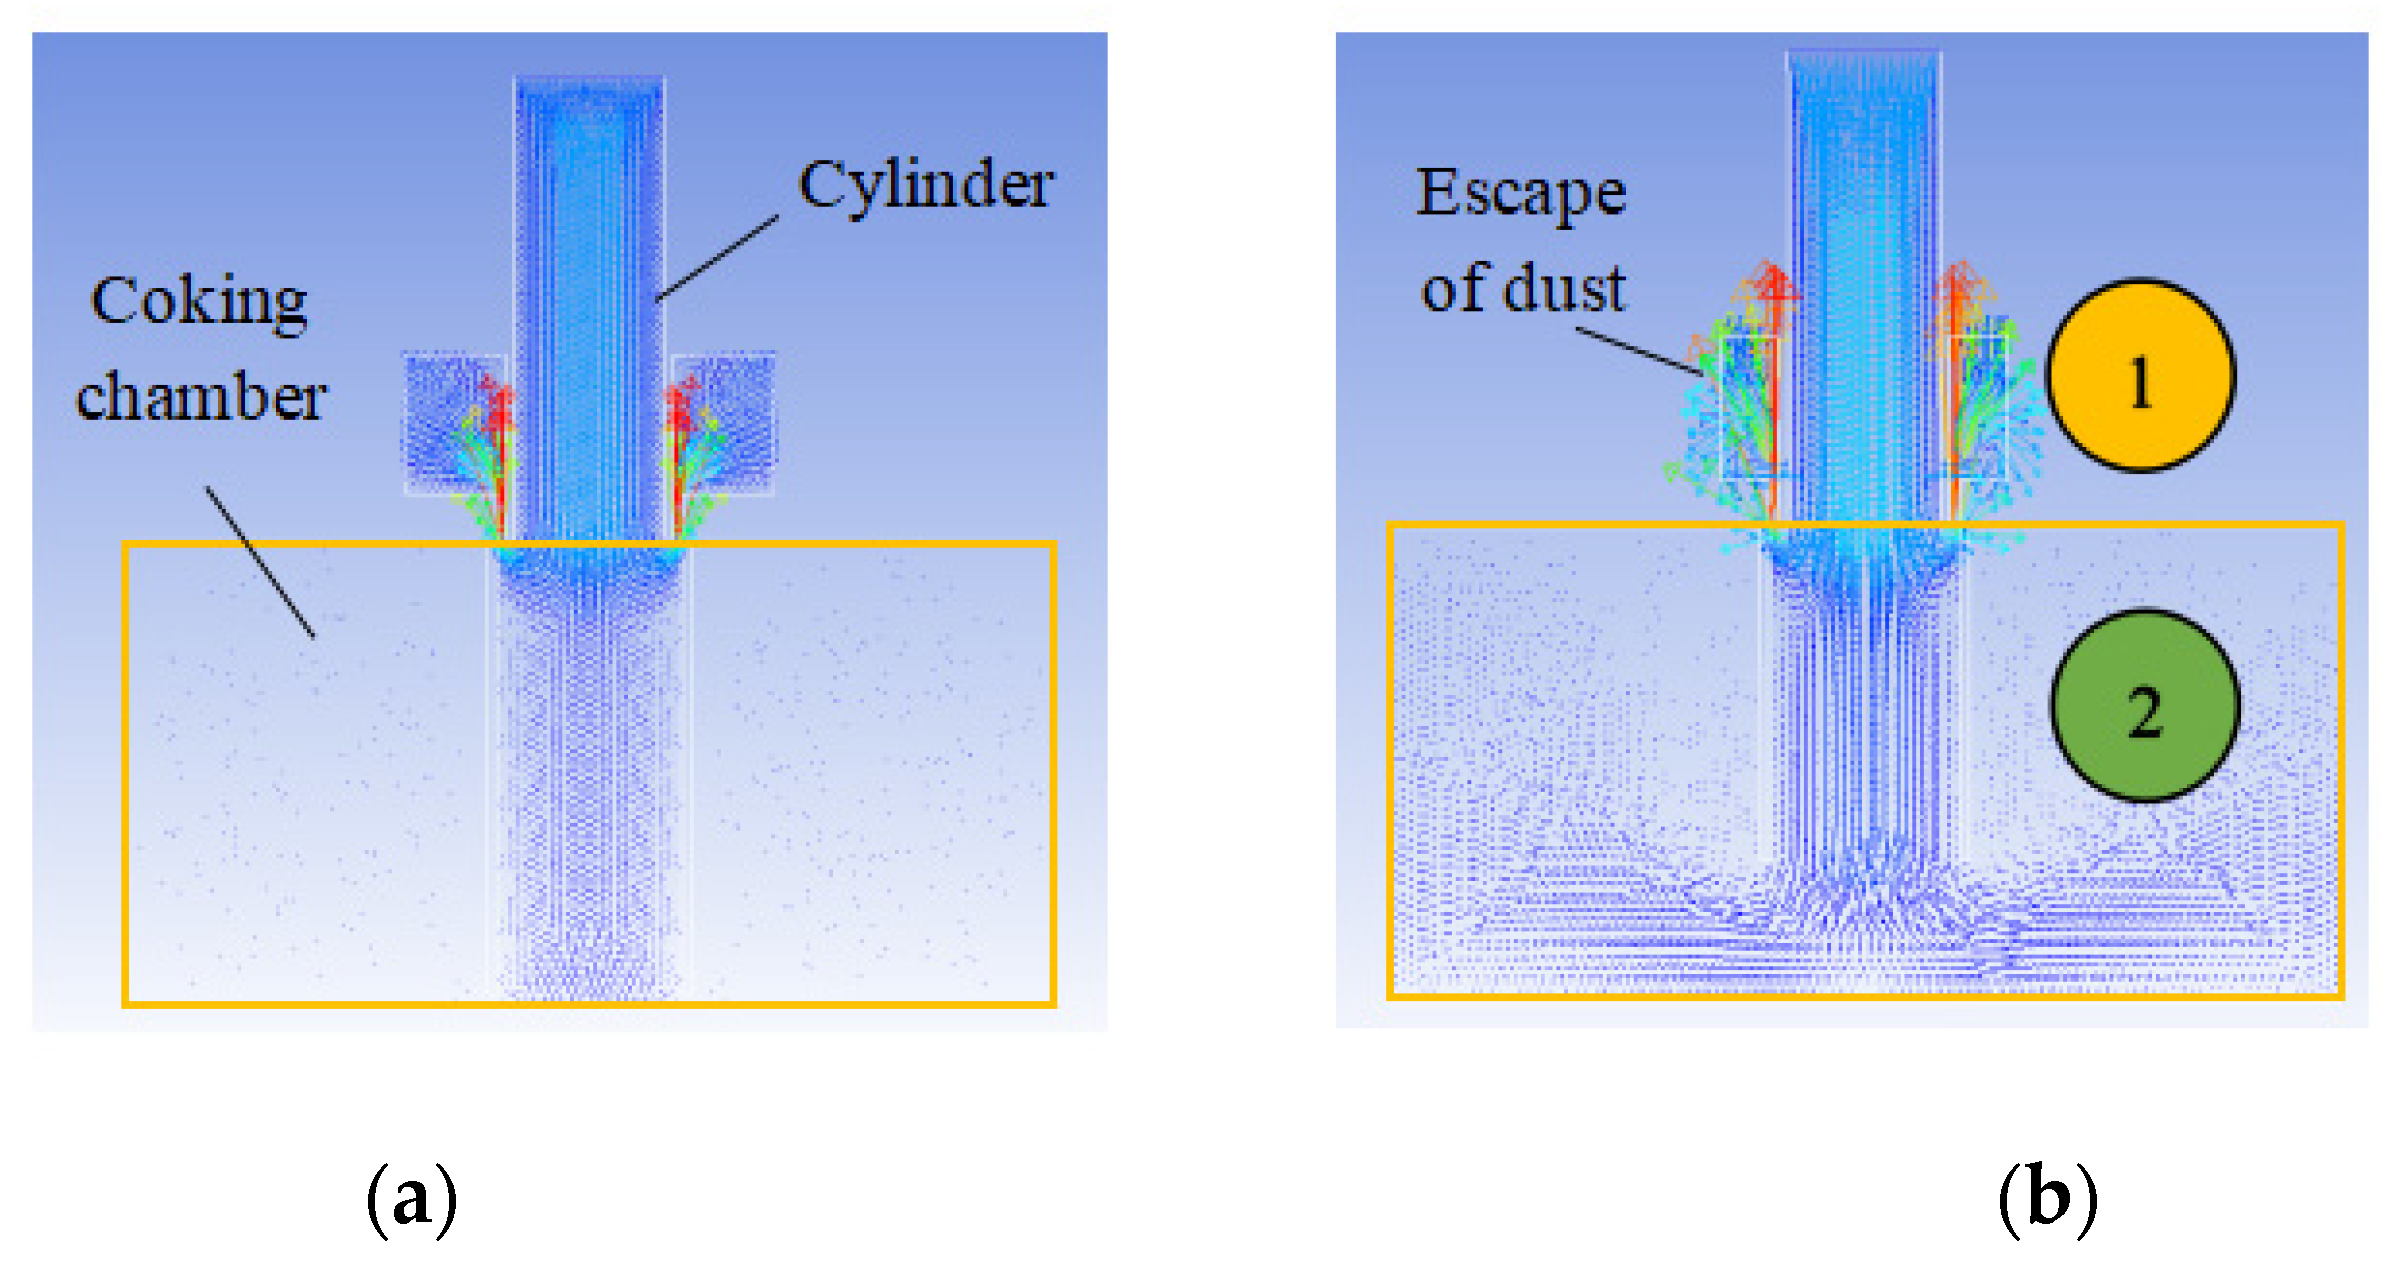
2.2.3. Dust Emission and Distribution during Charging
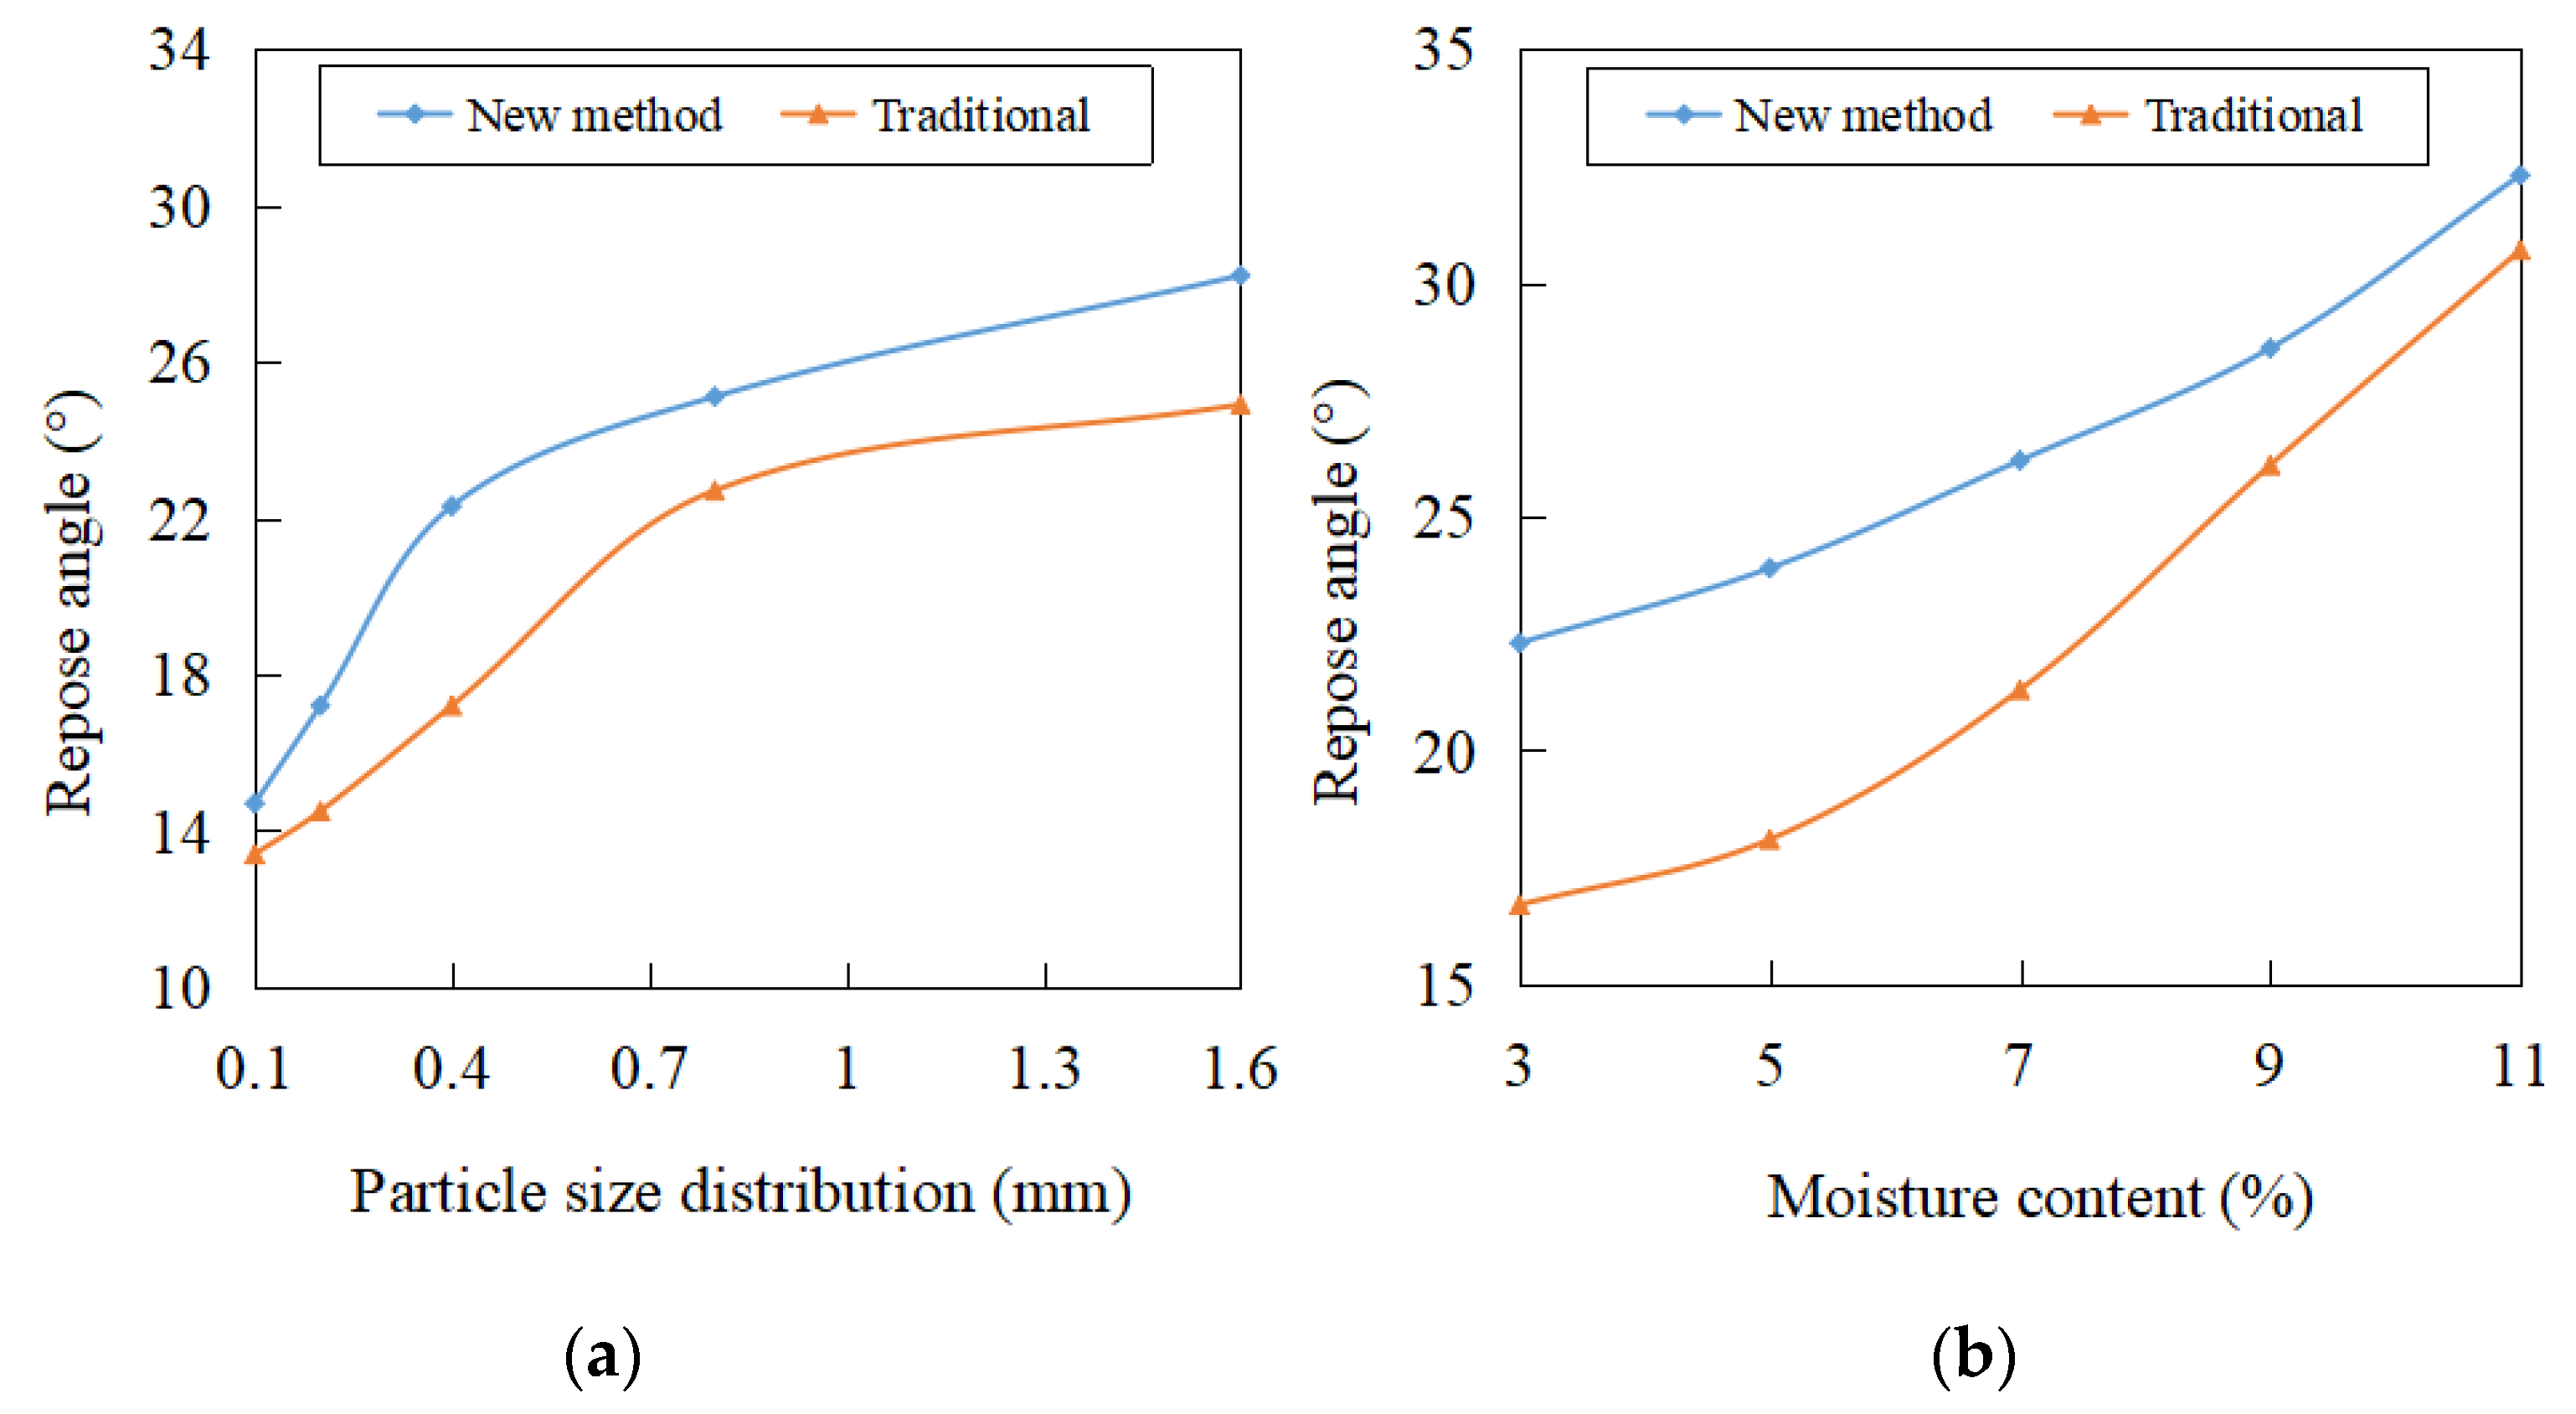
The dust emission characteristics of the coal charging process is an important index to measure the advantage of the new coal charging device compared to the traditional one [28]. Therefore, it is necessary to study the particle dust emission and particle distribution range during coal charging. The experimental research is mainly based on the new charging method and the traditional, and study on the variation law of dust emission concentration of coal samples with different moisture (11%, 9%, 7%, 5%) content over time. The test location is mainly near the charging port and the coking chamber.
Dust concentration testing equipment mainly adopts LBT-GCG5000 dust concentration sensor, the instrument utilizes the principle of light refraction to detect dust, and the microprocessor performs operation on the detected data to directly display the dust mass concentration and convert it into data signal output. The sensor is composed of sampling head, detecting device, single chip microcomputer system, and an air extraction system. It has the characteristics of easy to carry, rapid, and accurate measurement, high detection sensitivity and stable performance. The instrument ranges from 0.001 mg/m3 to 5000 mg/m3; resolution is 0.001 mg/m3; sampling flow rate is 2 L/min; measurement error is no more than ±10%.

2.2.4. Repose Angle

When the coal flows from the blanking outlet of the cylinder to the bottom of the coking chamber, the coal accumulates in the bottom plane of the coking chamber and a conical accumulation body, and a certain inclination angle is formed, this angle is called the repose angle. The smaller the repose angle, the lesser is the friction and the better is the liquidity. It is generally believed that liquidity is good when the angle is no more than 30°, and can meet the liquidity demand in the production process when it does not exceed 40° [29]. Some studies indicate that fine particles and high moisture coal have strong compressibility and agglomeration. Additionally, the gravity and friction between particles are different when sliding on the free inclined plane of coal accumulation horizon with different moisture content and different particle sizes; then, the repose angle is directly affected. Therefore, the coal samples with different particle size distribution and different moisture content were prepared by screening and moisture control of raw coal. Finally, the effects of coal particle size distribution and moisture content on repose angles were studied by using different charging methods.
In addition, according to the powder mechanics, the repose angle of the falling powder on the plane is also related to the process [30,31,32,33].

2.2.5. Bulk Density

The bulk density of coal is defined as the mass M of coal divided by the bulk volume [34]:
ρ = M V
The bulk density of coal mainly depends on the physical properties of coal particles and the charging method. This study mainly compares and analyzes the influence of coal material characteristics on the bulk density under the new coal charging method and the traditional method. In addition, by adding the contrast term, the bulk density of coal under different particle size distribution and water content in tamping state is also analyzed. New coal charging method refers to the non-natural accumulating, after falling into the coking chamber due to the bridging effect on the cylinder wall surface. Traditional accumulating refers to the condition of infinite wall effect, through which coal is slowly deposited under the action of gravity. Tamping density is the closest accumulation achieved by mechanical vibration.

2.2.6. Design of Experimental Scheme for Optimization of Coal Accumulation

Through the previous analysis, it could be known that different coal characteristics might have different influences on the coking coal accumulation. Here, by changing various experimental conditions and factors, coal accumulation of the new charging method after the coal charged was continuously, was optimized to find out various control conditions corresponding to the best accumulation effect. However, for the multi-factor test, orthogonal test design was a simple and common design method. The basic program of orthogonal test design included two parts—a test scheme design and result analysis [35,36]. This test design is a method that the orthogonal table used to arrange and analyze multi-factor tests. It is made up of all horizontal combinations of experimental factors, some representative horizontal combinations were selected for testing, then the best horizontal combination was found [37].
The main indices of the study are bulk density and repose angle of the coking coal. Obviously, the greater value of the bulk density of coking coal and the smaller the repose angle of coking coal, the better the effect of accumulation. However, in this part of the experimental design process, in addition to the consideration of the particle characteristics, the method of coal charging on the accumulation was also considered. Changing the coal charging method had two modes (cylinder lifting speed and blanking height).
Therefore, the experiments could be designed as four factors. A-Coal particle size distribution, B-Coal moisture content, C-Cylinder lifting speed, and D-blanking height. Then, five levels were set for each factor, as shown in Table 3.
The combination of four factors and five levels was 54 = 625; this is difficult to do in scientific experiments. The orthogonal design is to select some representative test points (horizontal combination) from the overall test points in the selected optimal area to carry out the experiment [38]. In Figure 6, each squares is marked with the test number, the test points were selected from the original by an orthogonal table; this was L25 (56).

3. Results and Discussion

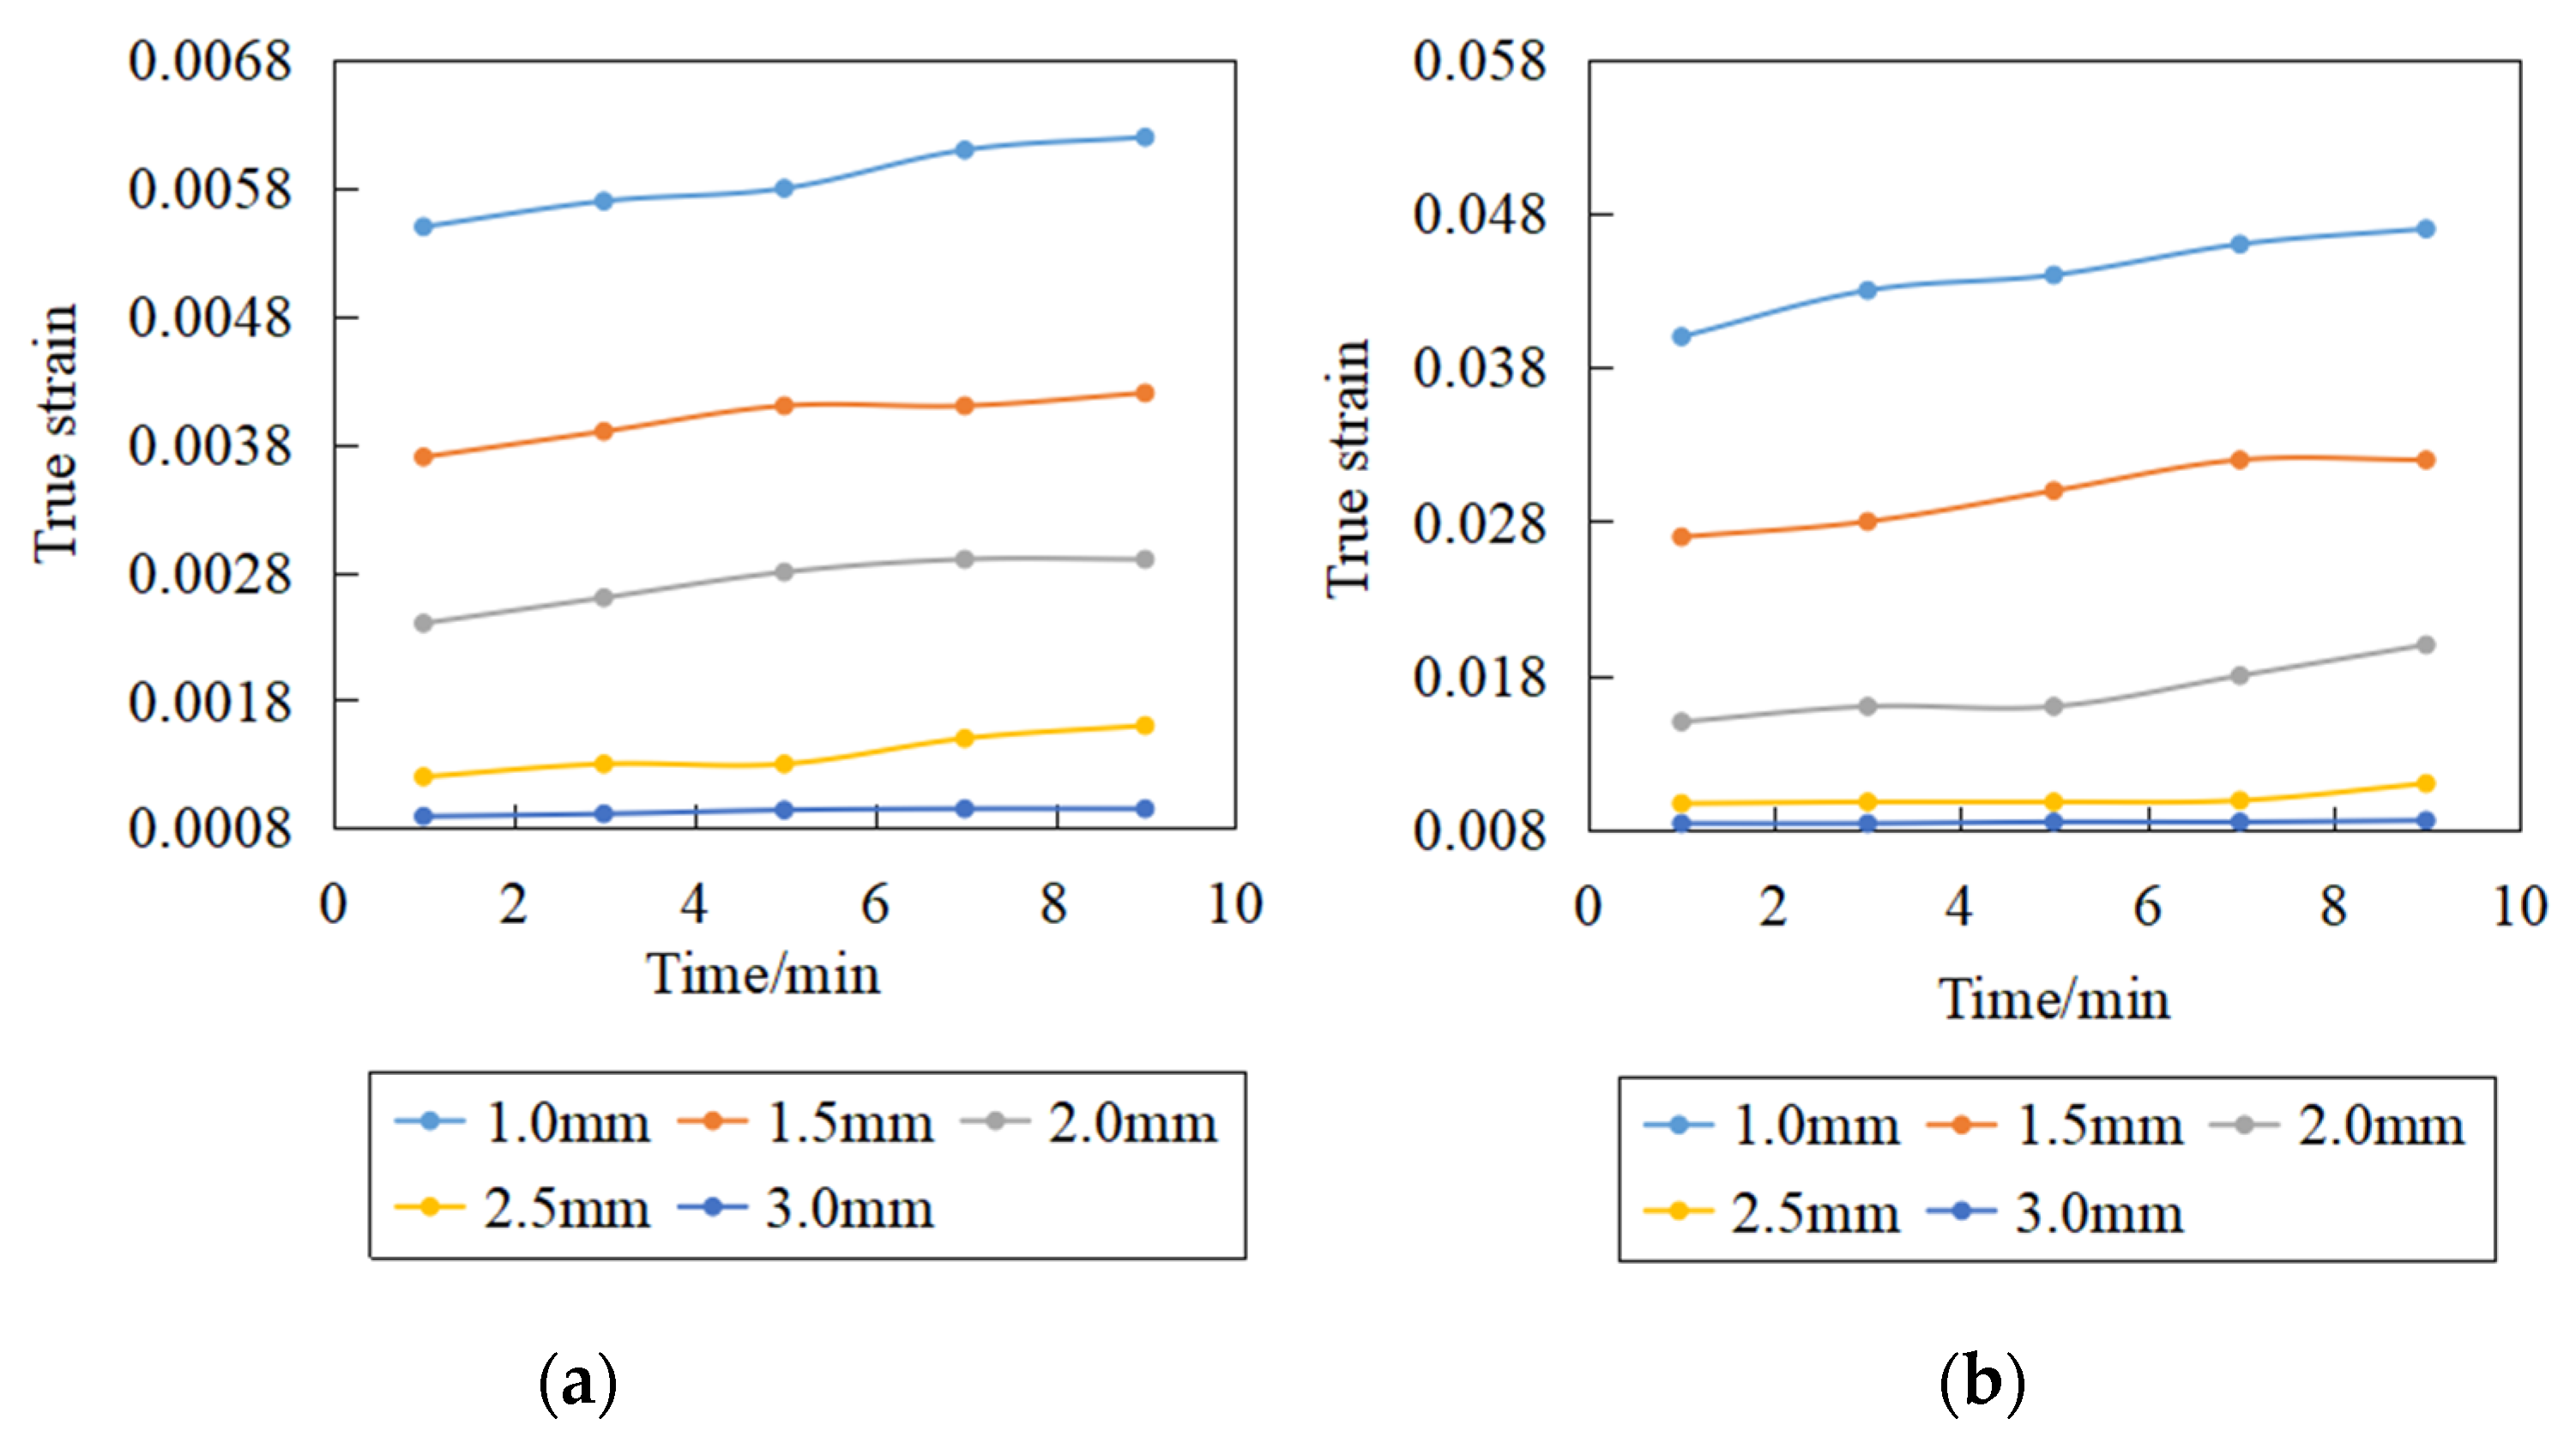
3.1. Selection of High-Temperature Resistant Materials

It showed the variation of true strain with time, under the condition of 1000 °C for different metal material properties in Figure 7. In the Figure, (a) is the 310 austenitic chromium nickel stainless steel; (b) is the 410 Ferritic stainless steel. It was observed that the true strain values of the two metal materials increased with the extension of heating time, but the overall increase trend was slow. When the thickness of the metal material exceeded 2.5 mm, the decrease amplitude weakened, and the strain value decreased with time and tended to be stable. The result was found by the thermal deformation law of the two materials, the strain of 310 s was much less than that of 410 ferrite, this indicated that in the high temperature environment, the material stability and strength of 310 s were better after being heated. Finally, based on the size of the coking chamber and the diameter of the coke oven charging hole, it was more appropriate to choose the cylinder thickness of 2.5 mm and the material selection of 310 austenitic chromium nickel stainless steel.

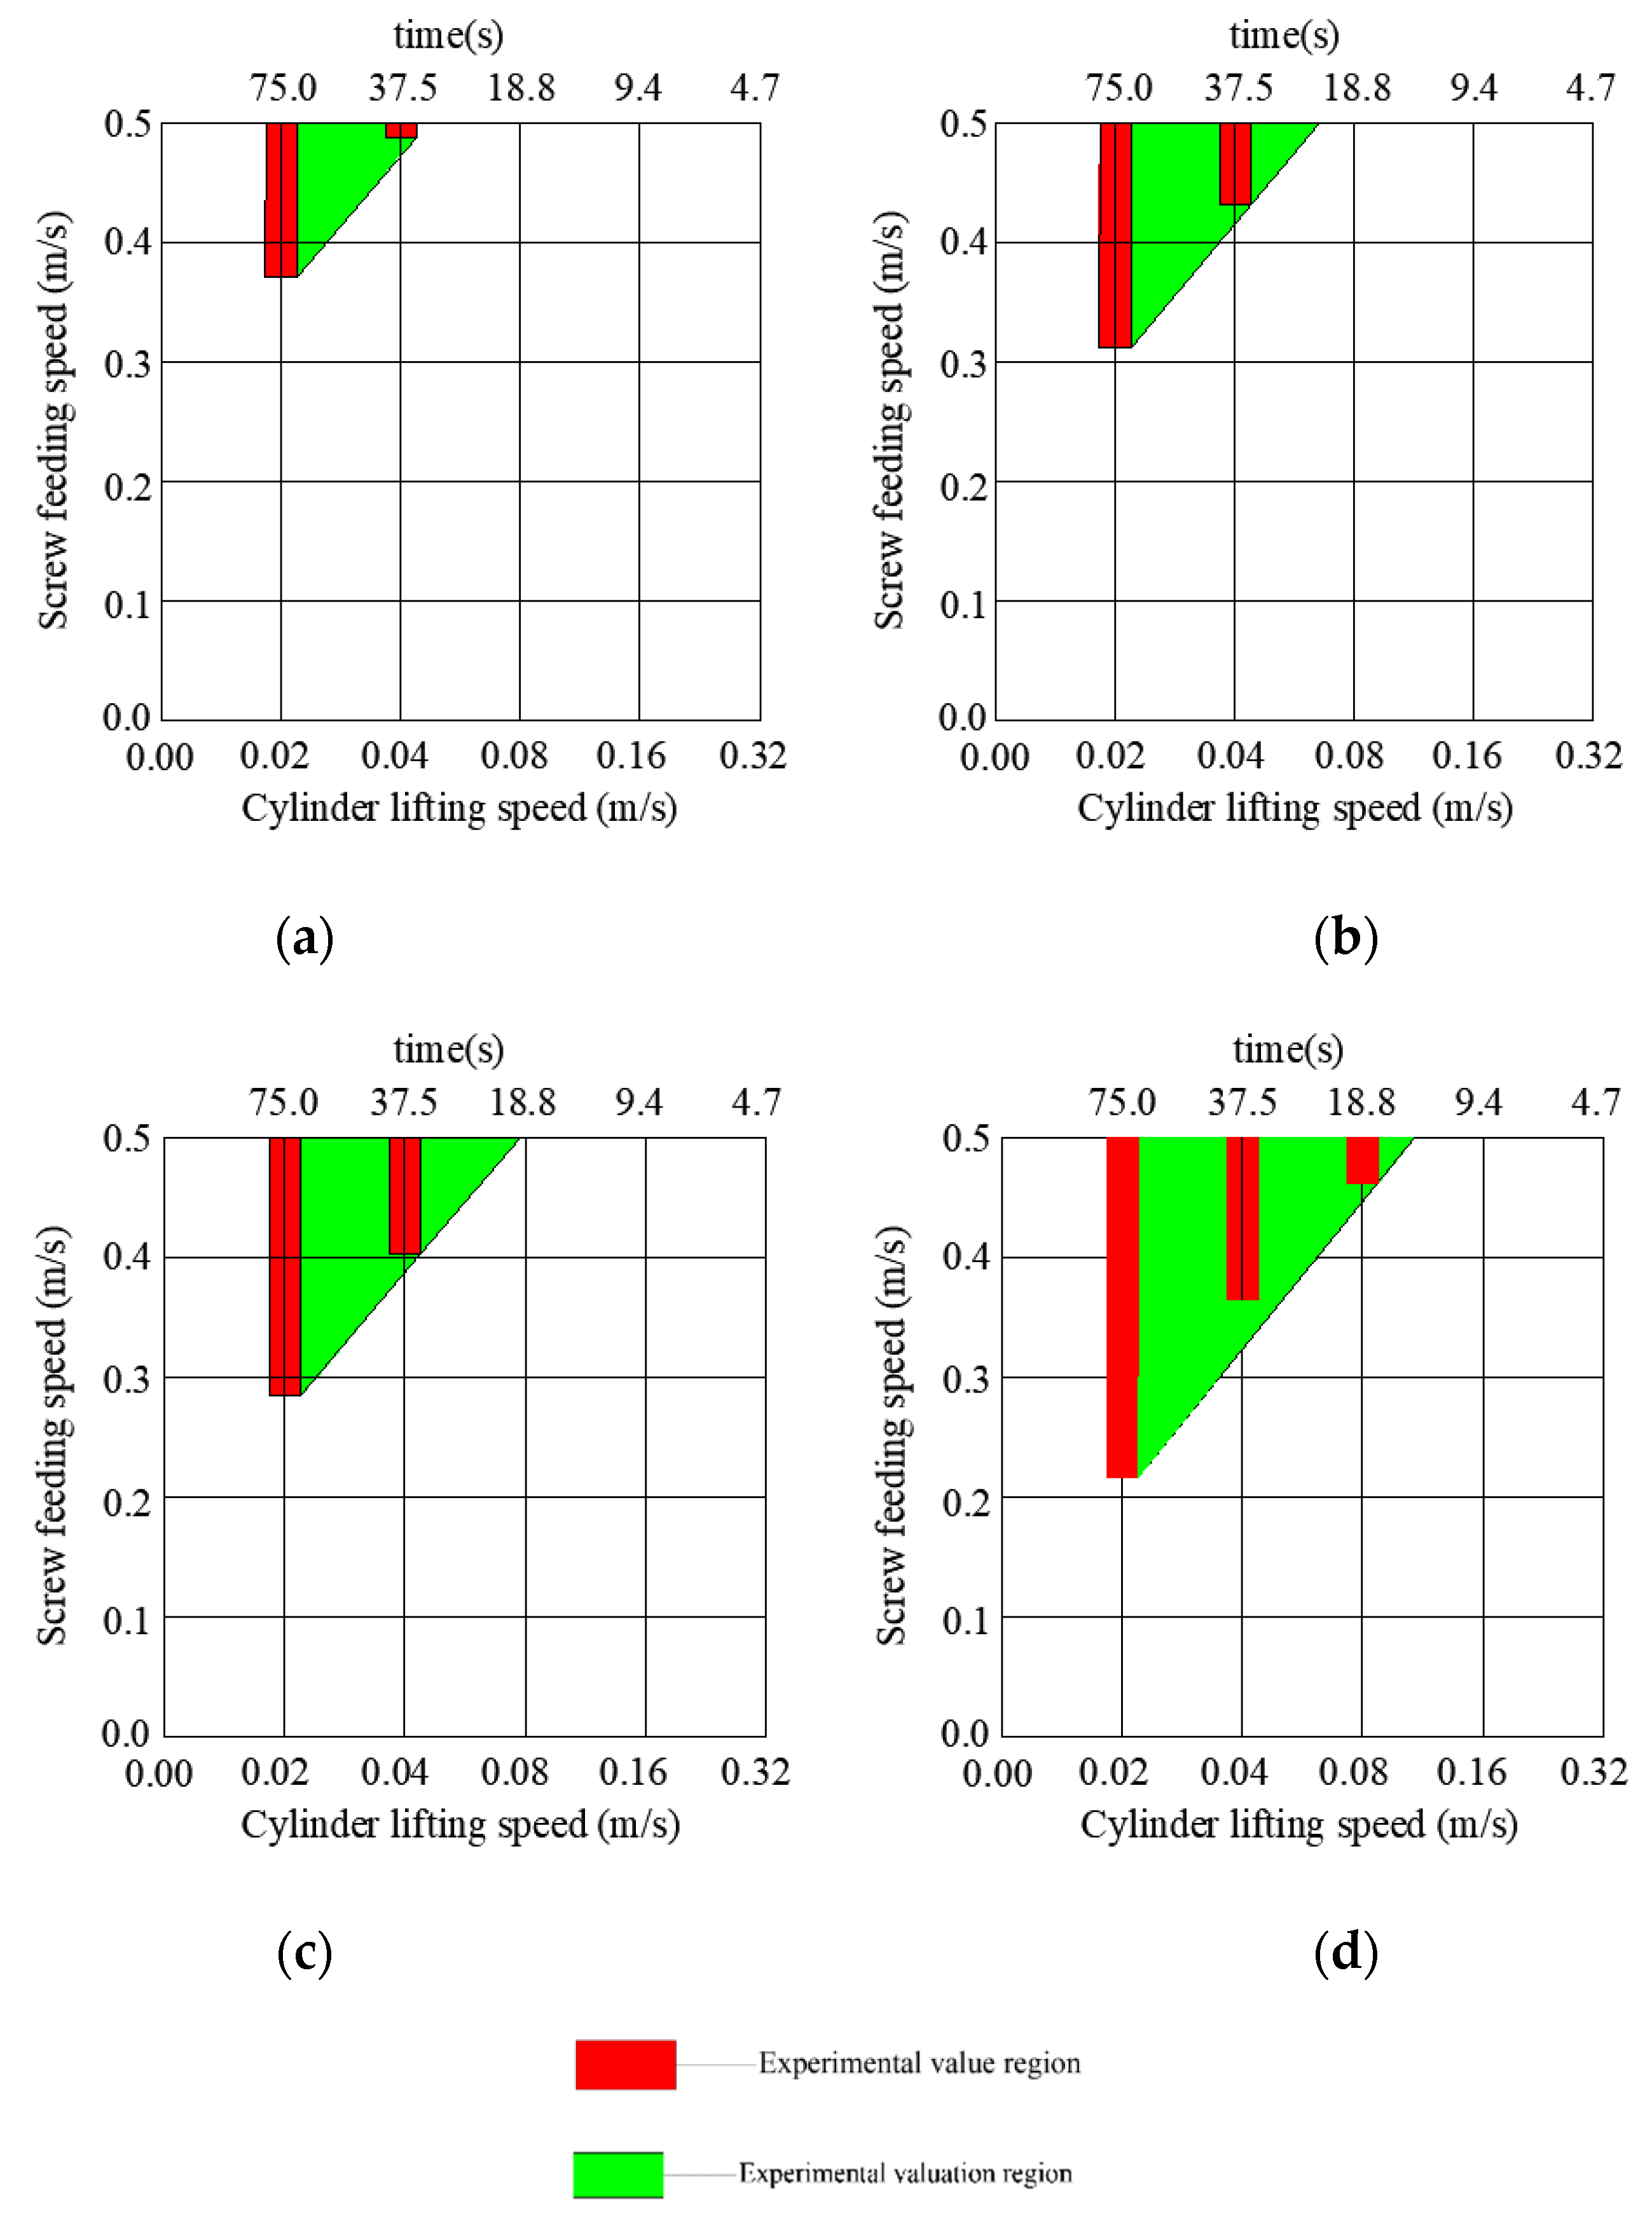
3.2. The Characteristics of Transport during Coking Coal Charging

Through the observation and research of coal transporting phenomenon during the experiment process, we found that if the cylinder lifting speed was too fast and the spiral conveyor feeding was too slow, the coal was subjected mainly to gravity rather than extrusion during its falling, this would cause the coal to be transported in a dilute state within the cylinder, the transportation with dilute state at the bottom of the coal in Figure 8b–d. This method of transportation is not only easy to cause the escape of coal particles and increase the amount of dust in the coking chamber, but also makes the accumulation of coal uneven on both sides of the chamber, and then leads to an increase in the times of trowelling with leveling equipment. Finally, by matching the two speeds, the coal can be discharged through extrusion, and the discharge phenomenon was shown in Figure 8a. Under this state, the coal was transported to the carbonization chamber in a dense phase flow, this coal charging process with dense phase flow had a low dust and good accumulation effect.
Therefore, the lifting speed of the cylinder and the extrusion speed of the screw feeder needed to be adjusted and matched, so that the coal could finally be extruded.
Figure 9a–d represent different moisture content of coal, respectively (3%, 5%, 7%, and 9%). The red region represents the distribution of the screw feeding speed required to achieve the condition of dense-phase continuous transport, the green area is screw feeding speed, in which distribution of the dense-phase continuous transport conditions is estimated. It was observed that the lower the moisture level of coal, the greater the value for screw feeding speed required to reach dense-phase continuous transport. The greater the value for the cylinder lifting speed, the higher the screw feeding speed required to meet the condition of dense continuous transport. For example, when the moisture content was 3%, the lifting speed of the cylinder was 0.02 m/s, the distribution range of screw feeding speed was [0.38, 0.50]; when the moisture content was 5%, the distribution range of the speed was [0.31, 0.50].

3.3. Dust Emission and Distribution Characteristics during Coal Charging

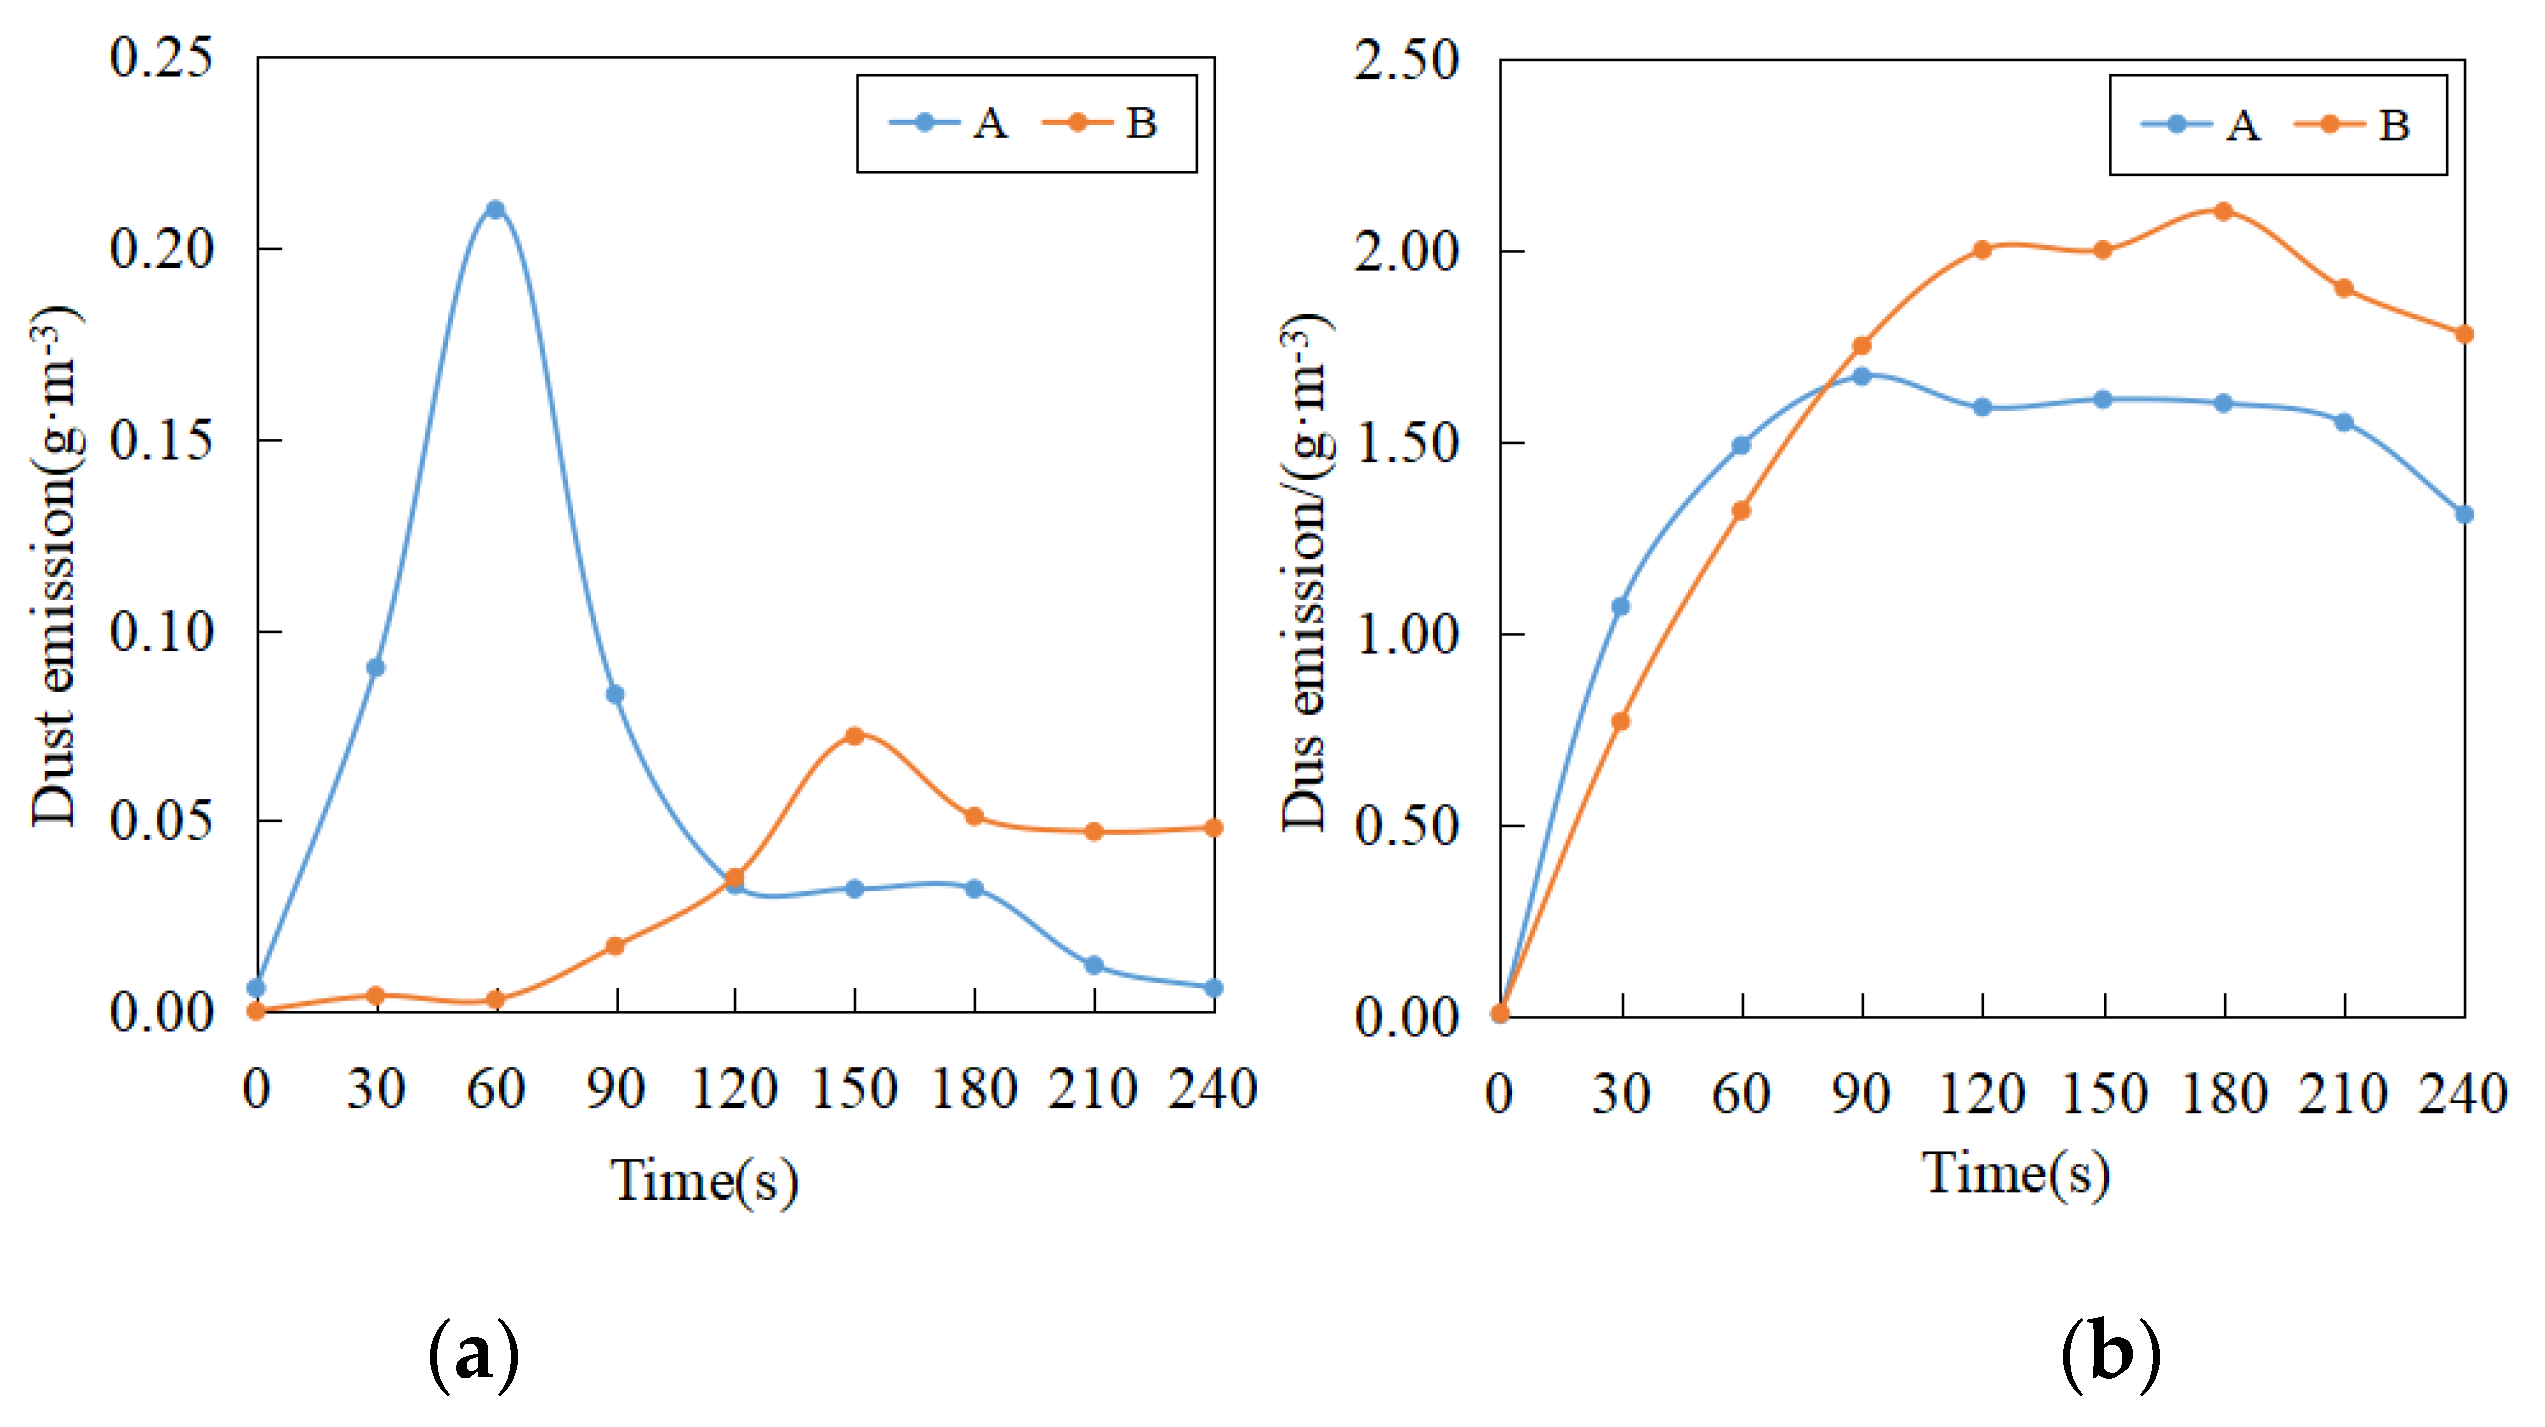
3.3.1. Dust Emission

In order to observe and explore the superiority of the new coal charging device to control dust emission control during coal charging, the experiment was based on the traditional coal charging and new coal charging method, the dust concentration sensor was used to track and measure the dust emission near the coal charging hole at the top of the furnace and in the carbonization room when the coke oven was not working. The dust emission characteristics of the two methods were compared, and the specific experimental results are shown in Figure 10, the moisture content of the experimental coal was 5%.
Figure 10a represents the changing law of dust emission with time during the charging process of the new method, and Figure 10b represents the dust emission law of the traditional method. (A-the dust emission near coke oven charging hole; B-the dust emission in the coking chamber). It can be seen in Figure 10a, at 0–60 min, that the dust emission at position (A) reached its peak value, which was about 0.21 g/m3; however, the amount of dust at position (B) was almost very small. After 60 s, the amount of dust in position (A) began to decline, the dust content at position B began to increase gradually, reaching the peak around 150 s, and then tended to be stable. This indicated that from 0 to 60 s, the cylinder fell to the bottom of the carbonization chamber, and the process of filling the cylinder with coking coal was a free-falling motion. In this process, coal was subjected to air resistance, the small particles floated up and were discharged from the joint gap between the cylinder and the cylinder; however in the carbonization chamber, due to the resistance of the cylinder wall, dust could not escape to the carbonization chamber, so during the period of filling the cylinder with coal, the dust emission of the carbonization chamber was almost very small. When the cylinder was lifted and coal fell, the coal gradually flowed along the length of the chamber, and dust began to escape to the chamber, this resulted in an increase in the amount of dust in the carbonization chamber. In addition, it was difficult for small particle dust to settle in a short time, thus, the measured dust value tended to be stable within this period.
For traditional coal charging, it can be seen from Figure 10b, compared to the new coal charging method, the dust emission of A and B positions increased significantly. Starting from about 90 min, the dust emission in the carbonization chamber gradually exceeded that near the coal charging hole of the coke oven. The dust emission reached the highest at 120–180 s, with an average of 2.2 g·m−3. After that, due to the factor of particle sedimentation, the dust quantity began to decline.

3.3.2. Distribution Characteristics of Coal Dust

The position and velocity distribution of dust particles escaping from the coal charging process were simulated with new equipment by the FLUENT software. The simulation results are shown in Figure 11. Figure 11a represents the process of filling the cylinder with coal. Figure 11b is the process of filling the chamber with coal as the cylinder is lifted, ① and ②, respectively, represent the dust emission measurement point near the coke oven charging hole and the dust emission measurement point in the coking chamber. According to the simulation results, when the cylinder was not lifted, coal particle dust was mainly concentrated in the cylinder, but when the coal was filled into the cylinder, dust particles were expelled from the gap between the cylinders due to air resistance. This was the same as the results obtained from the test points in the experimental process. When the cylinder began to lift, the coal continuously flowed out of the cylinder blanking port, then diffused and flowed along the length of the coking chamber.

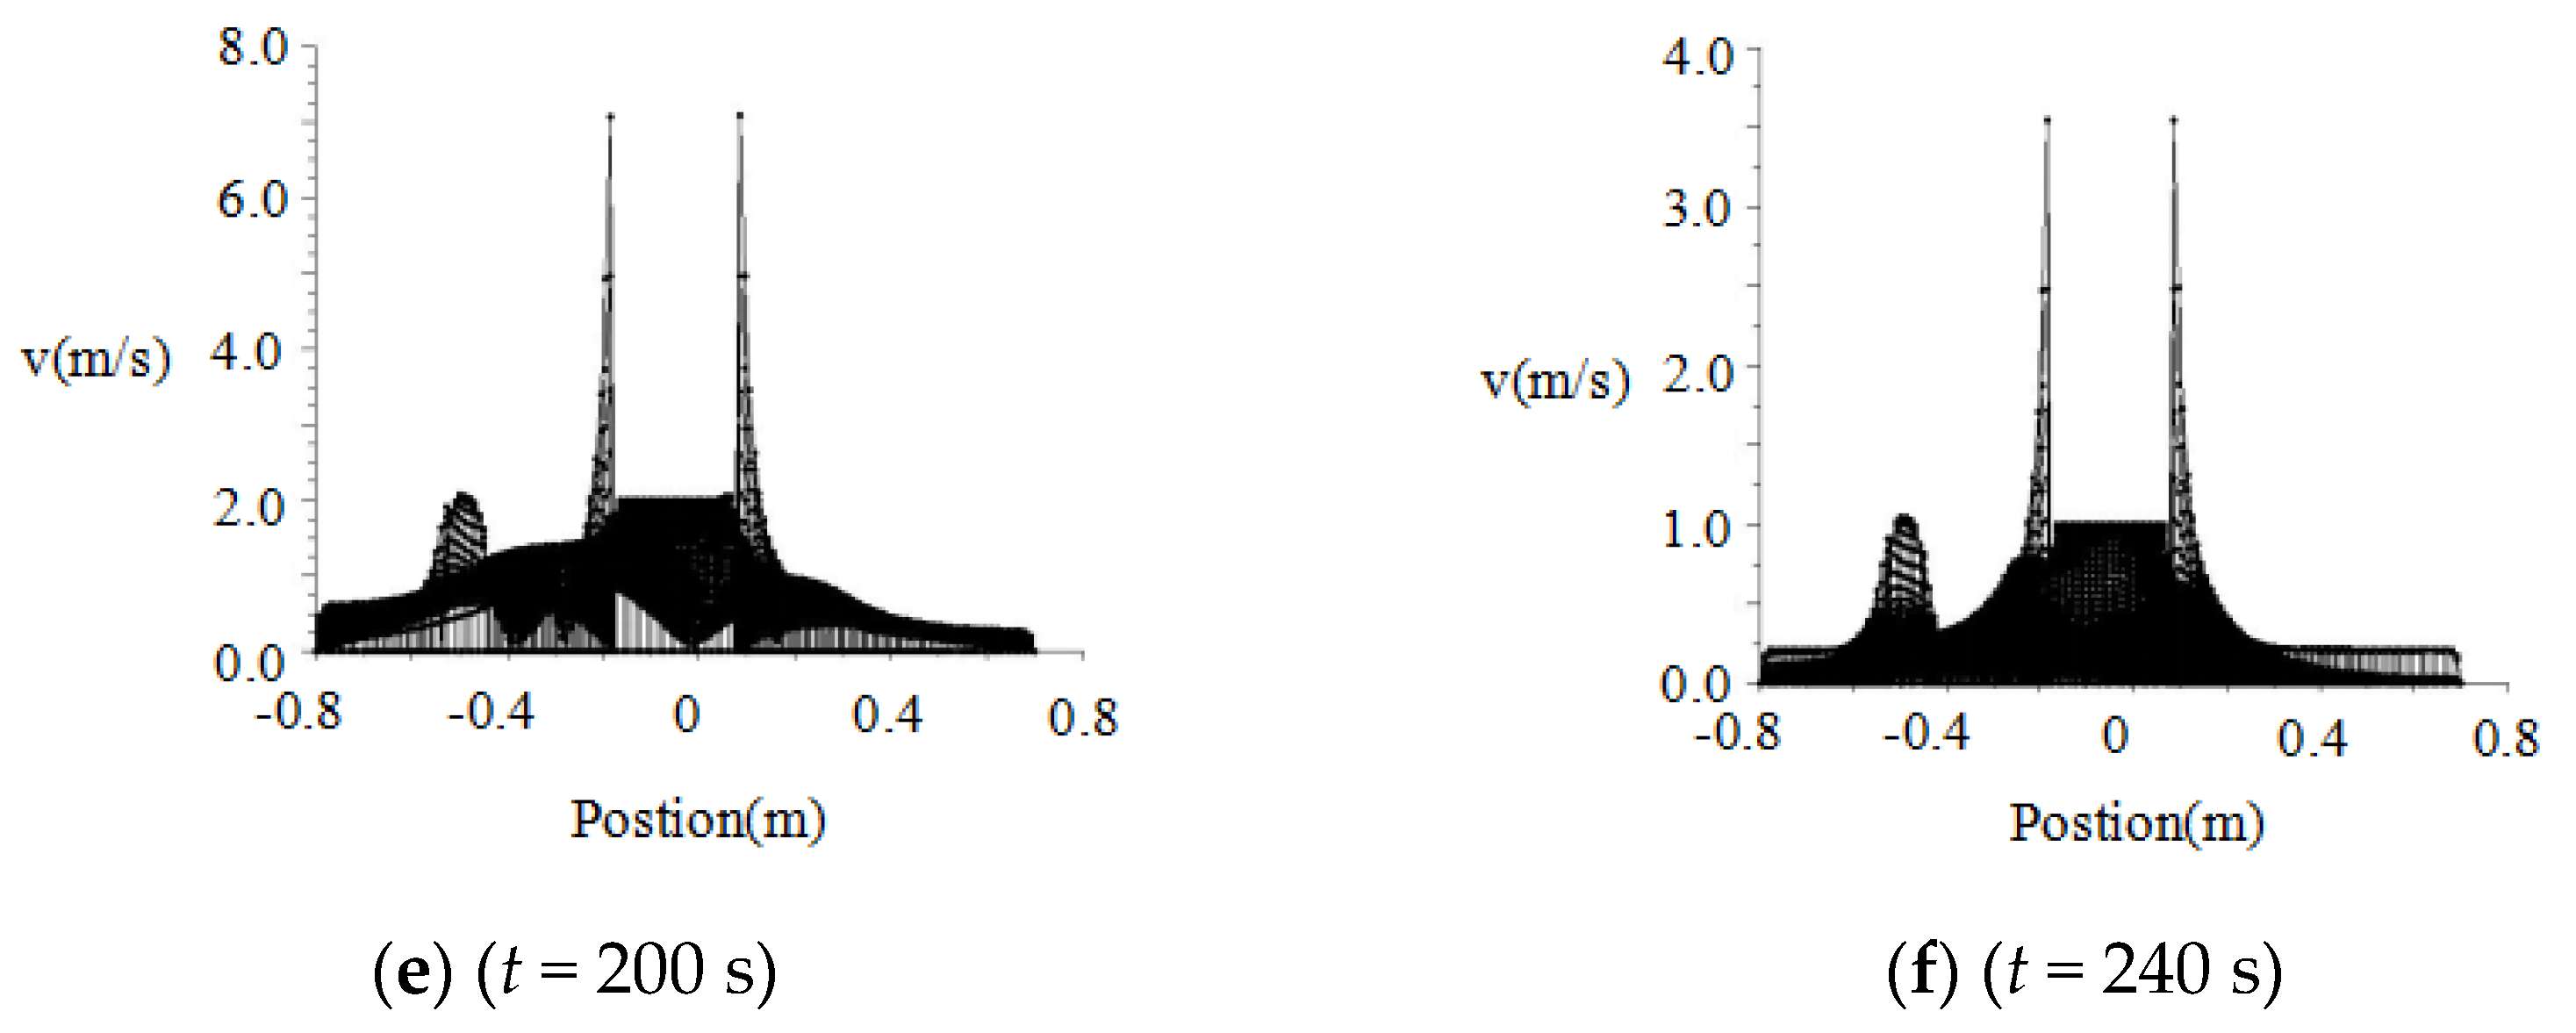
3.3.3. Velocity Distribution of Dust at Various Points during Cylinder Lifting Process

It shows the variation of velocity distribution of coal particles at different locations over time in Figure 12.
It can be seen from the figure, when time was 40 s, the coal particle velocity distribution on both sides of the cylinder was relatively extensive, with the cylinder as the central axis, and its velocity value was very large. This was mainly due to the air resistance of the particles, particles with smaller particles were ejected along the gap between the cylinders, according to the fluid mechanics formula. The fluid outflow velocity was related to the outlet cross-sectional area, under a certain flow rate; the smaller the cross-sectional area is, the greater the outflow velocity is. When time was 80–160 s, the cylinder was mainly in the lifting stage, at this time, coal flowed continuously from the cylinder to the length of the carbonization chamber, the dust emission on both sides of the cylinder decreased, and the amount of dust in the carbonization chamber began to increase, but the dust escape velocity was low.
As the charging of coal continued, t ≥ 200 s, the amount of dust was mainly concentrated in the middle of the carbonization chamber, and the velocity distribution was concentrated, this indicated that the main existence form of particles in this region was floating dust. To sum up, the simulation results were in good agreement with the experiments, which demonstrated the dust distribution pattern well.

3.4. Accumulation Characteristics in the Coking Chamber after Coal Charging

3.4.1. Repose Angle

The influence trend of the two factors on the repose angle of coking coal is shown in Figure 13. According to the results of experiments, the particle size distribution and moisture content have a great influence on the variation amplitude of the repose angle after coal charging. The average repose angle of coking coal obtained by the traditional charging method was less than the new charging method, this was mainly due to the wall effect of the new coal charging method. Although the cylinder of the blanking outlet was equipped with a guide plate, it still restricted the flow of coal towards the length of the coking chamber. However, the repose angle obtained by these two methods increased with an increase in particle size distribution range and moisture content.
In Figure 13a, the effect of particle size distribution on the repose angle can be seen. For a particle size distribution less than 1 mm, the repose angle of coking coal increased with the increase of the distribution range of the particle size. With an increase in the distribution of large particles, the repose angle of the two coal charging method increased first. With the increase of the particle size distribution range, when the particle size distribution was greater than 0.8 mm, the repose angle of the two coal charging methods increased slowly. The repose angle of coking coal increased with the increase of moisture content of coal particles in Figure 13b. When the moisture content was low, the repose angle difference obtained by the two coal charging methods was large, and with the increase of moisture content, the repose angle of the two methods approached gradually.

3.4.2. Bulk Density

It showed the influence of coal characteristics obtained by the three accumulating methods on the bulk density in Figure 14. The three methods were tamping, the new charging method, and the traditional method, respectively. For different coal characteristics, the bulk density of tamping was different from that of the new charging method and the traditional method, but it indicated a consistent trend for the three accumulating methods of coking coal bulk density. In Figure 14a, with an increase in particle size, the coal bulk density obtained by the three methods decreased first and then increased, the accumulating method had a significant effect on the bulk density of small particles. When the particle size distribution range was less than 0.6 mm, the bulk density obtained by the new charging method was greater than that obtained by the traditional. Whereas, with the increase of the distribution of large particles, the bulk density obtained by the traditional charging method was greater than the new charging method. This was mainly due to the traditional coal charging process, the small particles during the fall through the action of air resistance, in the settlement process, resulted in loose coal density. For large particles, gravity played a leading role, and the falling process would have an impact on the coal that had accumulated at the bottom, leading to a more dense coal accumulation. In Figure 14b, for moisture within 3–11%, the lower the moisture content, the higher the coking coal bulk density. With a decrease of moisture content, the bulk density increased faster. The moisture content of coal was less than 6% and the bulk density obtained by the new charging method was higher than that by the traditional. This was mainly because the low moisture coal was more likely to cause particles to escape during the gravity fall, making the accumulating coal loose. However, the new coal charging method can control this problem, so it is more suitable for low moisture coal charged into furnace.

3.4.3. The Conditions of the Optimal Accumulation State of Coking Coal

The orthogonal test table is designed according to the orthogonal test scheme. The results of the tests is shown in Table 4.

3.4.4. Analysis of Range

In Table 4, it can be seen that the range values of factors A, B, C, and D of coal bulk density are all greater than the blank column, so the four factors had a significant influence on the bulk density. However, the factor blanking height of the repose angle was smaller than the blank column, indicating that the blanking height had no significant influence on the repose angle. According to the comparison and analysis of the horizontal range of each factor, the optimal combination of control conditions corresponding to the bulk density was A5B1C1D2 (particle size distribution was 0.9~2 mm; coal moisture content was 3%; cylinder lifting speed was 0.02 m/s, and blanking height was 0.2 m). Optimal combination of the repose angle A5B5C2D1 (particle size distribution was 0.9~2 mm; moisture content was 11%; cylinder lifting speed was 0.04 m/s, and blanking height was 0.1 m). However, the range analysis method had some limitations, it was impossible to estimate the errors in the test process and the test results. Therefore, it was impossible to distinguish whether the difference in the test results corresponding to each level of a certain factor was caused by the change in the level or experimental error. Therefore, the variance analysis method was adopted below to make up for the deficiency of the range analysis method.

3.4.5. Analysis of Variance

Variance analysis can distinguish the difference between the test results caused by the change of factor level from the difference between the test results caused by the fluctuation of error, and can give a reliable quantity estimate [39]. Orthogonal test variance analysis was carried out by the SPSS software.
The reliability of test can be measured as test error, one-way ANOVA was performed on the bulk density; the repose angle of the test results and the significance results are shown in Table 5.
From the size of F value in the Table 5, the four factors—particle size distribution, moisture content, cylinder lifting speed, and blanking height had significant effects on the bulk density and the repose angle of coking coal. However, there was a big difference in the degree of influence of these four factors. For bulk density, the order of influence was B > C > A > D. For the repose angle, the order was A > B > C > D. It was seen that factor D had the least influence on the accumulating factors.

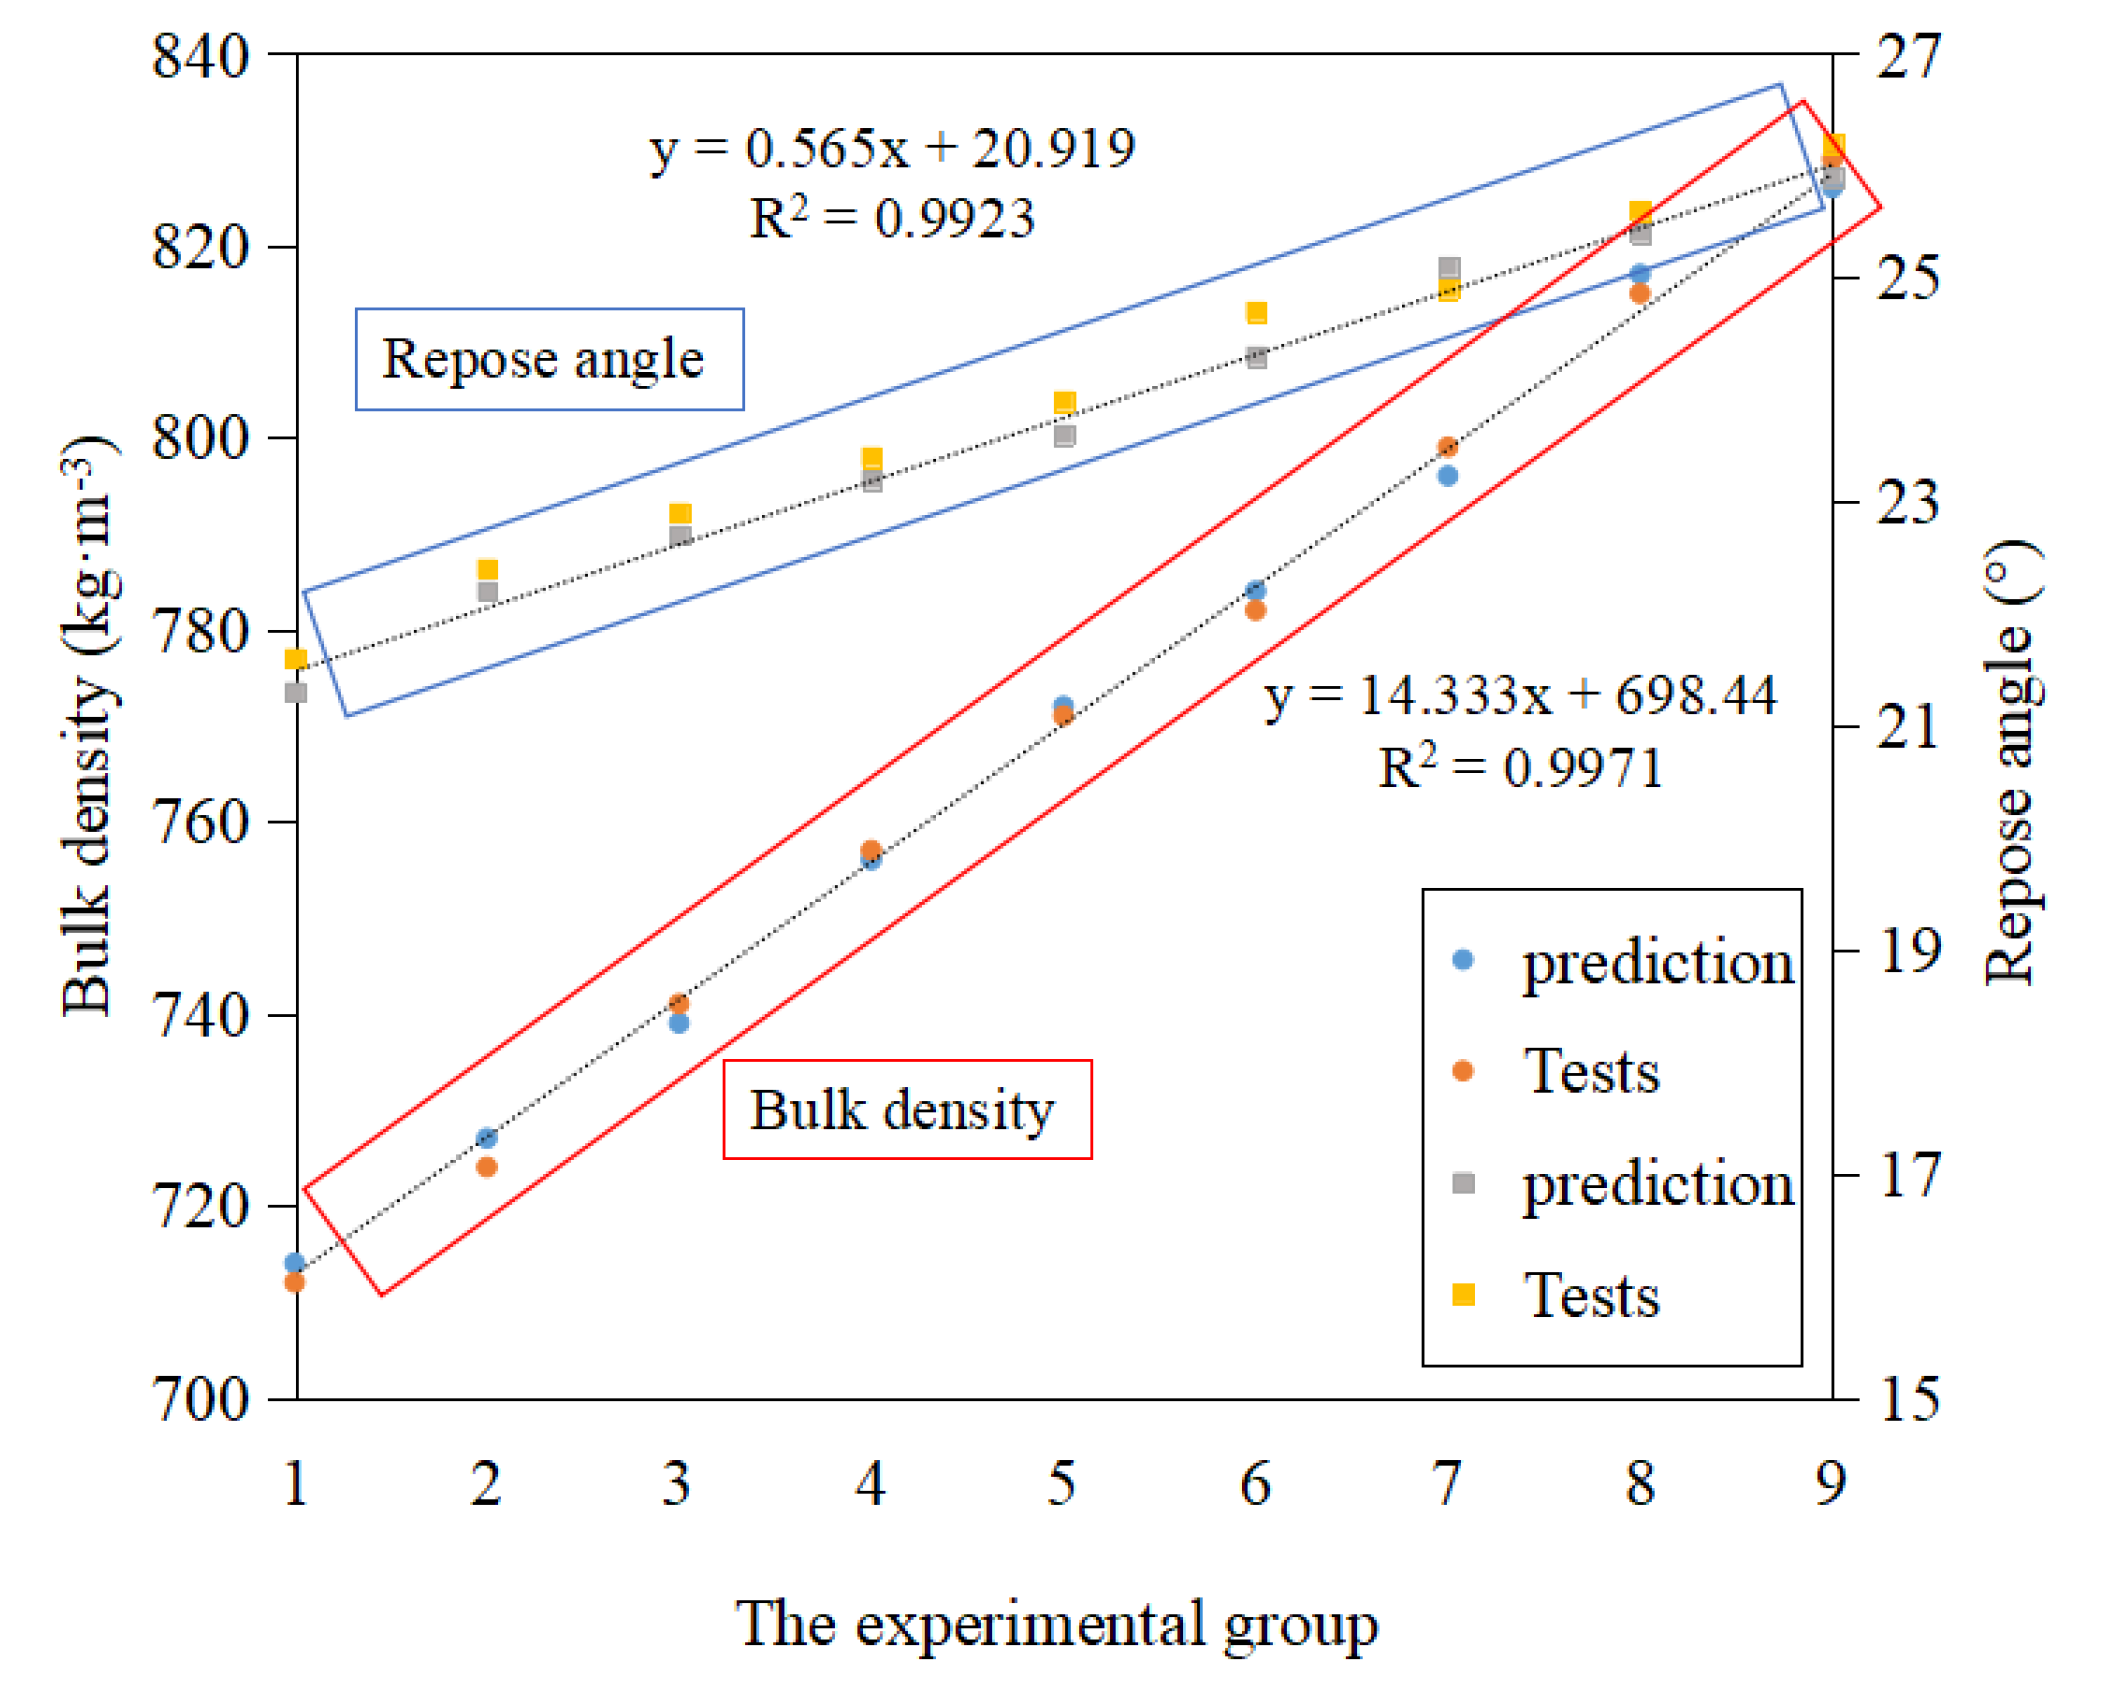
3.4.6. The Establishment of the Prediction Model of Accumulation Characteristics

After determining that the four factors had a significant influence on coal accumulation characteristics, a series of tests were designed to deduce the prediction model of coal accumulation.
γ 4 + 2 P γ 2 2 P 1 ( P + 0.5 M 0 ) = 0
M0-Number of basic tests, P-Number of variables, γ-Unknown variable. For this experiment, M0 = 3, P = 4, then γ = 1.55. The number of trials was 2P+ 2P+M0 = 27 [40]. By designing 27 experimental schemes and adopting polynomial stepwise regression method according to the results of experimental schemes, the prediction model of bulk density and repose angle was obtained, as shown in the Table 6.
BD = a b A c B d C + e D + f A B + g A C + h B 2 i D 2 + g C 2
RA = a b A c B + d C + e D + f A B + g B C h A D + i B 2 + g D 2 g C 2
BD-Bulk density, kg·m−3; RA-Repose angle; a–g are equation coefficients. The experimental results were substituted into (3) and (4) for comparison between the real value and the predicted value. The comparison results are shown in Figure 15. Through comparison between real accumulation and predicted accumulation, the prediction model had a high accuracy.

4. Conclusions

Through the design and test of the new coal charging method and equipment, the characteristics of coal transport, dust emission, and coal accumulation in the process of coal charging were analyzed and studied; the following conclusions could be drawn:
(1)
True strain values of the material increased with the extension of heating time, but the overall increase trend was slow, when the thickness of the metal material exceeded 2.5 mm, the decrease amplitude weakened, and the strain value decreased with time and tended to be stable. It was more appropriate to select 310 austenitic chromium nickel stainless steel as the meterials of cylinder.
(2)
Satisfies the condition that the coal transporting process with dense phase—the moisture content was 3%, the lifting speed of the cylinder was 0.02 m/s, satisfied this condition; the needs the distribution range of screw feeding speed was [0.38,0.50]; when the moisture content was 5%, and the distribution range of speed was [0.31,0.50].
(3)
Compared with the traditional coal charging method, the dust emission from the new charging method was reduced by 90% at the peak of dust emission.
(4)
The optimal combination of control conditions corresponding to the bulk density was A5B1C1D2 (particle size distribution was 0.9~2 mm; coal moisture content was 3%; cylinder lifting speed was 0.02 m/s, blanking height was 0.2 m). Optimal combination of repose angle A5B5C2D1 (particle size distribution was 0.9~2 mm; moisture content was 11%; cylinder lifting speed was 0.04 m/s, and blanking height was 0.1 m).
(5)
The prediction model of accumulation characteristics was established through experiments, and the accuracy of the model was verified by experiments.

Author Contributions

Formal analysis, S.Z.; Methodology, S.Z.; Writing—original draft, Z.Z.; Writing—review and editing, Z.Z. All authors have read and agreed to the published version of the manuscript.

Funding

This research received no external funding.

Institutional Review Board Statement

The study was conducted according to the guidelines of the Declaration of Helsinki, and approved by the Institutional Review Board.

Informed Consent Statement

Informed consent was obtained from all subjects involved in the study.

Acknowledgments

Financial support was sponsored by the National Key R&D Program of China (2016YFC0400401).

Conflicts of Interest

All the authors of the above article agree to contribute “Applied sciences”. The authors declare no conflict of interest.

References

  1. Cui, P.; Qu, K.-L.; Ling, Q.; Cheng, L.-Y.; Cao, Y.-P. Effects of coal moisture control and coal briquette technology on structure and reactivity of cokes. Coke Chem. 2015, 58, 162–169. [Google Scholar] [CrossRef]
  2. Gao, B.; Li, Y.G.; Chen, P.; Kong, D.W. Application and effect analysis of CMC in coking plant. Fuel Chem. Process. 2016, 47, 31–33. [Google Scholar]
  3. Liang, K.; Chao, C.; Zhu, Q.; Wu, J.; Liu, D. Development and application of coal moisture control technology in coking process. Angang Technol. 2017, 1, 6–11. [Google Scholar]
  4. Díez, M.; Alvarez, R.; Barriocanal, C. Coal for metallurgical coke production: Predictions of coke quality and future requirements for cokemaking. Int. J. Coal Geol. 2002, 50, 389–412. [Google Scholar] [CrossRef]
  5. Li, J.W. Development and application of coal moisture control technology in coking process. Chem. Enterp. Manag. 2019, 1, 67–68. [Google Scholar]
  6. Zheng, W.H. Coal Preheating and Moisture Control in Muroran Coking Plant, Japan. Fuel and Chemical Processes. 2002, 33, 1–3. [Google Scholar]
  7. Li, S.; Li, X. Development and Application of Coal Moisture Control Technology at Home and Abroad. Dry. Technol. Equip. 2010, 8, 249–255. [Google Scholar]
  8. Li, J. Development of Coal Moisture Control Technology and Its Application in Coking Plant. Coal Chem. Ind. 2005, 1, 34–36. [Google Scholar]
  9. Su, X.; Jiang, L.; Li, X.; Kong, X.; Sun, B. Problems and improvement of charging emission control technologyfor top-charging coke oven. Fuel Chem. Process. 2015, 46, 20–23. [Google Scholar]
  10. Copeland, C.; Eisele, T.C.; Kawatra, S. Suppression of airborne particulates in iron ore processing facilities. Int. J. Miner. Process. 2009, 93, 232–238. [Google Scholar] [CrossRef]
  11. Copeland, C.R.; Eisele, T.C.; Chesney, D.J.; Kawatra, S.K. Factors influencing dust suppressant effectiveness. Min. Met. Explor. 2008, 25, 215–222. [Google Scholar] [CrossRef]
  12. Dong, K.J. Study on Fluidized Bed Particle Grading Characteristics of Coking Coal; Huazhong University of Science and Technology: Wuhan, China, 2017. [Google Scholar]
  13. Fang, R. The Integration Study on Coking Coal Moisture Control and Classification in Vibration Fluidized Bed; Northeastern University: Liaoning, China, 2012. [Google Scholar]
  14. Chen, Q.; Hu, J.; Yang, H.; Wang, D.; Liu, H.; Wang, X.; Chen, H. Experiment and simulation of the pneumatic classification and drying of coking coal in a fluidized bed dryer. Chem. Eng. Sci. 2020, 214, 115–364. [Google Scholar] [CrossRef]
  15. Wang, Y.; Wang, Y.-Y.; Zhang, S. Effect of drying conditions on moisture re-adsorption and particulate matter emissions during the classification drying of coking coal. Fuel Process. Technol. 2019, 192, 65–74. [Google Scholar] [CrossRef]
  16. Bu, X.; Chen, Y.; Ma, G.; Sun, Y.; Ni, C.; Xie, G. Differences in dry and wet grinding with a high solid concentration of coking coal using a laboratory conical ball mill: Breakage rate, morphological characterization, and induction time. Adv. Powder Technol. 2019, 30, 2703–2711. [Google Scholar] [CrossRef]
  17. Li, J.; Pradhan, S.U.; Wassgren, C. Granule transformation in a twin screw granulator: Effects of conveying, kneading, and distributive mixing elements. Powder Technol. 2019, 346, 363–372. [Google Scholar] [CrossRef]
  18. Dos Santos, D.A.; Duarte, C.; Barrozo, M.A.S. Segregation phenomenon in a rotary drum: Experimental study and CFD simulation. Powder Technol. 2016, 294, 1–10. [Google Scholar] [CrossRef]
  19. Yari, B.; Beaulieu, C.; Sauriol, P.; Bertrand, F.; Chaouki, J. Size segregation of bidisperse granular mixtures in rotating drum. Powder Technol. 2020, 374, 172–184. [Google Scholar] [CrossRef]
  20. Wang, H.; Fotovat, F.; Bi, X.T.; Grace, J.R. Tribo-charging of binary mixtures composed of coarse and fine particles in gas–solid pipe flow. Particuology 2019, 43, 101–109. [Google Scholar] [CrossRef]
  21. Feng, B.B.; Tang, Z.N. Behavior of Fugitive Dust in the Process of Filling Powder in the Bags. Packag. Eng. 2017, 38, 105–109. [Google Scholar]
  22. Seyfi, S.; Mirzayi, B.; Seyyedbagheri, H. CFD modeling of black powder particles deposition in 3D 90-degree bend of natural gas pipelines. J. Nat. Gas Sci. Eng. 2020, 78, 103330. [Google Scholar] [CrossRef]
  23. Susanti, N.; Grosshans, H. Measurement of the deposit formation during pneumatic transport of PMMA powder. Adv. Powder Technol. 2020, 31, 3597–3609. [Google Scholar] [CrossRef]
  24. Song, X.N. Construction of a New Type of Coal Moisture Control Technology Based on the Characteristics of Indirect Heat and Mass Transfer Process in Coking Coal; Tianjin University: Tianjin, China, 2018. [Google Scholar]
  25. Filali, A.; Khezzar, L.; Alshehhi, M.; Kharoua, N. A One-D approach for modeling transport and deposition of Black Powder particles in gas network. J. Nat. Gas Sci. Eng. 2016, 28, 241–253. [Google Scholar] [CrossRef]
  26. Zhang, J.; Yang, L.; Zhang, W.; Qiu, J.; Xiao, H.; Liu, Y. Numerical simulation and experimental study for aerodynamic characteristics and powder transport behavior of novel nozzle. Opt. Lasers Eng. 2020, 126, 105873. [Google Scholar] [CrossRef]
  27. Jin, Y.; Liu, H.-F.; Guo, X.; Gong, X. Characteristics and formation mechanism of plug flow in the industrial vertical pipeline of dense-phase pneumatic conveying of pulverized coal. Chem. Eng. Sci. 2019, 205, 319–331. [Google Scholar] [CrossRef]
  28. Liu, T.; Liu, S. The impacts of coal dust on miners’ health: A review. Environ. Res. 2020, 190, 109849. [Google Scholar] [CrossRef] [PubMed]
  29. Al-Hashemi, H.M.B.; Al-Amoudi, O.S.B. A review on the angle of repose of granular materials. Powder Technol. 2018, 330, 397–417. [Google Scholar] [CrossRef]
  30. Guo, Z.; Chen, X.; Liu, H.; Guo, Q.; Guo, X. Theoretical and experimental investigation on angle of repose of biomass–coal blends. Fuel 2014, 116, 131–139. [Google Scholar] [CrossRef]
  31. Holsapple, K.A. Modeling granular material flows: The angle of repose, fluidization and the cliff collapse problem. Planet. Space Sci. 2013, 82–83, 11–26. [Google Scholar] [CrossRef]
  32. Wójcik, A.; Klapa, P.; Mitka, B.; Sladek, J. The use of the photogrammetric method for measurement of the repose angle of granular materials. Measurement 2018, 115, 19–26. [Google Scholar] [CrossRef]
  33. Chen, H.; Zhao, S.; Zhou, X. DEM investigation of angle of repose for super-ellipsoidal particles. Particuology 2020, 50, 53–66. [Google Scholar] [CrossRef]
  34. Yu, A.B.; Standish, N.; Lu, L. Coal agglomeration and its effect on bulk density. Powder Technol. 1995, 82, 177–189. [Google Scholar] [CrossRef]
  35. Liu, Y.; Wu, R.; Yang, P.; Wang, T.; Liu, H.; Wang, L. Parameter study of the injection configuration in a zero boil-off hydrogen storage tank using orthogonal test design. Appl. Therm. Eng. 2016, 109, 283–294. [Google Scholar] [CrossRef]
  36. Li, X.; Hao, J.-Y. Orthogonal test design for optimization of synthesis of super early strength anchoring material. Constr. Build. Mater. 2018, 181, 42–48. [Google Scholar] [CrossRef]
  37. Lin, R.; Diao, X.; Ma, T.; Tang, S.; Chen, L.; Liu, D. Optimized microporous layer for improving polymer exchange membrane fuel cell performance using orthogonal test design. Appl. Energy 2019, 254, 1–9. [Google Scholar] [CrossRef]
  38. Krotov, D.S. On the OA(1536,13,2,7) and related orthogonal arrays. Discret. Math. 2020, 343, 111659. [Google Scholar] [CrossRef]
  39. Ranil, R.; Niran, H.; Plazas, M.; Fonseka, R.; Fonseka, H.; Vilanova, S.; Andujar, I.; Gramazio, P.; Fita, A.; Prohens, J. Improving seed germination of the eggplant rootstock Solanum torvum by testing multiple factors using an orthogonal array design. Sci. Hortic. 2015, 193, 174–181. [Google Scholar] [CrossRef] [Green Version]
  40. Sun, W.Z.; Hu, D.S. Analysis of factors influencing coking coal’s bulk density. Baosteel Technol. 2012, 2, 10–14. [Google Scholar]
Figure 1. The dust emission during coal charging in the top-charged coke oven.
Applsci 11 00033 g001
Figure 2. Coal charging equipment.
Applsci 11 00033 g002
Figure 3. Comparison of different charging modes. (a) Dust escape characteristics under cylinder wall effect; (b) Dust escape characteristics under traditional charging method.
Applsci 11 00033 g003
Figure 4. Operating principle of new coal charging equipment.
Applsci 11 00033 g004aApplsci 11 00033 g004b
Figure 5. The movement of coal particles on the guide plate.
Applsci 11 00033 g005
Figure 6. Experimental scheme of the four factors and five levels.
Applsci 11 00033 g006
Figure 7. The true strain changes with time under different conditions. (a) The 310 austenitic chromium nickel stainless steel; (b) The 410 Ferritic stainless steel.
Applsci 11 00033 g007
Figure 8. Coking coal discharge status at bottom of cylinder. (a) Dense phase flow phenomenon; (bd) Dilute phase flow phenomenon.
Applsci 11 00033 g008
Figure 9. The influence of moisture content of coking coal on transporting characteristics. (a) The moisture content is 3%; (b) The moisture content is 5%; (c) The moisture content is 7%; (d) The moisture content is 9%.
Applsci 11 00033 g009
Figure 10. The dust amount of coal during loading varied with time under different charging methods. (a)-New method of coal charging; (b)-Traditional method of coal charging.
Applsci 11 00033 g010
Figure 11. Simulation of dust escape and distribution position with new charging. (a)-The process of filling the cylinder with coal; (b)-The process of filling the chamber with coal during the cylinder lifting.
Applsci 11 00033 g011
Figure 12. Effect of falling height on particle velocity distribution.
Applsci 11 00033 g012aApplsci 11 00033 g012b
Figure 13. Influence of coking coal characteristics on repose angle. (a)-The effect of particle size distribution on the repose angle; (b)-The effect of moisture content on the repose angle.
Applsci 11 00033 g013
Figure 14. Influence of coking coal characteristics on repose angle. (a)-The effect of particle size distribution on the bulk density; (b)-The effect of moisture content on the bulk density.
Applsci 11 00033 g014
Figure 15. Comparison results of measured and predicted accumulation.
Applsci 11 00033 g015
Table 1. The physical and chemical properties of coking coal.
SamplesProximate Analysis(wt%, d)Ultimate Analysis(wt%, daf)
MarAdVdafFadCHNS
Xingtai10.807.8836.1919.6686.335.491.520.38
Pingdingshan10.4417.0235.4218.2785.655.661.560.51
Tonghua10.8216.8733.6818.7384.405.321.440.35
Baotou10.219.2235.9720.0986.325.861.320.66
Note: Mar-Moisture content; Ad-Ash content; Vdaf-Volatiles; Fad-Fixed carbon; C-Carbon; H-Hydrogen; N-Nitrogen; S-Sulfur.
Table 2. Thermal deformation test design of materials.
MaterialsTest Temperature (°C)Thickness (mm)Heat-Up Time (min)
ab10001.01–10
1.5
2.0
2.5
3.0
Note: a—310 Austenitic chromium nickel stainless steel; b—410 Ferritic stainless steel.
Table 3. Table of factor level.
Name of FactorsA(mm)B(%)C(m·s−1)D(m)
Level 10.1030.020.1
Level 20.4550.040.2
Level 30.9070.080.4
Level 41.5090.160.8
Level 52.00110.321.6
Table 4. Orthogonal test L25 (56).
FactorsABCDBlankBlank
ρK1707.43789.18783.75758.83745.32745.06
K2754.05769.86755.60774.36745.37748.22
K3756.66745.11747.65749.32765.17742.61
K4762.17717.88735.52738.06743.82765.95
K5763.01721.28720.81722.74743.63742.60
R55.5871.3062.9451.6221.5423.35
ɑK123.2923.7527.1026.5325.5725.57
K225.3025.0027.7526.3626.1625.01
K326.4026.1226.8926.0126.1626.93
K427.0027.1224.9425.8226.1726.36
K528.4328.4423.7425.7026.3626.16
R5.144.704.000.830.791.92
Note: ρ—Bulk density; ɑ—repose angle.
Table 5. Analysis of variance.
FactorDependnt VariableSUM of SquareDOFMMSEFP
Aρ10,912.2742728.076.0370.015
ɑ74.40418.6041.1290.000
Bρ18,998.1844749.5510.510.003
ɑ66.40416.6036.710.000
Cρ11,145.4542786.366.170.014
ɑ56.11414.0331.020.000
Dρ7738.6241934.664.280.038
ɑ2.5040.631.380.322
Error Eρ3615.108451.89
ɑ3.6280.452
SUM Tρ14,065,018.9525
ɑ17,213.9825
Table 6. The result of linear fitting.
Accumulation ParameterEquationR2
Repose angley = 0.565x + 20.9190.9923
Bulk densityy = 14.333x + 698.440.9971
Publisher’s Note: MDPI stays neutral with regard to jurisdictional claims in published maps and institutional affiliations.

