Shape Modelling and Volume Optimisation of Salt Caverns for Energy Storage


Abstract
:1. Introduction
2. Three-Dimensional Numerical Model and Assessment Criteria
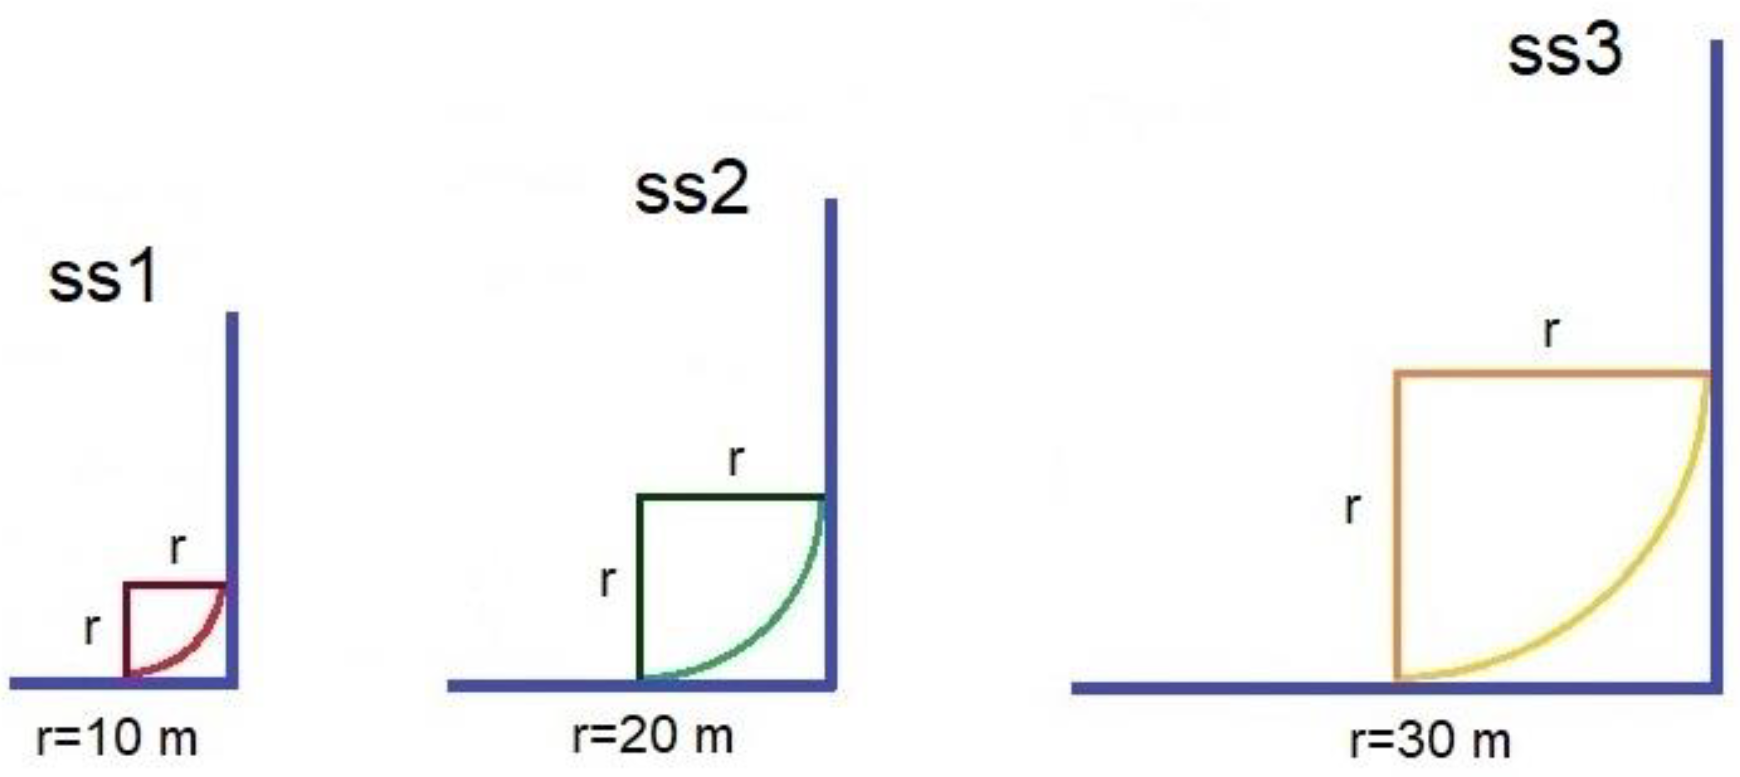
2.1. Experimental Verification of Cavern Shapes and Dimensions
2.2. Constitutive Models and Mechanical Parameters
2.3. Numerical Model and Boundary Conditions
2.4. Method of Analysis and Assessment Criteria
3. Results
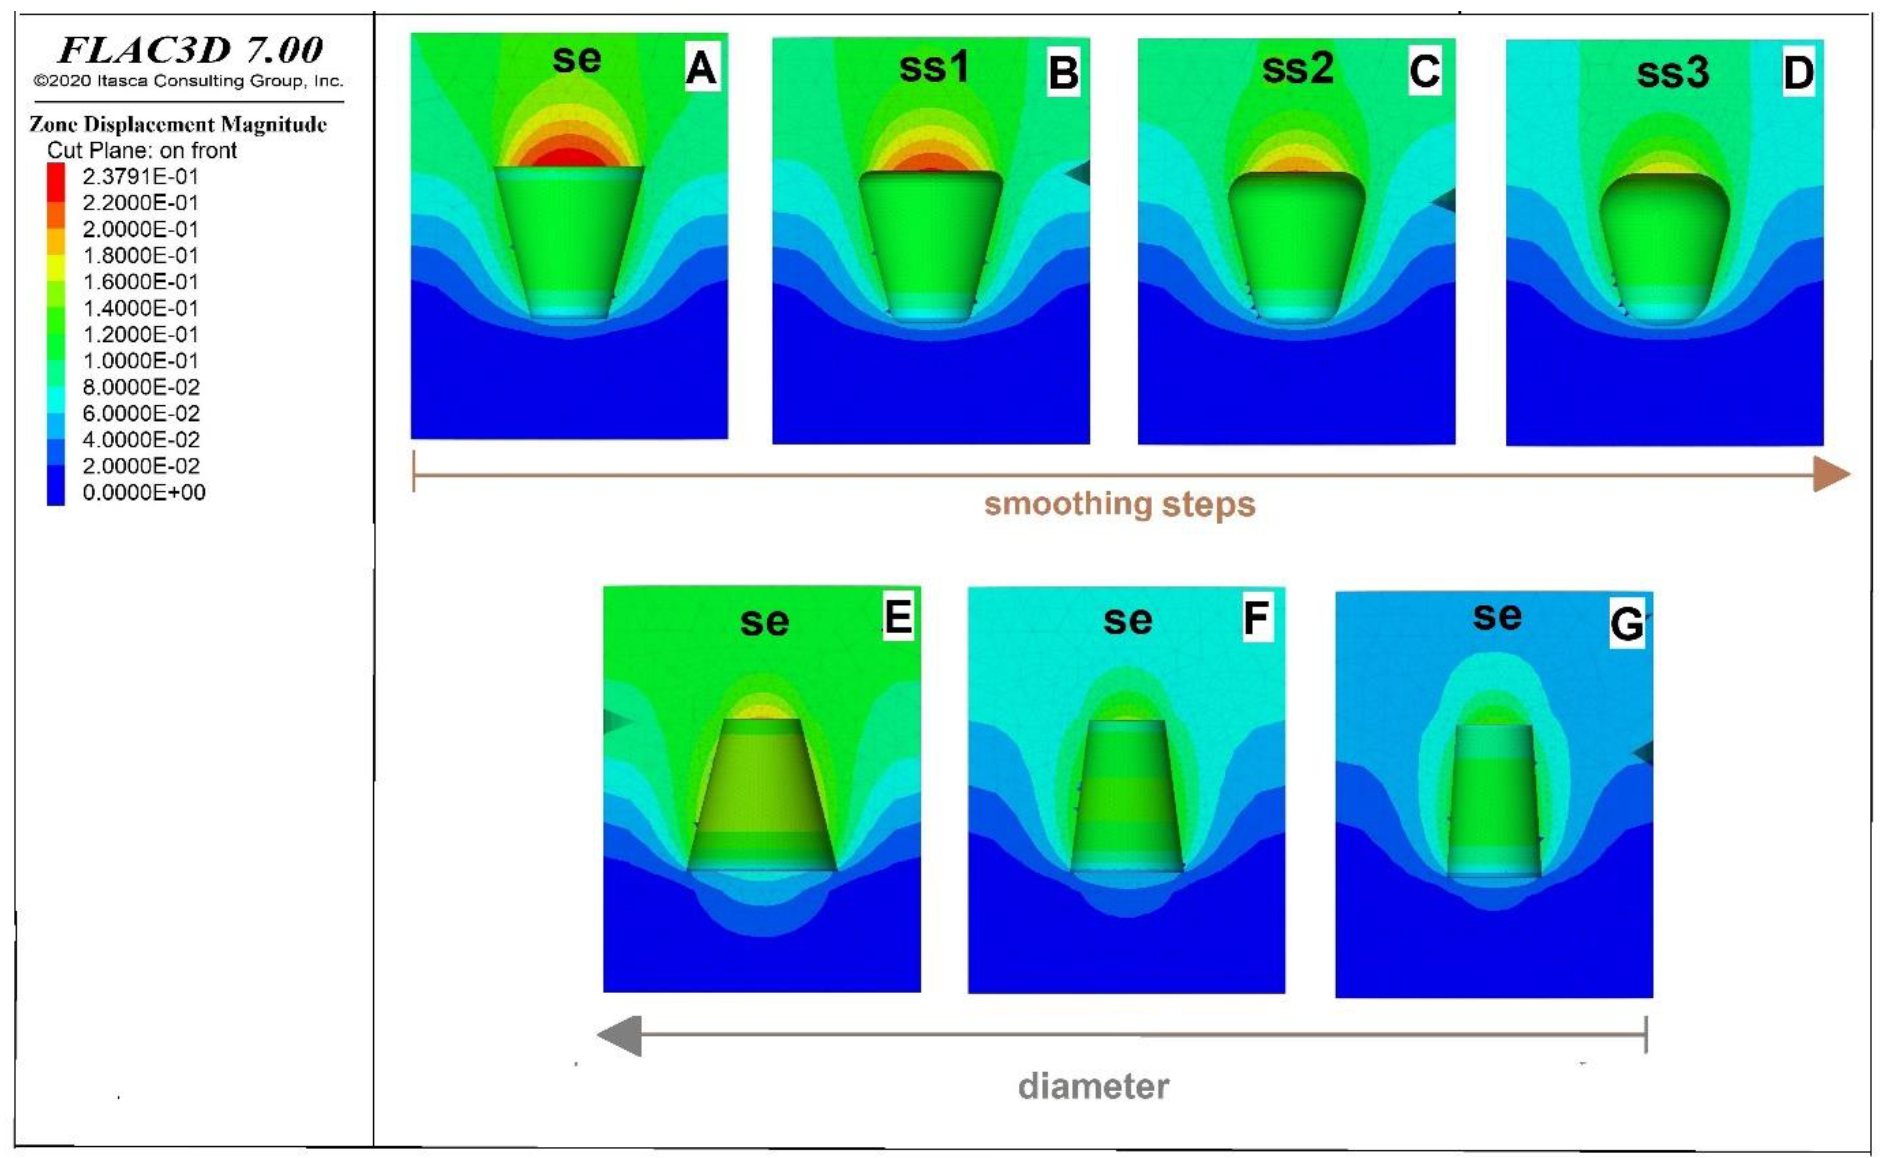
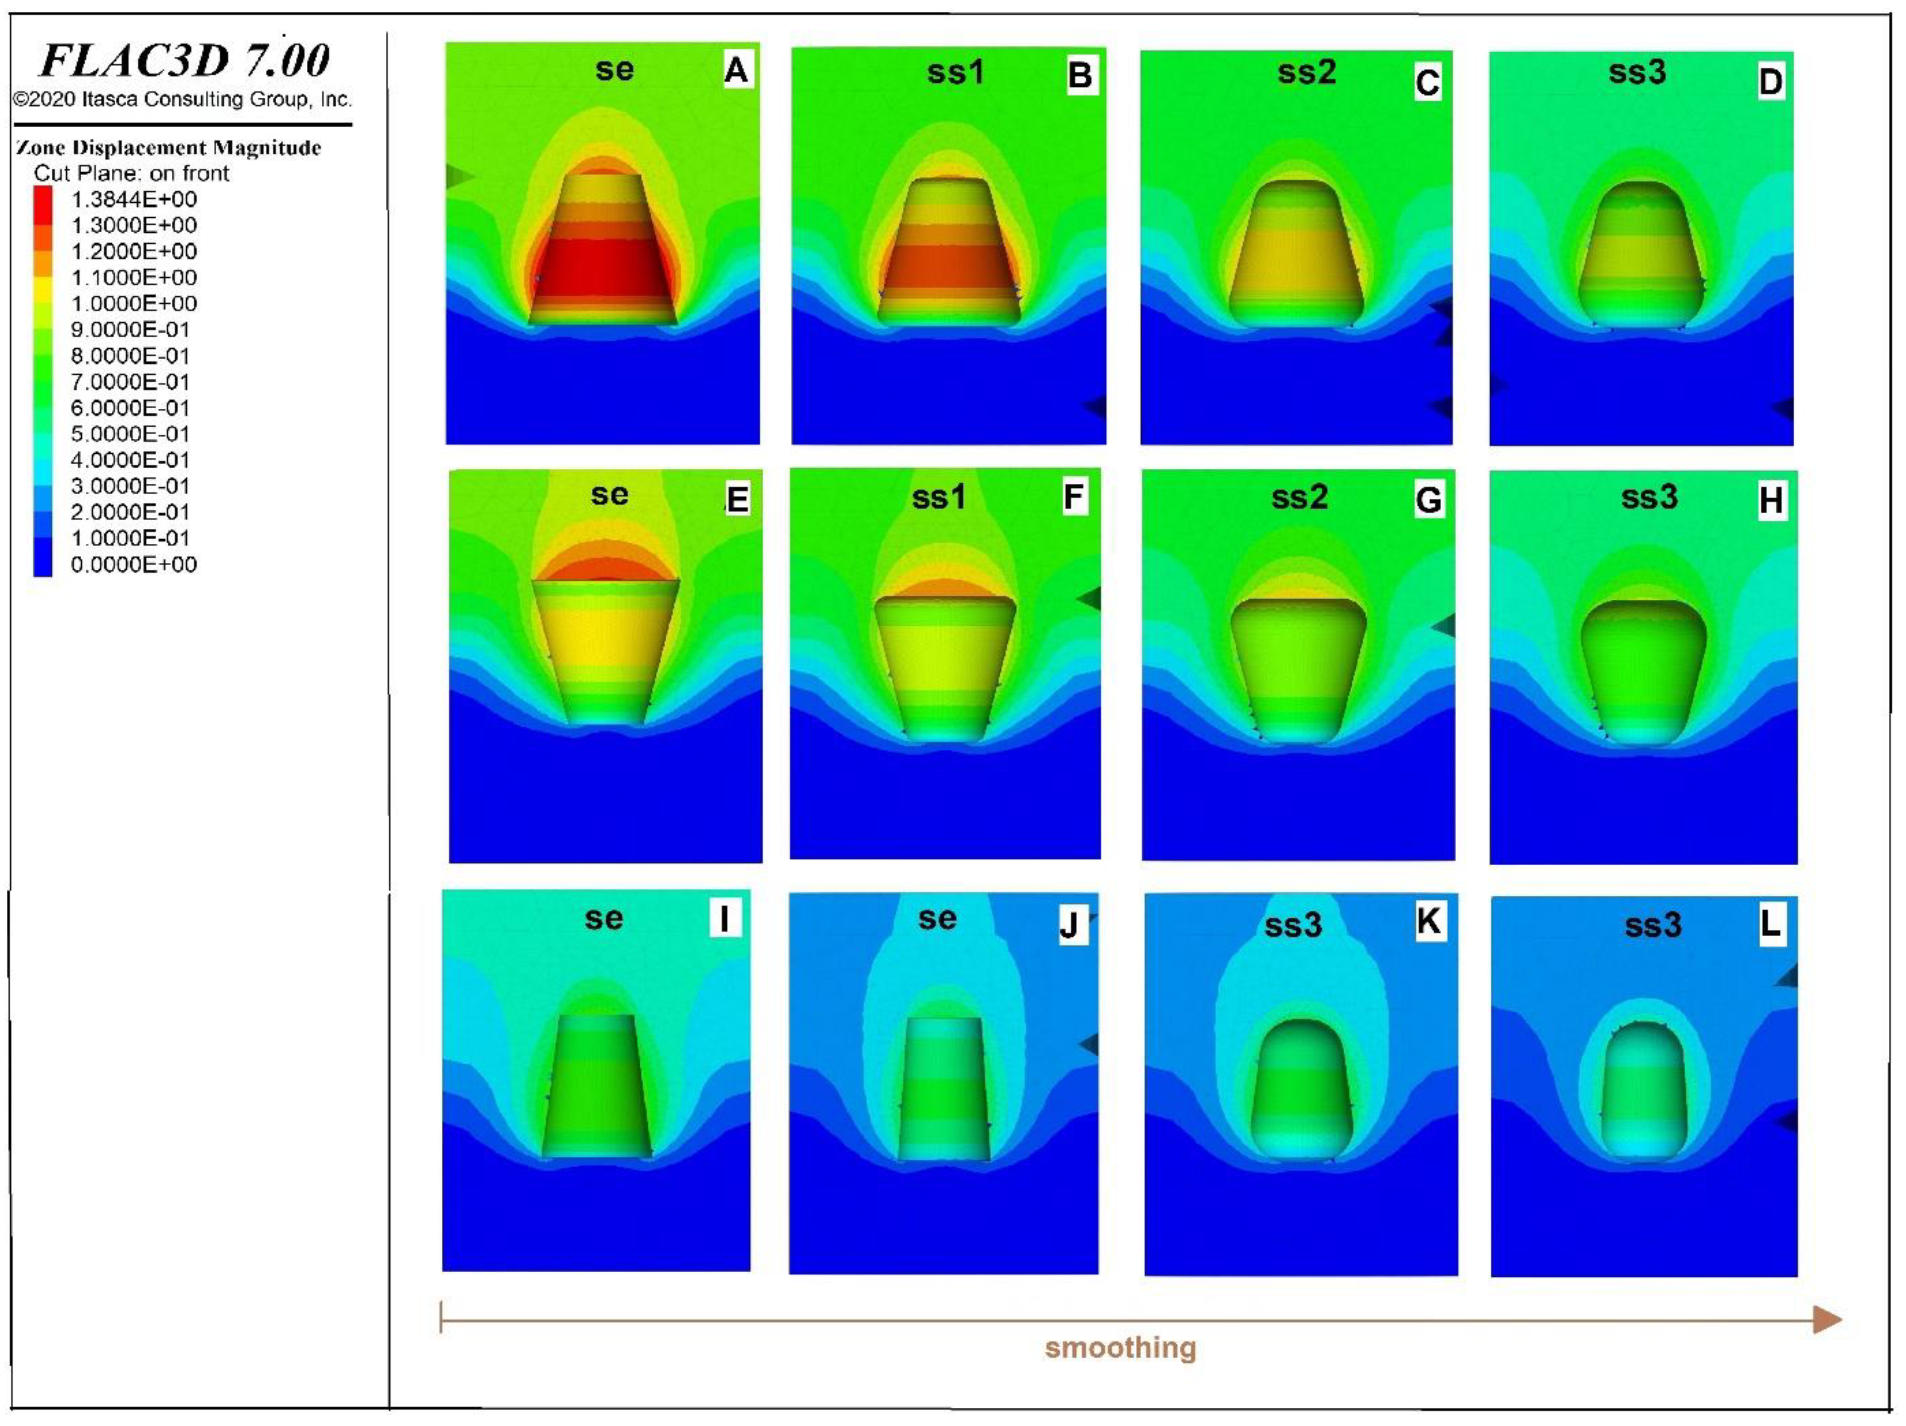
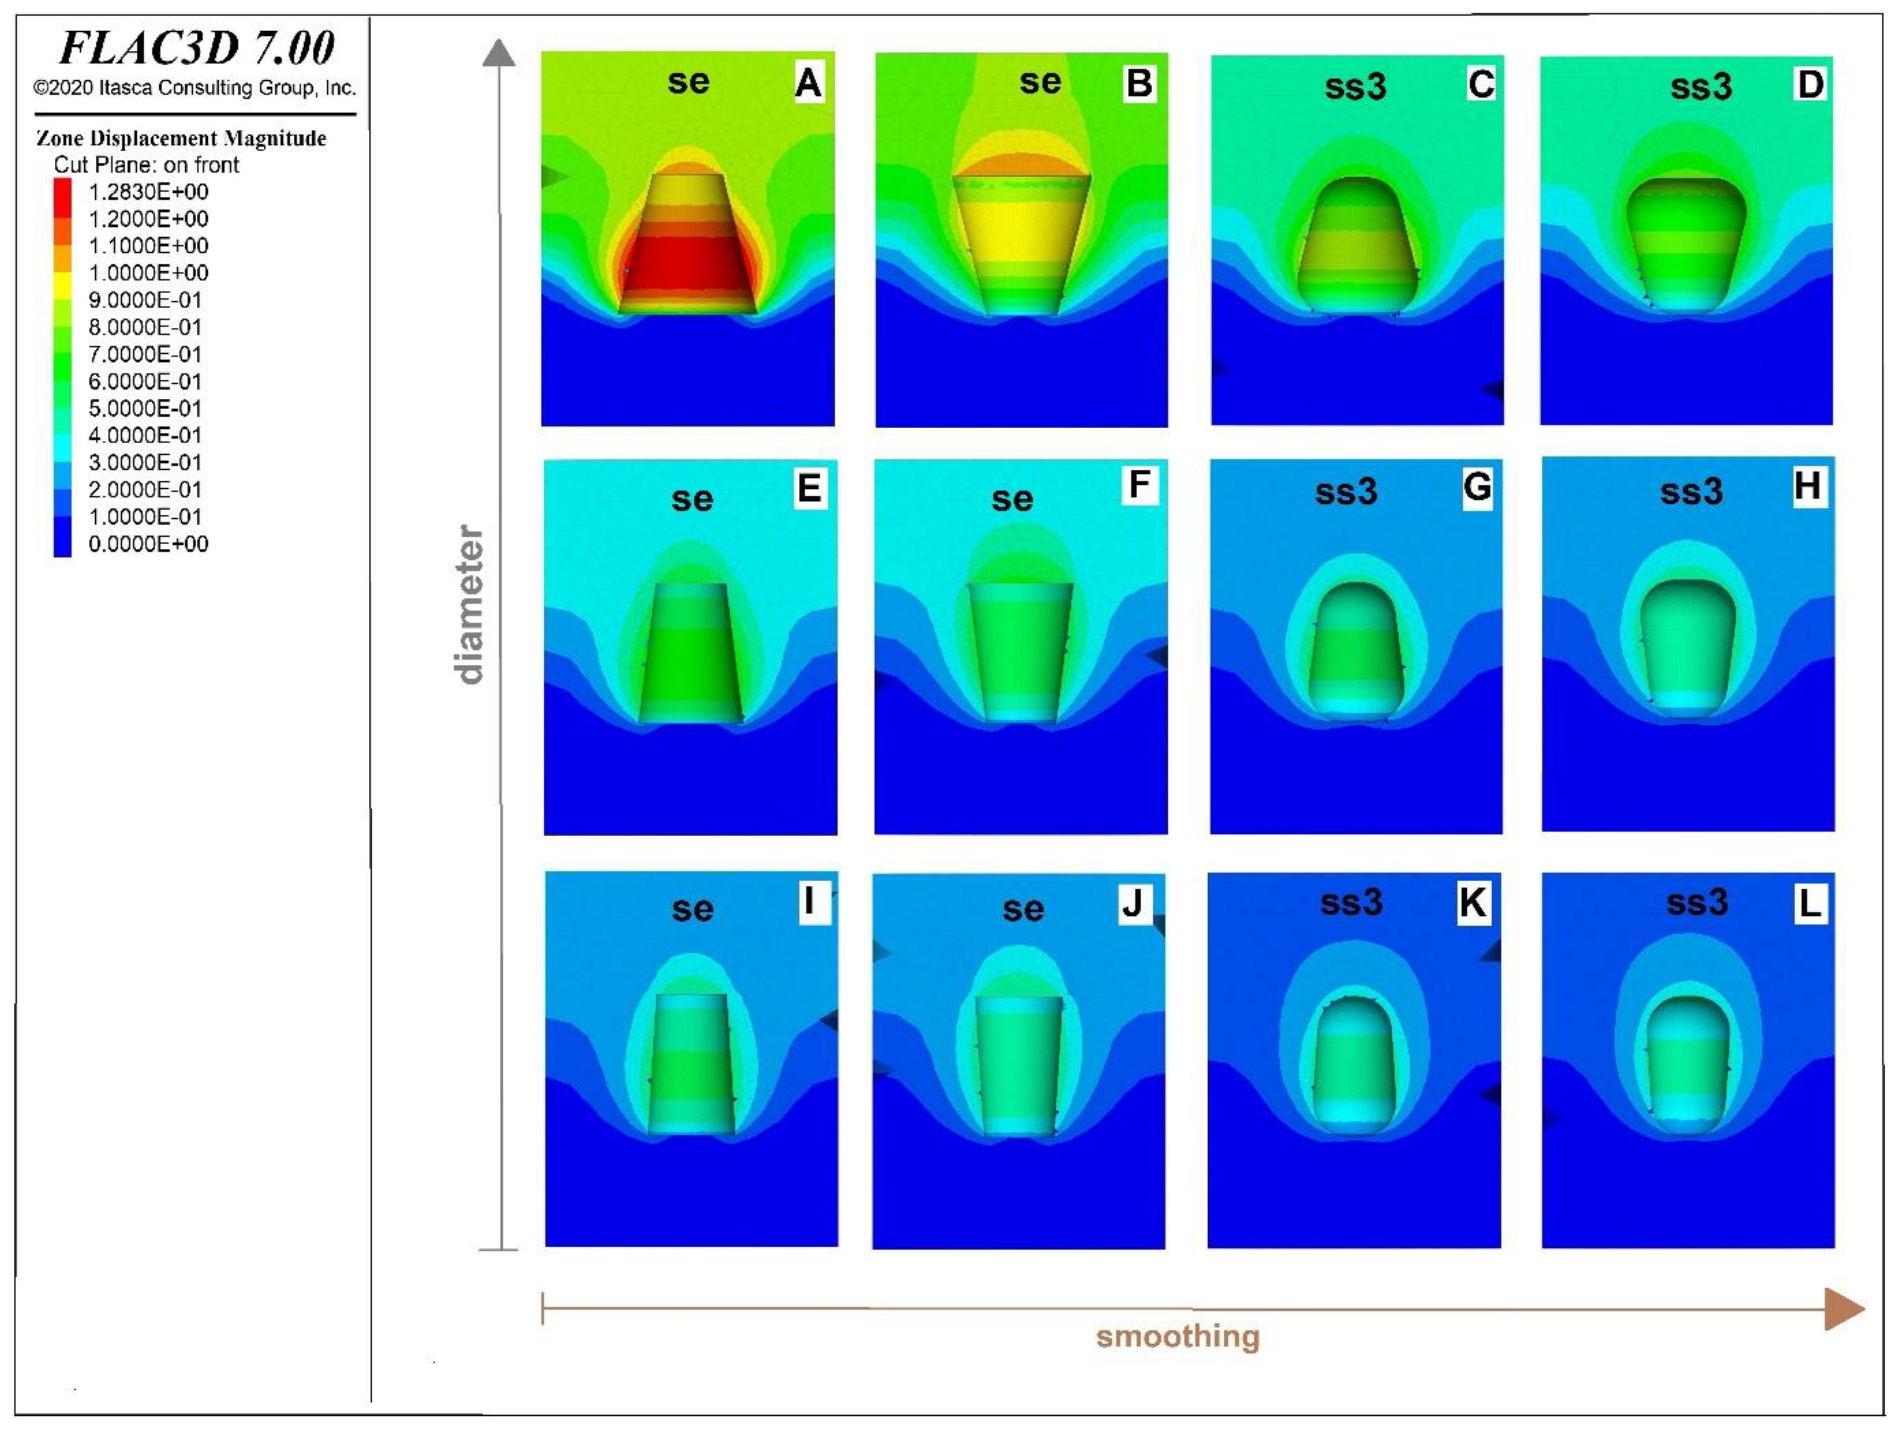
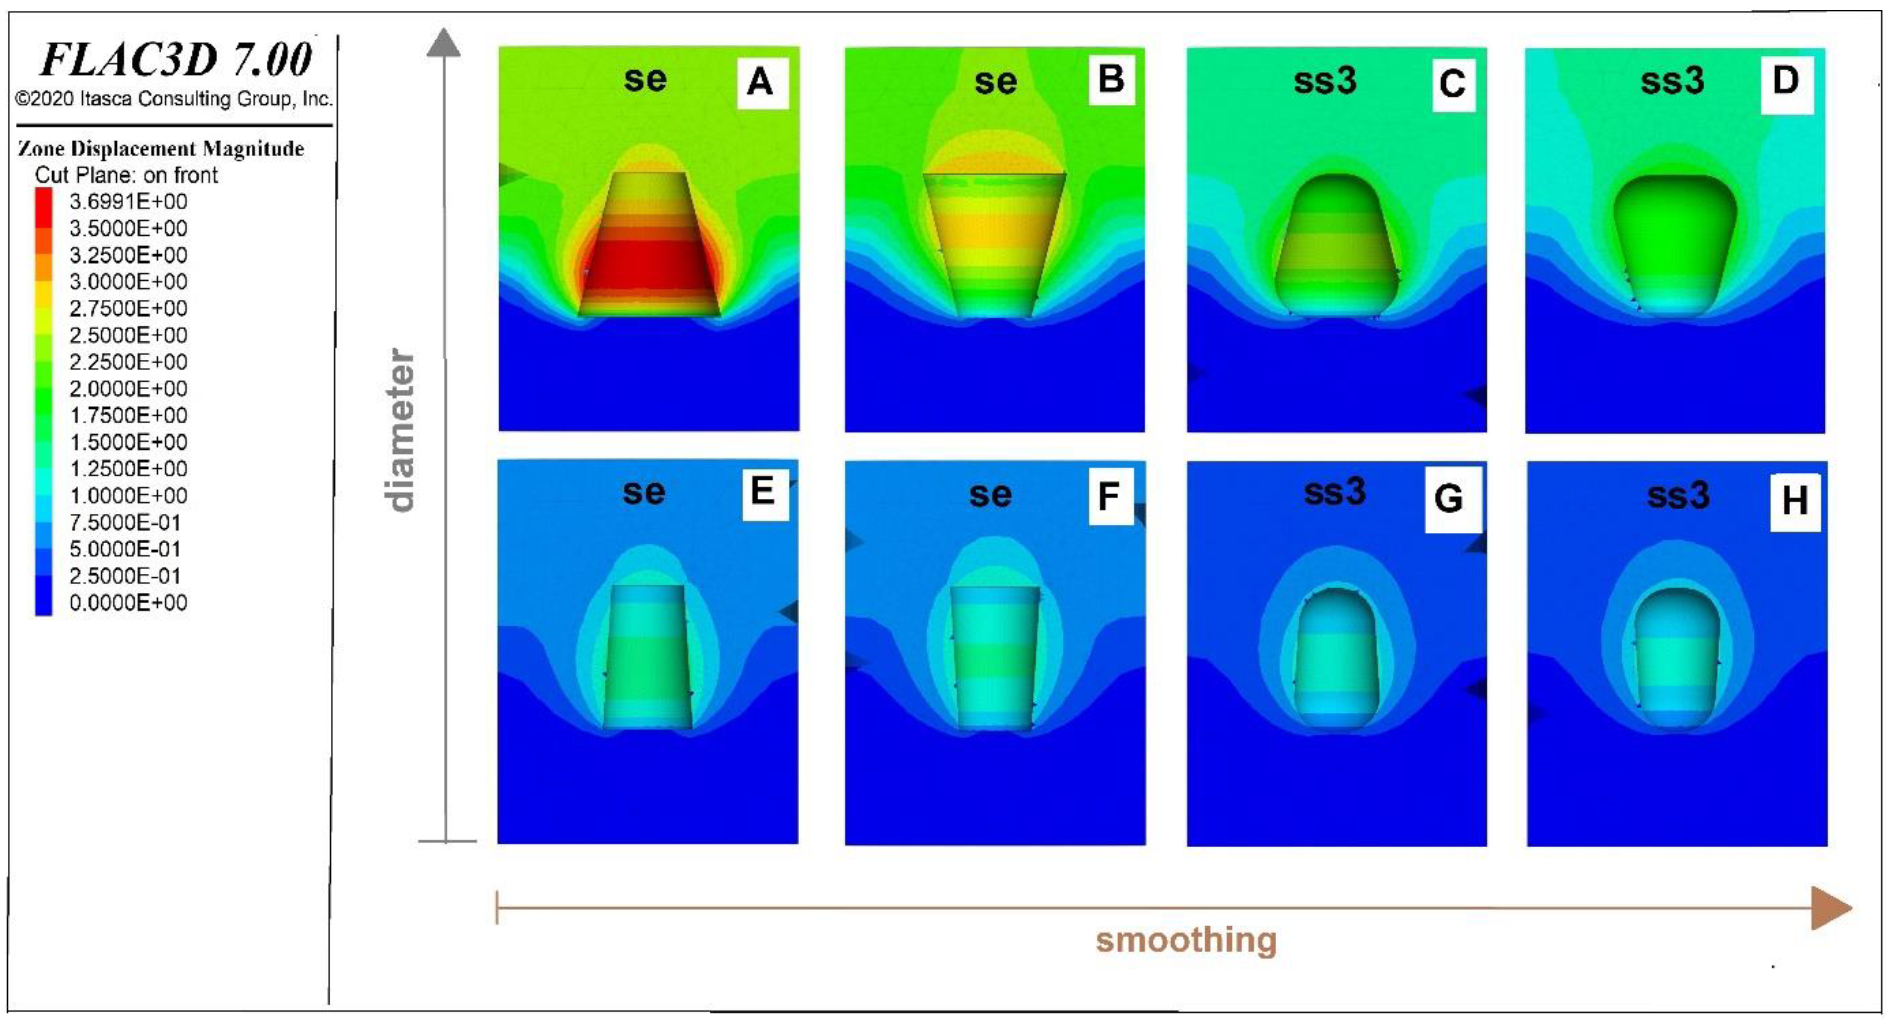
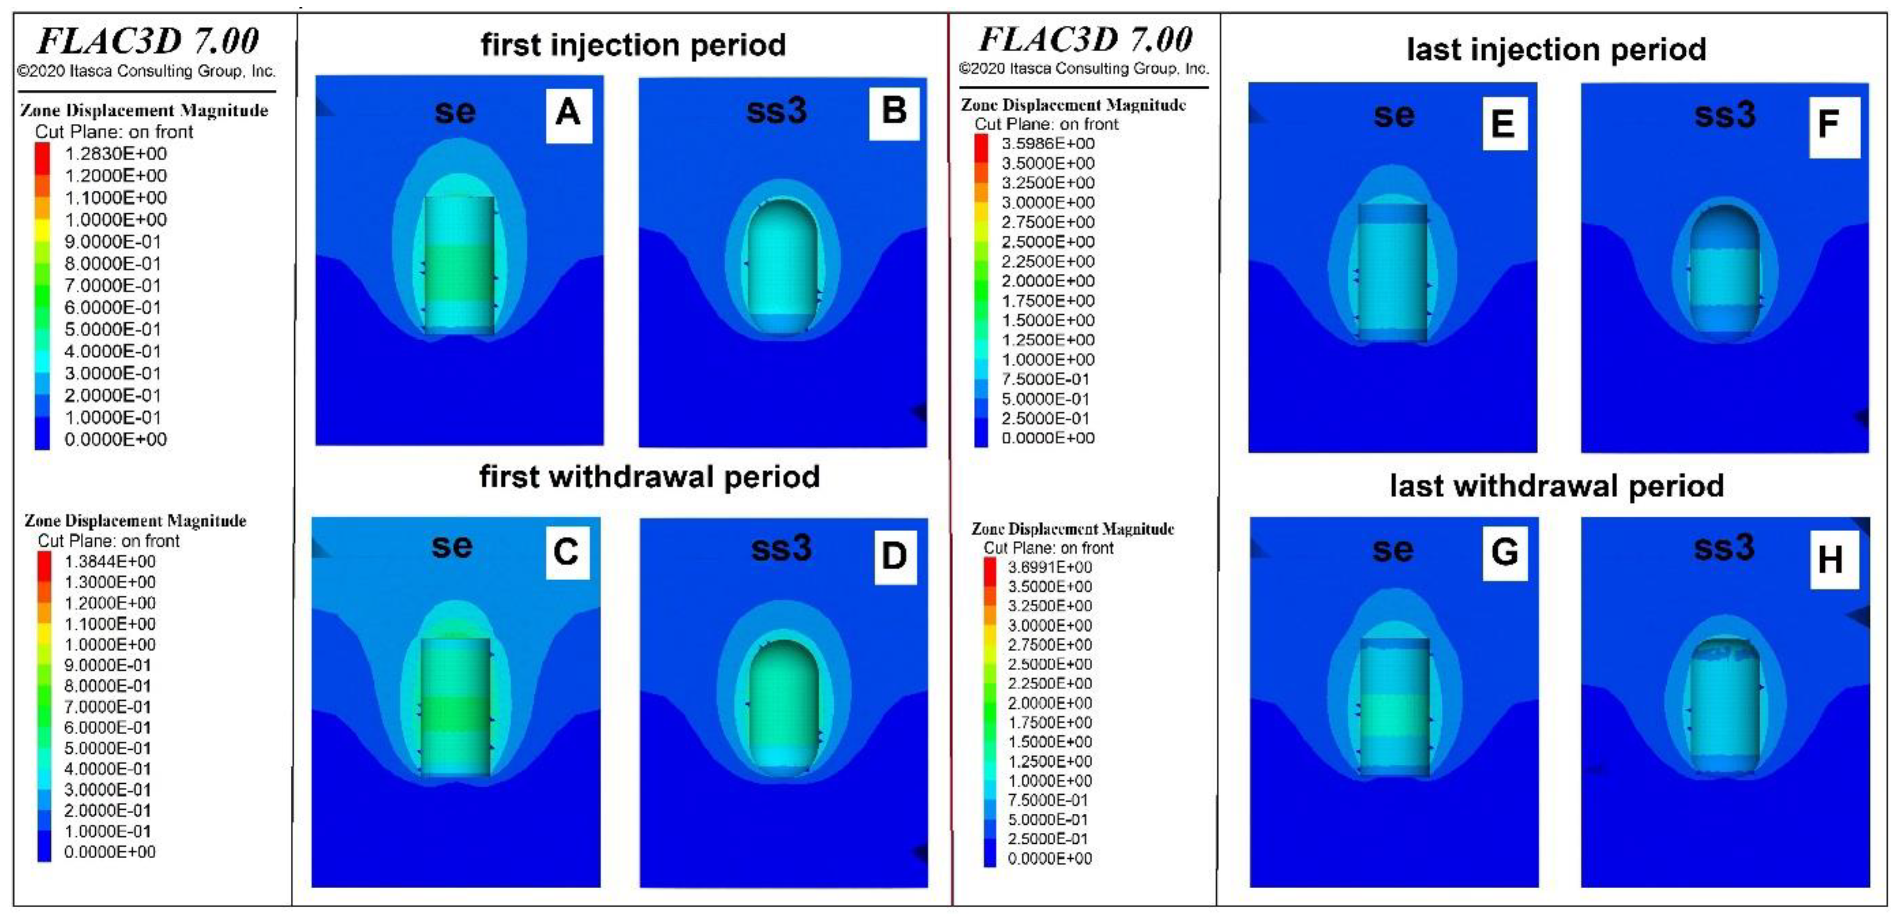
3.1. Displacements
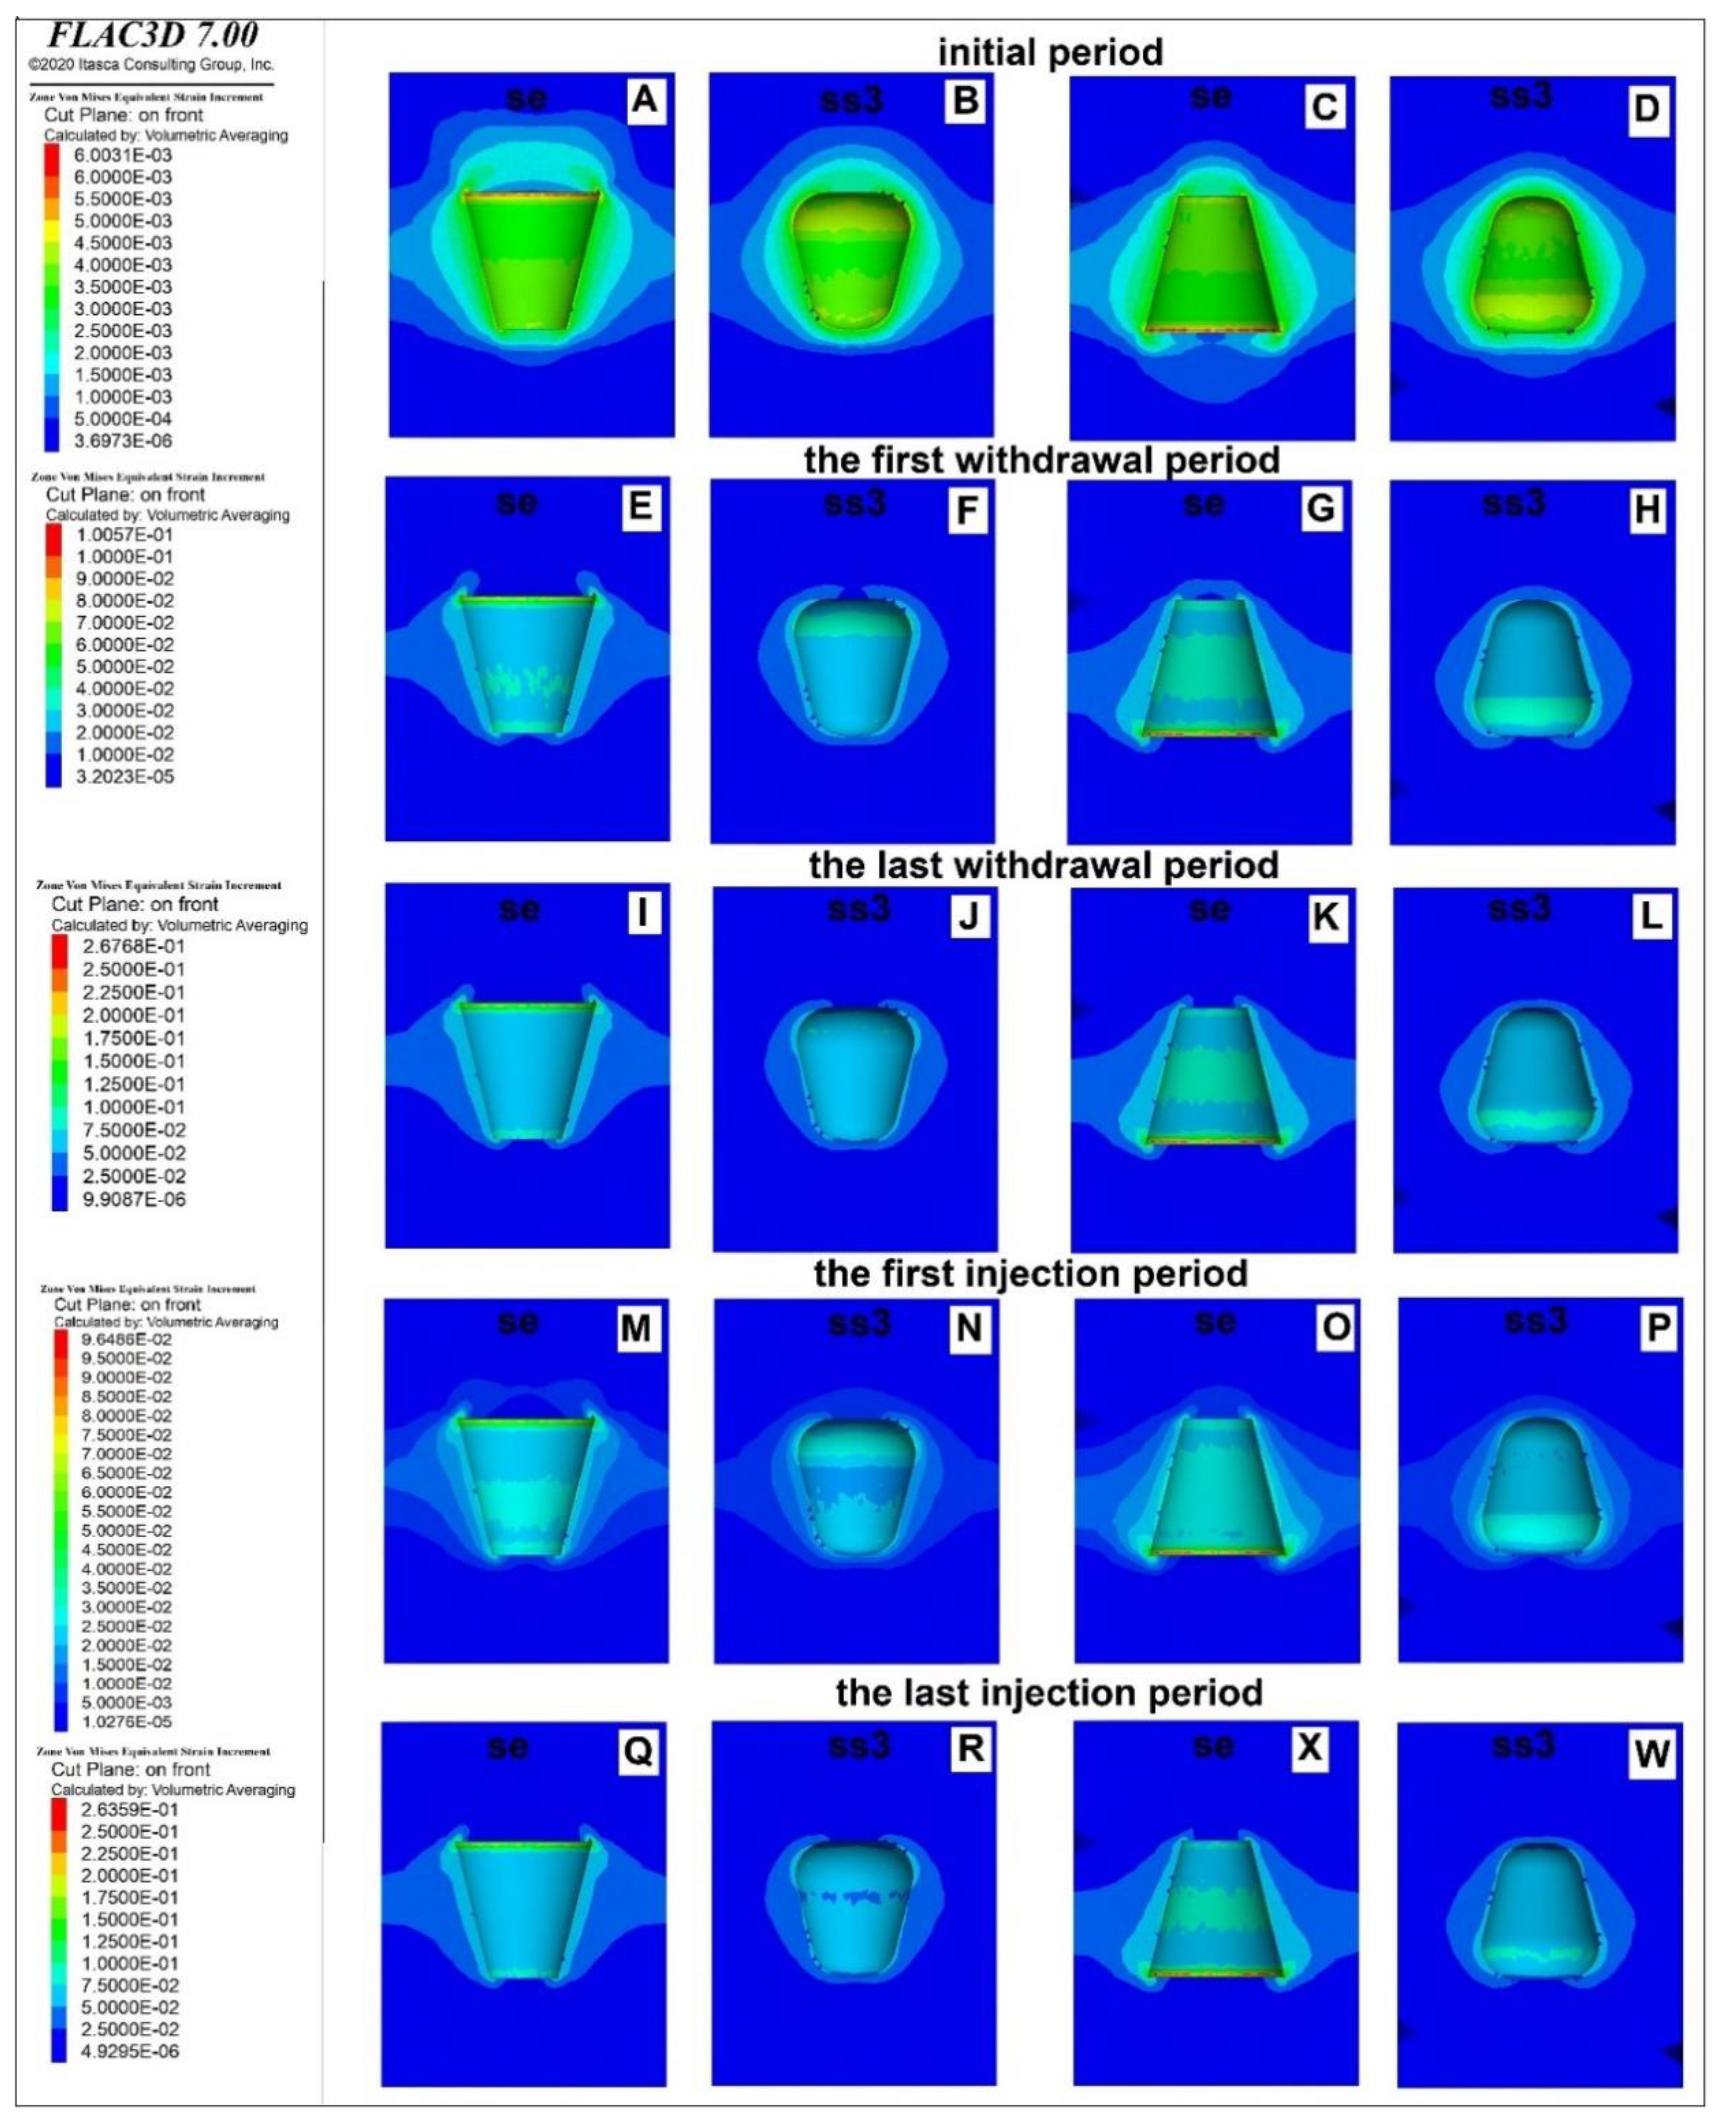
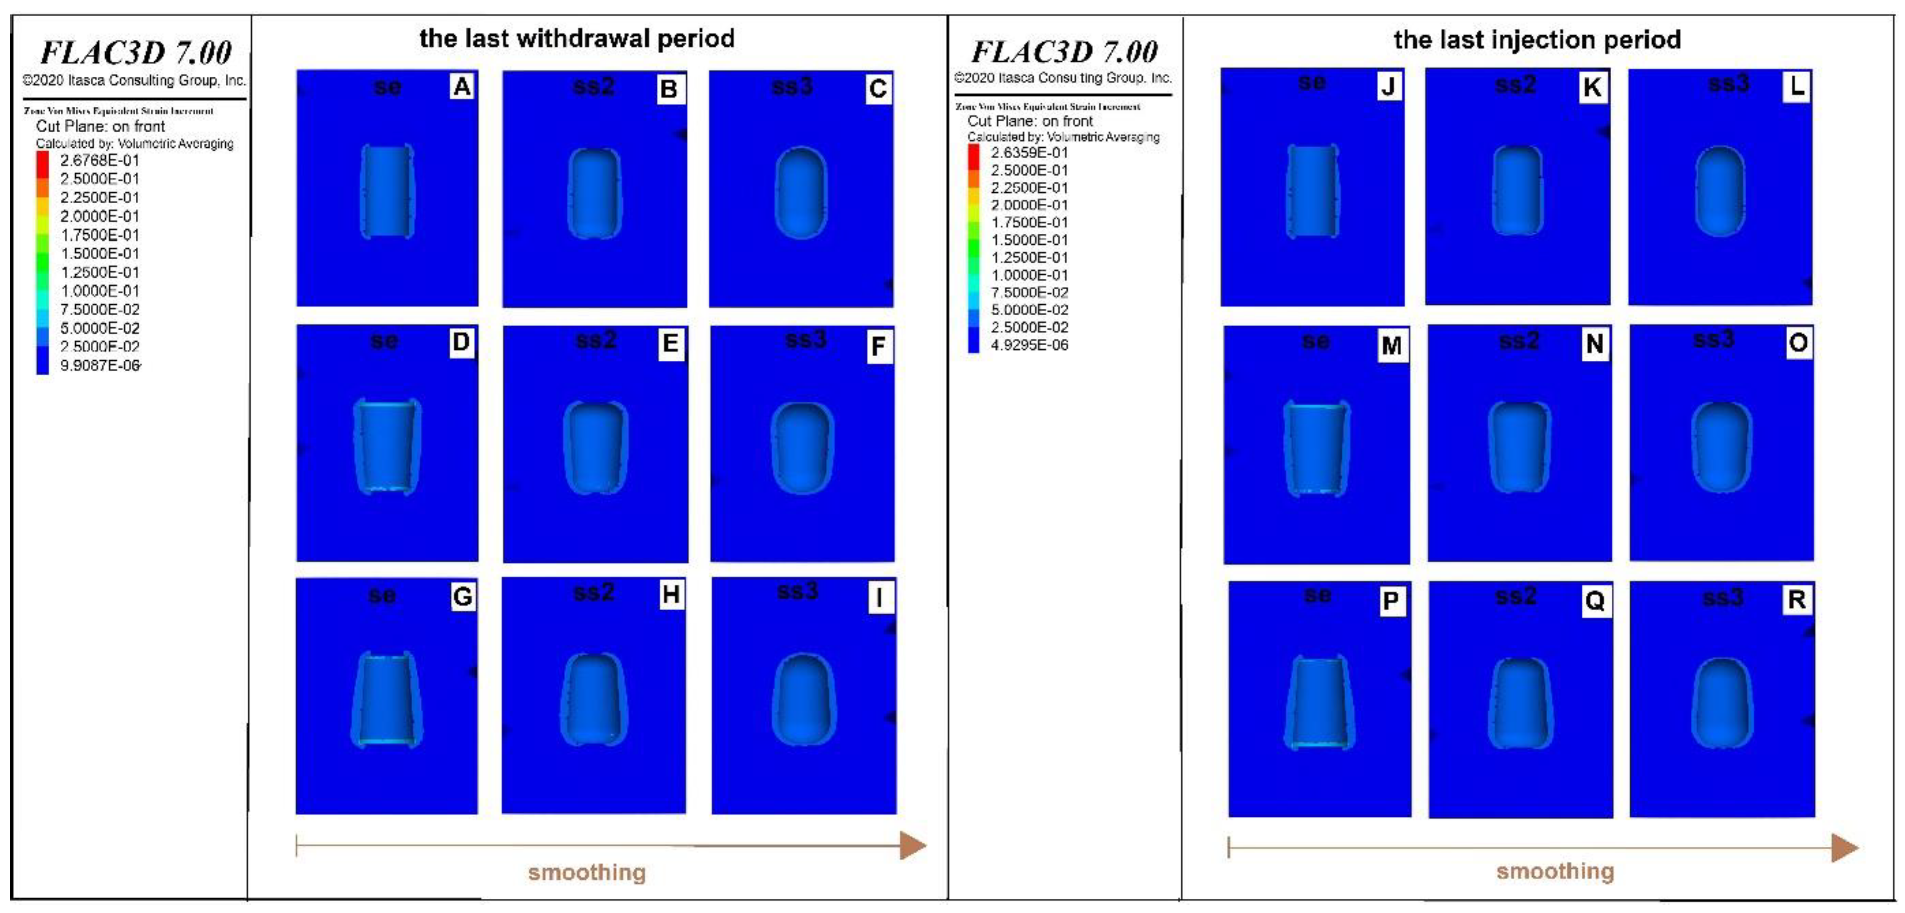
3.2. Effective Strains (ESs)
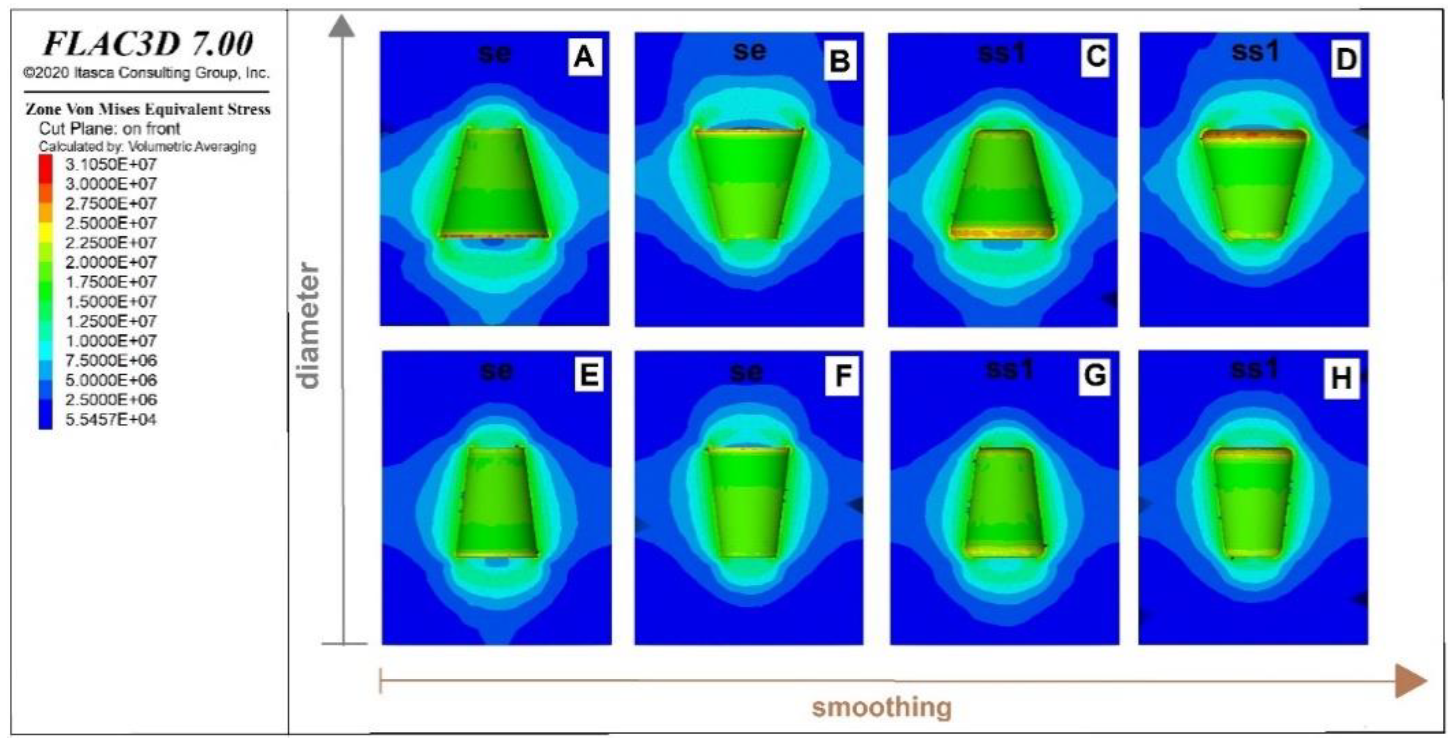
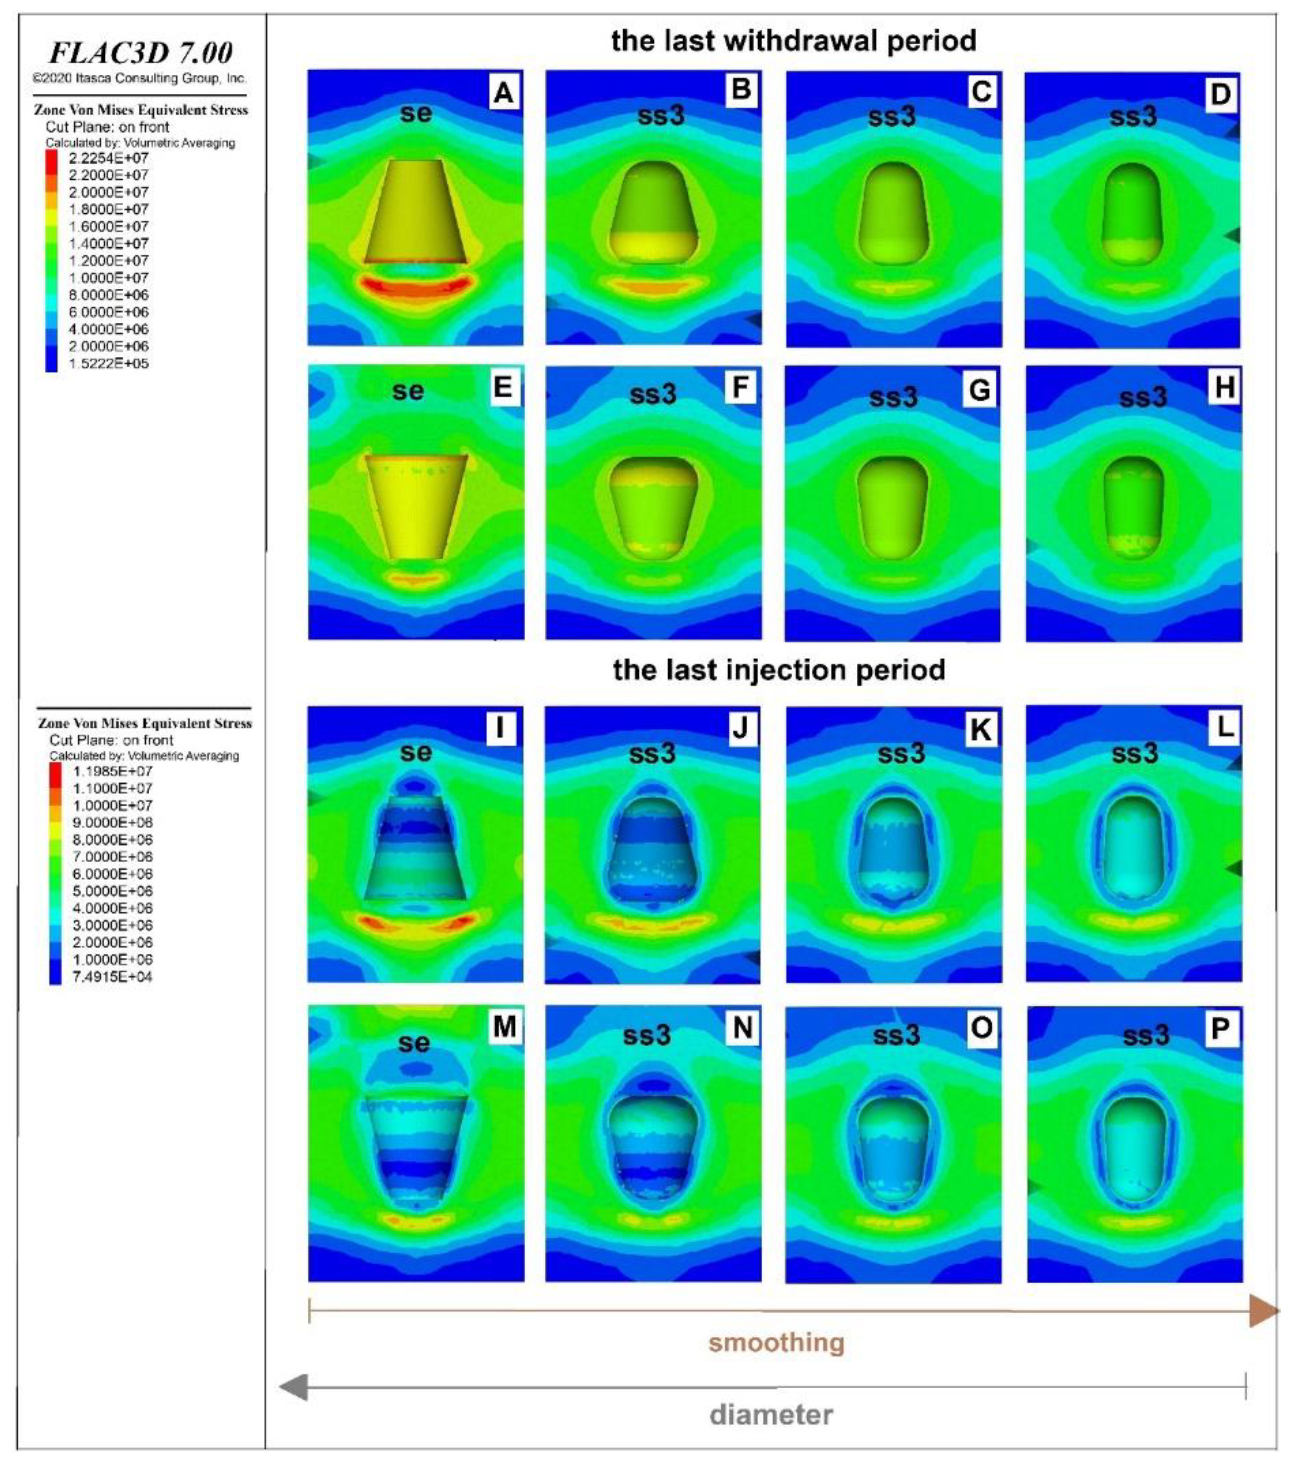
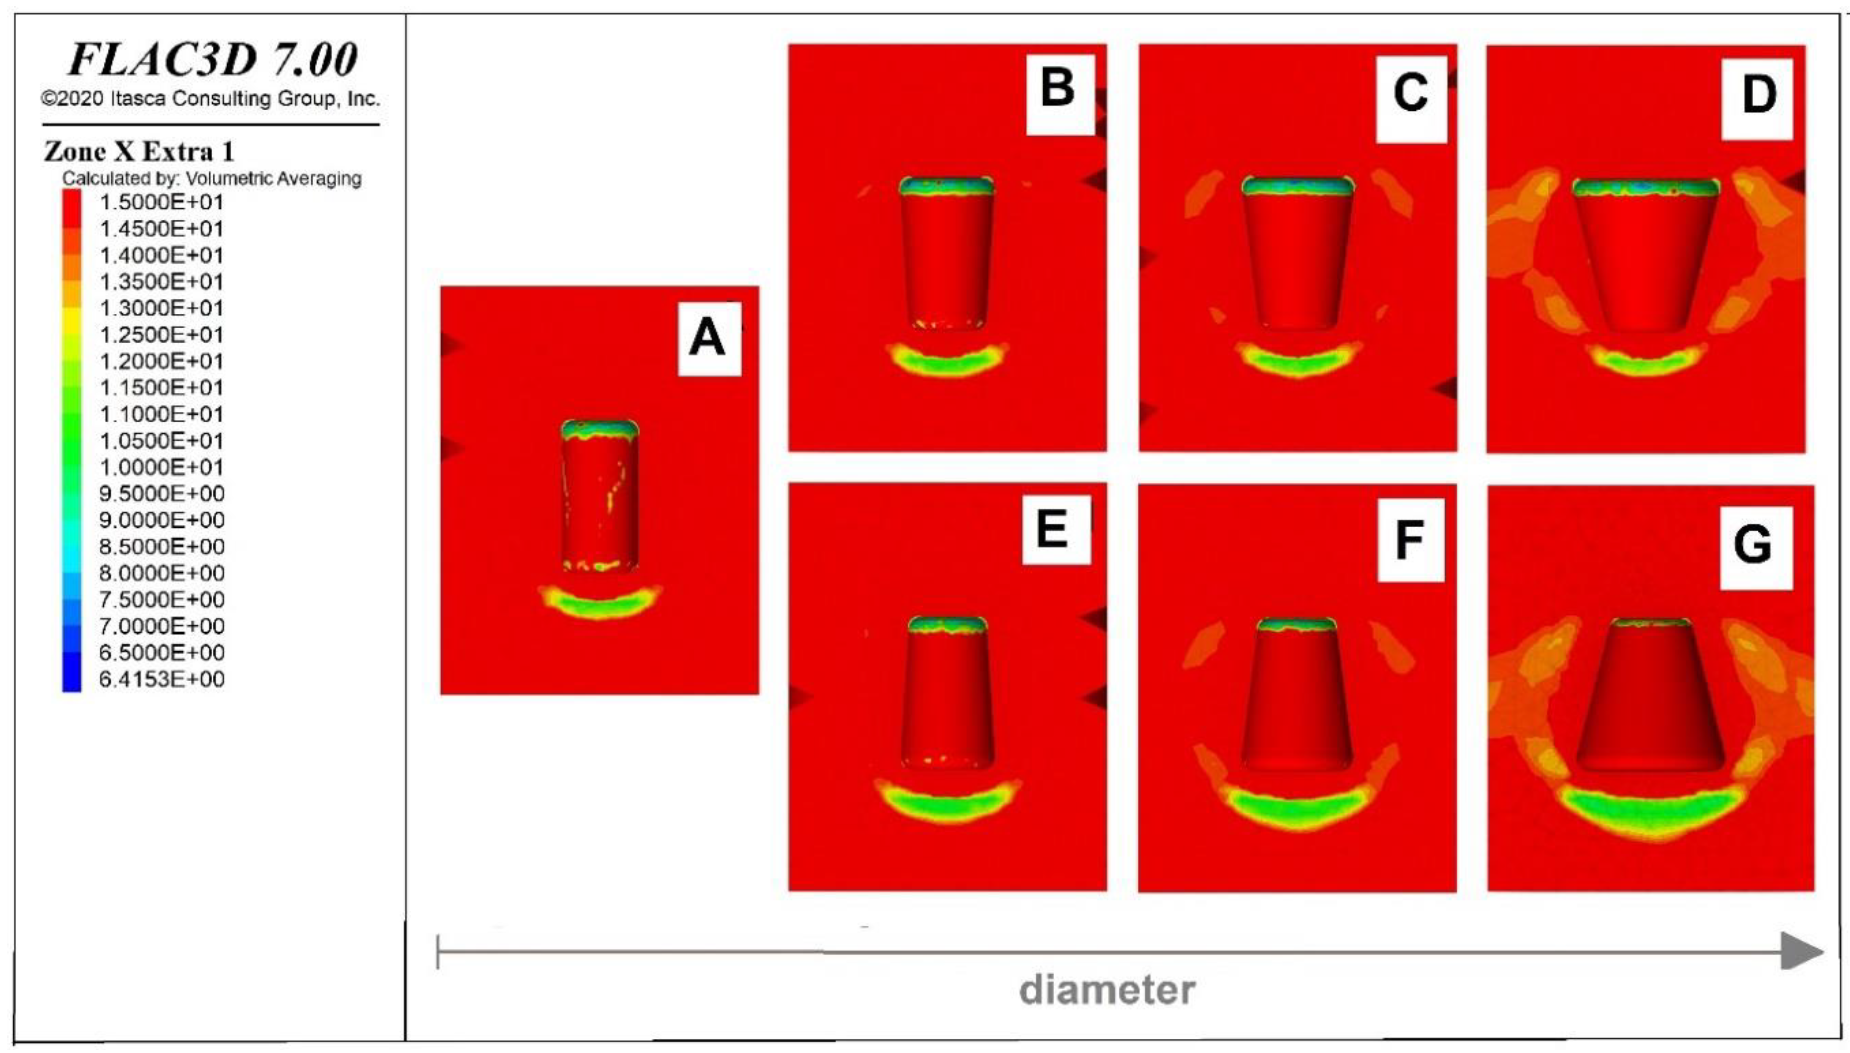
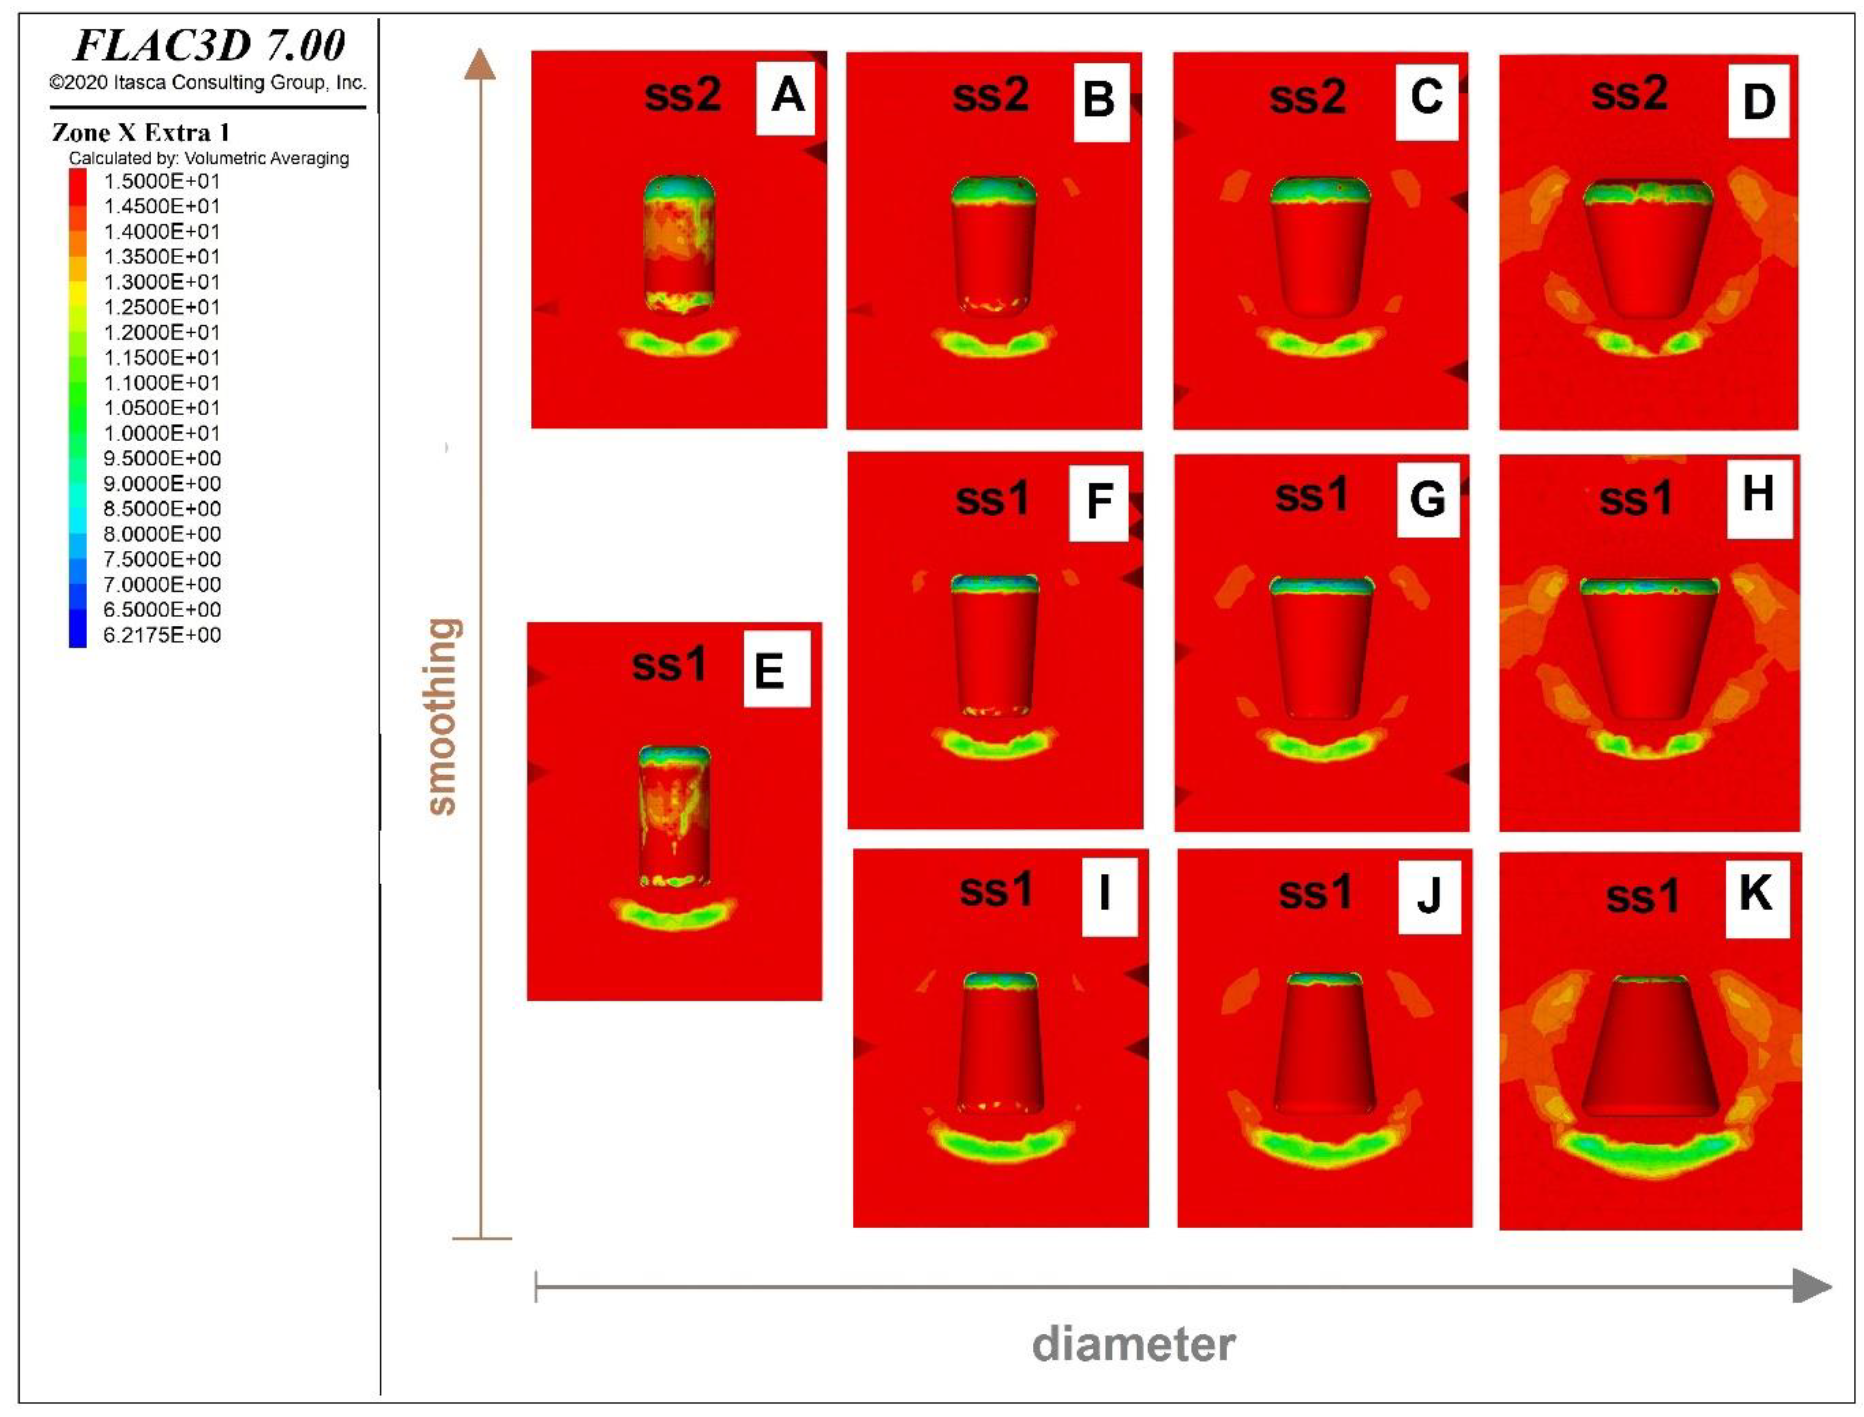
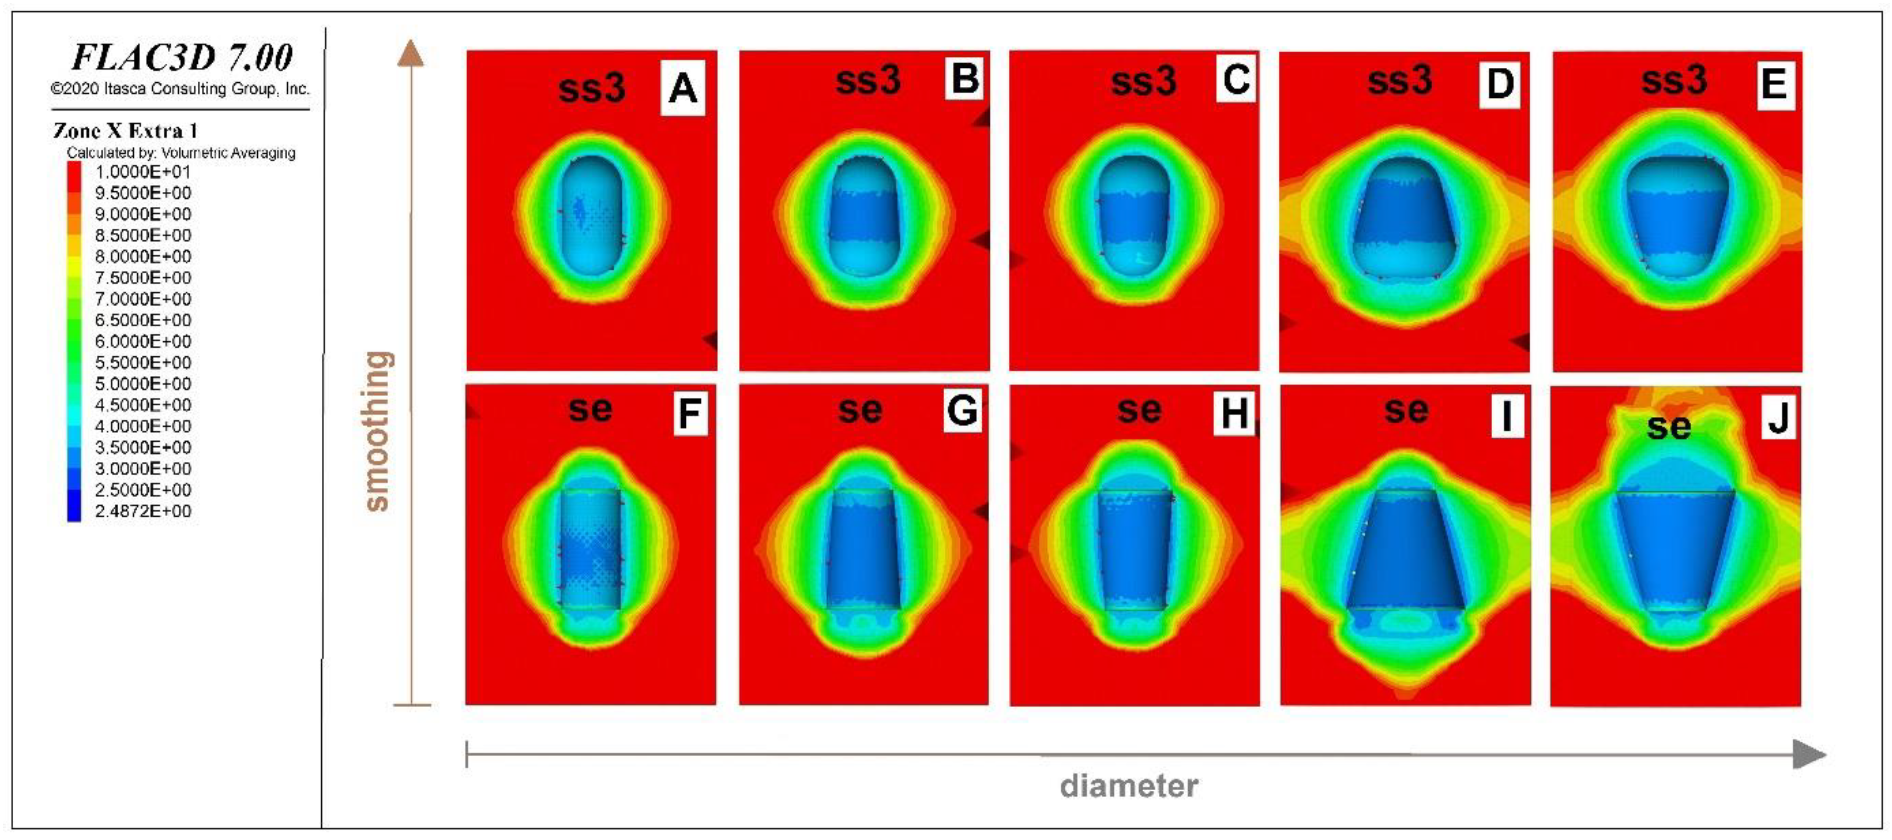
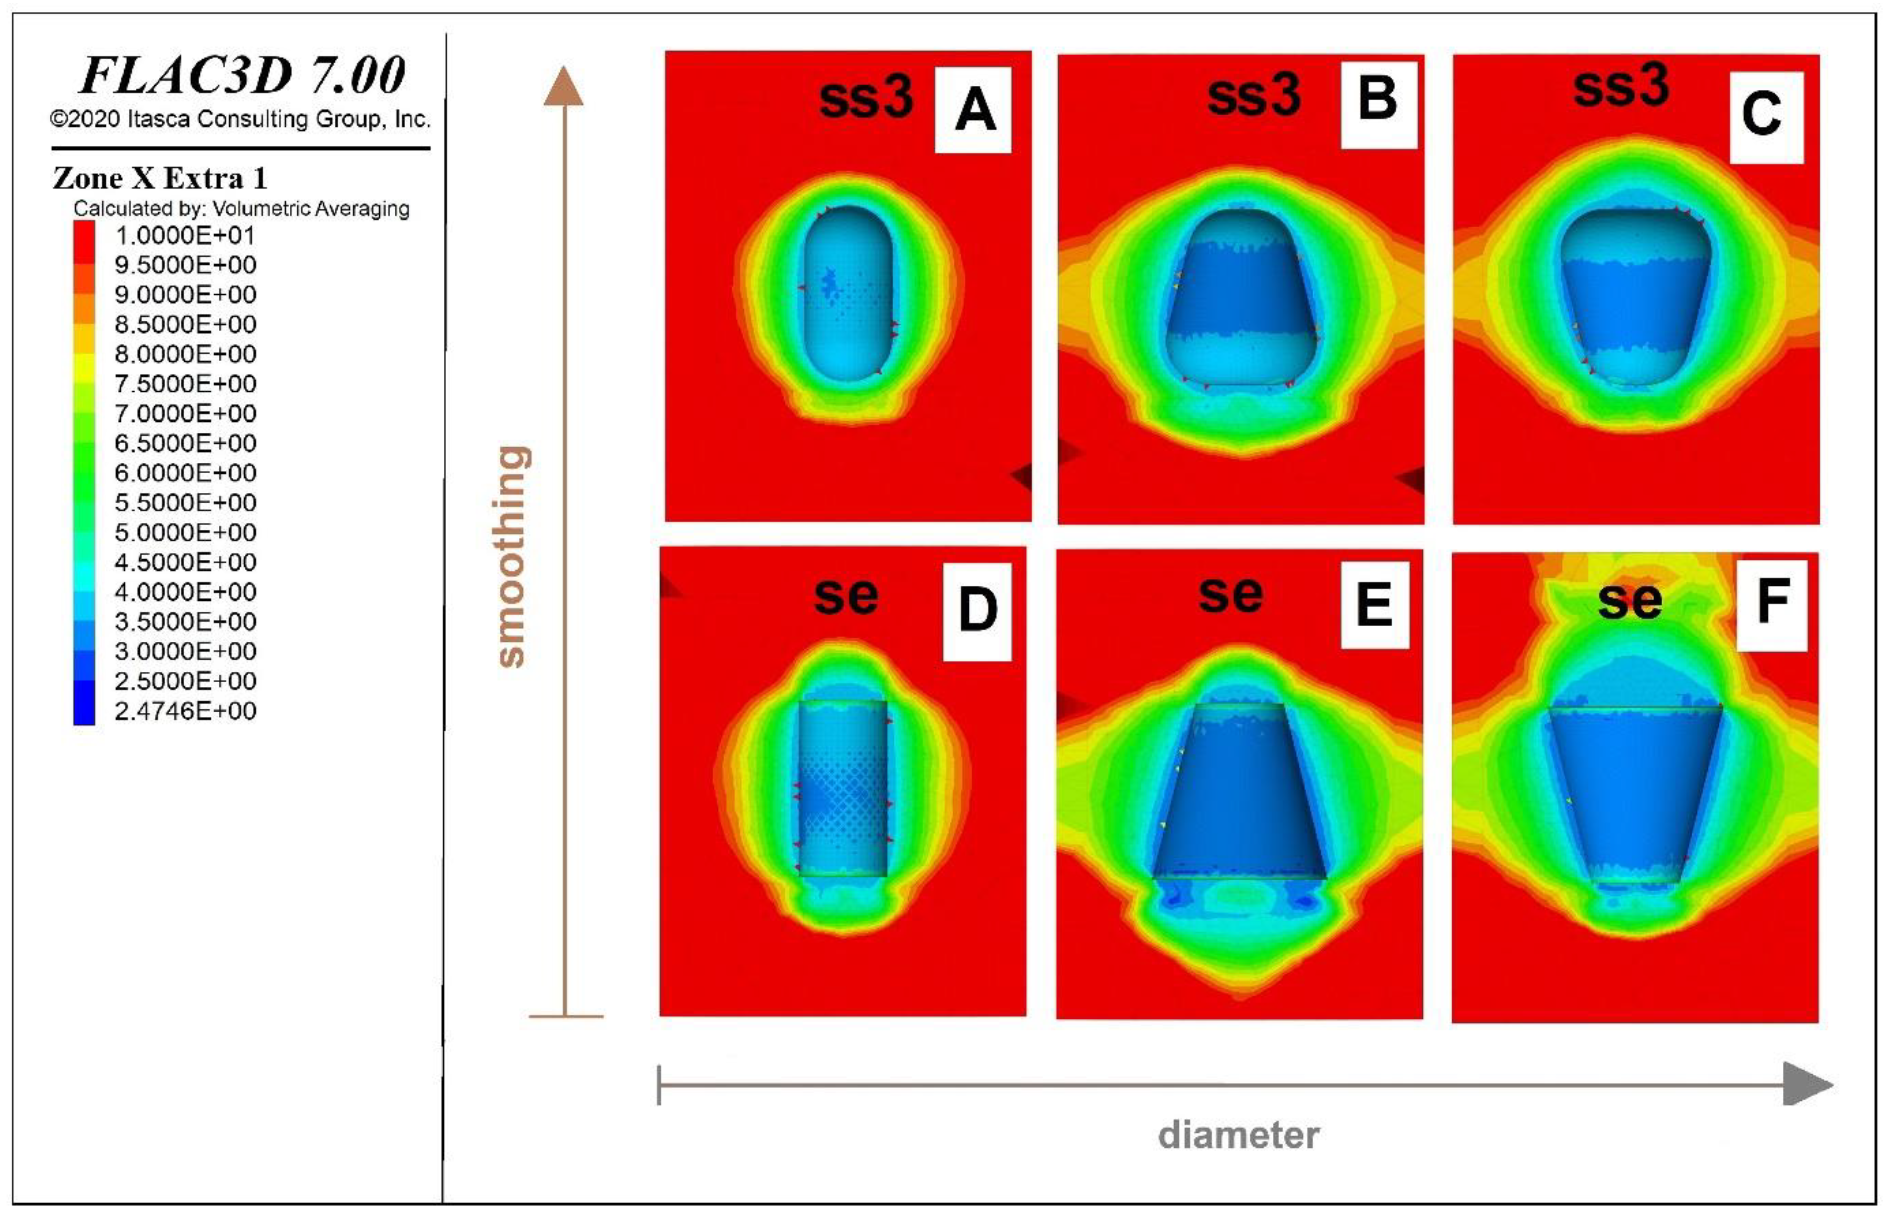
3.3. Von Mises Stress
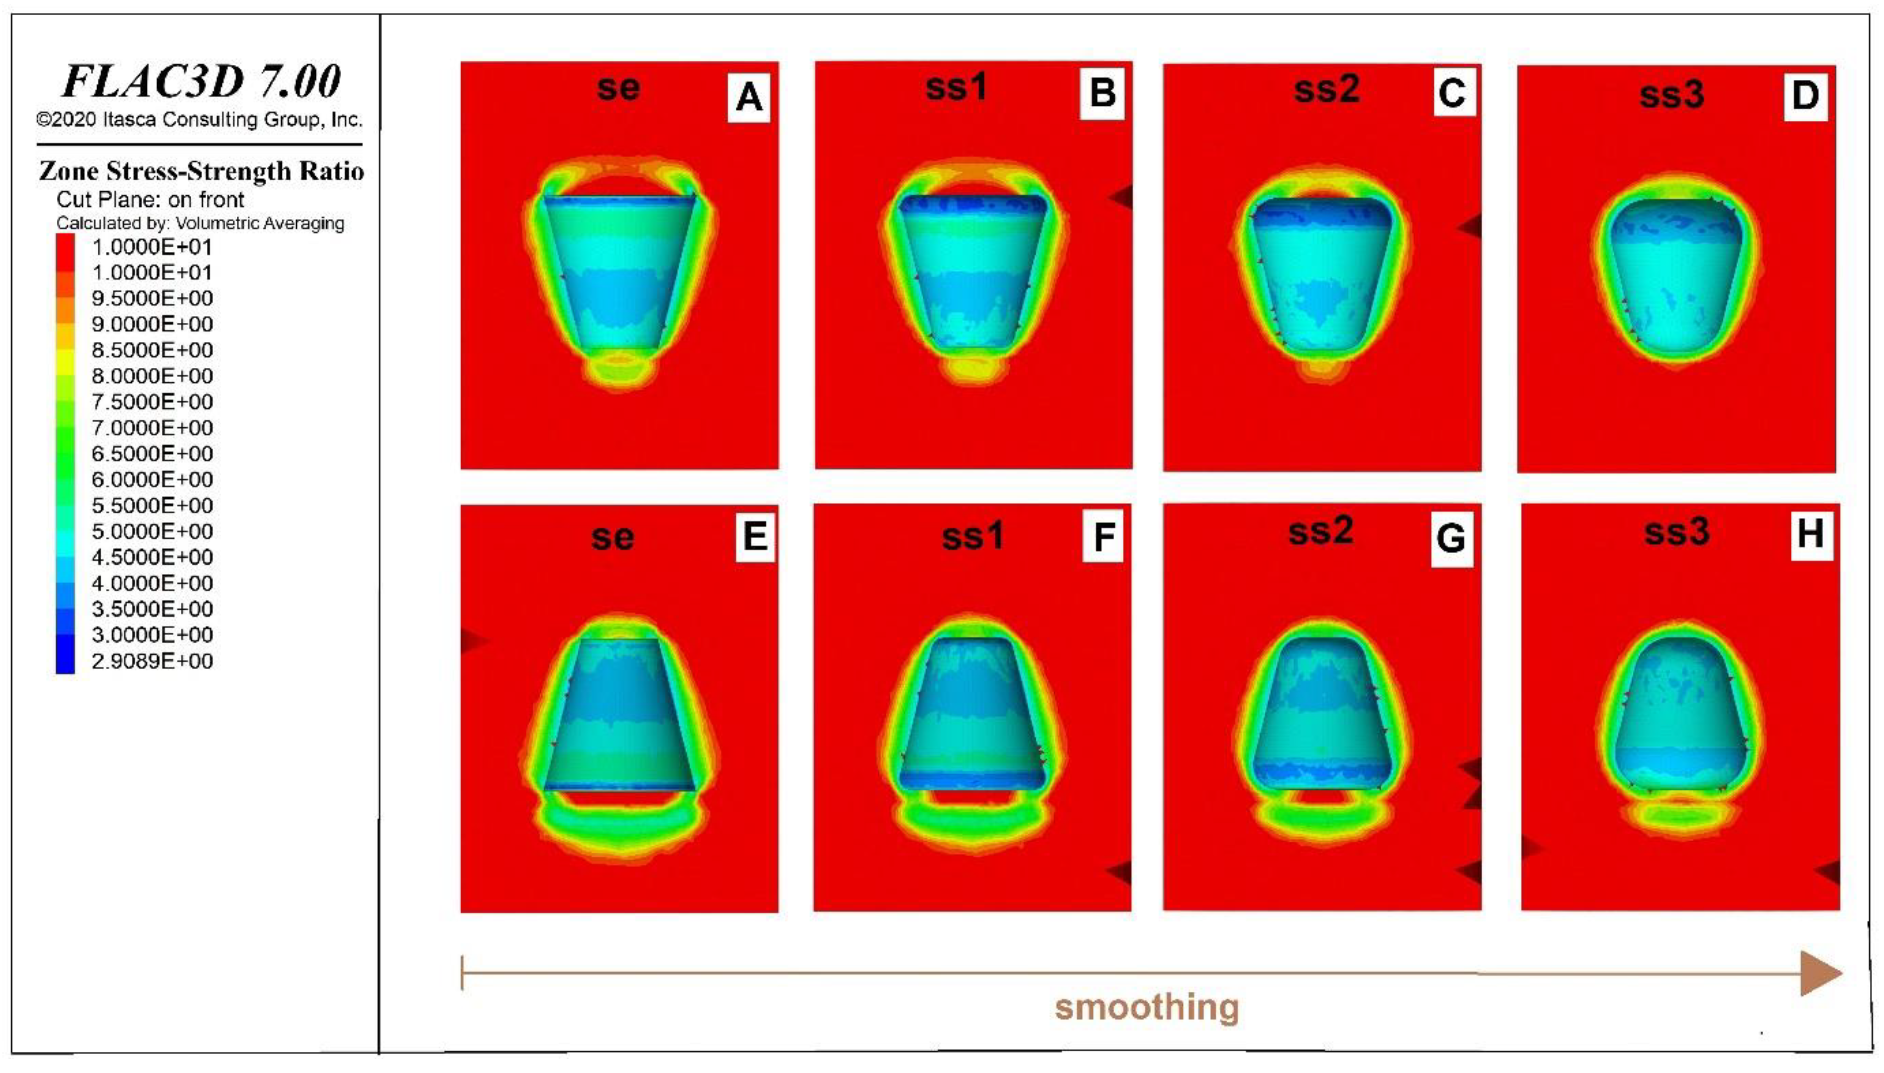
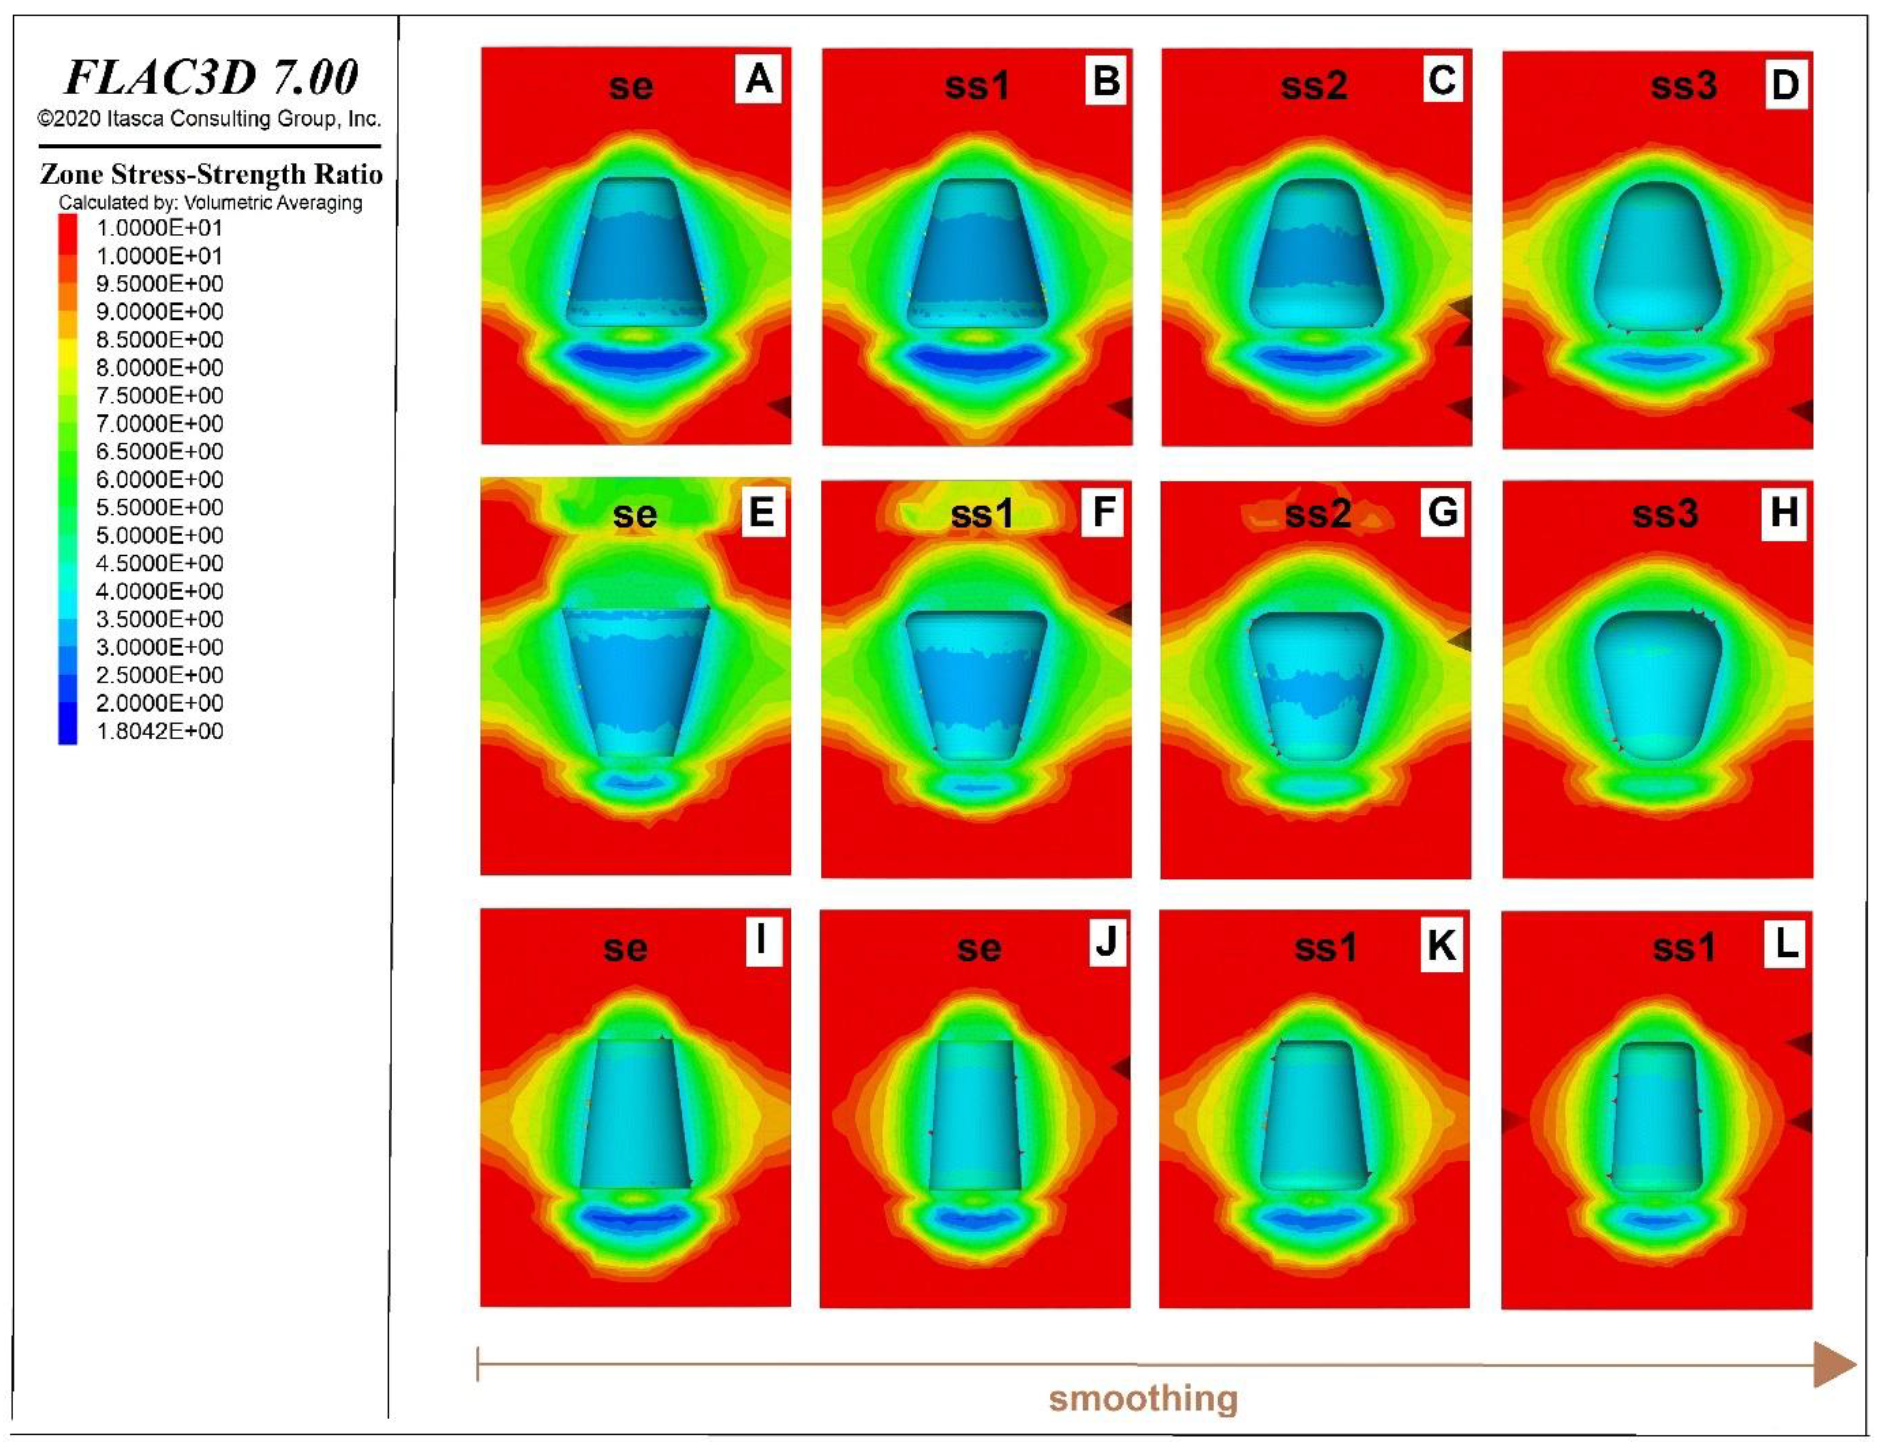
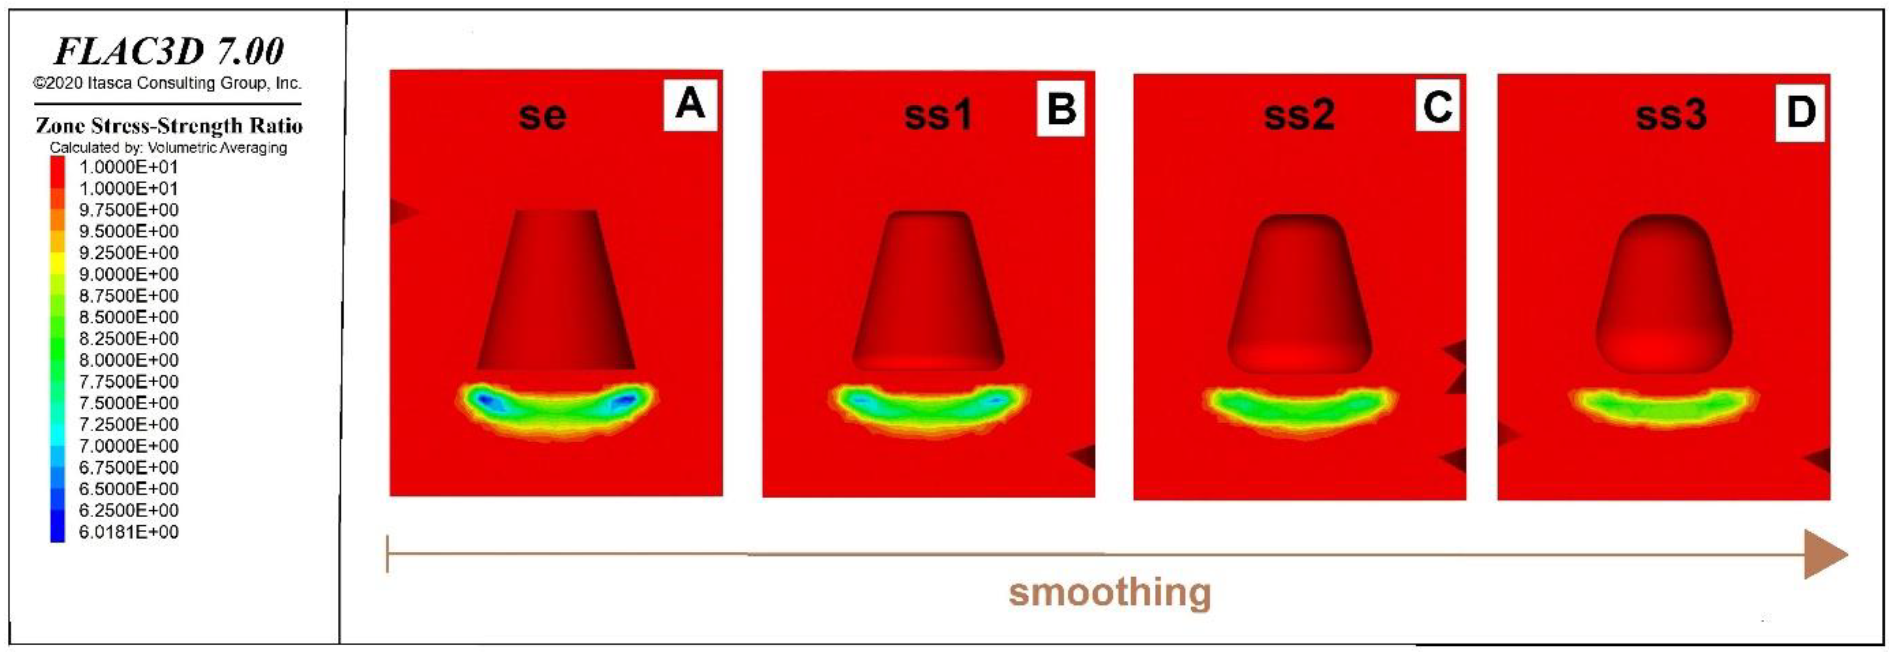
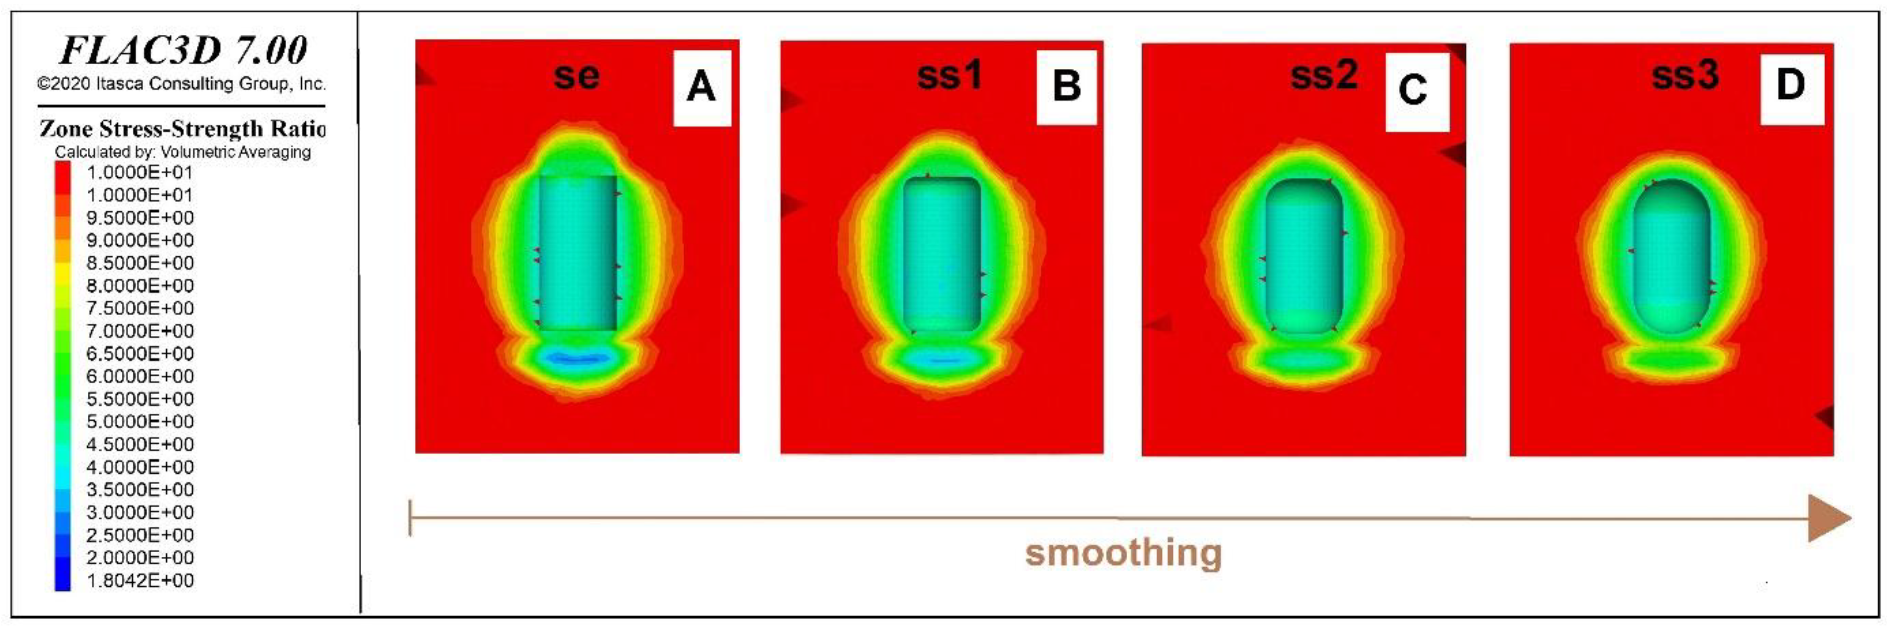
3.4. Strength/Stress Ratio (SSR)
3.5. Safety Factor (SF)
3.6. Volumetric Closure
4. Discussion
5. Conclusions
Supplementary Materials
Author Contributions
Funding
Conflicts of Interest
References
- Yang, C.; Wang, T.; Ma, H.; Li, Y.; Shi, X.; Daemen, J. Feasibility analysis of using closely spaced caverns in bedded rock salt for underground gas storage: A case study. Environ. Earth Sci. 2016, 75, 1138. [Google Scholar] [CrossRef]
- Wang, T.; Yang, C.; Chen, J.; Daemen, J. Geomechanical investigation of roof failure of China’s first gas storage salt cavern. Eng. Geol. 2018, 243, 59–69. [Google Scholar] [CrossRef]
- Wang, G.; Guo, K.; Christianson, M.; Konietzky, H. Deformation characteristics of rock salt with mudstone interbeds surrounding gas and oil storage cavern. Int. J. Rock Mech. Min. Sci. 2011, 48, 871–877. [Google Scholar] [CrossRef]
- Yu, L.; Liu, J. Stability of interbed for salt cavern gas storage in solution mining considering cusp displacement catastrophe theory. Petroleum 2015, 1, 82–90. [Google Scholar] [CrossRef] [Green Version]
- Li, J.; Shi, X.; Yang, C.; Li, Y.; Wang, T.; Ma, H.; Shi, H.; Li, J.; Liu, J. Repair of irregularly shaped salt cavern gas storage by re-leaching under gas blanket. J. Nat. Gas Sci. Eng. 2017, 45, 848–859. [Google Scholar] [CrossRef]
- Li, J.; Tang, Y.; Shi, X.; Xu, W.; Yang, C. Modeling the construction of energy storage salt caverns in bedded salt. Appl. Energy 2019, 255, 113866. [Google Scholar] [CrossRef]
- Ozarslan, A. Large-scale hydrogen energy storage in salt caverns. Int. J. Hydrog. Energy 2012, 37, 14265–14277. [Google Scholar] [CrossRef]
- Lord, A.S.; Kobos, P.H.; Borns, D.J. Geologic storage of hydrogen: Scaling up to meet city transportation demands. Int. J. Hydrog. Energy 2014, 39, 15570–15582. [Google Scholar] [CrossRef] [Green Version]
- Michalski, J.; Bünger, U.; Crotogino, F.; Donadei, S.; Schneider, G.-S.; Pregger, T.; Cao, K.-K.; Heide, D. Hydrogen generation by electrolysis and storage in salt caverns: Potentials, economics and systems aspects with regard to the German energy transition. Int. J. Hydrog. Energy 2017, 42, 13427–13443. [Google Scholar] [CrossRef]
- Crotogino, F.; Schneider, G.-S.; Evans, D.J. Renewable energy storage in geological formations. Proc. Inst. Mech. Eng. Part A J. Power Energy 2017, 232, 100–114. [Google Scholar] [CrossRef]
- Bruno, M.S.; Durseault, M.B. 2002, Geomechanical Analysis of Prersure Limits for Thin Bedded Salt Caverns. In Proceedings of the SMRI Spring Technical Meeting, Banff, AB, Canada, 29–30 April 2002. [Google Scholar]
- Zhang, Y.; Shi, X.; Ma, H.; Yang, C.; Ye, L.; Han, Y.; Zhang, N. Research on the Limit Operating Prersure of a Bedded Salt Gas Storage Cavern: A Case Study. In Proceedings of the 52nd U.S. Rock Mechanics/Geomechanics Symposium, Seattle, WA, USA, 17–20 June 2018. [Google Scholar]
- Wang, T.; Li, J.; Jing, G.; Zhang, Q.; Yang, C.; Daemen, J. Determination of the maximum allowable gas prersure for an un-derground gas storage salt cavern e A case study of Jintan, China. J. Rock Mech. Geotech. Eng. 2019, 11, 251–262. [Google Scholar] [CrossRef]
- Bruno, M.S. Geomechanical Analysis and Design Considerations for Thin-Bedded Salt Caverns: Final Report; Terralog Technologies: Arcadia, CA, USA, 2005. [Google Scholar]
- Bruno, M.S.; Dorfmann, L.; Han, G.; Lao, K.; Young, J.T. 3D geomechanical analysis of multiple caverns in bedded salt. In Proceedings of the SMRI Fall Technical Meeting, Nancy, France, 1–5 October 2005. [Google Scholar]
- DeVries, K.L.; Mellegard, K.D.; Callahan, G.D. Proof-of-concept research on a salt damage criterion for cavern design: A project status report. In Proceedings of the SMRI Spring Technical Meeting, Banff, AB, Canada, 29–30 April 2002. [Google Scholar]
- Cosenza, P.; Ghoreychi, M. Effects of very low permeability on the long-term evolution of a storage cavern in rock salt. Int. J. Rock Mech. Min. Sci. 1999, 36, 527–533. [Google Scholar] [CrossRef]
- Cosenza, P.; Ghoreychi, M.; Bazargan-Sabet, B.; de Marsily, G. In situ rock salt permeability measurement for long term safety arsersment of storage. Int. J. Rock. Mech. Min. Sci. 1999, 36, 509–526. [Google Scholar] [CrossRef]
- Minkley, M.; Muehlbauer, J. Constitutive models to describe the mechanical behaviour of salt rocks and the imbedded weakness planes. In Proceedings of the 6th Conference on the Mechanical Behavior of Salt-SALTMECH 6, Hannover, Germany, 22–25 May 2007. [Google Scholar]
- Yang, C.H.; Liang, W.G.; Wei, H.D. Investigation on porsibility of energy storage in salt rock in China. Chin. J. Rock Mech. Eng. 2005, 24, 4409–4417. [Google Scholar]
- Cała, M.; Cyran, K.; Kowalski, M.; Wilkosz, P. Influence of the Anhydrite Interbeds on a Stability of the Storage Caverns in the Mechelinki Salt Deposit (Northern Poland). Arch. Min. Sci. 2018, 63, 1007–1025. [Google Scholar]
- Liu, W.; Jiang, D.; Chen, J.; Daemen, J.; Tang, K.; Wu, F. Comprehensive feasibility study of two-well-horizontal caverns for natural gas storage in thinly-bedded salt rocks in China. Energy 2018, 143, 1006–1019. [Google Scholar] [CrossRef]
- Jie, C.; Dan, L.; Wei, L.; Jinyang, F.; Deyi, J.; Liang, Y.; Yanfei, K. Stability study and optimization design of small-spacing two-well (RSTW) salt caverns for natural gas storages. J. Energy Storage 2020, 27, 101131. [Google Scholar]
- Cristescu, N.; Paraschiv, I. The optimal shape of rectangular-like caverns. Int. J. Rock Mech. Min. Sci. Géoméch. Abstr. 1995, 32, 285–300. [Google Scholar] [CrossRef]
- Staudtmeister, K.; Rokahr, R. Rock mechanical design of storage caverns for natural gas in rock salt mass. Int. J. Rock Mech. Min. Sci. 1997, 34, 300.e1–300.e13. [Google Scholar] [CrossRef]
- Ehgartner, B.L.; Sobolik, S.R. Analysis of Cavern Shapes for the Strategic Petroleum Reserve; Office of Scientific and Technical Information (OSTI): Oak Ridge, TN, USA, 2006. [Google Scholar]
- Wei, J.; Liang, W.G.; Zhao, Y.S. Effects of geometrical characteristic on cavern integrity for the underground gas storage. In Boundaries of Rock Mechanics: Recent Advances and Challenges for the 21st Century; Cai, M., Wang, J., Eds.; CRC Press: London, UK, 2008; pp. 349–352. [Google Scholar]
- Lux, K.-H. Design of salt caverns for the storage of natural gas, crude oil and compressed air: Geomechanical aspects of construction, operation and abandonment. Geol. Soc. Lond. Spéc. Publ. 2009, 313, 93–128. [Google Scholar] [CrossRef]
- Wang, T.; Yan, X.; Yang, H.; Yang, X.; Jiang, T.; Zhao, S. A new shape design method of salt cavern used as underground gas storage. Appl. Energy 2013, 104, 50–61. [Google Scholar] [CrossRef]
- Jianjun, L.; Le, Y. The optimal geometric shape of the inverted pear-like gas storage cavern in bedded salt based on the sta-bility. Electron. J. Geotech. Eng. 2014, 19, 9575–9597. [Google Scholar]
- Cyran, K. Insight into a shape of salt storage caverns. Arch. Min. Sci. 2020, 65, 363–398. [Google Scholar]
- Onal, E. Stability Analyses of Differently Shaped Salt Caverns for Underground Natural Gas Storage. Master’s Thesis, The Penn-sylvania State University, State College, PA, USA, 2013. [Google Scholar]
- Wang, T.; Yang, C.; Ma, H.; Li, Y.; Shi, X.; Li, J.; Daemen, J. Safety evaluation of salt cavern gas storage close to an old cavern. Int. J. Rock Mech. Min. Sci. 2016, 83, 95–106. [Google Scholar] [CrossRef]
- Yang, C.; Wang, T.; Qu, D.; Ma, H.; Li, Y.; Shi, X.; Daemen, J. Feasibility analysis of using horizontal caverns for underground gas storage: A case study of Yunying salt district. J. Nat. Gas Sci. Eng. 2016, 36, 252–266. [Google Scholar] [CrossRef]
- Peterson, R.E. Strers Concentration Factors; John Wiley & Sons: New York, NY, USA, 1974. [Google Scholar]
- Timoshenko, S.P.; Goodier, J.N. Theory of Elasticity, 3rd ed.; McGraw-Hill: New York, NY, USA, 1987. [Google Scholar]
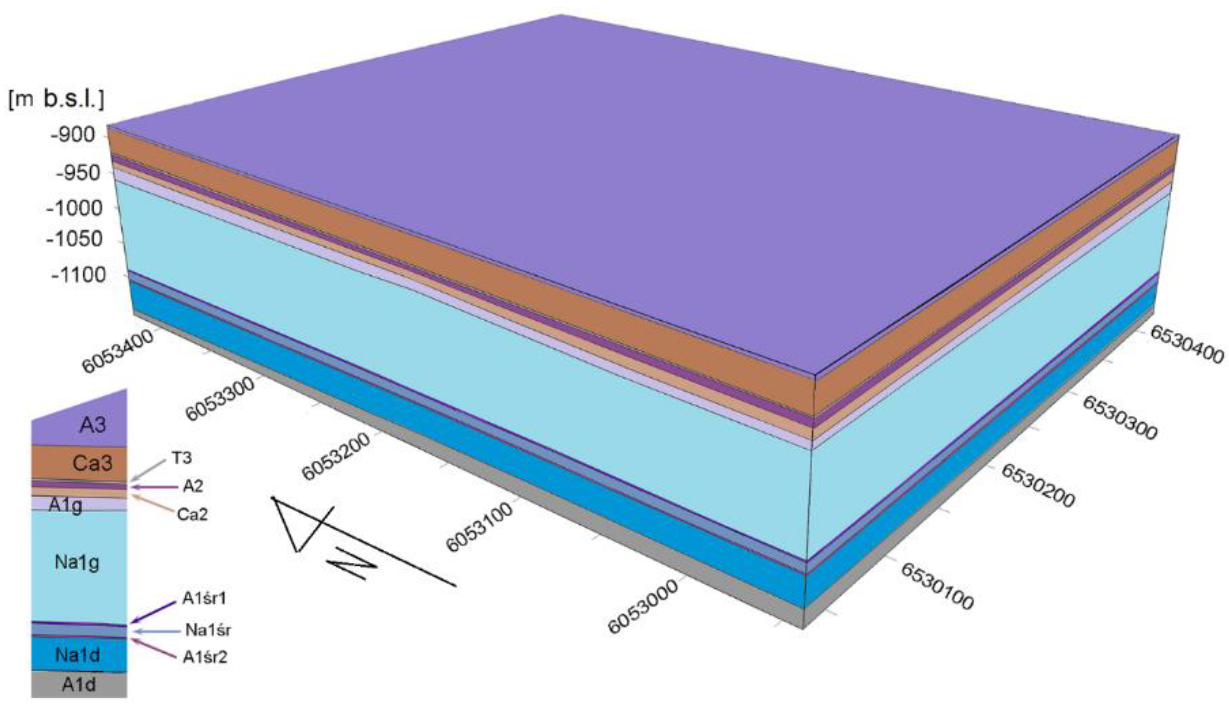
- Czapowski, G.; Chełmiński, J.; Tomaszczyk, M.; Tomassi-Morawiec, H. Methodology of 3D structure modelling of sedimentary stratiform mineral deposits-a case of the Mechelinki Zechstein salt deposit at the Puck Bay. Geol. Rev. 2007, 55, 681–689. [Google Scholar]
- Van Sambeek, L.L.; Ratigan, J.L.; Hansen, F.D. Dilatancy of rock salt in laboratory tests. Int. J. Rock Mech. Min. Sci. Géoméch. Abstr. 1993, 30, 735–738. [Google Scholar] [CrossRef]
- Devries, K.L.; Mellegard, K.D.; Callahan, G.D.; Goodman, W.M. Cavern Roof Stability for Natural Gas Storage in Bedded Salt; Office of Scientific and Technical Information (OSTI): Oak Ridge, TN, USA, 2005. [Google Scholar]
- DeVries, K.L. Geomechanical analyses to determine the onset of dilation around natural gas storage caverns in bedded salt. In Proceedings of the SMRI Spring Technical Meeting, Brussels, Belgium, 30 April–3 May 2006. [Google Scholar]
- Plaat, H. Underground gas storage: Why and how. In Underground Gas Storage: World-Wide Experiences and Future Development in the UK and Europe; Evans, D.J., Chadwick, R.A., Eds.; Geological Society of London: London, UK, 2009; Volume 313, pp. 25–37. [Google Scholar]
- Yang, C.; Wang, T.; Li, Y.; Yang, H.; Li, J.; Qu, D.; Xu, B.; Yang, Y.; Daemen, J. Feasibility analysis of using abandoned salt caverns for large-scale underground energy storage in China. Appl. Energy 2015, 137, 467–481. [Google Scholar] [CrossRef]
- Bérest, P.; Réveillère, A.; Evans, D.; Stöwer, M. Review and analysis of historical leakages from storage salt caverns wells. Oil Gas Sci. Technol. 2019, 74, 27. [Google Scholar] [CrossRef] [Green Version]
- Coleman, H.P.; Stroh, G.; Osnes, J. The Effects of Interbedded Salt & Potash on Cemented Casing at Dewdney Field. In Proceedings of the SMRI Fall Technical Meeting, Santander, Spain, 27–30 September 2015. [Google Scholar]
- Réveillère, A.; Bérest, P.; Evans, D.J.; Stöwer, M.; Chabannes, C.; Koopmans, T.; Bolt, A.R. Past Salt Caverns Incidents Data-Base Part 1: Leakage, Overfilling and Blow-Out; SMRI Research Report RR2017-2; Solution Mining Research Institute: Clifton Park, NY, USA, 2019. [Google Scholar]
- Osnes, D.G.; DeVries, K.L.; Ratigan, J.L.; Meece, M.W.; Thompson, M.; Spencer, G.W. A Case History of the Threaded Cou-pling Production Casing Failure in Gas Caverns—Part 1: Detection and Geomechanical Analysis. In Proceedings of the Solution Mining Research Institute Fall Meeting, Halifax, NS, Canada, 8–9 October 2007. [Google Scholar]
- Wei, L.; Yinping, L.; Chunhe, Y.; Deyi, J.; Daemen, J.J.K.; Chen, J.; Junfen, K. A new method of surface subsidence prediction for natural gas storage cavern in bedded rock salts. Environ. Earth Sci. 2016, 2016, 800. [Google Scholar] [CrossRef]
- Sepehri, M.; Apel, D.B.; Liu, W. Stope Stability Assessment and Effect of Horizontal to Vertical Stress Ratio on the Yielding and Relaxation Zones Around Underground Open Stopes Using Empirical and Finite Element Methods. Arch. Min. Sci. 2017, 62, 653–669. [Google Scholar] [CrossRef] [Green Version]
- Heusermann, S.; Rolfs, O.; Schmidt, U. Nonlinear finite-element analysis of solution mined storage caverns in rock saltusing the LUBBY2 constitutive model. Comput. Struct. 2003, 81, 629–638. [Google Scholar] [CrossRef]


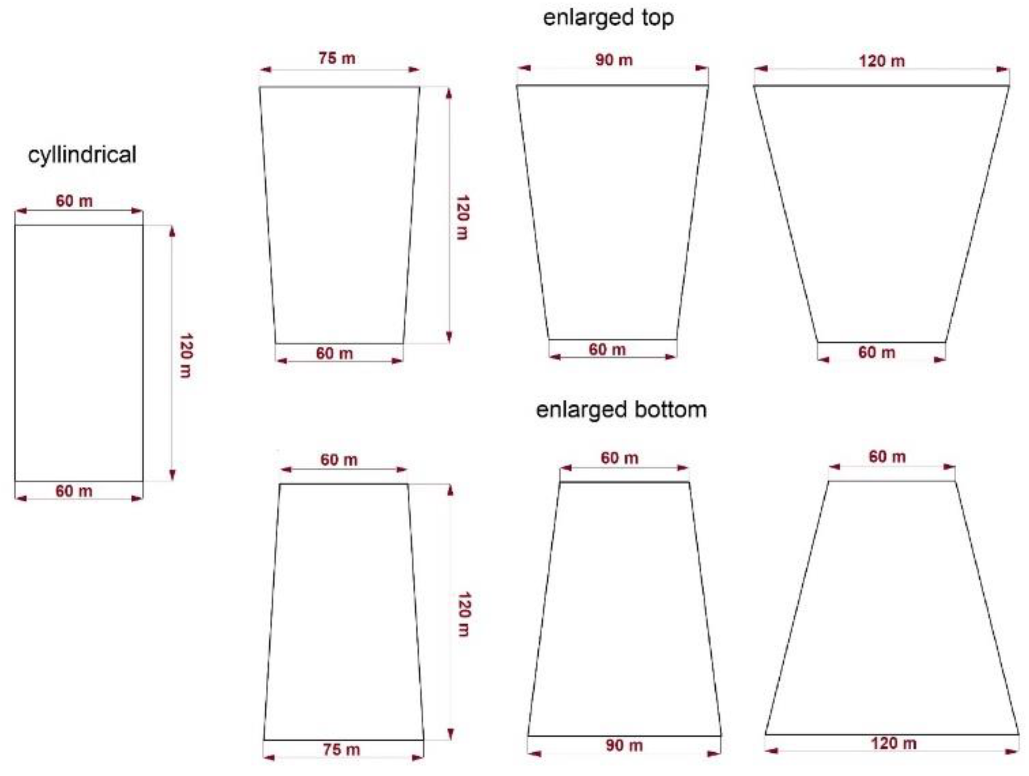
| Shape | Initial Maximum Diameter Dmax (m) | Initial Minimum Diameter Dmin (m) | Height H (m) | Initial H/Dmax Ratio | “Smoothing” Radius (m) | Cavern Volume (m3) |
|---|---|---|---|---|---|---|
| Cylindrical | 60 | 60 | 120 | 2/1 | 0 | 338,324 |
| 10 | 330,199 | |||||
| 20 | 309,994 | |||||
| 30 | 281,517 | |||||
| Enlarged top/bottom | 75 | 60 | 120 | 8/5 | 0 | 430,444 |
| 10 | 420,915 | |||||
| 20 | 397,020 | |||||
| 30 | 362,430 | |||||
| Enlarged top/bottom | 90 | 60 | 120 | 4/3 | 0 | 536,427 |
| 10 | 525,090 | |||||
| 20 | 496,673 | |||||
| 30 | 454,459 | |||||
| Enlarged top/bottom | 120 | 60 | 120 | 1/1 | 0 | 790,878 |
| 10 | 774,674 | |||||
| 20 | 732,414 | |||||
| 30 | 669,064 |
| Parameters | Anhydrite | Rock Salt |
|---|---|---|
| Bulk density (kg/m3) | 24 | 24 |
| Young’s modulus (MPa) | 12,000 | 5000 |
| Poisson’s ratio (-) | 0.20 | 0.45 |
| Cohesion (kPa) | 4000 | 10,990 |
| Internal friction angle (°) | 35 | 36.4 |
| Tensile strength (kPa) | 1000 | 2000 |
Publisher’s Note: MDPI stays neutral with regard to jurisdictional claims in published maps and institutional affiliations. |
© 2021 by the authors. Licensee MDPI, Basel, Switzerland. This article is an open access article distributed under the terms and conditions of the Creative Commons Attribution (CC BY) license (http://creativecommons.org/licenses/by/4.0/).
Share and Cite
Cyran, K.; Kowalski, M. Shape Modelling and Volume Optimisation of Salt Caverns for Energy Storage. Appl. Sci. 2021, 11, 423. https://doi.org/10.3390/app11010423
Cyran K, Kowalski M. Shape Modelling and Volume Optimisation of Salt Caverns for Energy Storage. Applied Sciences. 2021; 11(1):423. https://doi.org/10.3390/app11010423
Chicago/Turabian StyleCyran, Katarzyna, and Michal Kowalski. 2021. "Shape Modelling and Volume Optimisation of Salt Caverns for Energy Storage" Applied Sciences 11, no. 1: 423. https://doi.org/10.3390/app11010423