Abstract
Plant protein concentrates are used to enhance the nutritional quality of bread and to respond to the demand of consumers with respect to increased protein intake. In the present study, bread samples were produced using pea protein concentrate (PP) and soy protein concentrate (SP) substituting wheat flour by 5%, 10%, and 15%. The protein levels were between 1.2- and 1.7-fold (PP) and 1.1- and 1.3-fold (SP) higher than the control bread. The incorporation of 10% and 15% PP allowed for the achievement of a “high protein” claim. Water absorption was correlated with the protein contents of the breads (r = 0.9441). The decrease in bread volume was higher for the PP than SP incorporations, and it was highly negatively correlated with the protein content (r = −0.9356). Soy breads had a softer crumb than pea breads. The total change in crumb colour was higher in the PP than SP breads. The soy breads had an overall acceptability between 6.3 and 6.8, which did not differ (p > 0.05) from the control. PP breads were statistically less liked (p < 0.05). The results underlined that the choice of the type and amount of protein concentrates influenced the bread properties differently.
1. Introduction
Nowadays, people are more aware of what they consume and they want nutritionally improved products like bread with a high protein content, which can provide nitrogen and amino acids to the body. On the other hand, there is a general global trend towards reducing the use of animal proteins and increasing the consumption of plant proteins for protecting the environment and for reducing gas emissions. Bread is considered an important food in several countries, as part of the daily diet. The forecasted bread consumption volume in Europe is estimated to reach 18,797 million kg by 2021 [1].
The use of wheat flour in baking manufacturing has some limitations from a nutritional point of view. Replacement of wheat flour by different ingredients in bakery products brings not only health effects, but also changes the dough rheology and technological features [2].
Different types of protein ingredients were used for wheat flour supplementation like legumes flours, concentrates, or isolates from pea, chickpea, faba bean, and soy protein [3]. The manufacture of bread with high levels of incorporated legume proteins is very difficult from a technological aspect, because of the lack of gluten network needed to meet the viscoelastic, fermentative, and structure-forming requirements [4]. This is why it is more convenient to use for supplementation ingredients with a high content in proteins (80–90%) for processing, which can be added in a small amount, rather than using legume flours with a lower protein content, which should be added in sufficient quantity so as to obtain a final product with the same protein content.
Pea proteins are very popular in food matrices because of their lower content of anti-nutrients compared with soy protein, which contain phytates, tannins, or trypsin inhibitors [5]. The health benefits of peas are represented by the level of protein, starch, fibre, vitamins, minerals, and phytochemical components. It has been demonstrated that pea ingredients can influence the glycaemic response, insulin resistance, and cardiovascular and gastrointestinal health [6]. Research has been done for producing bread with a 10% protein content through the replacement of wheat flour with 30% raw, germinated, and toasted pea flour [7]. In addition, in bread formulations, pea protein isolate has been used to substitute 15% of the wheat flour, and the effect on the dough properties and bread quality have been analysed [8].
Ribotta et al. [9] showed that different types of soy products used in bread manufacturing prevented the formation of the gluten, and reduced dough strength and gas retention ability of the dough. The addition of soy protein to 30% impacted the dough rheology and the quality of the end products—the specific bread volume decreased and the hardness increased [10]. On the other hand, Ivanovski et al. [11] proved that soy flour at a 20% substitution level to wheat flour used as a protein supplement in bread manufacturing did not negatively affect the flavour and texture properties.
Studies on the supplementation of bread with 5% pea protein isolate showed little adverse effects on the bread volume and physical attributes of the crumb, and had a good overall sensory acceptance. Higher amounts of soy protein concentrate and pea isolate in spelt flour (20% and 10%, respectively) determined the decrease in the loaf volume [12].
The aim of this study was to obtain and analyse the quality of high-protein breads with the addition of plant-based proteins, which can be a “source” of protein or can be claimed to be “rich” in proteins, based on EFSA (European Food Safety Authority) recommendations.
2. Materials and Methods
2.1. Materials
The following protein concentrate powders were employed in the experiment: pea protein concentrate (PP; Paradisul Verde, Romania) and soy protein concentrate (SP; Solaris, Romania). For bread formulations, white wheat flour, yeast, and salt were commercially available.
2.2. Analysis of the Raw Materials and Breads
The raw materials and bread samples were analysed for the following characteristics: moisture using the drying method (AOAC 925.10), protein content using the Kjeldahl method with a conversion factor of nitrogen to protein of 6.25 (AOAC 979.09), fat content using Soxhlet extraction with petroleum ether (AOAC 963.15), and ash using the gravimetric method by burning at 550 °C in a furnace (AOAC 923.03) [13]. The total carbohydrate contents were assessed by subtracting the values of the moisture, protein, fat, and ash content from 100. The caloric values were calculated using the following conversion factors: nine for fat, four for carbohydrates, and four for protein [14].
2.3. Bread Dough Mixolab Analysis
The rheological properties of wheat flour and wheat flour–protein concentrate powder blends were studied using a Mixolab analyser (Chopin Technologies, Villeneuve-la-Garenne, France) [15]. For both types of protein concentrates, the following percentages were used: 5%, 10%, and 15% of the wheat flour. The samples were loaded into the Mixolab bowl and mixed with distilled water to produce 75 g dough, and the target consistency (torque) was 1.1 ± 0.05 Nm. The dough was subjected to dual-mixing (80 rpm) during a heating and cooling programme following the “Chopin+” protocol, namely: 8 min mixing at 30 °C, 4 °C/min heating to 90 °C, 7 min holding at 90 °C, 4 °C/min cooling to 50 °C, and 5 min holding at 50 °C. The Mixolab software (version 4.0.8) was used to record the curves and calculate the dough mixing parameters. The samples were analysed at adapted hydration (i.e., the initial torque C1 was kept constant at 1.1 Nm). The parameters from the Mixolab curves refer to the following: dough development time, the time needed to attain a torque of 1.1 Nm (min); stability, the dough mixing resistance (min); C2, the torque associated with protein weakening (Nm); C3, the degree of the gelatinisation of the starch (Nm); C4, the stability of the starch gel formed (Nm); and C5, the retrogradation of the starch (Nm) [16]. The analysis was performed in triplicate.
2.4. Bread Preparation
The bread samples’ formulation was based on wheat flour, which was replaced by different concentrations of pea protein concentrate, namely 5%, 10%, and 15% (5PP, 10PP, and 15PP, respectively) and of soy protein concentrate, namely, 5%, 10%, and 15% (5SP, 10SP, and 15SP, respectively). A control sample (100% wheat flour) was also considered. The other ingredients (as % of wheat flour/wheat flour–protein concentrates blends) were as follows: fresh yeast (3.0%), salt (1.5%), and water. The amount of water used to form the dough was the amount calculated by the Mixolab measurements (Table 1). The ingredients were mixed in a Diosna mixer (Germany) for 3 min at a low speed and 3–5 min at a high speed. The dough was allowed to rest for 15 min and then divided into pieces of 575–580 g (in order to have a final end product of around 500 g), rounded and left to rest 10 min, and then moulded in the aluminium bread pans and proofed in a proofer at 35 °C and 49% humidity for 40 min (MCE Meccanica, Italy). The samples were baked in an oven (Mondial Forni, Italy) for 30 min at 230–235 °C. In the first 4 s, steam was used inside oven. The breads were cooled down for 2 h at room temperature and were stored in polypropylene bags for analysis.

Table 1.
Bread recipes.
2.5. Physical Parameters of Fresh Bread Samples
2.5.1. Bread Volume, Porosity, and Elasticity Analysis
For the bread volume, the rapeseed displacement method was employed using the Fornet bread volumeter (Chopin, France) [17]. The bread porosity was determined with the help of a cylindrical sharpened brass perforator (internal diameter of 45 mm) from a 60 mm slice obtained from the middle of the loaf and then weighed [18]. For bread elasticity, the crumb cut for the porosity analysis was pressed to half of its height for 1 min using a screw-driven pressing device and, then, after removing the pressure, the height of the compressed piece of crumb was measured. The ratio between the height after compression and recovery, as well as the initial height, represented the elasticity (expressed as a percentage) [19]. All of the above parameters were the average of three determinations.
2.5.2. Bread Crumb Colour Analysis
The colour parameters of the bread crumb samples were analysed using a CM-5 spectrophotometer (Konica Minolta Sensing, Inc., Osaka, Japan) equipped with a D65 illuminant and a 10° observer angle. The colour was determined on 10 different points from a slice of 20 mm thickness, taken from the middle of the loaf. The colour parameters were as follows: lightness (L* = 0 is black and L* = 100 is white), a* (-a = green and +a = red), and b* (-b = blue and +b = yellow). Using the colour coordinates, the following parameters were calculated: chroma (C* = ) and hue angle (h = arctan(b*/a*)). The total colour difference (ΔE) between the control bread and the different protein formulations was determined as follows: , where subscripts C and P refer to the control bread and to the different bread formulations with protein concentrates, respectively.
2.5.3. Bread Crumb Texture Analysis
The texture properties of the bread samples were calculated based on a compression profile with the help of the Instron Texture Analyzer (model 5944, Illinois Tool Works Inc., USA) equipped with a cylinder probe with a 12 mm diameter and a load cell of 50 kg·m·s−2. The slice of bread (20 mm) was compressed to up to 40% of its height at a speed rate of 1.667 mm/s, and the following parameters were measured: hardness, cohesiveness, elasticity, and chewiness [20]. The average values for three determinations were included.
2.6. Headspace-Electronic Nose
The global volatile composition of the bread samples was analysed using an electronic nose system (FOX 4000, Alpha M.O.S., France), according to a previous study [21]. Briefly, 2 g of bread crumb was put into vials that were incubated (35 °C, 600 s) in order to generate a volatile headspace; then, the bread headspace was injected into the measuring chamber of the electronic nose. Three replications were performed for each type of bread and a statistical analysis was applied to the recorded signals.
2.7. Sensory Analysis
Twelve trained panellists (nine females and three males, with an average age of 24-62 years old) analysed the bread samples through the quantitative descriptive test, focused on attribute scoring from a low intensity (1) to high intensity (5). The sensory attributes included the following: appearance of the crust and crumb colour, lighter–darker; bitter flavour, no bitter flavour–very intense bitter flavour; astringent flavour, no astringent flavour–very intense astringent flavour; crumb firmness at the first bite, soft–rough; crumb gumminess at first bite, less gummy–very gummy; and mass adherence during chewing, no adherence–high adherence.
For the bread overall acceptability, a nine-point hedonic scale (from 9 = like extremely to 1 = dislike extremely) was used [22]. Another method employed to evaluate the bread acceptability was the bread note, which was performed according to the patent RO 130586 A2 [23]. Accordingly, a maximum score was set for each of the following parameters: volume (24), outer appearance (7), crust colour (7), crumb colour (10), crumb porosity (20), crumb texture (20), and flavour (12), taking into consideration a standard volume of 400 cm3/100 g bread and a standard porosity of 85%.
2.8. Statistical Analysis
A data analysis was carried out using ANOVA (one-way analysis of variance) with Tukey’s test (Minitab®19, Minitab Ltd., Coventry, UK). Significant differences among the samples were considered at p < 0.05. Values were expressed as mean ± standard deviation.
3. Results and Discussion
3.1. Effect of Protein Concentrates on Bread Compositional Analysis
The wheat flour used in this study had the following characteristics: 13.28% moisture, 10.9% protein, 1.33% fat, 0.48% ash, and 64.74% starch. The protein, fat, ash, and moisture in PP and SP were 77.96%, 0.29%, 3.77%, and 7.43%, and 39.21%, 10.01%, 5.66%, and 8.84%, respectively.
The bread compositional analysis was performed in order to evaluate the changes in the macronutrient composition determined by the partial substitution of wheat flour with protein concentrate such as pea and soy (Table 2). The protein and carbohydrates content constitute the main differences in the compositional profile, because of the substitution of wheat flour (which has a high starch content of 74.65% dry matter (d.m.)) by protein concentrates with protein contents of 84.22% d.m. for PP and 43.01% d.m. for SP. In addition to these parameters, for SP bread, the fat content brought significant differences (p < 0.05) in the bread samples, because of the higher fat content in SP (10.98% d.m.) compared with PP (0.31% d.m.).

Table 2.
Compositional analysis of the control and protein concentrate breads (expressed in % of the fresh bread).
In general, the calculated caloric value of the supplemented breads had a lower value (p < 0.05) than the control bread, with the exception of the 10SP and 15SP breads, where a small increase of 0.85% and 0.95%, respectively, was noted. Comparing the percentage of calories provided by the protein, the formulations for 10PP and 15PP reached values higher than 20, and the nutritional claim of being “high protein” can be applied according to regulation (EC) no. 1924/2006 [14].
3.2. Dough Mixing Properties
The influence of the protein concentrate additions on the dough mixing properties is summarized in Table 3.

Table 3.
Mixolab rheological parameters of wheat flour and wheat flour–protein concentrate blends.
Water absorption increased as the level of protein concentrates increased. PP significantly increased (p < 0.05) dough water absorption by almost 3.5% (5PP), 9.9% (10PP), and 19.8% (15PP), while in the case of SP, the maximum increase was by 3.2% (15SP).
Proteins are one of the main components involved in water adsorption, and the type of protein is responsible for the increase in water absorption [24]. Taherian et al. [25] showed that the supplementation of wheat flour with 10% pea protein isolate (with a protein content of 96.1% dry matter basis) determined an increase in water absorption, a fact that was explained through the capacity of proteins to absorb a high quantity of water. In the present study, a high correlation between water absorption and the protein contents of the breads was found (r = 0.9441). The dough development time of the SP breads were significantly higher than the control bread (p < 0.05). In addition, the stability time was significantly increased (p < 0.05) by SP addition compared with the control, which denotes a stronger dough structure. However, there was no concentration-dependent tendency in the stability time, as there were no significant differences (p > 0.05) between the three levels of SP addition. The same trend was observed for the 5PP and 10PP samples.
On the other hand, the 15% PP addition had the effect of decreasing the dough stability compared with lower levels of addition (5% and 10%), but it did not significantly differ (p > 0.05) from the control. A similar behaviour with an increase in the dough stability through the addition of soy protein was reported by Zhou et al. [10], while in contrast, the incorporation of whey protein brought a decrease in the dough stability time.
The addition of 5% PP and 5% SP showed higher values for the C2 parameter, which denotes a dough with strong mixing resistance, while higher addition levels lead to a reduced strength in the protein network. The highest weakening of the gluten network was found for the samples 15PP, 10SP, and 15SP. The results are similar to Hoehnel et al. [8], who pointed out that a weakened gluten network was obtained when 15% wheat flour was substituted with pea and potato protein. It was also proven that the gluten network was loosened as a consequence of the interference effect of the soy proteins, and the lesser availability of water in the build-up of the gluten network [26].
The stability of the starch gel (C4) for 5PP and 5SP was similar to that of the control, while at higher concentrations it was significantly decreased, being more prominent in the case of pea protein blends.
The addition of both types of protein concentrates in wheat dough contributed to a decrease in C3 and C5 parameters, which correspond to a lower degree of starch gelatinization and starch retrogradation, respectively, towards the control, which is accounted by the higher protein content provided by the addition of protein concentrates, subsequently decreasing the starch content. Hadnađev et al. [27] attributed a lower starch retrogradation to a higher protein and fat content and lipid–amylose complex forming capacity. The parameters C3 and C5 were highly positively correlated (r = 0.9418).
3.3. Physical Characteristics of Bread Samples
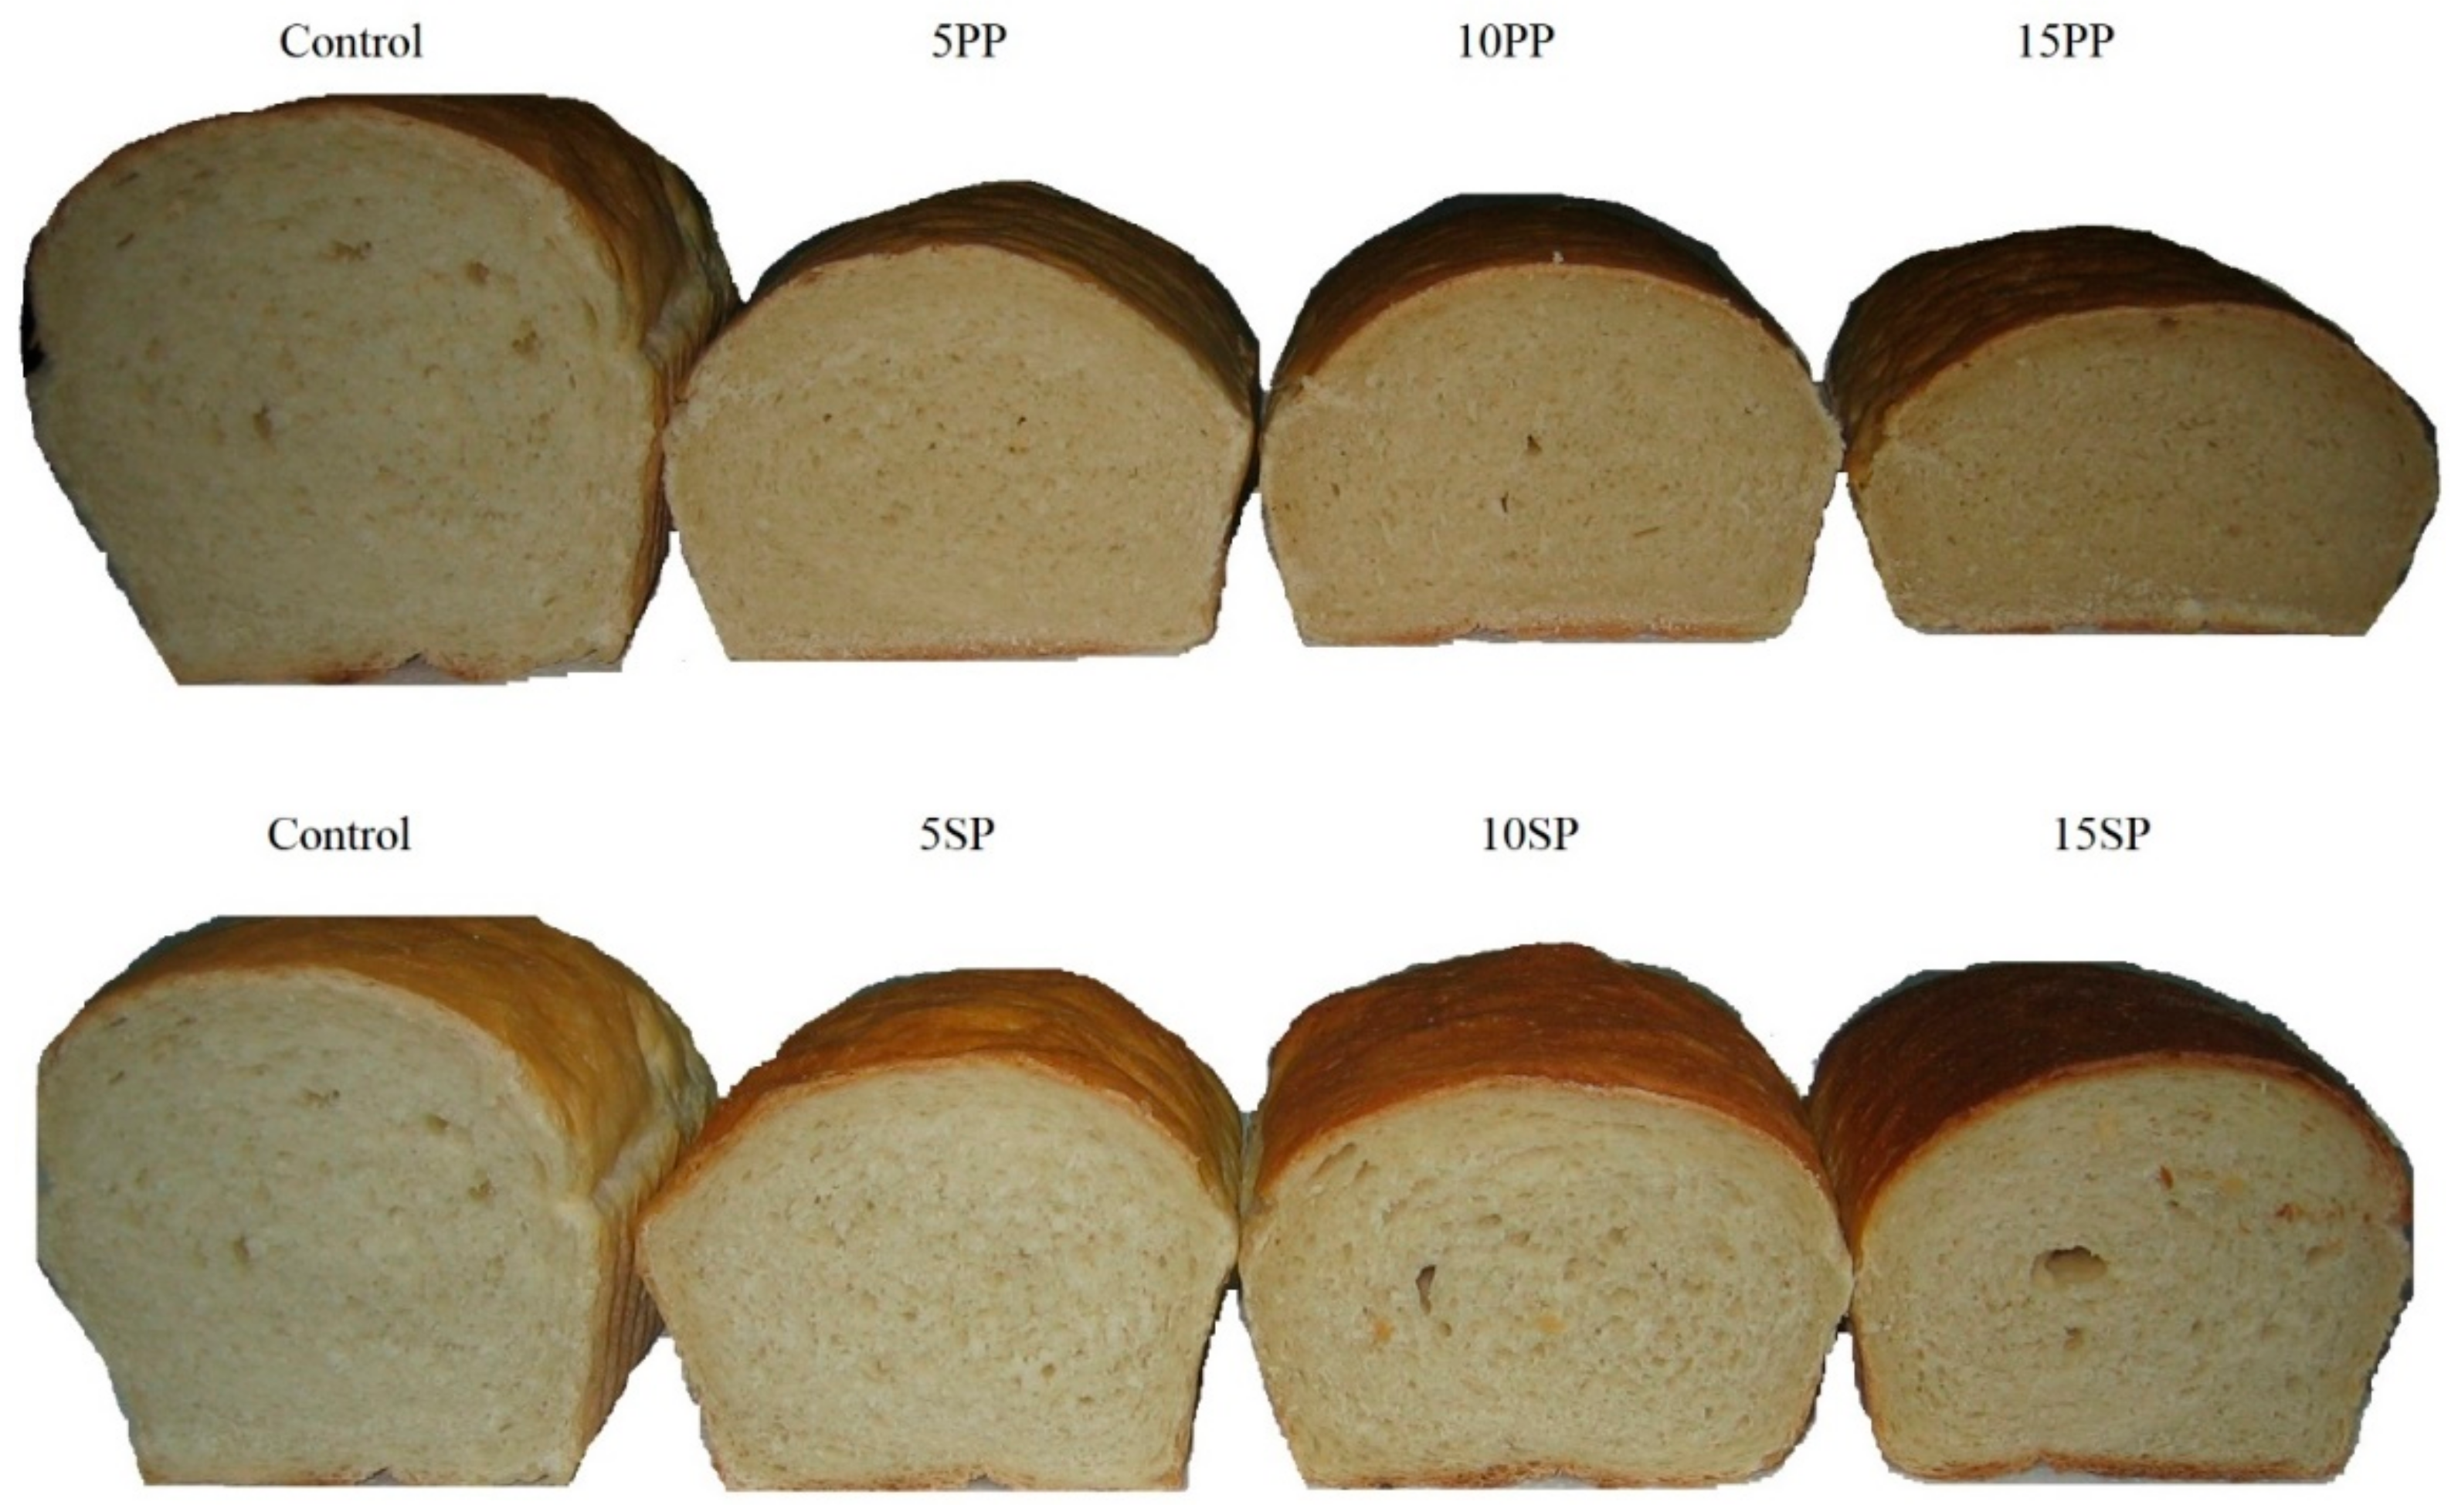
Figure 1 shows the bread obtained with different levels of protein concentrates in comparison with the control bread. The physical characteristics of the bread samples are presented in Table 4.
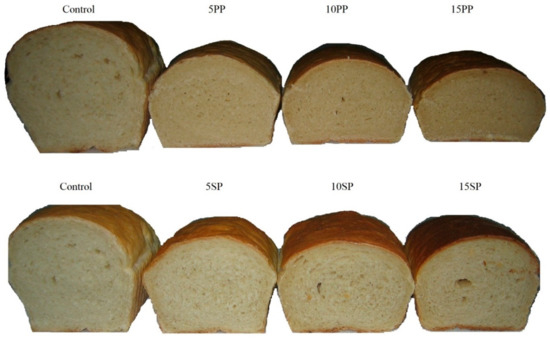
Figure 1.
Comparation between bread obtained with different additions of pea protein concentrate (5PP, 10PP, and 15PP) and soy protein concentrate (5SP, 10SP, and 15SP), respectively, with the control bread.

Table 4.
Physical parameters of the bread samples.
A significant decrease (p < 0.05) in bread volume, porosity and elasticity was noted with the addition of protein concentrates in the bread receipt; the decrease being more obvious in the case of PP than SP additions. The use of PP significantly decreased (p < 0.05) the bread volume in a concentration-dependent trend; the PP bread volume was between 1.5- and 2.1-fold lower towards the wheat bread control. In the case of the SP breads, the volume was between 1.2- and 1.3-fold lower than the control. However, no significant difference (p > 0.05) regarding bread volume between the 10SP and 15SP breads was observed. The physical and chemical interactions between gluten and the components from the protein concentrates contributed to the volume lowering. The bread volume was highly negatively correlated with the protein content (r = −0.9356). The results are in line with other studies reported previously on the impact of pea protein isolate [3] or soy protein [10] on bread volume.
The incorporation of protein concentrates decreased the crumb porosity by up to 47.3% (for 15PP bread) and 12.5% (for 15SP bread). There was a negative correlation between the crumb porosity and protein content (r = −0.9559). Another similar finding was observed in relation to the elasticity and protein content (r = −0.8782).
Measurements of the bread colour parameters showed that all supplemented breads were darker than the control bread. L* value (lightness parameter) significantly decreased (p < 0.05) with the inclusion of concentrates. The highest lightness was obtained for 5SP bread, whereas the lowest lightness was in the 15PP bread. For each of the three levels of substitution used, the PP breads were darker than the SP breads (p < 0.05). Protein supplemented breads showed significantly (p < 0.05) higher redness (a* parameter) and yellowness (b* parameter) values than the bread control. Both parameters significantly increased (p < 0.05) relative to the level of additions. Bread 15SP had the highest a* and b* values, showing a more reddish and yellowish crumb colour. Among the protein supplemented breads, sample 5SP had the smallest C* value, a lower chroma value indicating a less strong colour. The highest value for the hue angle (h°) for the control bread indicated yellowish tones. The hue angle was significantly reduced in the bread crumb of the supplemented breads (p < 0.05).
In order to establish the colour differences between the samples, ΔE was calculated. The total change in crumb colour was higher in the PP than SP breads. Only sample 5SP resulted in colour differences towards the control that were not noticeable to the human eye (ΔE < 3). It is stated that values for ΔE higher than 3 are visible to the human eye [28].
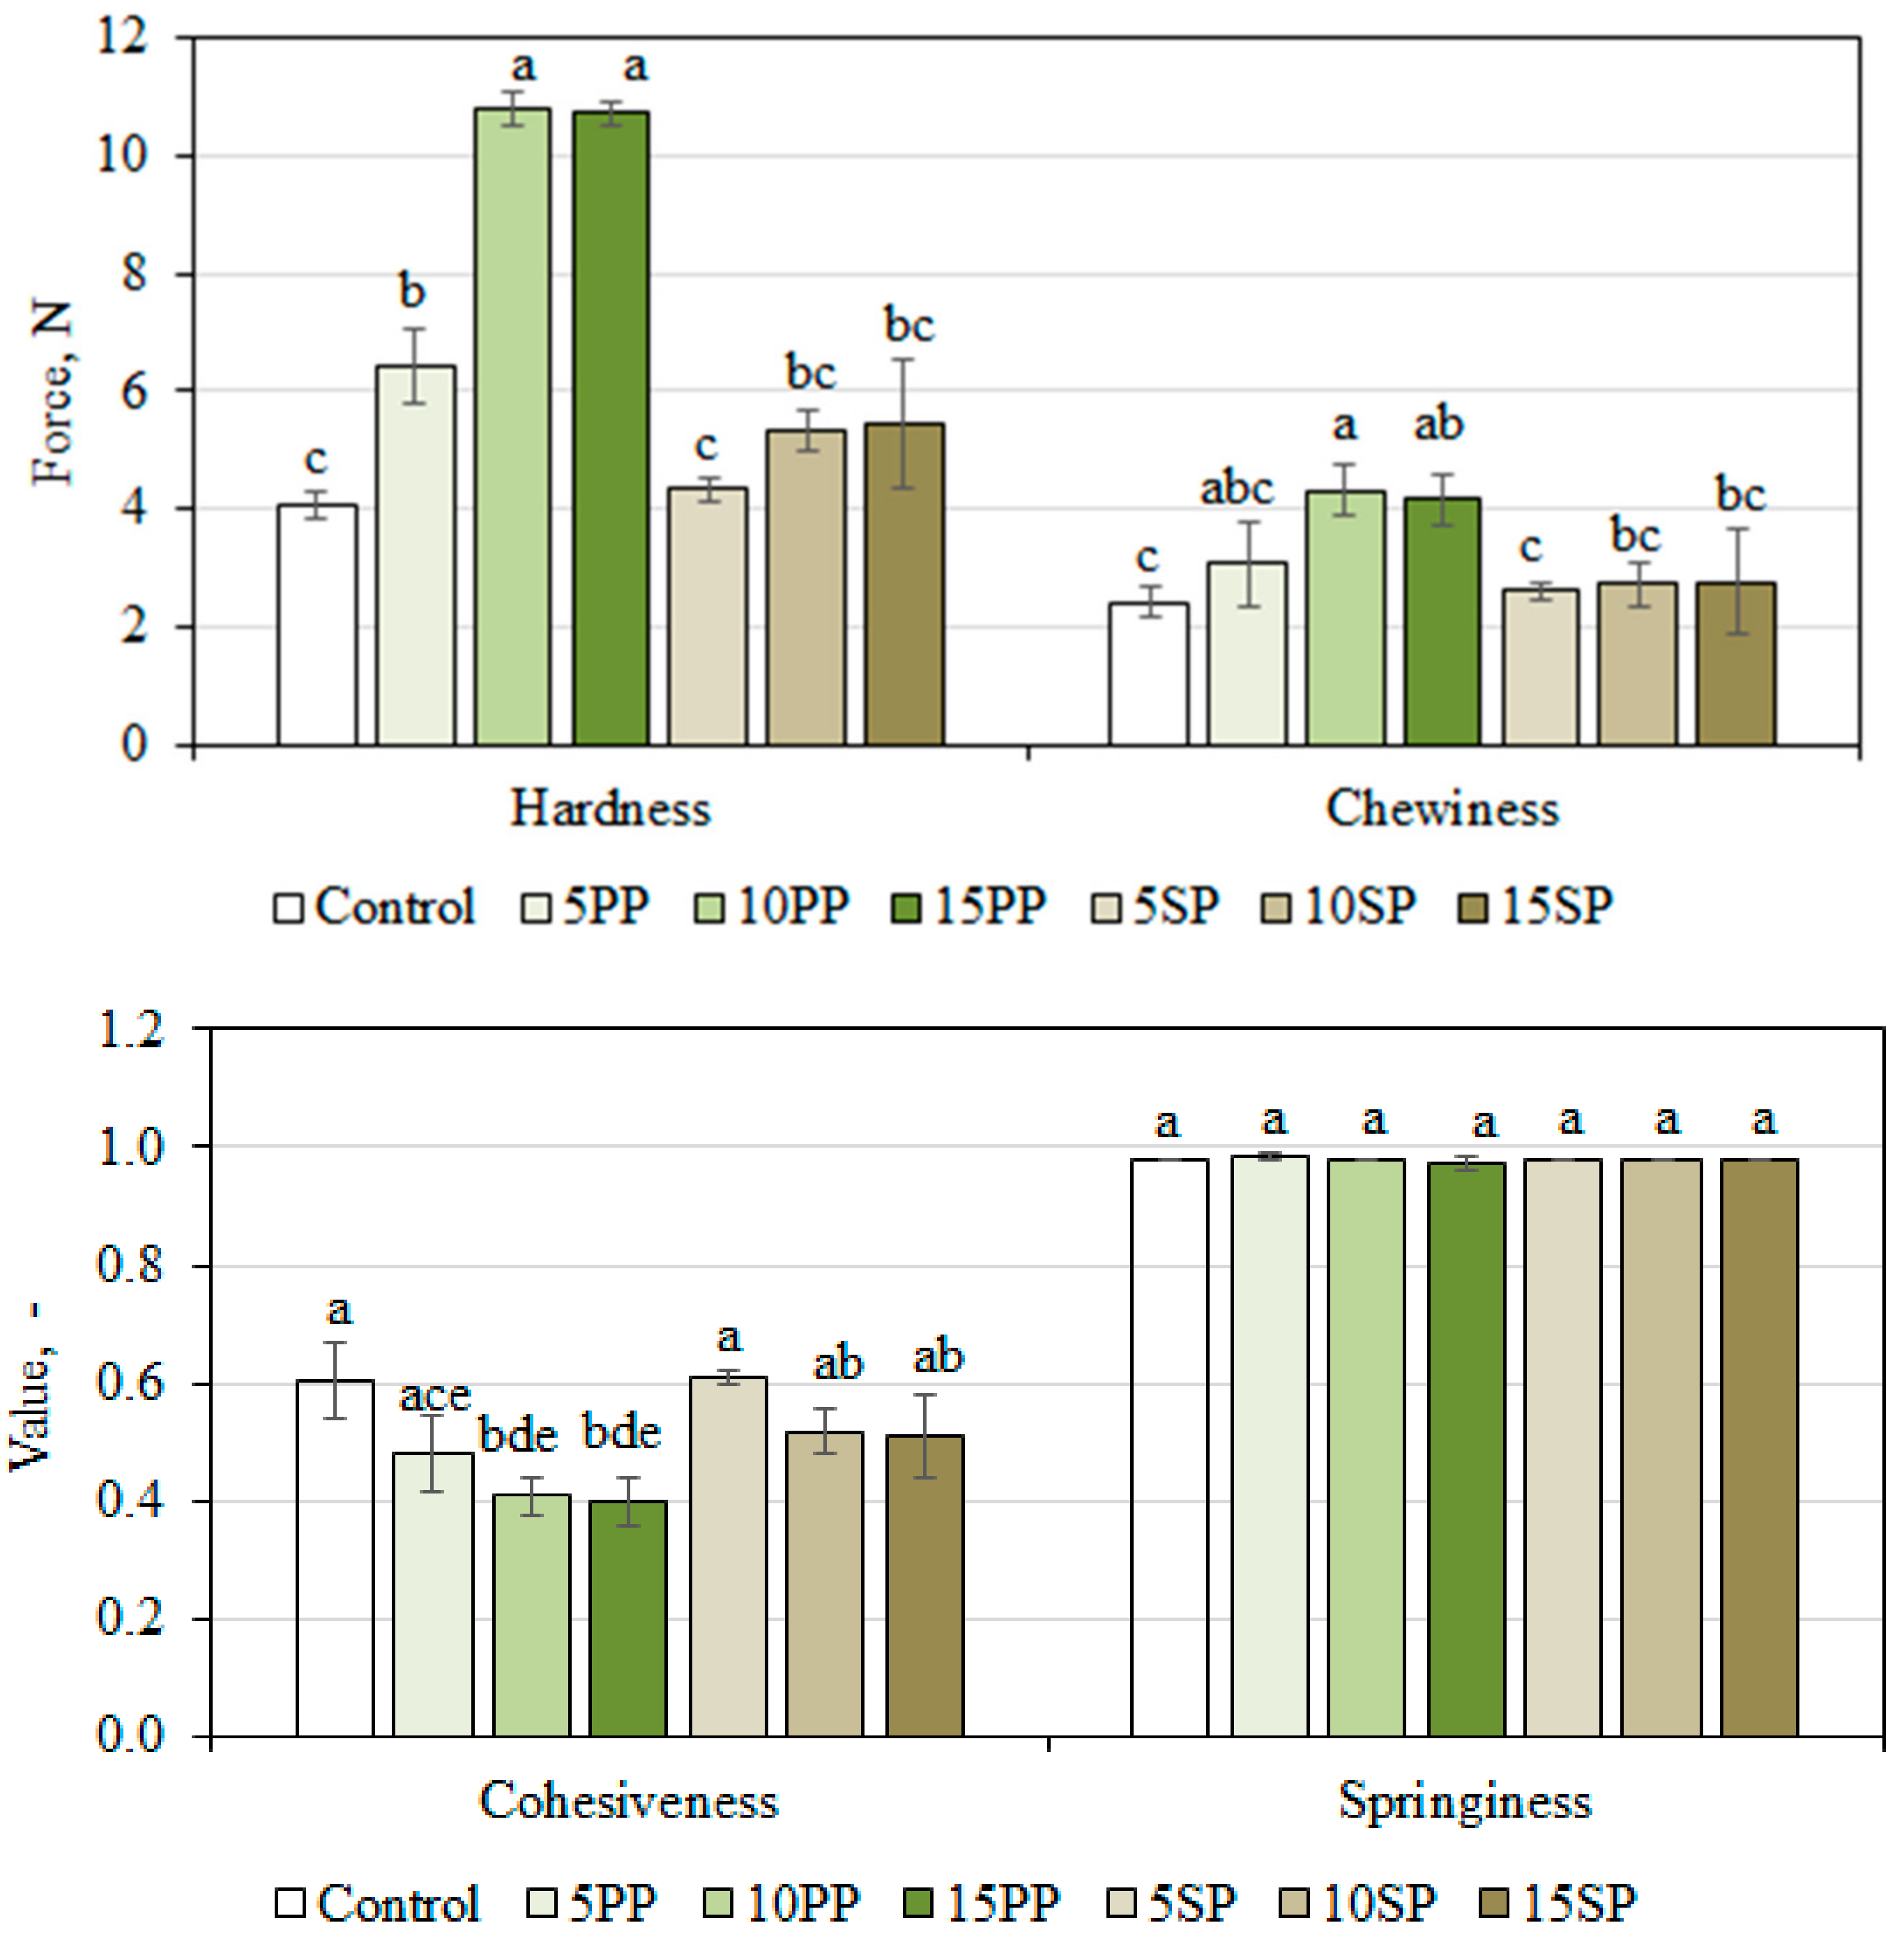
The texture properties of the bread crumbs are exhibited in Figure 2.
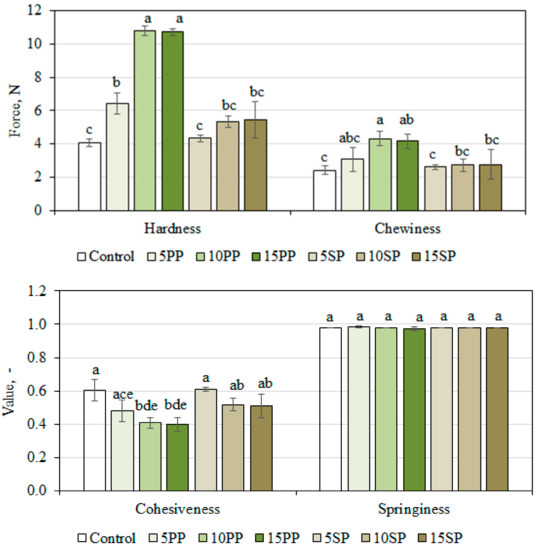
Figure 2.
Texture properties of the bread samples. The results are mean ± standard deviation (n = 3). The different letters show significance difference (p < 0.05).
Crumb hardness for the control and 5SP breads were significantly lower (p < 0.05) compared with the other formulations, which indicates an adequate quality of the bread made with a lower concentration of SP. Pea protein showed a stronger effect on bread hardness than soy protein; so, soy breads had a softer crumb. The results were in agreement with a previous study [29], where the addition of soy protein into gluten-free bread formulations resulted in the lowest bread volume compared with other protein sources such as carob, lupin, or pea. Bread prepared with PP at a high concentration (10% and 15%) showed the highest hardness, which was almost 2.6-fold higher than the control wheat bread. Similar results of an increase in bread hardness were shown by Garcia-Segovia et al. [30] when wheat flour was substituted with 5% and 10% pea protein, respectively. The crumb hardness was highly negatively correlated with bread volume (r = −0.9282). In addition, a correlation between the hardness and protein content was noted (r = 0.9223).
Regarding bread chewiness, the same trend was observed as for hardness. Bread chewiness increased slowly with SP addition, but the difference was not significant (p > 0.05) compared with control bread. The higher increase in chewiness for PP breads points out that a longer time is needed for chewing the samples before swallowing. However, no significant differences (p > 0.05) in chewiness between the 10PP and 15PP samples were noted.
The difference in crumb cohesiveness between the control, SP breads, and 5PP was not significant (p > 0.05). At a higher level of PP used in the bread formulations, the crumb was less cohesive (lower values of cohesiveness registered for the 10PP and 15PP breads). Regarding the springiness parameter, no significant difference (p > 0.05) between the control and protein-based breads were observed.
3.4. Discrimination of Bread Sample by Electronic Nose System
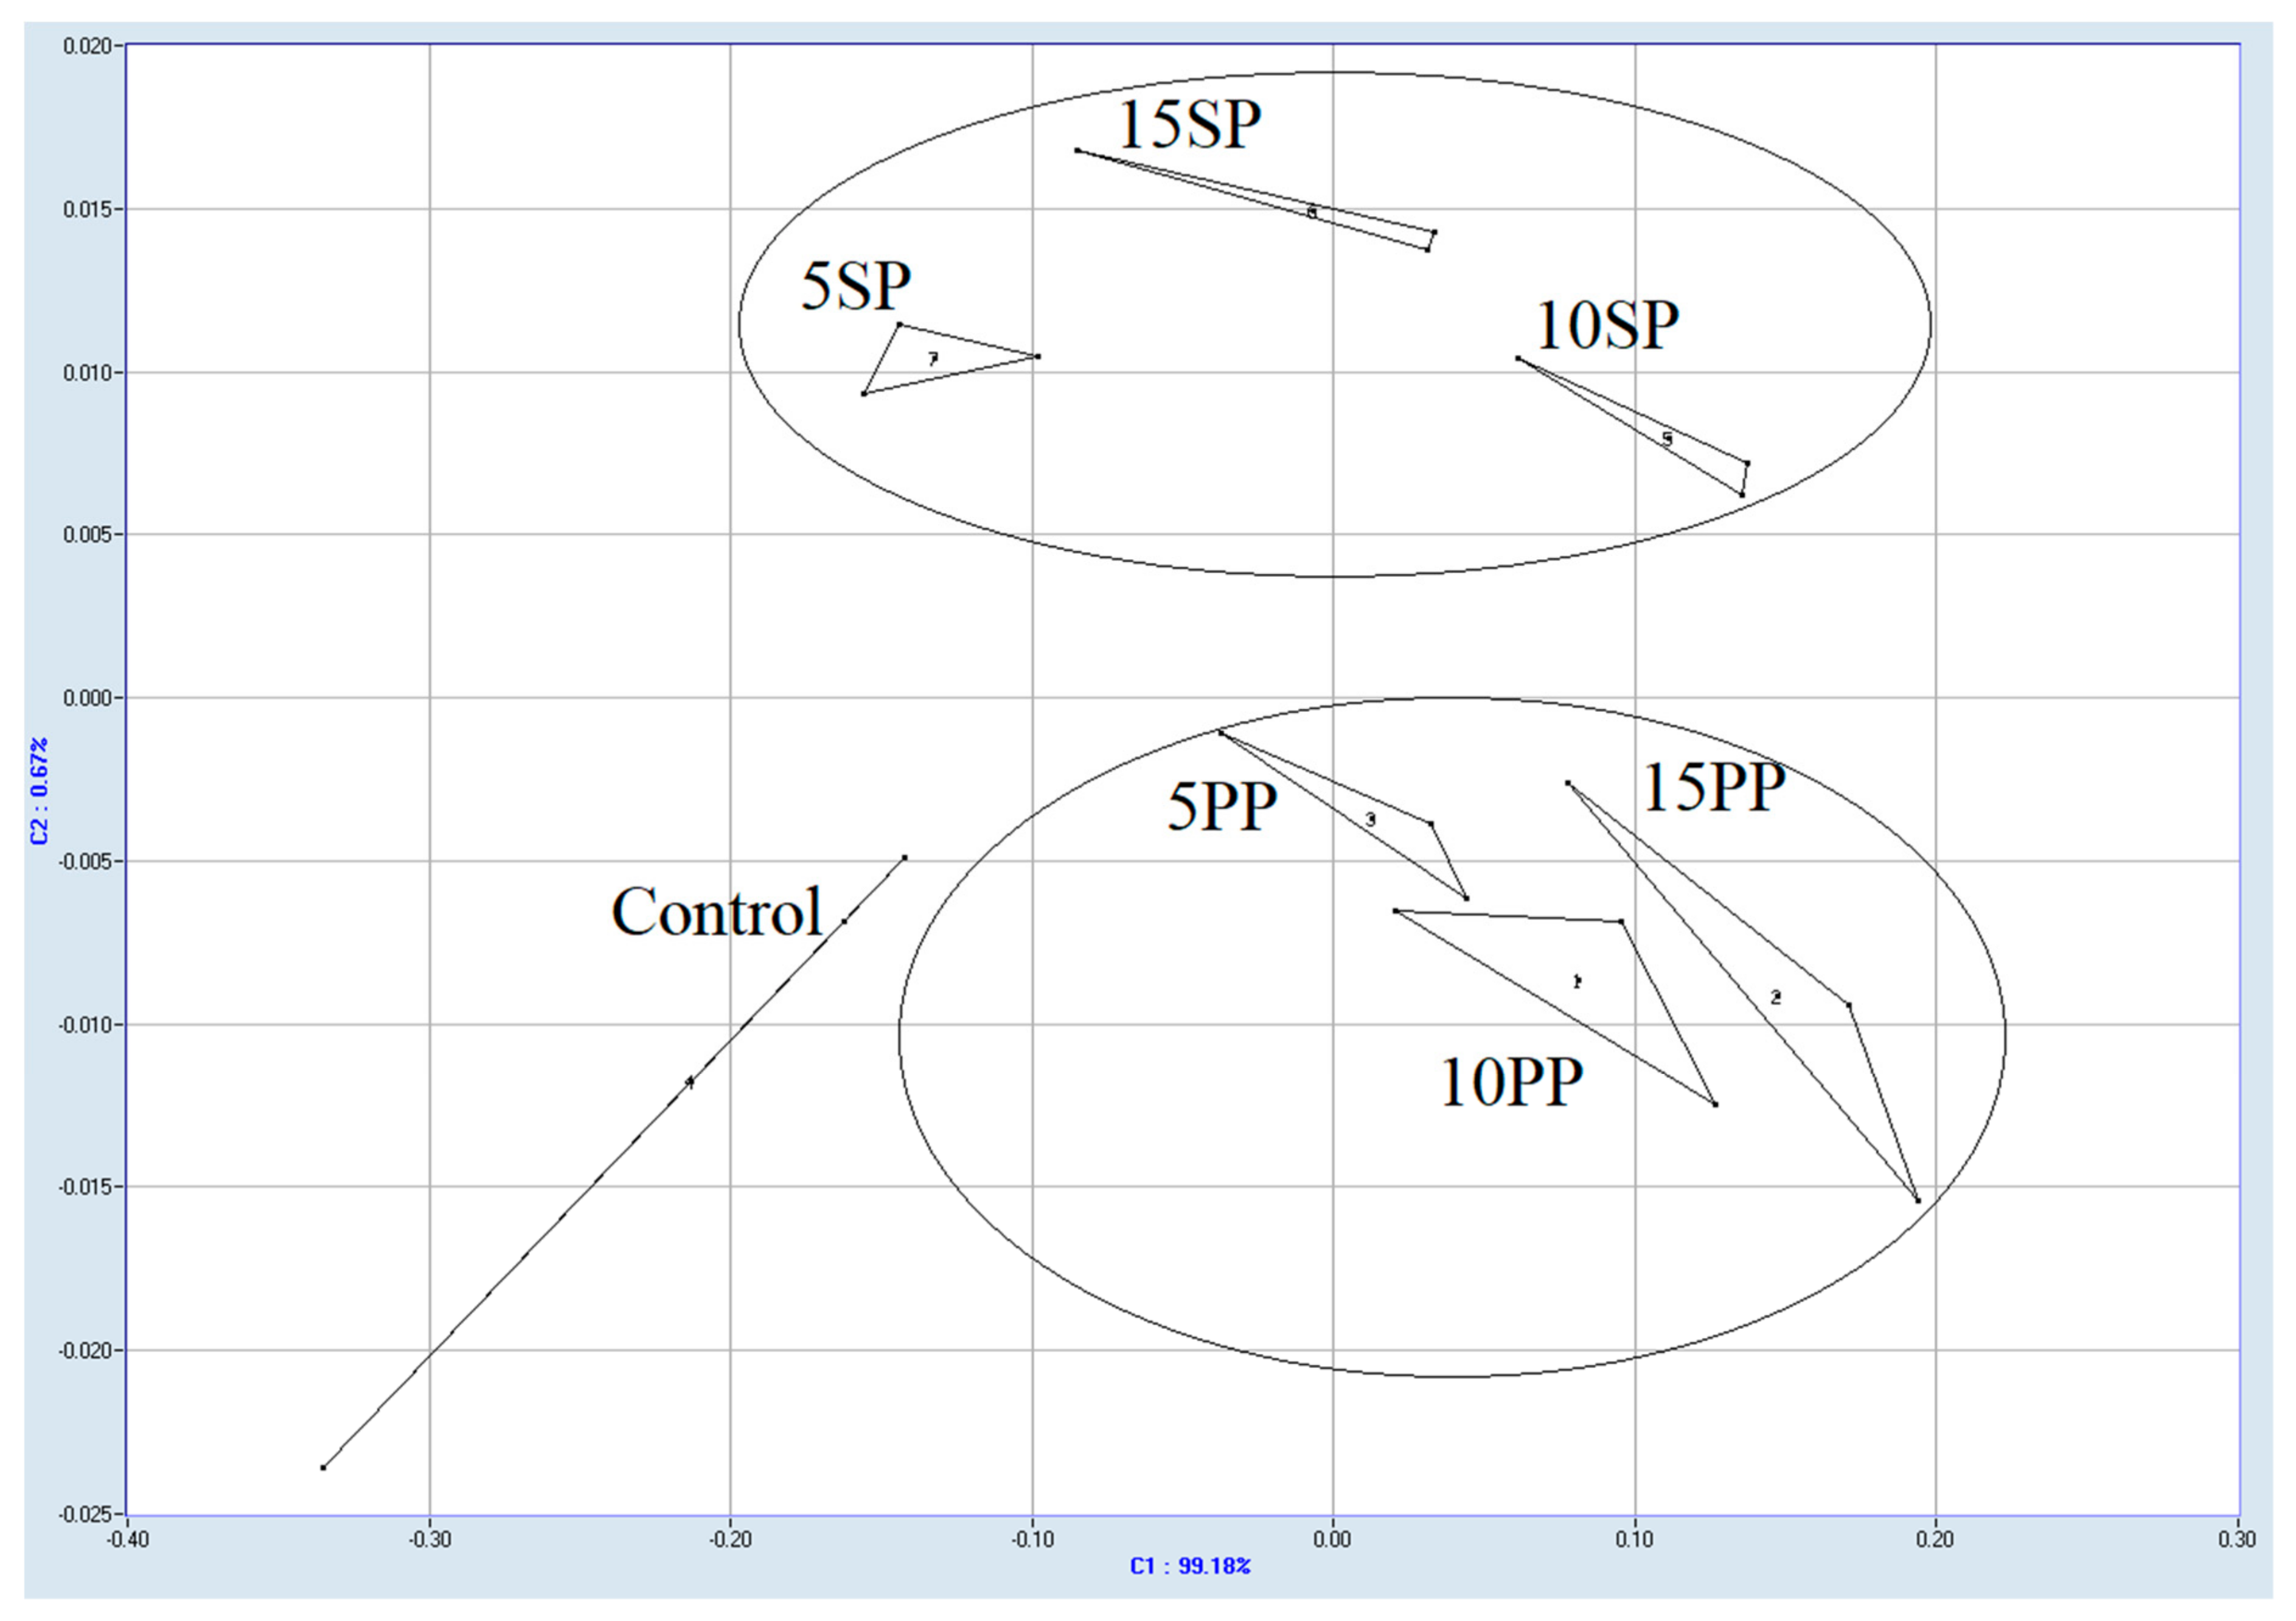
Principal component analysis (PCA) was employed to detect the differences in volatile composition between the bread samples based on the calculation of a discrimination index. Thus, the higher the discrimination index, the better the discrimination. Figure 3 depicts the PCA plot that represents a map of the discrimination of the bread samples. A discrimination index of 85 was obtained, which is explained by the very different odour of the samples. The contribution rates for the two principal components (PC1 and PC2) were 99.18% and 0.67%, respectively.
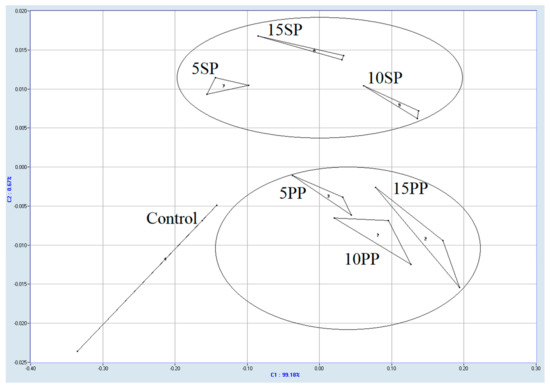
Figure 3.
Principal component analysis (PCA) plot for the bread samples: control, pea (5PP, 10PP, and 15 PP), and soy (5SP, 10 SP, and 15SP) breads.
Considering only the same level of addition and comparing this with the control, a good discrimination was obtained: 93 (between the control, 5PP, and 5SP breads), 91 (between the control, 10PP, and 10SP breads), and 91 (between the control, 15PP, and 15SP breads), respectively. In all of the cases, the control bread was significantly separated from the protein bread samples, positioned on the left side of the PCA map.
3.5. Sensory Analysis
The sensory attributes of the bread samples are included in Table 5. Higher levels of protein concentrate additions led to a stronger intensity in the colour of the crumb and crust. There was no statistically significant difference (p > 0.05) in the bitter and astringent flavours between the bread samples. Crumb firmness increased with protein concentrate addition and was positively correlated with the values of hardness provided by the texture analyser (r = 0.9493). As the addition of protein concentrates increased, mass adherence during chewing increased in comparison with the bread. However, this increase was not significantly different (p > 0.05) between the control and soy protein breads and 5PP. Only higher levels of PP (10% and 15%) addition brought about a significant increase in mass adherence. Hence, a good correlation between the protein content in the bread and mass adherence was found (r = 0.8544).

Table 5.
Sensory profile of bread samples using a descriptive method.
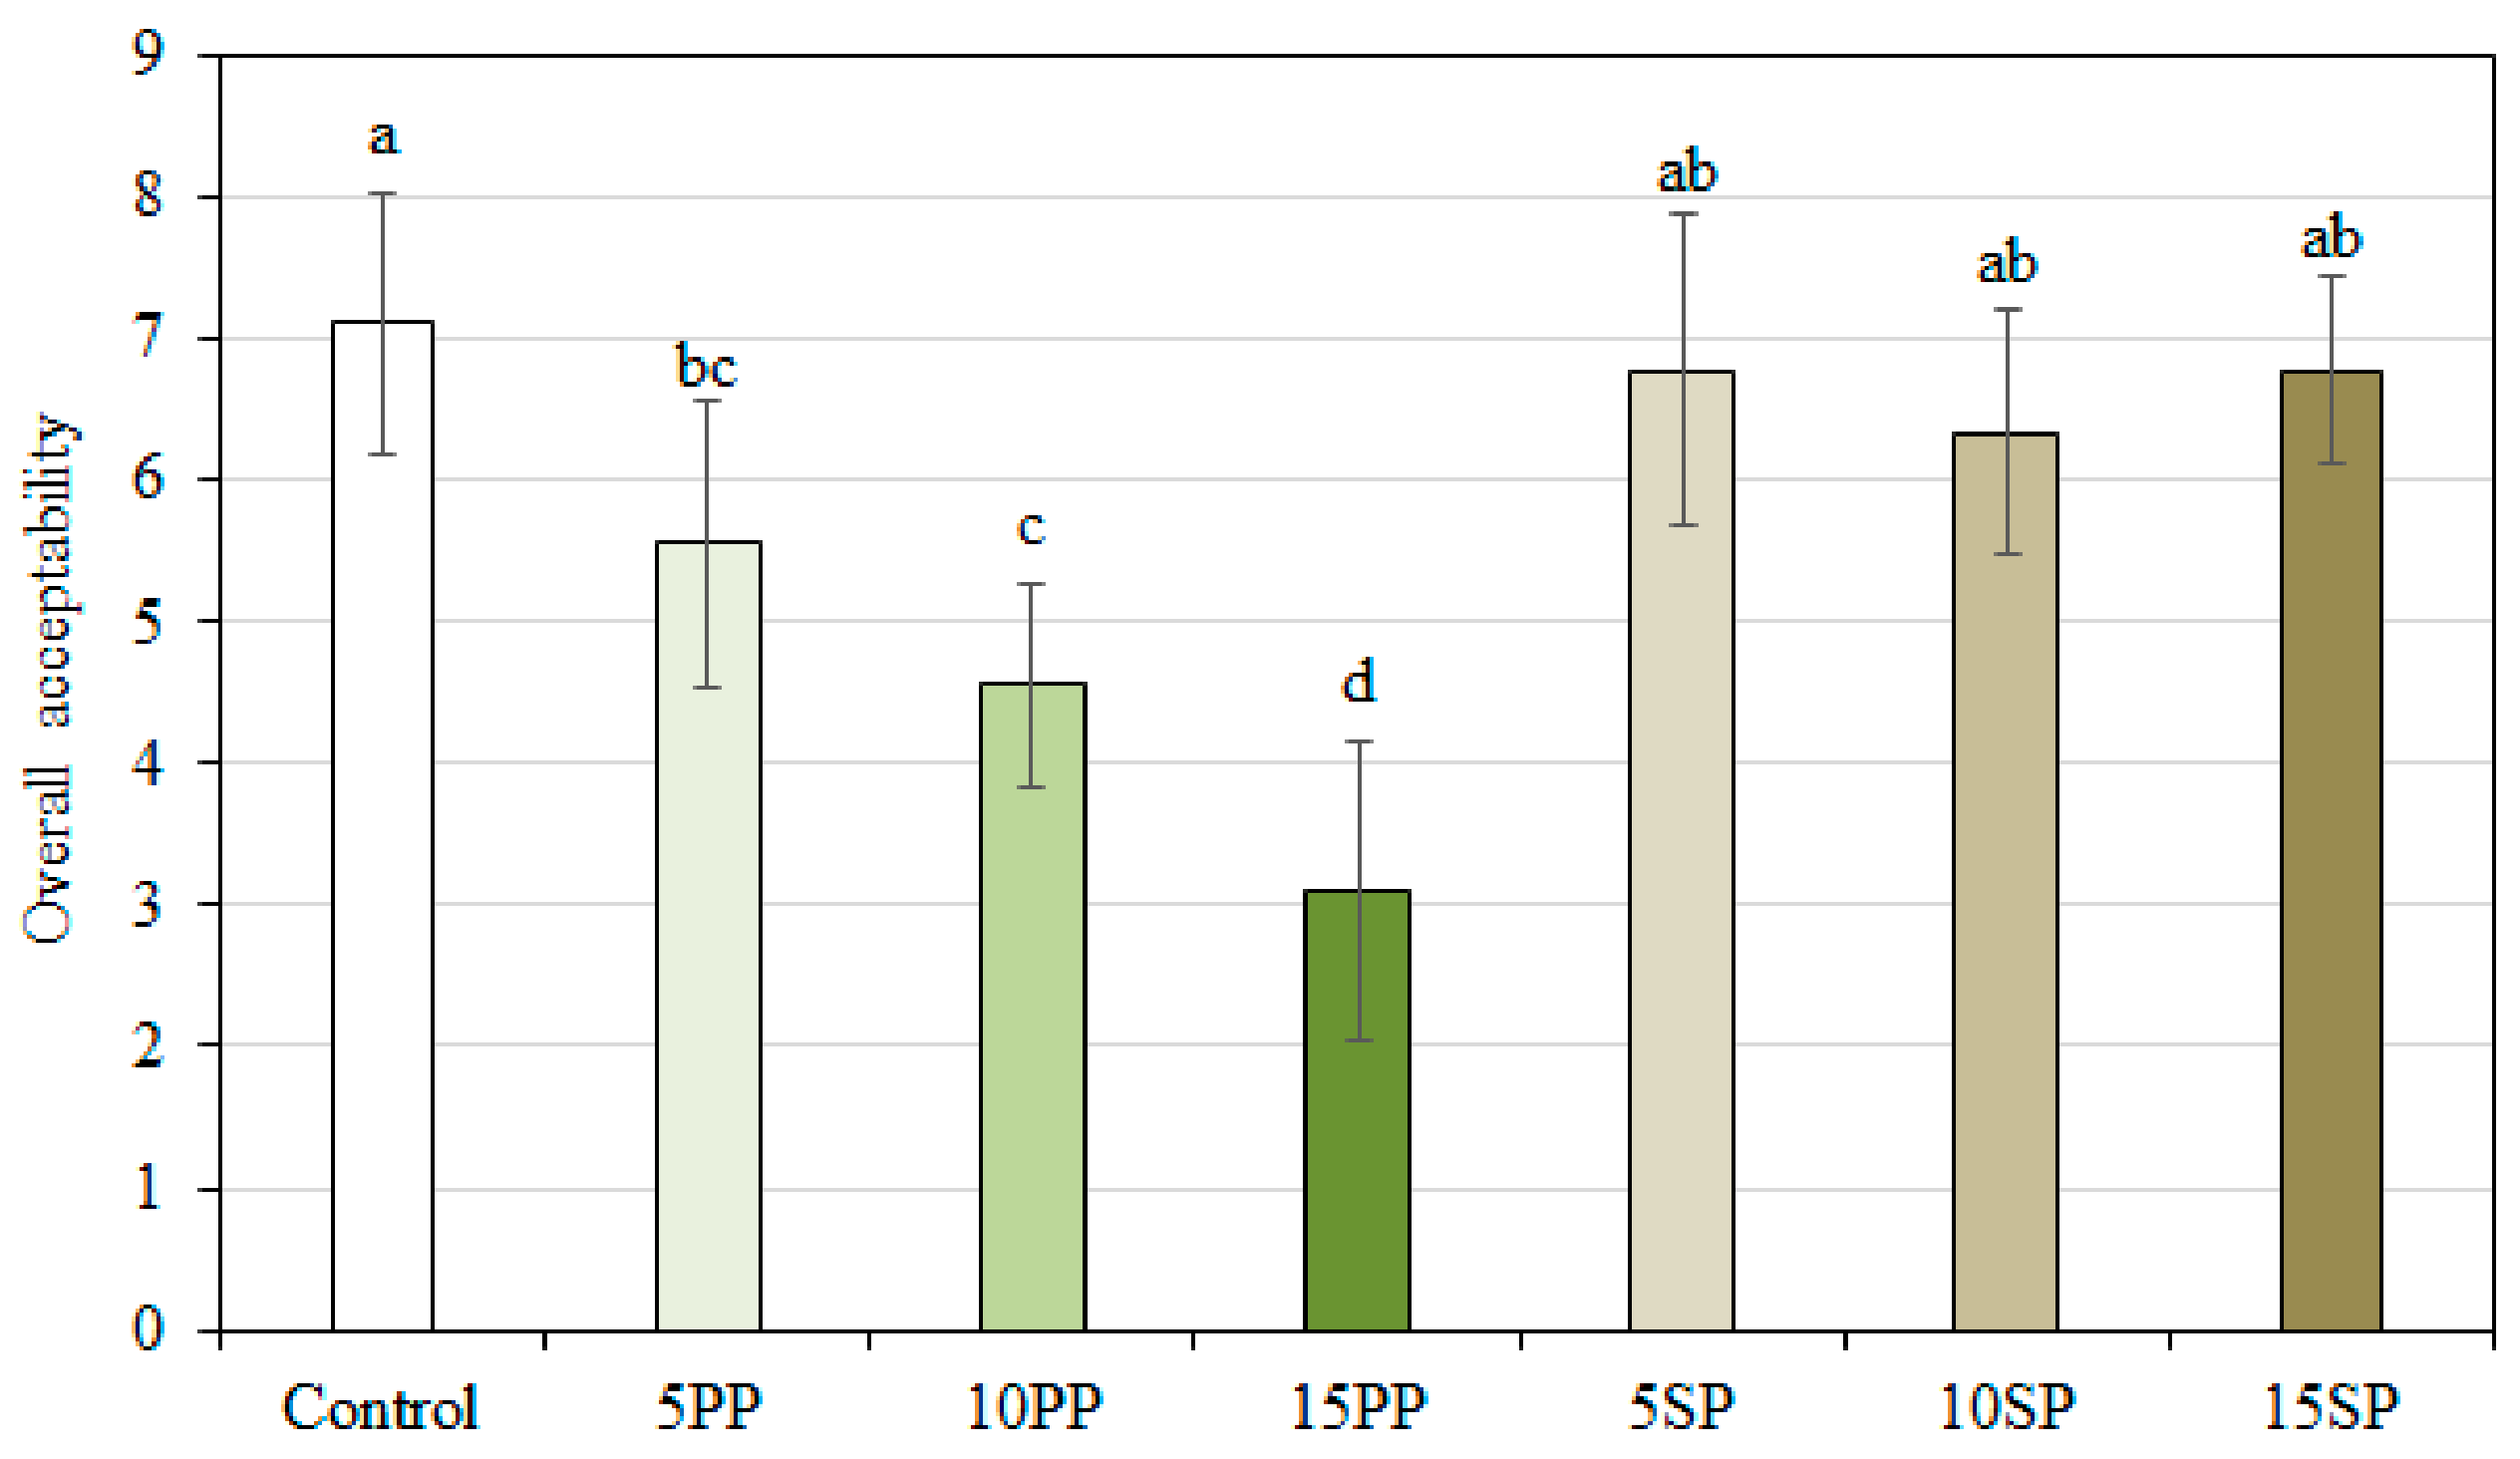
According to the hedonic test (Figure 4), the soy breads had a good overall acceptability, with a score varying from 6.3 to 6.8. Moreover, the SP breads did not significantly differ (p > 0.05) from the wheat control bread. On the other hand, breads with a pea protein concentrate addition were less liked compared with the soy breads. The overall acceptability noted for the 10PP and 15PP breads decreased significantly (p < 0.05) compared with the control bread and SP samples.
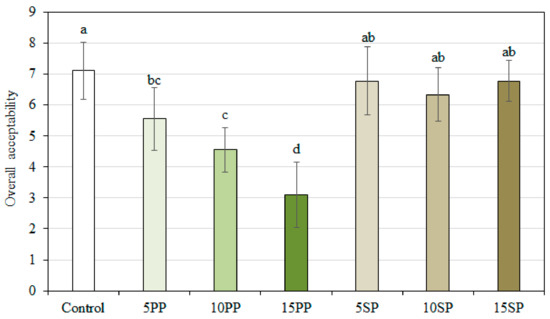
Figure 4.
Mean of the overall acceptability of the breads. The different letters show a significance difference (p < 0.05).
The results from the bread note are presented in Table 6. These results were in line with those obtained through other methods. Thus, positive correlations were observed between the physical methods and bread note methods for volume (r = 0.9969), porosity (r = 0.9578), and elasticity (r = 0.8356). In addition, a highly positive correlation was found between the overall acceptability performed by the panelists and the total score calculated through the bread note procedure (r = 0.9770). The L* parameter was positive correlated with the crumb colour in the bread note (r = 0.8392). There was also a negative correlation between L* and crumb colour in the sensory analysis (r = −0.8254).

Table 6.
Bread note.
4. Conclusions
In the present study, bread samples were produced using pea protein concentrate and soy protein concentrate, with the aim of enhancing the nutritional properties of wheat bread. SP breads showed a stronger dough structure, higher volume, and softer crumb than the bread obtained with PP. The total change in crumb colour was higher in the PP than SP breads. The bread samples were different in the odour profile according to the PCA map provided by the electronic nose system. Sensory analysis showed that SP allowed for obtaining a more acceptable bread than PP incorporation into bread formulation. The amount and type of protein have a substantial role in particular applications referring to protein fortified bakery products.
Author Contributions
Conceptualization, N.B.; methodology, N.B. and D.E.D.; formal analysis, A.C. and D.E.D.; investigation, D.E.D. and G.D.S.; resources, D.E.D.; data curation, A.C.; writing—original draft preparation, A.C. and D.E.D.; writing—review and editing, A.C. and D.E.D.; visualization, A.C.; supervision, N.B. and D.E.D.; project administration, D.E.D.; funding acquisition, N.B. and D.E.D. All authors have read and agreed to the published version of the manuscript.
Funding
This work was achieved through the Core programme (PN 19 02) supported by the Ministry of Education and Research (project number 19 02 01 01).
Institutional Review Board Statement
The study was conducted according to the guidelines of the Declaration of Helsinki, and approved by the Ethics Committee of the National Institute of Research & Development for Food Bioresources IBA Bucharest (08/28.02.2011).
Informed Consent Statement
Informed consent was obtained from all subjects involved in the study.
Data Availability Statement
Data is contained within the article.
Conflicts of Interest
The authors declare no conflict of interest.
References
- Statistica. Bread and Bakery Consumption Volume in Europe from 2010 to 2021, by Category. Available online: https://www.statista.com/statistics/806319/europe-bread-and-bakery-production-volume-by-category/ (accessed on 29 November 2020).
- Schmiele, M.; Ferrari Felisberto, M.H.; Silva Clerici, M.T.P.; Chang, Y.K. Mixolab™ for rheological evaluation of wheat flour partially replaced by soy protein hydrolysate and fructooligosaccharides for bread production. LWT Food Sci. Technol. 2017, 76, 259–269. [Google Scholar] [CrossRef]
- Des Marchais, M.F.; Mercier, S.; Villeneuvea, S.; Mondor, M. Bread-making potential of pea protein isolate produced by a novel ultrafiltration/diafiltration process. Procedia Food Sci. 2011, 1, 1425–1430. [Google Scholar] [CrossRef]
- Collar, C. Use of Mixolab on Formulated Flours. In Mixolab: A New Approach to Rheology; Dubat, A., Rosell, C.M., Gallagher, E., Eds.; AACC International, Inc.: St. Paul, MN, USA, 2013; pp. 33–44. [Google Scholar]
- Shah, N.N.; Umesh, K.V.; Singhal, R.S. Hydrophobically modified pea proteins: Synthesis, characterization and evaluation as emulsifiers in eggless cake. J. Food Eng. 2019, 255, 15–23. [Google Scholar] [CrossRef]
- Dahl, W.J.; Foster, L.M.; Tyler, R.T. Review of the health benefits of peas (Pisum sativum L.). Br. J. Nutr. 2012, 108, 3–10. [Google Scholar] [CrossRef] [PubMed]
- Millar, K.A.; Barry-Ryan, C.; Burke, R.; McCarthy, S.; Gabllagher, E. Dough properties and baking characteristics of white bread, as affected by addition of raw, germinated and toasted pea flour. Innov. Food Sci. Emerg. Technol. 2019, 56, 102189. [Google Scholar] [CrossRef]
- Hoehnel, A.; Axel, C.; Bez, J.; Arendt, E.K.; Zannini, E. Comparative analysis of plant-based high-protein ingredients and their impact on quality of high-protein bread. J. Cereal Sci. 2019, 89, 102816. [Google Scholar] [CrossRef]
- Ribotta, P.D.; Arnulphi, S.A.; Leόn, A.E.; Añόn, M.C. Effect of soybean addition on the rheological properties and breadmaking qualityof wheat flour. J. Sci. Food Agric. 2005, 85, 1889–1896. [Google Scholar] [CrossRef]
- Zhou, J.; Liu, J.; Tang, X. Effects of whey and soy protein addition on bread rheological property of wheat flour. J. Texture Stud. 2018, 49, 38–46. [Google Scholar] [CrossRef] [PubMed]
- Ivanovski, B.; Seetharaman, K.; Duizer, L.M. Development of soy-based bread with acceptable sensory properties. J Food Sci. 2012, 77, S71–S76. [Google Scholar] [CrossRef] [PubMed]
- Šimurina, O.; Filipčev, B.; Belić, Z.; Jambrec, D.; Krulj, J.; Brkljača, J.; Pestorić, M. The influence of plant protein on the properties of dough and the quality of wholemeal spelt bread. Croat. J. Food Sci. Technol. 2016, 8, 107–111. [Google Scholar] [CrossRef]
- AOAC. Official Methods of Analysis of AOAC International; Association of Official Analytical Chemists: Gaithersburg, MD, USA, 2005. [Google Scholar]
- Regulation (EC) No. 1924/2006 of the European Parliament and of the Council of 20 December 2006 on Nutrition and Health Claims Made on Foods. Available online: https://eur-lex.europa.eu/legal-content/EN/TXT/PDF/?uri=CELEX:32006R1924&from=EN (accessed on 27 November 2020).
- AACC. Method 54–60.01 Determination of Rheological Behavior as a Function of Mixing and Temperature Increase in wheat FLour and whole Wheat Meal by Mixolab, 11th ed.; AACC International: St. Paul, MN, USA, 2010. [Google Scholar]
- Dubat, A. The Mixolab. In Mixolab: A New Approach to Rheology; Dubat, A., Rosell, C.M., Gallagher, E., Eds.; AACC International, Inc.: St. Paul, MN, USA, 2013; pp. 3–13. [Google Scholar]
- AACC. Method 10–05.01 Guidelines for Measurement of Volume by Rapeseed Displacement, 11th ed.; AACC International: St. Paul, MN, USA, 2010. [Google Scholar]
- SR 91 Bread and Fresh Pastry Products. Methods of Analysis; Romanian Standard Association (ASRO) Publisher House: Bucharest, Romania, 2007. (In Romanian)
- Lazaridou, A.; Duta, D.; Papageorgiou, M.; Belc, N.; Biliaderis, C.G. Effects of hydrocolloids on dough rheology and bread quality parameters in gluten-free formulations. J. Food Eng. 2007, 79, 1033–1047. [Google Scholar] [CrossRef]
- Bourne, M.C. Texture profile analysis. Food Technol. 1978, 32, 62–66. [Google Scholar]
- Culetu, A.; Duta, D.E.; Andlauer, W. Influence of black tea fractions addition on dough characteristics, textural properties and shelf life of wheat bread. Eur. Food Res. Technol. 2018, 244, 1133–1145. [Google Scholar] [CrossRef]
- Lawless, H.T.; Heymann, H. Sensory Evaluation of Food: Principles and Practices, 2nd ed.; Springer: New York, NY, USA, 2010. [Google Scholar]
- Belc, N.; Ghencea, S. Procedure for Evaluating the Bread Quality by Scoring (in Romanian). Patent RO 130586 A2. 2015. Available online: http://pub.osim.ro/publication-server/pdf-document?PN=RO130586%20RO%20130586&iDocId=7515&iepatch=.pdf (accessed on 29 November 2020).
- Collar, C.; Angioloni, A. High-legume wheat-based matrices: Impact of high pressure on starch hydrolysis and firming kinetics of composite breads. Food Bioproc. Tech. 2017, 10, 1103–1112. [Google Scholar] [CrossRef]
- Taherian, A.R.; Mondor, M.; Labranche, J.; Drolet, H.; Ippersiel, D.; Lamarche, F. Comparative study of functional properties of commercial and membrane processed yellow pea protein isolates. Food Res. Int. 2011, 44, 2505–2514. [Google Scholar] [CrossRef]
- Roccia, P.; Ribotta, P.D.; Pérez, G.T.; Leon, A.E. Influence of soy protein on rheological properties and water retention capacity of wheat gluten. LWT Food Sci Technol. 2009, 42, 358–362. [Google Scholar] [CrossRef]
- Hadnađev, T.D.; Torbica, A.; Hadnađev, M. Rheological properties of wheat flour substitutes/alternative crops assessed by Mixolab. 11th International Congress on Engineering and Food. Procedia Food Sci. 2011, 1, 328–334. [Google Scholar] [CrossRef]
- Francis, F.J.; Clydesdale, F.M. Food Colorimetry: Theory and Applications; AVI Publishing Company Inc.: Westport, CT, USA, 1975. [Google Scholar]
- Horstmann, S.W.; Foschia, M.; Arendt, E.K. Correlation analysis of protein quality characteristics with gluten-free bread properties. Food Funct. 2017, 8, 2465–2474. [Google Scholar] [CrossRef] [PubMed]
- Garcia-Segovia, P.; Igual, M.; Martinez-Monzo, J. Physicochemical properties and consumer acceptance of bread enriched with alternative proteins. Foods 2020, 9, 933. [Google Scholar] [CrossRef] [PubMed]
Publisher’s Note: MDPI stays neutral with regard to jurisdictional claims in published maps and institutional affiliations. |
© 2021 by the authors. Licensee MDPI, Basel, Switzerland. This article is an open access article distributed under the terms and conditions of the Creative Commons Attribution (CC BY) license (http://creativecommons.org/licenses/by/4.0/).

