Article

Fast Sound Source Localization Based on SRP-PHAT Using Density Peaks Clustering

1
School of Civil Engineering, Chongqing University, Chongqing 400045, China
2
Key Laboratory of New Technology for Construction of Cities in Mountain Area, Chongqing University, Chongqing 400045, China
3
School of Civil Engineering and Architecture, Jishou University, Zhangjiajie 427000, China
*
Author to whom correspondence should be addressed.
Appl. Sci. 2021, 11(1), 445; https://doi.org/10.3390/app11010445
Submission received: 21 November 2020 / Revised: 29 December 2020 / Accepted: 30 December 2020 / Published: 5 January 2021
(This article belongs to the Section Acoustics and Vibrations)

Abstract

:
Sound source localization has been increasingly used recently. Among the existing techniques of sound source localization, the steered response power–phase transform (SRP-PHAT) exhibits considerable advantages regarding anti-noise and anti-reverberation. When applied in real-time situations, however, the heavy computational load makes it impossible to localize the sound source in a reasonable time since SRP-PHAT employs a grid search scheme. To solve the problem, an improved procedure called ODB-SRP-PHAT, i.e., steered response power and phase transformation with an offline database (ODB), was proposed by the authors. The basic idea of ODB-SRP-PHAT is to determine the possible sound source positions using SRP-PHAT and density peak clustering before real-time localization and store the identified positions in an ODB. Then, at the online positioning stage, only the power values of the positions in the ODB will be calculated. When used in real-time monitoring, e.g., locating the speaker in a video conference, the computational load of ODB-SRP-PHAT is significantly smaller than that of SRP-PHAT. Simulations and experiments under a real environment verified the high localization accuracy with a small computational load of ODB-SRP-PHAT. In addition, the advantages of anti-noise and anti-reverberation remained. The suggested procedure displayed good applicability in a real environment.

Graphical Abstract

1. Introduction

Sound source localization is a technology to determine the position of the objective sound source by analyzing sound signals and has been applied in many areas, such as speaker localization in teleconferencing, the noise testing of wind turbines, sound discrimination of robots, car whistle identification, etc. [1,2,3,4,5,6].
The existing sound source localization methods can be divided into three categories [7,8,9,10,11]: Time delay estimation (TDE)-based two-step localization methods, methods based on high-resolution spectral estimation, and beamforming methods based on the maximum steered response power. The TDE based two-step location methods first evaluate the time difference of the sound arrival at different elements of the microphone array and then identify the sound source according to the geometry configuration of the microphone array. These methods have simple principles and high efficiency; however, the TDE performance drops markedly under relatively heavy noise or reverberation. Therefore, these methods are not applicable in scenarios with a low signal-to-noise ratio (SNR) or high reverberation. In the methods based on high-resolution spectral estimation, a covariance matrix derived from the received signals is needed, which is estimated under the assumption that the signal and noise are stationary. However, such a condition can be hardly satisfied for non-stationary sound signals.
In 2000, Dibiase proposed a new approach of sound source localization, i.e., steered response power-phase transform (SRP-PHAT) [12]. The new approach combines the robustness and short-time analysis characteristics of the steered response power method with the advantage of the phase transformation method in time delay estimation. Hence, SRP-PHAT features robustness against noise and reverberation.
However, SRP-PHAT has heavy computation due to the grid search scheme, which limits its application in real-time situations. Since the SRP-PHAT algorithm was proposed, various improved algorithms have been published to reduce the computational load. Based on the fact that the time difference of arrival (TDOA) of two close candidates in space may be the same in the discrete-time domain, Cho et al. [13] proposed the classification of points with the same TDOA into one class, to store them in an offline table, and then to search only the representative points of all classes to determine the global maximum value. Yook et al. [14] proposed a two-level search space clustering sound source localization method (TL-SSC) based on the characteristic that the output powers at the searched grid points are close when the phase difference is within 2π/5. Zhao et al. [15] took advantage of the similarity of the TDOA vectors in adjacent regions and developed a fast SRP-PHAT sound source localization algorithm based on a cluster search. Cai et al. [16], Wan et al. [17,18], Zhao et al. [19], Badía et al. [20], and Nunes et al. [21] did similar work.
Although these suggested methods do improve SRP-PHAT for specific situations, they ask for either strict conditions or complicated computation. Evidently, it is still a problem for SRP-PHAT to simplify the computation while maintaining the robustness.
An improved procedure called ODB-SRP-PHAT was put forward by the authors to reduce the heavy computational load of SRP-PHAT. Considering the different probability of each candidate sound source in the space to be searched, all positions of possible sound sources were located to build an ODB in advance. Based on the ODB, a real-time search scheme was laid down for the search space.
This paper is divided into seven sections. In the second and third sections, the preprocessing of sound signal and the principle of SRP-PHAT were introduced respectively. The fourth section proposed the improved procedure, i.e., ODB-SRP-PHAT. Simulations were implemented to verify the efficiency of ODB-SRP-PHAT as shown in the fifth section. In the sixth section, we elaborated the experiments that were carried out under a real environment to validate the applicability of ODB-SRP-PHAT. The conclusions were drawn in the last section.

2. Sound Signal Preprocessing

For an array of M microphones, the sound signal x m ( t ) collected by the m-th microphone can be expressed as
x m ( t ) = h m ( t ) s ( t ) + b m ( t ) ,   m = 1 , 2 , , M
where s ( t ) is the sound source signal, h m ( t ) is the impulse response of the m-th microphone to the sound source, “*” indicates convolution, and b m ( t ) is the noise recorded by the m-th microphone. It is assumed that b m ( t ) is independent of each other, and is independent with s ( t ) . The discrete form of Equation (1) is as follows:
x m ( l ) = h m ( l ) s ( l ) + b m ( l ) ,   m = 1 , 2 , , M ,   l = 1 , 2
where l is the sequence number of the discrete form of x .
Although sound signals are nonlinear and time dependent, they exhibit short-time stationary characteristics. Thus, they can be divided into short segments (frames) for processing.
The i-th frame of x m ( l ) can be expressed as follows:
x m , i ( l ) = w ( l ) x m ( ( i 1 ) i n c + l ) ,   l = 0 , 1 , L 1
where w ( l ) is a window function, L is the frame length, i n c is the frame shift. Discrete Fourier Transform is then performed on each frame, so we can get:
X m , i ( k ) = l = 0 L 1 x m , i ( l ) e j 2 π L l k ,   k = 0 , 1 , L 1
where k is the sequence number.

3. SRP-PHAT Algorithm
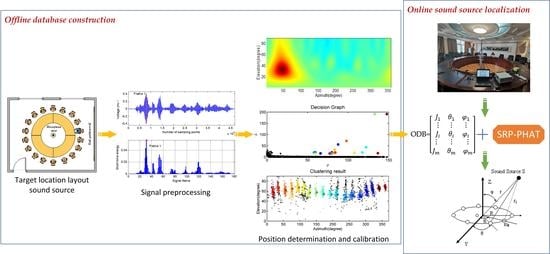
SRP-PHAT calculates firstly the steered response power (SRP) value for all positions in the search space. Then the maximum SRP value can be used to estimate the sound source position. SRP-PHAT has characteristics of short-time analysis. A short signal, such as a frame of a sound signal, can also be used to compute the SRP value.
The SRP value, which is the sum of the generalized cross-correlation phase transform (GCC-PHAT) function with the signals collected by all microphone pairs, can be expressed as follows:
P i ^ ( q ) = m = 1 M n = m + 1 M R ^ m n ( i ) [ τ m , n ( q ) ]  
P i ^ ( q ) represents the SRP value at candidate location q calculated using the i-th frame of the signal, R ^ m n ( i ) [ τ m , n ( q ) ] is the GCC-PHAT function of the i-th frame of the signals collected by the m-th and n-th microphones, and its expression is:
R ^ m n ( i ) ( τ ) = 1 L k = 0 L 1 X m , i ( k ) X n , i * ( k ) | X m , i ( k ) X n , i * ( k ) | e j ω τ
where, X m , i ( k ) is the discrete Fourier transform (DFT) of x m , i ( l ) . x m , i ( l ) is the i-th frame of the signal collected by the m-th microphone, and “*” means conjugate. L is the number of DFT points, ω is the analog angular frequency. τ is the abbreviation of τ m , n ( q ) , which represents the TDOA from the imaginary sound source to the m-th and n-th microphones. r m and r n represent the rectangular coordinate vector of the m-th and the n-th microphones respectively. If c denotes the speed of sound in the air (about 340 m/s), the expression of τ m , n ( q ) is:
τ m , n ( q ) = ( q r m q r n ) c
After calculating the SRP for each candidate locations, the candidate location with the largest SRP is designated as the location estimate, and can be expressed as follows:
q ^ = argmax q P i ^ ( q ) .
Due to the effect of noise and reverberation, the location estimate obtained by different frame of a sound signal usually varies. This can be dealt with by clustering, which will be addressed in Section 4.1.

4. ODB-SRP-PHAT

SRP-PHAT searches all candidate points in the objective space, since the probability of each point being sound source is regarded as the same. Such an algorithm can guarantee a global optimal solution, however, the resulting huge computation makes its application impossible in a real-time situation. In practice, the sound source is typically located at a specific position, instead of an equal probability of showing up at every point of the space. For example, in a video conference room, the voice of a speaker can only be emitted from the area above the seats, while it is almost impossible to be given from other places. If all the possible sound source positions are localized to construct an ODB in advance, only the positions in the database need to be searched in real-time sound source localization. Thereby, the shortcoming of the heavy computational load due to searching points one by one in a large space can be overcome, and real-time localization becomes practical.
Based on this, the authors put forward an improved procedure called ODB-SRP-PHAT to decrease the computational load and maintain the robustness. The new procedure consists of two steps, i.e., offline database construction and online sound source localization, as shown in Figure 1.
We assumed that the sound source is in the far field, and the localization algorithm only estimates the direction of arrival (DOA) of the sound source. In a spherical coordinate system, the search ranges of the azimuth (θ) and elevation (φ) are 0–359° and 0–90° respectively, where the search space mesh has increments of 1°, and each mesh point is a candidate orientation q(θ, φ). Figure 2a shows an eight-element uniform ring microphone array with a diameter of 20 cm. Figure 2b illustrates the SRP-PHAT energy map, i.e., SRP values, obtained by analyzing a certain frame of the signal collected by the microphone array. In Figure 2b, the darker the color is, the greater the SRP value becomes. The position of the darkest color (47°, 33°) is estimated as the sound source location. For the convenience of further analysis, we use ( θ ^ i , j , φ ^ i , j ) to represent the estimated location of the i-th sound source by analyzing the j-th frame of the signal, and use ( θ i , φ i ) to represent the actual location of the i-th sound source.

4.1. Offline Database Construction

The key for ODB-SRP-PHAT is to construct an offline database (ODB), which influences the accuracy of the subsequent localization. The data in the ODB are composed of a series of actual locations of the possible sound sources relative to a microphone array located at a place.
The basic steps constructing an ODB are as follows:
Step 1: The possible sound source locations are numbered, i.e., from 1 to m, and the i-th location is indicated by q i .
Step 2: The microphone array device is installed at a place and debugged, and the sound source is put in sequence at each location, i.e., from q 1 to q m .
Step 3: The microphone array is used to collect the sound signal emitted from each location, and the sound signal is framed. Then SRP-PHAT is used to analyze each frame in turn to obtain the estimated location ( θ ^ i , j , φ ^ i , j ).
Step 4: According to the estimated locations by all frames, the actual location ( θ i , φ i ) is further determined by a method, which will be discussed later. The determined actual location is stored into the ODB.
ODB = [ q 1 θ 1 φ 1 q i θ i φ i q m θ m φ m ]
It was found that by simulation analysis without noise and reverberation, the estimated location ( θ ^ i , j , φ ^ i , j ) obtained by analyzing each frame was the same and so completely consistent with the actual location ( θ i , φ i ). However, in the real environment, the noise and reverberation are unavoidable. So the estimated location obtained with a signal polluted by noise and reverberation always deviates from the actual location to some degree. How to determine the actual location with the estimated location analyzed by each frame considering noise and reverberation is a problem to be solved.
If the estimated locations of all frames for a sound source are plotted as dots in a coordinate system with θ as the abscissa and φ as the ordinate, the dots can be regarded as sample points. It was found that the sample points distributed in a different range due to the change of the noise and reverberation. The lower the signal noise ratio (SNR) is and the longer the reverberation time is, the more dispersive the distribution of sample points is, and vice versa. The closer to the actual location ( θ i , φ i ) the place is, the larger the density of the sample points is, and vice versa. For each sound source location, the sample points distributed in a cluster, and the densest position of the cluster was typically the actual location of the sound source.
In this paper, a clustering algorithm was used to identify the actual location, which should be at the densest position of the sample points. For the classical clustering algorithm K-means, the number and centers of clusters are specified artificially, and the center is updated by iteration. As each point is assigned to the closest center, this method is prone to the effect of the initial selection of the center and poor self-adjusting ability. It is not applicable for analyzing data of non-spherical clusters [22].
Density-based spatial clustering of applications with noise (DBSCAN) can deal with clusters with an arbitrary shape. One chooses a density threshold, discards the points in regions with densities lower than this threshold as noise, and assigns disconnected regions of high density to different clusters. However, choosing an appropriate threshold can be nontrivial [23]. Rodriguez et al. [24] suggested a new efficient density peaks clustering algorithm, i.e., clustering by fast search and finding density peaks (DPC). More effective than the traditional algorithms, such as K-means and DBSCAN, DPC can determine the centers automatically according to the density of sample points, and can handle data with any distribution. The computational load is also small. DPC is based on two assumptions: the local density of the center is bigger than that of the neighboring sample points; the distance between any two centers of different clusters is far away.
To find the centers satisfying the two assumptions simultaneously, DPC introduces the local density. We assume that the local density of x i is ρ i . ρ i is a Gaussian kernel function as:
ρ i = j I S \ { i } exp ( ( d i j d c ) 2 )
where d i j is the distance between x i and x j , and d c is the cutoff distance.
We designate δ j as the distance from x i to the closest sample point x j with a bigger density than x i ,
δ j = min j : ρ j > ρ i ( d i j )
For the sample point with the biggest local density, its δ j is as follows
δ i = max j ( d i j ) .
By constructing the decision graph of δ j versus ρ i , allocating the sample points, and deleting noise points, the clustering results can be obtained. The algorithm flow of DPC is shown in Algorithm 1.
Algorithm 1 The Flow of DPC.
Step 1. Calculating the distance between any two sample points
Step 2. Calculating the local density ρ i of any sample point x i according to the cutoff distance
Step 3. Computing δ i for any sample point x i
Step 4. Plotting the decision graph of δ j versus ρ i
Step 5. In the decision graph, designating the points with big values of both ρ i and δ j as the centers of clusters, and the points with big δ j and small ρ i as noise
Step 6. Allocating the remaining points, with each of them being assigned to the closest cluster in which the points have a larger local density
According to the above steps, the cluster center, i.e., the actual location ( θ i , φ i ) of each sound source position, is finally obtained and stored in the ODB.

4.2. Online Sound Source Localization

During online localization, SRP-PHAT carries out a grid search scheme. Assuming that the azimuth range is 1 N θ , the elevation range is 1 N φ , and the search step is 1, SRP-PHAT will calculate the SRP values of N θ × N φ grid points. As for the suggested ODB-SRP-PHAT, the SRP values only at the positions stored in the ODB need to be calculated using Equation (5). By comparing the calculated SRP values, the position corresponding to the maximum value is considered as the sound source position.
The search workload of ODB-SRP-PHAT in the online localization stage is determined by the number of possible sound source positions, i.e., m, in the ODB. Thus, compared with the SRP-PHAT algorithm, the online computational cost of ODB-SRP-PHAT is m. The corresponding computational load ratio is R :
R = m N θ N φ · 100 % .

5. Simulations

In the simulations, there were 24 seats in a round conference room with the dimensions 8 m × 8 m × 3 m (length × width × height). A circular microphone array consisted of eight omnidirectional microphones with a radius of 0.1 m, which was located at the center of the room, i.e., the co-ordinates being 4 m, 4 m, and 0.6 m, as shown in Figure 3. Voice signals were selected randomly from the TIMIT database [25], with the length of 3 s and a sampling rate of 16 kHz. The sound source was sequentially placed at eight different seats marked in red in the upper left area of the room, and the height was set as 1.7 m. The impulse responses of the room were generated by the image method [26], which were convoluted with the voice signals to simulate reverberation. Various reverberation durations were considered, i.e., 20, 300, 500, 700, and 900 milliseconds. Gaussian noises were also added into the signals to consider different SNRs, i.e., 5, 10, 15, 20, 25, and 30 dB.

5.1. Offline Database Construction

Voice signals with different reverberation time and SNR were divided into frames. The frame length was 512 points (i.e., 32 ms), and the frame shift was 256 points (i.e., 16 ms). There were 181 frames. Each frame was convoluted with Hanning window, and its short-time energy was calculated, as shown in Figure 4. Corresponding to each sound source position, the first 100 frames with larger short-time energy were chosen to localize the sound source. The sample points with the reverberation time as 300 ms and the SNR as 10 and 30 dB are drawn respectively in Figure 5. The dispersion of sample points was small as the SNR being 30 dB, which indicates that the localization by each frame was acceptably accurate. When the SNR was 10 dB, the large dispersion of sample points indicated that it was unreliable to localize the sound source by a single frame.
DPC was used for analyzing the sample points to accurately localize the sound source. In Figure 6, the identified cluster centers (sound sources) are marked as a with the reverberation time being 300 ms and the SNR being 10 dB and 30 dB respectively. Table 1 and Table 2 give out the identified coordinates of cluster centers with the reverberation time as 300 ms corresponding to different SNRs and the SNR as 30 dB under different reverberation durations respectively. It can be seen that the coordinates were completely consistent with the actual location of sound sources when the reverberation time was relatively short, e.g., 20 ms or 300 ms, and the SNR was high, e.g., 25 dB or 30 dB. Even under strong reverberation or heavy noise, e.g., 900 ms or 5 dB, the error did not exceed 2 degrees (see the bold figures). This proved that DPC could efficiently remove the effects of reverberation and noise and locate the sound source accurately.
The influence of the used number of frames on the clustering results was also analyzed. Table 3 lists the identified coordinates of cluster centers using different number of frames with large short-term energy when the reverberation time was 300 ms and the SNR was 30 dB. It can be seen that when the number of frames was 30 or more, the recognition results were stable. While the number of frames was less than 30, the results had certain deviation. So in order to get reliable identification results in practice, the number of frames should be taken as 30 at least and depends on whether the results are stable.
The co-ordinates of the centers, i.e., the stable clustering results, were stored in the ODB.

5.2. Comparison of Sound Source Localization

A parameter V called the localization success rate was used to compare the SRP-PHAT and ODB-SRP-PHAT.
V = N s u c c N t o t a l
where N t o t a l is the total localization times, which was taken as 100 in this section. N s u c c is the successful localization time. The tolerance for both the azimuth and elevation was set as 10° when SRP-PHAT was used.
When the reverberation time was 300 ms, the results of localization under situations of six different SNRs are shown in Figure 7a. When the SNR was 5 dB, V was only about 80% for SRP-PHAT, which was much smaller than that for ODB-SRP-PHAT. ODB-SRP-PHAT exhibited good performance of localization even under extremely low SNRs. The higher the SNR, the bigger the value of V for both methods. When the SNR was 30 dB, V approached 100%.
Simulations were also carried out for five situations of reverberation time under an SNR of 30 dB. As shown in Figure 7b, when the reverberation time was 20 ms, both methods achieved ideal results. As the reverberation became stronger, the values of V for both methods went down. However, even when the reverberation time was as long as 900 ms, the value of V for the proposed method could be above 90%, better than SRP-PHAT. This indicates that ODB-SRP-PHAT had good anti-reverberation ability.

5.3. Computational Load Analysis

As shown in Section 4.2, when SRP-PHAT was used for analysis, assuming that the search space was the sectoral area in Figure 3, the azimuth angle range was 75°~195°, the elevation angle was 20°~70°, and the search step was 1°, so N θ was 121, N φ was 51, the power values of 121 × 51 = 6171 grid nodes had to be calculated for each frame. In contrast, ODB-SRP-PHAT only needed to calculate the power values at eight nodes in the ODB. Its online computational load was only 0.1% of SRP-PHAT.

6. Real Environment Test

Video-conferencing has been widely used in various fields. In a long-distance video-conference a speaker needs to be localized in real time for the convenience of capturing his/her face by camera. At present, this often relies on labor or half-linkages to control the camera, which has unsatisfactory efficiency and is labor consuming. Therefore, an automatic control system is necessary to be developed, in which sound source localization is the key.
A series of tests in a real environment were conducted to verify the efficiency of ODB-SRP-PHAT. A conference room with the dimensions of 8.7 m × 7.5 m × 2.8 m in a university was chosen as the test field, in which a round table had 18 seats as shown in Figure 8. A circular microphone array consisting of eight omnidirectional microphones (MPA416) with a radius of 10 cm was placed at the center of the round table, at the height of 2.2 m as shown in Figure 8. The reverberation time and the averaged SNR were approximately 0.4 s and 16 dB, respectively, by estimation.
At the stage of offline database construction, a sound source was, in turn, set at the center of each seat and at the height of 1.2 m. The sound signals, i.e., a piece of music generated by a blue-tooth speaker controlled by a mobile phone, emitted from each sound source were recorded by the microphone array three times with the sampling rate of 20 KHz. A Hanning window was used to convolute the sound signals and the windowed signals were divided into frames, with a frame length of 512 points and a frame shift of 256 points. There were 1080 frames for each signal, in which 200 frames with a larger short-time energy were selected for sound source localization using SRP-PHAT. The obtained 3600 sample points are shown in Figure 9.
Then, DPC was used to deal with the sample points and, finally, 18 clusters were formed. The centers of the clusters were stored in the ODB. As shown in Figure 10 and Table 4, the azimuth space between any two adjacent sound sources was approximately 20°, which was essentially consistent with the actual situation. There were deviations for sound source elevation and the dispersion was relatively big. This was partly due to the relatively low elevation resolution of the circular microphone array placed horizontally. In addition, the plate mounted with the microphone array tilted to some degree and was difficult to align. However, since the plate of the microphone array was kept at the same location and tilting status for both the offline database construction and the subsequent online localization, the results were not greatly affected.
At the online localization stage, a person of 1.7 m high sat on the 18 seats in turn and counted from 1 to 10, repeated three times at each seat. With the sampling rate at 20 kHz, the sound signals collected by the microphone array were divided into frames and convoluted with a Hanning window. The frame length was 512, and the frame shift was 256. Among the frames collected at each seat, the first 100 frames with a larger short-time energy were used with SRP-PHAT and ODB-SRP-PHAT. For SRP-PHAT, the position with the largest value of SRP was judged as the sound source position. The tolerance was set as 10° and 20° for both the azimuth and elevation. If the deviation was smaller than the tolerance, the localization was considered successful. ODB-SRP-PHAT only calculated the SRP values at the 18 points stored in the ODB. If the largest value of the SRP was consistent at the point with the sound source position, it was a successful localization. The results of the localization success rate V are plotted in Figure 11.
In Figure 11, the success rate of the localization for ODB-SRP-PHAT is generally high. Except for seats 3, 4, and 6, the V values of the other seats are all greater than 90%. In particular, from seat 12 to seat 18 near the open door, the V values approach 100%. The lower V values for seat 3, 4, and 6 were due to a close wall having a smooth surface behind these seats, which resulted in a stronger reverberation. When the tolerance was set as 20°, the success rates from SRP-PHAT were close to those from ODB-SRP-PHAT. When the tolerance was 10°, however, the V values from ODB-SRP-PHAT were much larger than those from SRP-PHAT. ODB-SRP-PHAT demonstrated clear superiority in the sound source localization.
Regarding the computational load, when using SRP-PHAT for analysis, the search range of the azimuth angle was 1°~360°, the elevation angle was 30°~80°, and the search step was 1°, Therefore, there were 18,360 (360 × 51) grid points at which the SRP value needed to be calculated. ODB-SRP-PHAT only needed to compute the SRP values at the 18 points in the ODB. The online computational load was less than 0.1% of that by SRP-PHAT.
In general, ODB-SRP-PHAT was validated by the tests in the real environment. ODB-SRP-PHAT could localize the sound source accurately with the least computational load. In addition, it had a good ability to resist noise and reverberation. ODB-SRP-PHAT is applicable for online sound source localization.

7. Conclusions

Among the existing sound source localization algorithms, SRP-PHAT has the advantages of anti-noise and robustness against reverberation. However, the heavy computational load prevents it from applying in real-time situations. To solve the problem, an improved procedure called ODB-SRP-PHAT was proposed by the authors. The basic idea of ODB-SRP-PHAT is constructing an ODB prior to real-time sound source localization.
Sound signals were emitted from all the possible sound source positions in turn artificially, and were collected by a microphone array. These signals were then evaluated with SRP-PHAT to localize each sound source position. To improve the localization accuracy, DPC was used. The center of each cluster, i.e., the sound source locations, was stored in an ODB. In real-time localization, the SRP values of only the points in the ODB would be computed and the maximum value indicated the sound source. Hence the heavy computational load of searching the whole space was considerably reduced.
Simulations and tests in a real environment verified the localization accuracy, the anti-noise ability, and the robustness against reverberation of the proposed method. Compared with SRP-PHAT, ODB-SRP-PHAT exhibited better performance and higher efficiency and, therefore, is applicable for real-time localization. However, ODB-SRP-PHAT is designed to be suitable for the situation of fixed sound sources. In future work, a study using a microphone array with better elevation resolution in more complicated circumstances will be performed to further validate the performance of ODB-SRP-PHAT.

Author Contributions

D.-B.Z. and H.C conceived and designed the theoretical verifications; D.-B.Z. performed the simulations and experiments; D.-B.Z. and H.C. analyzed the results and wrote the paper; H.C. revised the manuscript to improve the quality of English. All authors have read and agreed to the published version of the manuscript.

Funding

This research was funded by the Scientific research project of the Hunan Education Department, grant number 20C1512.

Institutional Review Board Statement

Not applicable.

Informed Consent Statement

Not applicable.

Data Availability Statement

The data presented in this study are available on request from the corresponding author.

Conflicts of Interest

The authors declare no conflict of interest.

References

  1. Zhang, C.Q.; Gao, Z.Y.; Chen, Y.Y.; Dai, Y.J.; Wang, J.W.; Zhang, L.R.; Ma, J.L. Locating and tracking sound sources on a horizontal axis wind turbine using a compact microphone array based on beamforming. Appl. Acoust. 2019, 146, 295–309. [Google Scholar] [CrossRef]
  2. Zhao, Z.; Chen, W.H.; Amezquita-Semprun, K.; Chen, P.C.Y.; Zheng, Z. Design and Evaluation of a Prototype System for Real-Time Monitoring of Vehicle Honking. IEEE Trans. Veh. Technol. 2019, 68, 3257–3267. [Google Scholar] [CrossRef]
  3. Too, Y.M.; Chitre, M.; Barbastathis, G.; Pallayil, V. Localizing Snapping Shrimp Noise Using a Small-Aperture Array. IEEE J. Ocean. Eng. 2017, 44, 207–219. [Google Scholar] [CrossRef]
  4. Meng, F.; Behler, G.; Vorlaender, M. A Synthesis Model for a Moving Sound Source Based on Beamforming. Acta Acust. United Acust. 2018, 104, 351–362. [Google Scholar] [CrossRef]
  5. Padois, T. Acoustic source localization based on the generalized cross-correlation and the generalized mean with few microphones. J. Acoust. Soc. Am. 2018, 143, EL393–EL398. [Google Scholar] [CrossRef] [Green Version]
  6. Zhang, Z.; Wu, M.; Han, X.; Yang, J. Performance comparison of UCA and UCCA based real-time sound source localization systems using circular harmonics SRP method. Appl. Acoust. 2020, 164, 107241. [Google Scholar] [CrossRef] [Green Version]
  7. Brandstein, M.S.; Silverman, H.F. A practical methodology for speech source localization with microphone arrays. Comput. Speech Lang. 1997, 11, 91–126. [Google Scholar] [CrossRef] [Green Version]
  8. Knapp, C.; Carter, G. The generalized correlation method for estimation of time delay. IEEE Trans. Acoust. Speech Signal Process. 1976, 24, 320–327. [Google Scholar] [CrossRef] [Green Version]
  9. Schmidt, R. Multiple emitter location and signal parameter estimation. IEEE Trans. Antennas Propag. 1986, 34, 276–280. [Google Scholar] [CrossRef] [Green Version]
  10. Chen, Z.; Li, Z.; Wang, S.; Yin, F. A microphone position calibration method based on combination of acoustic energy decay model and TDOA for distributed microphone array. Appl. Acoust. 2015, 95, 13–19. [Google Scholar] [CrossRef]
  11. Sun, Y.; Chen, J.; Yuen, C.; Rahardja, S. Indoor Sound Source Localization with Probabilistic Neural Network. IEEE Trans. Ind. Electron. 2018, 65, 6403–6413. [Google Scholar] [CrossRef]
  12. DiBiase, J.H. A High-Accuracy, Low-Latency Technique for Talker Localization in Reverberant Environments Using Microphone Arrays. Ph.D. Thesis, Brown University, Providence, RI, USA, May 2000. [Google Scholar]
  13. Cho, Y.; Yook, D.; Chang, S.; Kim, H. Sound source localization for robot auditory systems. IEEE Trans. Consum. Electron. 2009, 55, 1663–1668. [Google Scholar] [CrossRef]
  14. Yook, D.; Lee, T.; Cho, Y. Fast Sound Source Localization Using Two-Level Search Space Clustering. IEEE Trans. Cybern. 2015, 46, 20–26. [Google Scholar] [CrossRef] [PubMed]
  15. Zhao, X.; Tang, J.; Zhou, L.; Wu, Z. Accelerated steered response power method for sound source localization via clustering search. Sci. China Ser. G Phys. Mech. Astron. 2013, 56, 1329–1338. [Google Scholar] [CrossRef]
  16. Cai, W.; Wang, S.; Wu, Z. Accelerated steered response power method for sound source localization using orthogonal linear array. Appl. Acoust. 2010, 71, 134–139. [Google Scholar] [CrossRef]
  17. Wan, X.; Wu, Z. Improved steered response power method for sound source localization based on principal eigenvector. Appl. Acoust. 2010, 71, 1126–1131. [Google Scholar] [CrossRef]
  18. Wan, X.; Wu, Z. Sound source localization based on discrimination of cross-correlation functions. Appl. Acoust. 2013, 74, 28–37. [Google Scholar] [CrossRef]
  19. Zhao, Y.; Chen, X.; Wang, B. Real-time sound source localization using hybrid framework. Appl. Acoust. 2013, 74, 1367–1373. [Google Scholar] [CrossRef]
  20. Badía, J.M.; Belloch, J.A.; Cobos, M.; Igual, F.D.; Quintana-Ortí, E.S. Accelerating the SRP-PHAT algorithm on multi- and many-core platforms using OpenCL. J. Supercomput. 2018, 75, 1284–1297. [Google Scholar] [CrossRef]
  21. Nunes, L.O.; Martins, W.A.; Lima, M.V.; Biscainho, L.W.; Goncalves, F.M.; Said, A.; Lee, B. A Steered-Response Power Algorithm Employing Hierarchical Search for Acoustic Source Localization Using Microphone Arrays. IEEE Trans. Signal Process. 2014, 62, 5171–5183. [Google Scholar] [CrossRef]
  22. Rodriguez, A.; Laio, A. Clustering by fast search and find of density peaks. Science 2014, 344, 1492–1496. [Google Scholar] [CrossRef] [PubMed] [Green Version]
  23. Jain, A.K. Data clustering: 50 years beyond K-means. Pattern Recognit. Lett. 2010, 31, 651–666. [Google Scholar] [CrossRef]
  24. Ester, M.; Kriegel, H.P.; Sander, J.; Xu, X. A Density-Based Algorithm for Discovering Clusters in Large Spatial Databases with Noise. In Proceedings of the 2nd International Conference on Knowledge Discovery and Data Mining KDD-96, Portland, OR, USA, 2–4 August 1996; pp. 226–231. [Google Scholar]
  25. Garofolo, J.; Lamel, L.; Fisher, W.M.; Fiscus, J.G. TIMIT Acoustic-Phonetic Continuous Speech Corpus. Linguistic Data Consortium. 1993. Available online: https://catalog.ldc.upenn.edu/LDC93S1 (accessed on 10 February 2020).
  26. Allen, J.B.; Berkley, D.A. Image method for efficiently simulating small-room acoustics. J. Acoust. Soc. Am. 1979, 65, 943–950. [Google Scholar] [CrossRef]
Figure 1. ODB-SRP-PHAT flowchart.
Applsci 11 00445 g001
Figure 2. Microphone array model and SRP-PHAT energy map.
Applsci 11 00445 g002
Figure 3. The locations of the microphone array and the seats in the simulations.
Applsci 11 00445 g003
Figure 4. Voice signal with SNR as 30 dB and reverberation as 300 ms.
Applsci 11 00445 g004aApplsci 11 00445 g004b
Figure 5. Sample points obtained by the first 100 frames with different SNR.
Applsci 11 00445 g005
Figure 6. Clustering results with different SNR.
Applsci 11 00445 g006aApplsci 11 00445 g006b
Figure 7. Comparison of the localization results under different noise and reverberation conditions.
Applsci 11 00445 g007
Figure 8. Layout and actual view of the meeting room.
Applsci 11 00445 g008
Figure 9. Sample points of the localization results (18 positions).
Applsci 11 00445 g009
Figure 10. Clustering analysis results (18 positions).
Applsci 11 00445 g010
Figure 11. Comparison of the analysis results between SRP-PHAT and ODB-SRP-PHAT.
Applsci 11 00445 g011
Table 1. Identified sound source (cluster center) coordinates with different SNR.
Node5 db10 db15 db20 db25 db30 db
θφθφθφθφθφθφ
q 1 453745374538453845384538
q 2 455745574556455745574557
q 3 753875387538753875387538
q 4 755675577557755775567556
q 5 105381053810538105381053810538
q 6 105551055610556105561055610556
q 7 134371353713537135381353813538
q 8 135571355713558135571355713557
Table 2. Identified sound source (cluster center) coordinates with different reverberation time.
Node20 ms300 ms500 ms700 ms900 ms
θφθφθφθφθφ
q 1 45384538453845374537
q 2 45574557455745564559
q 3 75387538753874387438
q 4 75567556755675567556
q 5 1053810538105381053810638
q 6 1055610556105561055710557
q 7 1353813538135381353713537
q 8 1355713557135581355713558
Table 3. Identified sound source (cluster center) coordinates with different number of frames.
Node10 Frames20 Frames30 Frames50 Frames100 Frames150 Frames
θφθφθφθφθφθφ
q 1 453945384538453845384538
q 2 455545534557455745574557
q 3 753975397538753875387538
q 4 765574547556755675567556
q 5 105391053910538105381053810538
q 6 105561055410556105561055610556
q 7 135391353813538135381353813538
q 8 135551355513557135571355713557
Table 4. ODB of the meeting room.
NumberθφNumberθφ
q 1 31952 q 10 12654
q 2 30150 q 11 11163
q 3 28141 q 12 9366
q 4 25644 q 13 7364
q 5 23541 q 14 5362
q 6 20947 q 15 3267
q 7 19148 q 16 1759
q 8 16850 q 17 35756
q 9 14754 q 18 33955
Publisher’s Note: MDPI stays neutral with regard to jurisdictional claims in published maps and institutional affiliations.

