Article

The Mkurtogram: A Novel Method to Select the Optimal Frequency Band in the AC Domain for Railway Wheelset Bearings Fault Diagnosis

1
School of Mechanical, Electronic and Control Engineering, Beijing Jiaotong University, Beijing 010044, China
2
State Key Laboratory of Mechanical Behavior and System Safety of Traffic Engineering Structures, Shijiazhuang Tiedao University, Shijiazhuang 050043, China
*
Author to whom correspondence should be addressed.
Appl. Sci. 2021, 11(1), 9; https://doi.org/10.3390/app11010009
Submission received: 12 November 2020 / Revised: 18 December 2020 / Accepted: 18 December 2020 / Published: 22 December 2020
(This article belongs to the Special Issue Monitoring and Maintenance Systems for Railway Infrastructure)

Abstract

:

Featured Application

The proposed method of this paper is for the fault diagnosis of railway wheelset bearings.

Abstract

A wheelset bearing is one of the main components of the train bogie frame. The early fault detection of the wheelset bearing is quite important to ensure the safety of the train. Among numerous diagnostic methods, envelope analysis is one of the most effective approaches in the detection of bearing faults which has been amply applied, but its validity greatly depends on the informative frequency band (IFB) determined. For the wheelset bearing faulty signal, it is often difficult to identify the IFB and extract fault characteristics due to the influence of complex operating conditions. To address this problem, a novel method to select optimal IFB, called the Mkurtogram, is proposed for railway wheelset bearings fault diagnosis. It takes the multipoint kurtosis (Mkurt) of unbiased autocorrelation (AC) of the squared envelope signal generated from sub-bands as assessment indicator for the first time. The fundamental concept which inspires this proposed method is to make full use of regular periodicity of AC of squared envelope signal. In the AC domain, the impulsiveness and periodicity, two distinctive signatures of the repetitive transients, have achieved a united representation by Mkurt. A simulated signal with multiple interferences and two experimental signals collected from wheelset bearings are applied to verify its performances and advantages. The results indicate that the proposed method is more effective to extract the wheelset bearings fault feature under complex interferences. It can not only decrease the influence of large impulse interference and the discrete harmonics interference, but also effectively overcome the influence of amplitude fluctuation caused by variable working conditions. Moreover, based on the periodic directivity of Mkurt, the proposed method also can be applied to the compound faults diagnosis of the wheelset bearing.

1. Introduction

The condition monitoring of railway infrastructure and vehicles is very important to ensure the safe operation of trains, which has gradually attracted considerable attention in recent years [1,2,3]. Among them, the wheelset bearing, as one of the key rotating elements in the bogie frame of high-speed or heavy-duty locomotives, working status has a significant impact on the safety of the vehicle [4,5,6]. Hence, it is essential to the diagnosis of the wheelset bearing’s damage in its initial stages for preventing potential accidents [7,8]. For the fault feature extraction of bearings, vibration-based analysis has developed into an effective approach after the development of recent years [9,10]. However, influenced by the complex wheel/rail excitation and the severe operating condition, the fault-related repetitive impulses are usually submerged by strong background noise and complex harmonic interferences, which bring some difficulties for the early fault detection of the wheelset bearing. When a local defect occurs on the contact surfaces of the bearing, a typical feature is that the fault-induced repetitive transients are modulated in a high-frequency resonance band related to the machine structure [11]. Therefore, a valid strategy for the extraction of fault-induced repetitive transients is to determine an IFB to filter the vibration signal [12,13,14]. However, how to choose the IFB adaptively is still a difficult problem.
In order to determine the IFB adaptively, Antoni proposed the spectral kurtosis (SK)-based method [15] and fast kurtogram (FK) [16], in which the kurtosis of the filtered time signal is taken to extract the impulse-like characteristics from bearing fault signal. Up to now, SK-based kurtogram and FK have been widely used in the fault diagnosis of rotating machinery, such as railway locomotives, wind turbines, excavating machinery, and so on. Afterwards, several research works have been made to improve the validity and stability of the kurtogram. On one hand, more accurate bandpass filters have been developed to improve the effect of decomposition (e.g., multiwavelets [17], wavelet packet transform (WPT) [18,19], dual-tree wavelets [20,21], maximal overlap discrete WPT (MODWPT) [22], dynamic Bayesian wavelet transform [23], tunable Q-factor wavelet transform [24,25], etc.). On the other hand, more robust indicators are adopted to estimate the impulse-like characteristics of the filtered time signal. Bozchalooi proposed a novel smoothness index-based method to select the wavelet parameter to de-noise, and its performance is verified by bearing experimental signal [26]. Miao used the Gini index to generate kurtograms for bearing fault feature extraction [27]. Gryllias utilized a peak energy to choose the appropriate morlet wavelet parameters for the demodulation of bearing vibration signal [28]. Wang proposed spectral L2/L1 norm for characterizing non-stationary signals, and then some extensions of spectral L2/L1 norm are also generalized to bearing fault diagnosis [29,30]. Antoni extended the applicability of the kurtogram by negentropy, which inspired by idea derived from the field of thermodynamics [31]. Although the validity of these methods have been extensively verified, one of the most severe limitations of the kurtogram is still unsolved, that is, it is powerless to determine whether a sequence of transients is periodic or not [31,32]. Recently, Wang [30] demonstrated that all of the L2/L1 norm, SK, Gini, and the reciprocal of smoothness can be regarded as a monotonically incremental functions of the maximum squared envelope by a strict mathematical derivation, which implies that the above indicators are easily disturbed by the large impulse interference. Therefore, when the faulty bearing signal contains large impulse interference, the stability of the above methods based on the impulse-like characteristics will be greatly reduced.
To overcome the above-mentioned drawbacks, some researchers have shifted the focus to the cyclostationarity of the repetitive transients. The protrugram [32] and enhanced kurtogram [19] were proposed as a breakthrough attempt for the optimal band selection, where the kurtosis of the envelope spectrum is adopted as an indication of repetitive transients. The main innovation is that it takes advantage of the cyclostationarity of repetitive transients in the frequency domain, that is, its envelope spectrum shows an impulsiveness with a series of harmonics. However, new drawback is exposed with in-depth research that it may invalid when the discrete harmonic components, produced by uncorrelated excitation sources, are dominant in the envelope spectrum compared with fault characteristic frequencies [22]. To further utilize the traits of repetitive transients, another attractive method, named Infogram, was proposed by Antoni [31], where the negentropy of the squared envelope and squared envelope spectrum (SES) are respectively generated to measure both the impulsiveness and the cyclostationarity of the repetitive transients. After that, some excellent improvements were proposed to extend the original Infogram. The pareto optimal solution [33] and a grey strategy [34] have been utilized to balance the contributions due to the spectral negentropys generated from two evaluation domains, differ from simply synthesize by the equal weight adopted in original Infogram. Nonetheless, the above-improved methods still inherit the drawbacks that the negentropy of the squared envelope is prone to be disturbed by the large impulse interference and the negentropy of the SES is easily affected by discrete harmonic components. Recently, one of the exciting attempts was proposed Autogram [22], which adopts the kurtosis of AC of the squared envelope of the filtered time signal as an evaluation strategy to determine the IFB. The intensity of the fault-induced repetitive transients is enhanced and the uncorrelated background noise is further decreased after the AC process. However, the Autogram only depicts the impulsiveness of AC of the squared envelope signal through the evaluation indicator of kurtosis. Another significant merit, the periodic property of AC, has not been fully utilized in Autogram, which suggests that it will be sensitive to the discrete harmonic interferences generated by other sources such as shafts, gears and so on. Therefore, although the above methods pay attention to the cyclostationarity of fault-induced repetitive transients and avoid the interference of large impulses, they still can’t avoid the influence of discrete harmonic interference.
According to the above discussion, it can be seen that the determination of IFB is still not a simple matter when there are multiple complex interferences in the faulty signal, such as large impulse interference and discrete harmonic interference. However, influenced by the complex wheel/rail excitation and the complex vibration transmission, the wheelset bearing faulty signal usually contains multiple complex interferences. In order to decrease the effect of multiple complex interferences on the selection of the IFB, a novel approach, named Mkurtogram, is proposed for the railway wheelset bearings fault diagnosis in this paper. It takes the Mkurt [35,36] of unbiased AC of the squared envelope signal generated from sub-bands as assessment indicator for the first time. The AC process is firstly used to decrease the large impulses interference and enhance the strength of the fault-induced repetitive transients. Then, based on the regular periodic distribution of fault-related peaks in AC domain, a unified representation of the impulsiveness and periodicity is performed by MKurt, thus, the influence of irrelevant discrete harmonic interferences is further eliminated. Moreover, based on the periodic directivity of Mkurt, the proposed method also can be applied to the compound faults diagnosis of the wheelset bearing.
The paper is organized as follows: A novel method for fault diagnosis of wheelset bearing is presented in Section 2. In Section 3, a simulated signal with multiple interferences is applied to testify the validity of the proposed method. Moreover, experimental data collected from two different wheelset bearing test rigs are taken to verify the validity and advantages of the proposed method. At last, some conclusions are proposed in Section 4.

2. The Proposed Approach for Fault Diagnosis of Wheelset Bearing

The usage of kurtosis as the assessment index to identify the optimal IFB has gained extensive attentions, of which FK is a typical benchmark. However, it is powerless to estimate whether a sequence of transients is periodic or not, which has reduced its effectiveness to some extent. Therefore, in some cases, the kurtosis easily leads to a wrong result, and the typical situation is that when there is high randomly impulse noise in the filtered signal or the repetition rate of the cyclic impulses is high [32]. To improve the traditional kurtogram, Autogram provides a new procedure in which the kurtosis of AC of squared envelope signal is adopted to reduce the interference generated by impulse noise in the filtered time signal. It is no doubt that the SNR can be improved in the AC domain, and a more stable result will be gained. However, this method still inherits the drawbacks of kurtosis, which suggests that it still be sensitive to the cyclostationary noise and the new outliers imposed in the AC domain. In Section 2.3, another unique trait will be further revealed that the fault-induced impulses are regularly reordered in the AC domain, which is important to estimate the presence of a fault and is underutilized in Autogram. In order to better extract the wheelset bearing fault-induced repetitive transients, this special periodicity feature is fully utilized in this paper, and the Mkurt is adopted to estimate the intensity of the enhanced and reordered periodic peaks in the AC domain.

2.1. Maximal Overlap Discrete Wavelet Packet Transform

Different from WPT, MODWPT [37,38,39] ignores down-sampling process at each decomposition level and enjoys a full-time resolution, which is indispensable to the implementation of this proposed approach in this paper. In order to introduce the MODWPT understandably, the maximal overlap discrete wavelet transform (MODWT) is introduced at first briefly. MODWT can be seen as a modified edition of the discrete wavelet transform (DWT), which is a highly redundant non-orthogonal wavelet transform and does not have a strict requirement for the sample length of N [39]. Here, {gl, l = 0, 1, …, L−1} and {hl, l = 0, 1, …, L−1} are assumed as low-pass and high-pass filters of MODWT, and L represents the length of the filter. gl and hl satisfy the equation constraints as follows:
l = 0 L 1 g l 2 = 1 2 , l = 0 L 1 g l g l + 2 n = + g l g l + 2 n = 0 h l = ( 1 ) l g L l 1 ,   g l = ( 1 ) l + 1 h L l 1
In order to overcome the shortcoming that the points of signal data half at each decomposition level due to down-sampling process, a new filter at different jth level by inserting 2j−1 zeros in {gl} and {hl}is rebuilt by MODWT:
{ g ¯ l } = { g 0 , 0 , , 0 , g 1 , 0 , , 0 , , g L 2 , 0 , , 0 , g L 1 } { h ¯ l } = { h 0 , 0 , , 0 , h 1 , 0 , , 0 , , h L 2 , 0 , , 0 , h L 1 }
Based on Mallat pyramid algorithm, the jth level scaling transform coefficients Vj,t, and wavelet transform coefficients Wj,t of MODWT are as follows:
V j , t ' = l = 0 L 1 g ¯ l V j 1 , ( t 2 j 1 l ) mod N ( t = 0 , , N 1 ) W j , t ' = l = 0 L 1 h ¯ l V j 1 , ( t 2 j 1 l ) mod N ( t = 0 , , N 1 )
Similar to DWT, MODWT also cannot decompose the high-frequency band of the signal. As we know, the discrete wavelet packet transform (DWPT) can make up for the drawback that the DWT can’t further decompose the high-frequency band. Therefore, similar to the DWPT deriving from DWT method, the MODWPT is developed on the basis of MODWT to further decompose the high-frequency band. The MODWPT not only has all the advantages of MODWT, but can also decompose the high-frequency band. The MODWPT coefficients Wj,n can be calculated as:
W j , n , t = l = 0 L 1 r n , t W J 1 , [ n / 2 ] , ( t 2 j 1 l ) mod N ( t = 0 , , N 1 ) r n , t = { g ¯ l ,   if   n mod 4 = 0   or   3   ; h ¯ l ,   if   n mod 4 = 1   or   4   .
where j is the decomposition level, and n is the number of frequency bands under each decomposition level.

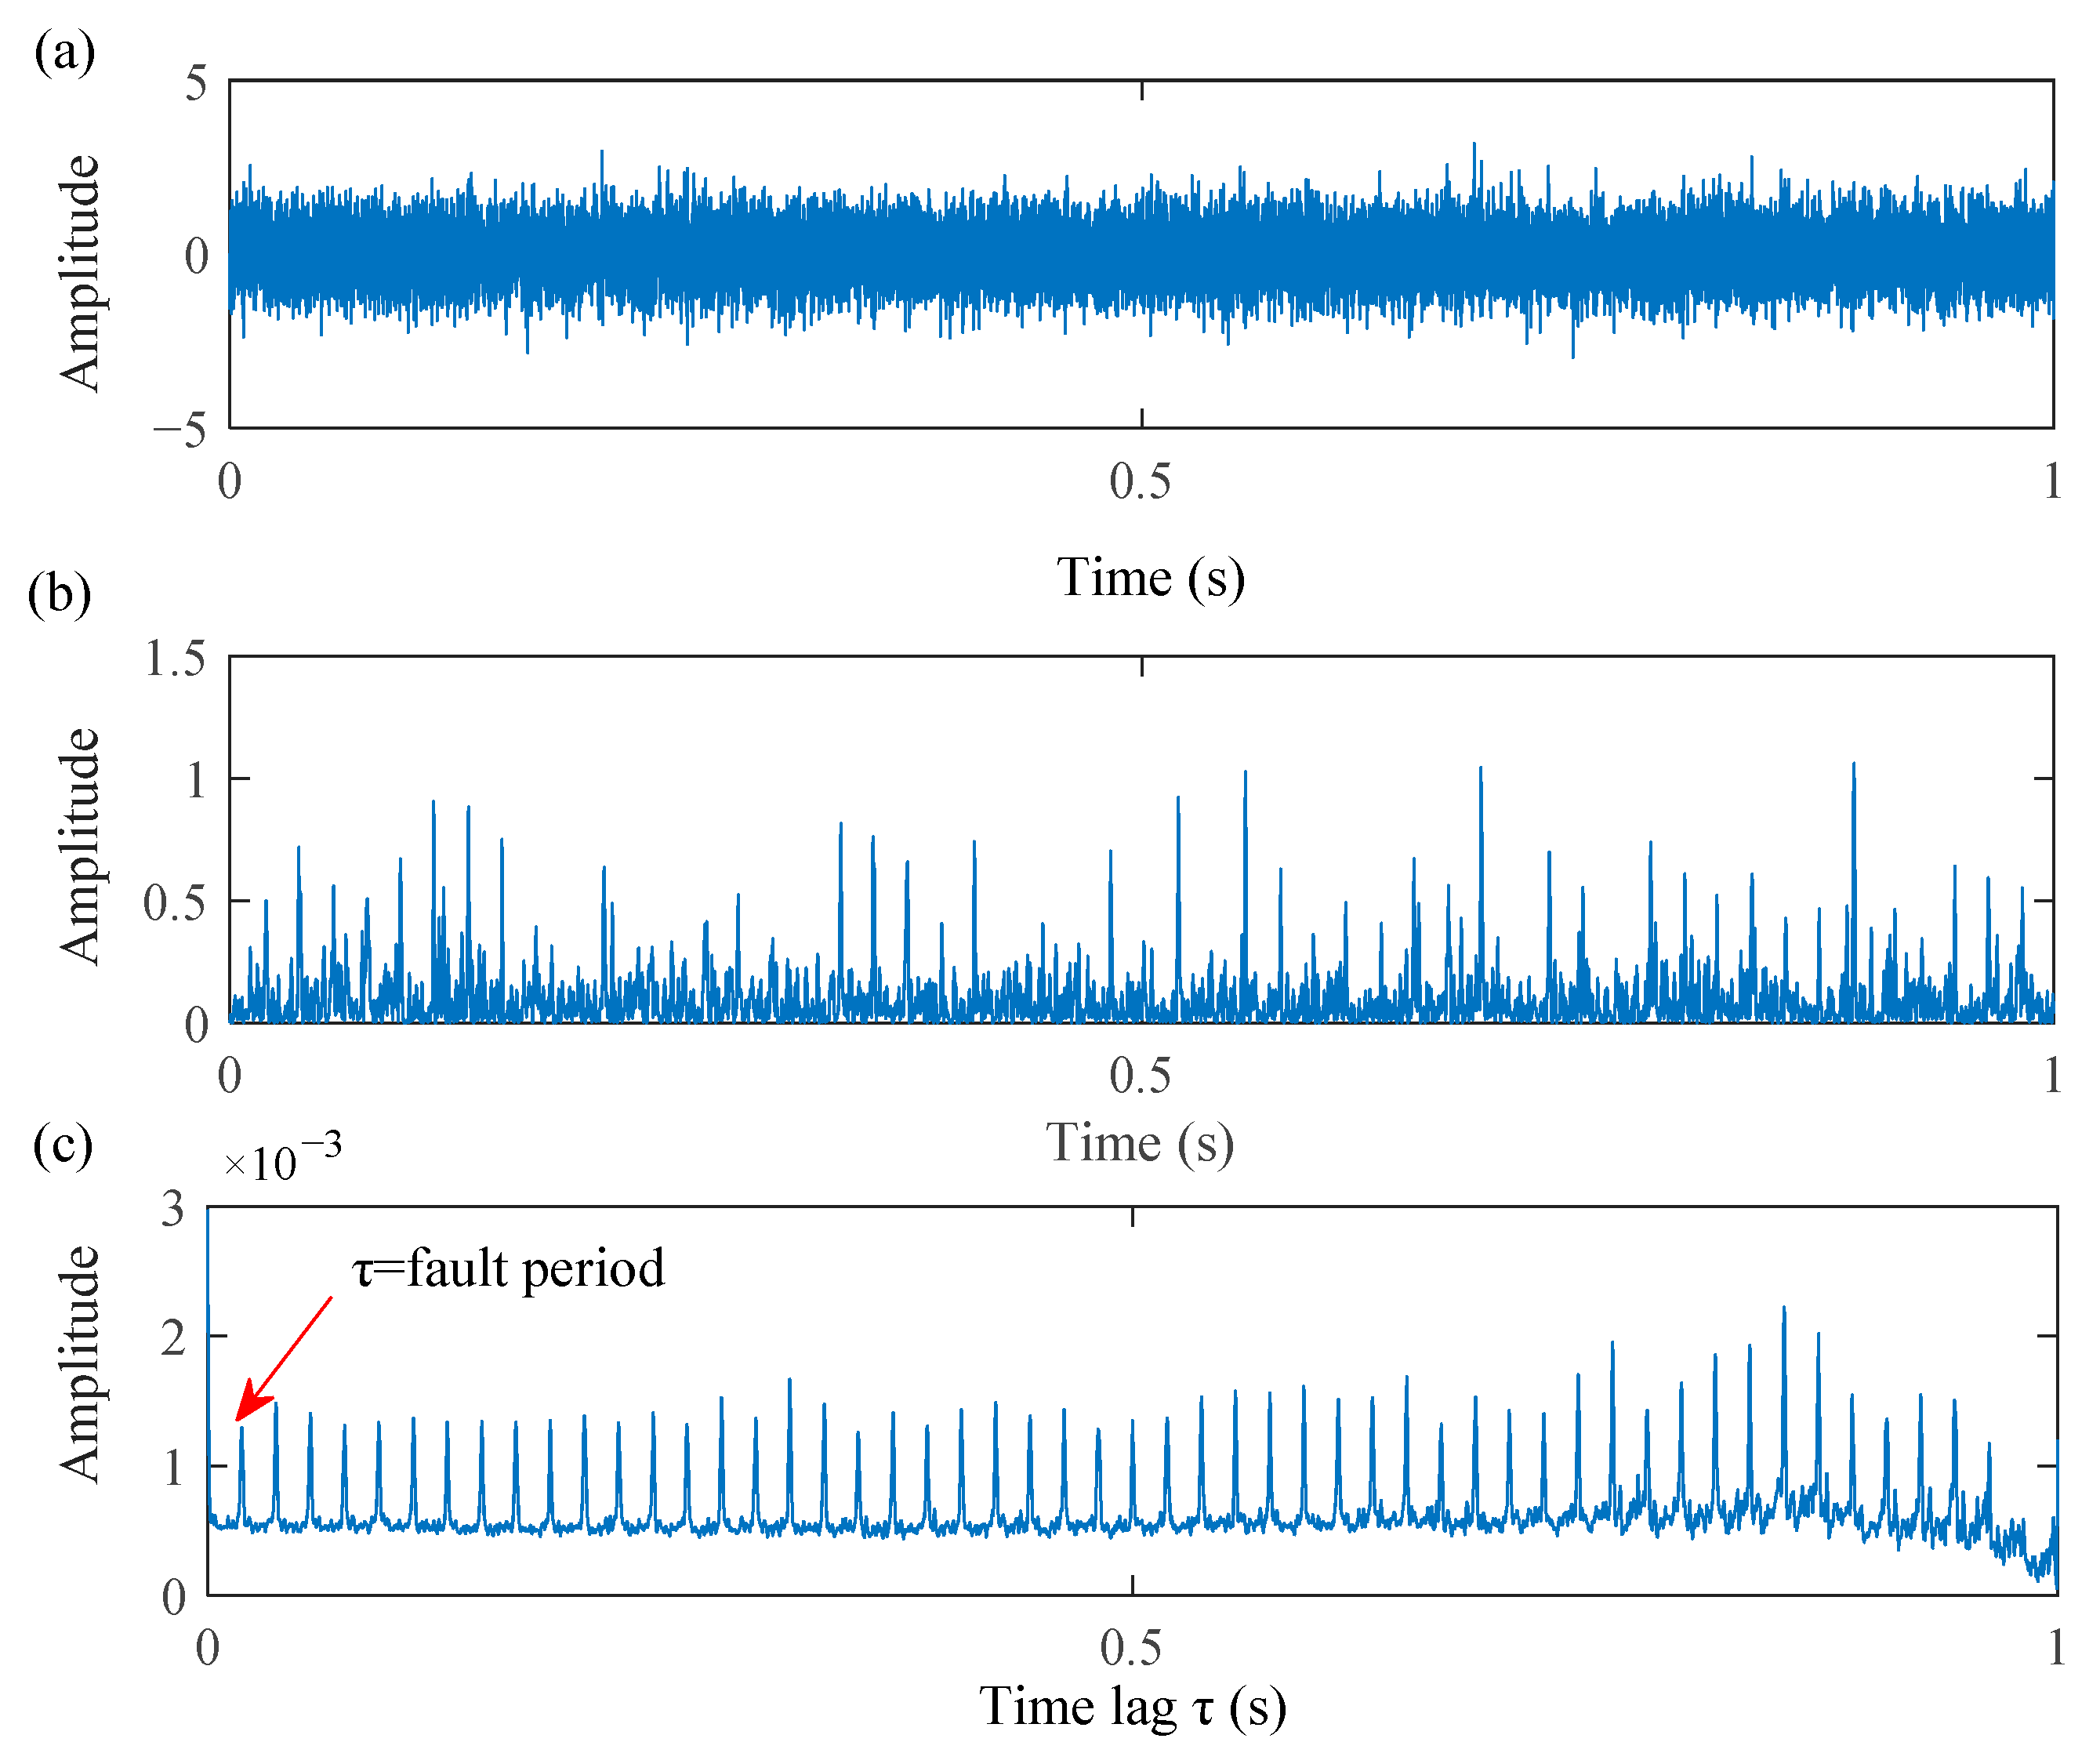
2.2. The Noise Reduction Signature of AC Process

The AC process is an adaptive noise reduction strategy, which has been extensively applied. Its advantage mainly benefits from the property that the Gaussian white noise in the signal declines rapidly to 0 as the time lag τ increases. The definition of AC of a signal x(n) can be described as follows:
R ( τ ) = 1 N n = 1 N x ( n ) x ( n + τ )
For bearings with a local fault, its vibration signal, apart from the fault-induced repetitive transients, usually contains multiple harmonic interference components generated from other rotating parts and strong background noise [40]. Therefore, the vibration signal derived from a defective bearing can be expressed as:
y ( n ) = x ( n ) + h ( n ) + w ( n )
where x(n) signifies the fault-induced repetitive transients, h(n) represents harmonic interference and w(n) signifies background noise. As a result, the AC of the compound signal y(n) can be expressed as:
R y y ( τ ) = 1 N n = 1 N y ( n ) y ( n + τ ) = 1 N n = 1 N [ x ( n ) + h ( n ) + w ( n ) ] [ x ( n + τ ) + h ( n + τ ) + w ( n + τ ) ] = R x x ( τ ) + R x h ( τ ) + R x w ( τ ) + R h x ( τ ) + R h h ( τ ) + R h w ( τ ) + R w x ( τ ) + R w h ( τ ) + R w w ( τ )
Since the Gaussian white noise is random, Rww(τ) is approximately 0. Due to the periodic signal x(n), harmonic interference h(t) and background noise w(t) are independent from each other, thus, the cross-correlation among them are can be ignored: Rxh(τ) ≈ 0, Rxw(τ) ≈ 0, Rhx(τ) ≈ 0, Rhw(τ) ≈ 0, Rwx(τ) ≈ 0, Rwh(τ) ≈ 0. Consequently, the influential contribution to the final result Ryy(τ) just remains two terms: Rxx(τ) and Rhh(τ):
R y y ( τ ) R x x ( τ ) + R h h ( τ )
Therefore, the AC process can realize noise cancellation and periodic signal enhancement.

2.3. The Regular Distribution of the Periodic Peaks after AC Process

In addition to the property of noise reduction, AC process [41] can also change the arrangement of periodic impulses. Provided a periodic signal x(n) has a fault period 2L, it can be expressed by the sum of the cosines and sines as:
x ( n ) = a 0 + k = 1 N ( a k cos ( 2 π k L n ) + b k sin ( 2 π k L n ) ) = a 0 + k = 1 N [ a k 2 + b k 2 cos ( 2 π k L n arctan b k a k ) ] ,   N 1
The AC process of x(n) can be described as:
R x x ( τ ) = 1 2 L n = L L 1 x ( n ) x ( n + τ ) = 1 2 L n = L L 1 [ a 0 + k = 1 N ( a k cos 2 π k L n + b k sin 2 π k L n ) ] [ a 0 + k = 1 N ( a k cos 2 π k L ( n + τ ) + b k sin 2 π k L ( n + τ ) ) ] = a 0 2 + k = 1 N ( a k 2 + b k 2 2 cos 2 π k L τ )
The AC of a periodic signal is still a periodic signal and it shares a same period 2L with the original signal. In addition, another quality of AC process is revealed that the initial phase of the AC signal at time lag τ = 0 is zero, which implies the AC signal is not changed with the initial phase of the original signal. Hence, the positions of the periodic peaks are rearranged in the AC domain, and the first peak will be adjusted to the position of the time lag τ = 2L (fault period) no matter where the first periodic peak appears in the original signal.
In order to better highlight the advantages of AC process, a simple example is generated by a simulated wheelset bearing fault signal with a periodic fluctuation of 2% and a signal-to-noise ratio (SNR) of −15 dB (the bearing model, not explained here, will be displayed in Equations (14) and (15) below). The fault frequency is set as 54 Hz, the resonance frequency band is set as 3200 Hz and he sampling frequency is set as 25.6 kHz. The squared envelope signal resulted from the optimal IFB and its corresponding AC process signal are displayed in Figure 1.
From Figure 1b,c, it is evident that the residual in-band noise is further reduced and fault-related peaks are enhanced after AC process. Furthermore, as depicted in Figure 1c, the positions of the periodic peaks are rearranged and first periodic peak is transferred to the position of the fault period, which is consistent with the theoretical derivation above.

2.4. The Advantages of the Mkurt in Extracting Repetitive Transients

In order to better understand the Mkurt, a short introduction of the kurtosis is presented in this part at first. Kurtosis is a statistical indicator that can be used to quantitatively represent the non-Gaussian of the vibration signal. On account of this property, the impulse-like characteristics of the bearing fault signal can be detected easily. For this reason, the kurtosis has been a popular indicator used to identify the IFB for envelope analysis. Kurtosis can be defined as:
Kurtosis = n = 1 N ( x n ) 4 ( n = 1 N x n 2 ) 2
However, in some cases, the kurtosis is easily interfered. As mentioned in [32], the kurtosis is prone to make a misdiagnosis when there is a relatively strong impulse in the measured signal or the fault-related impulses enjoys a high rate repetition. The main reason lies in that the cyclostationarity attribute of the bearing fault signal is not considered. Different from kurtosis, a target vector tn is adopted in Mkurt, which sets the locations and weightings of the target peaks will to be taken. Mkurt can be defined as follows:
Mkurt = ( n = 1 N t n 2 ) 2 n = 1 N t n 8 n = 1 N ( t n x n ) 4 ( n = 1 N x n 2 ) 2
This definition is derived from kurtosis and has been modified to multiple peaks at specified positions based on the target vector tn. A simple instance, tn = [00001000010000100]T, the target vector tn will be limited only to pick up three peaks in the signal xn: peaks at n = 5, 10, 15. In addition, another outstanding virtue worth mentioning is that the Mkurt is a normalized index so that it will reach to the maximal value 1 provided a candidate input signal xn in the direction of tn is reached. Therefore, the Mkurt has a potential ability to describe the presence and strength of the periodic components with a given period. The detailed derivation of the normalization factor, please refers to [35]. As discussed in Section 2.3, the positions of the periodic peaks are rearranged in the AC domain. Hence, this unique characteristic makes it possible to use Mkurt to identify the strength of concerned fault-related peaks and avoid the impacts of non-interested fault peaks and outliers in the AC domain.

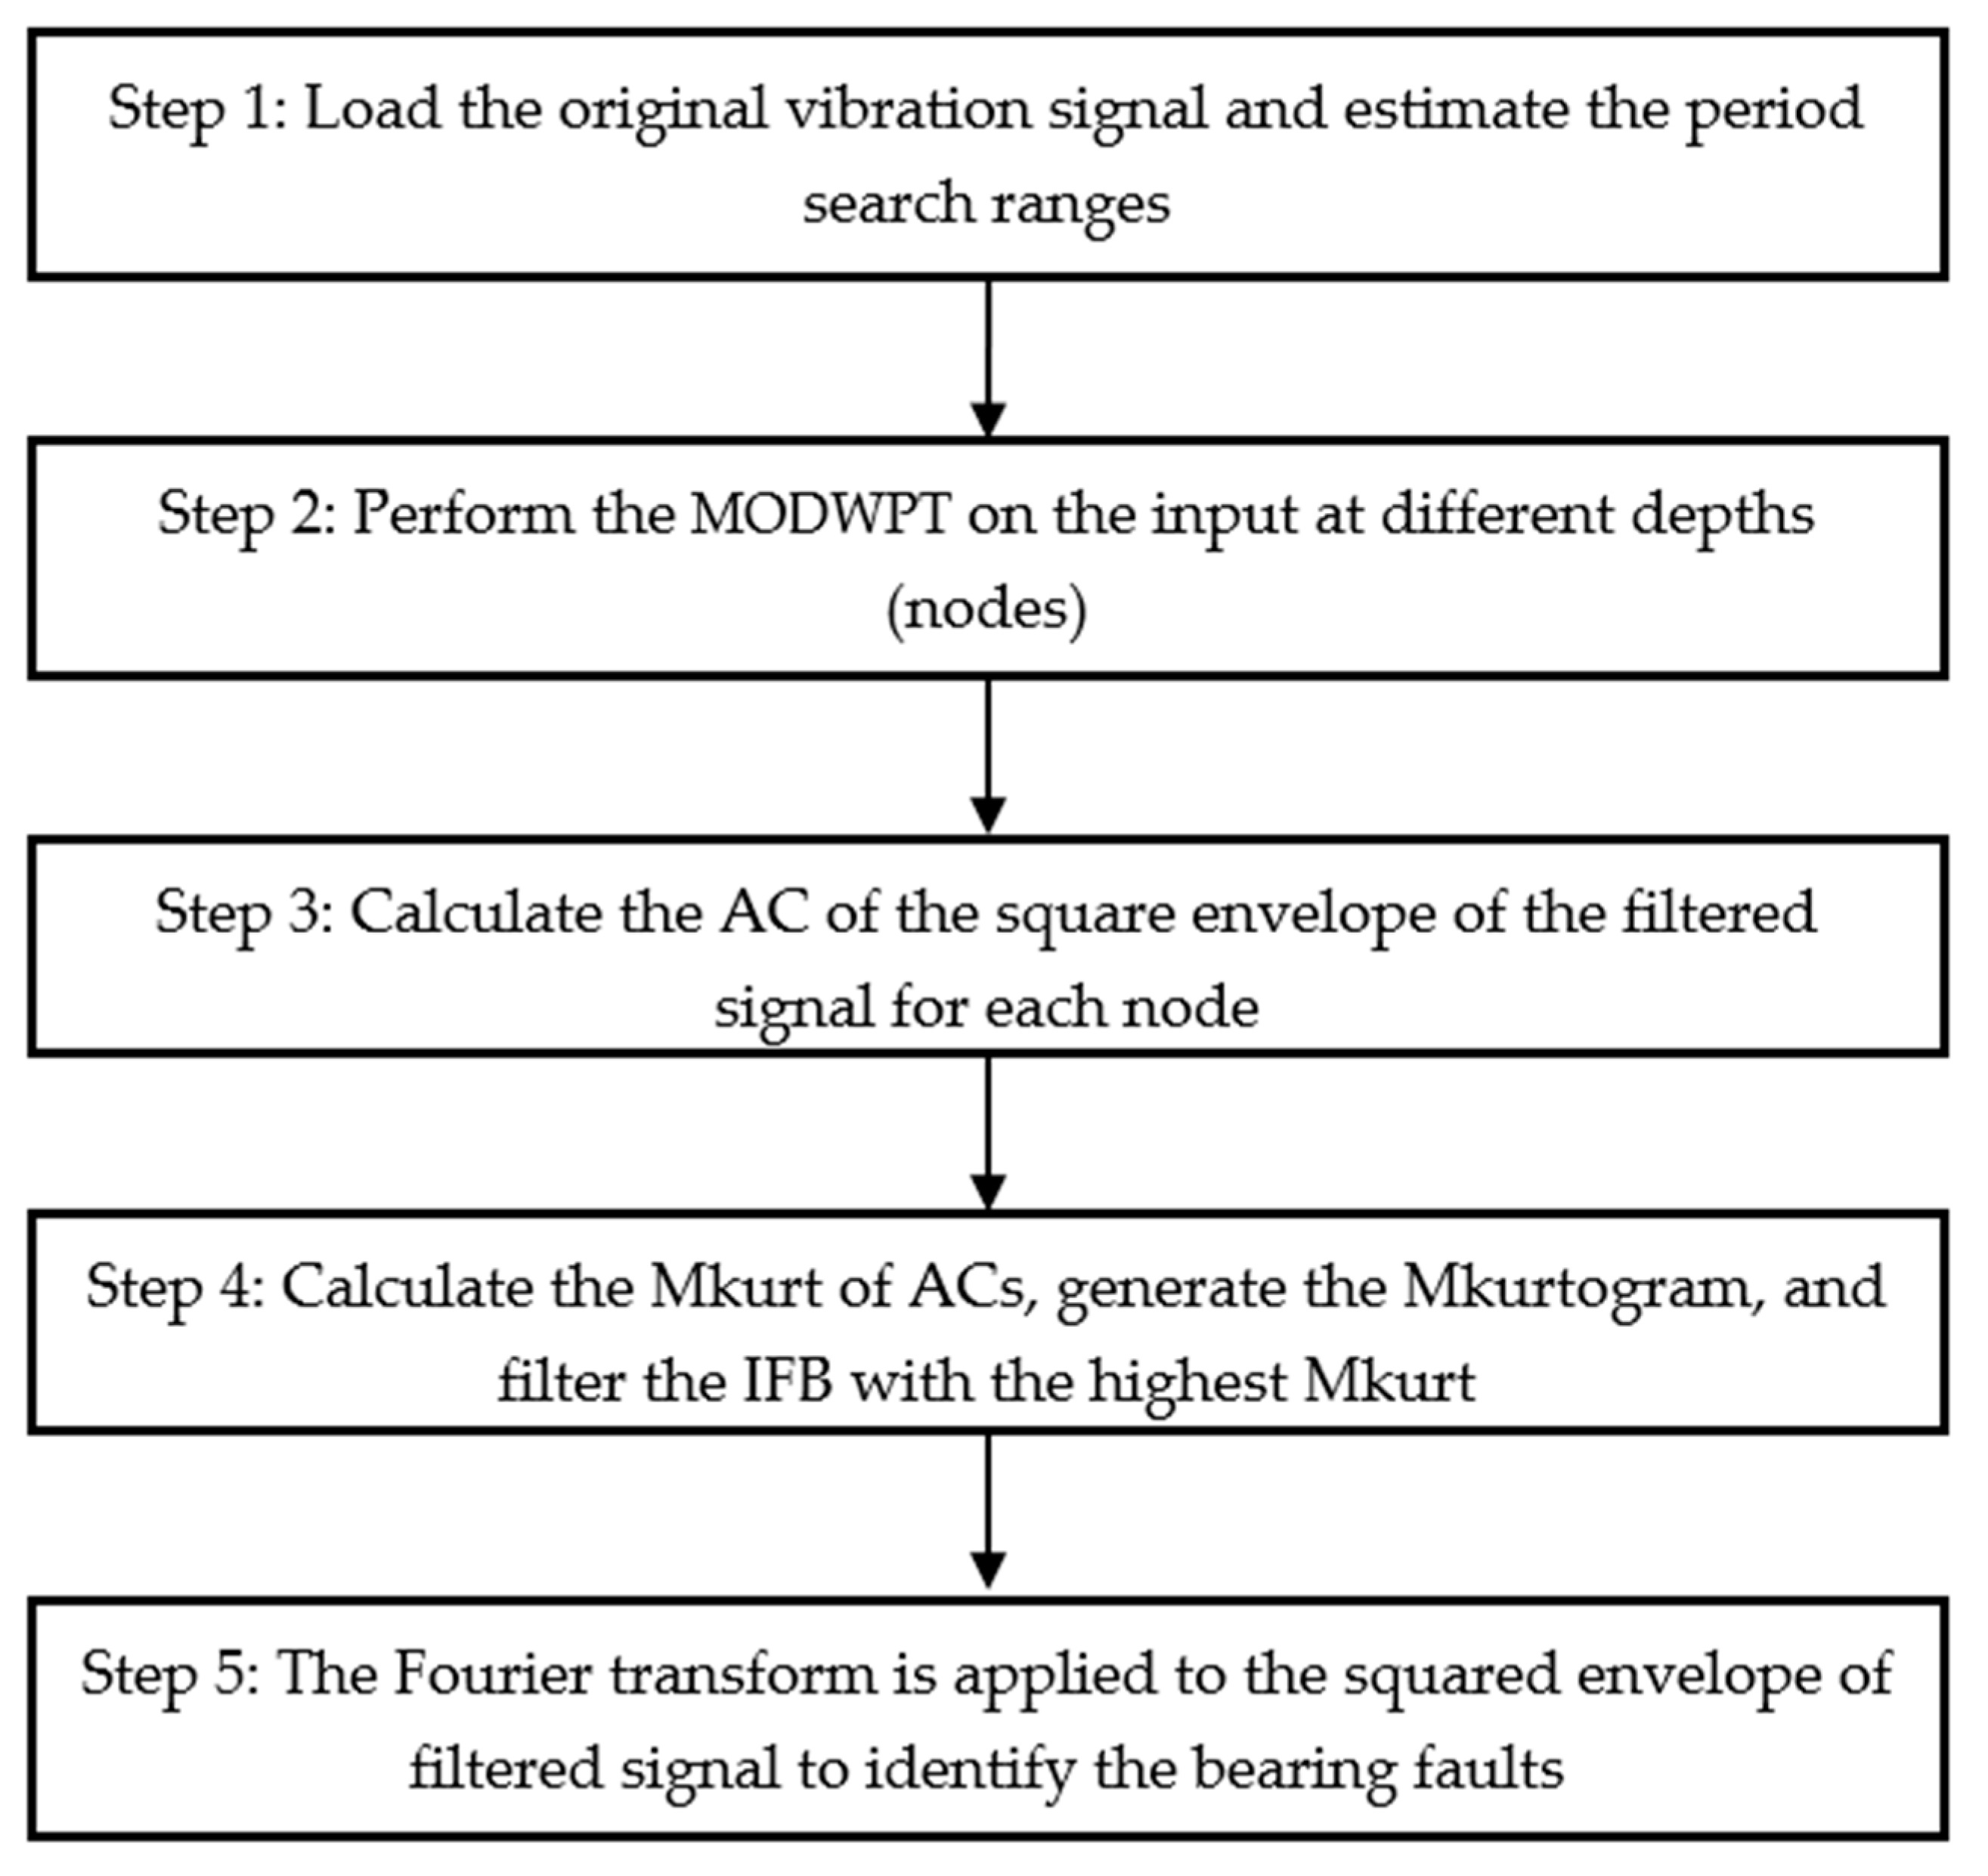
2.5. The Implementation of the Proposed Method

Based on the above principles and discussions, a novel approach to determine the optimal IFB, named MKurtogram, is proposed for wheelset bearing fault diagnosis. This method takes the Mkurt of the AC of the squared envelope of the filtered signal as a new assessment strategy. Based on the directivity of Mkurt, the impulsiveness and periodicity, two distinctive signatures of the repetitive transients, have achieved a united representation, which makes the proposed method immune to both outliers and unconcerned repetitive peaks in the AC domain. The flowchart of the MKurtogram is shown in Figure 2, and the details can be concluded as follows:
Step 1: The original signal obtained by a vibration accelerometer is loaded as an input at first. And then, the fault period T is calculated based on the speed and the structure parameters. The fault period represents the fault sampling period in this paper, that is, the number of sampling points between two adjacent fault-induced impulses. Considering the effect of speed fluctuation and the slips of rolling elements, a small searching zone [T−ΔT, TT] is set as the input fault period and ΔT is generally suggested less than 2–3% of T.
Step 2: The MODWPT is used to decompose the original vibration signal into different depths. Different from DWPT, the down-sampling process is removed in the MODWPT and it enjoys a full-time resolution [22,37,38]. Therefore, at different nodes, the sampling points between two consecutive fault-induced impulses are always consistent, which is indispensable to the implementation of this proposed approach. Besides, the bandwidth of the wavelet packet coefficients at the largest scale is advised to be three times greater than the inner race fault characteristic frequency (FCF) in order that adequate fault-related information will be reserved.
Step 3: The unbiased AC is conducted on the squared envelope of the demodulation signal for all nodes, where the filtered signals are collected from Step 2. As shown in Figure 1c, with increasing of the delay factor τ, the remaining number of signal samples for generating the AC will be less, and the later results may be distorted due to the lack of a sufficient estimation variance. Consequently, a portion of the rear AC will be cut out for a stable investigation [22].
Step 4: The Mkurt of the ACs are calculated based on the input fault period, and then MKurtogram is generated by employing values of the Mkurt of each node. The node with the maximal Mkurt is picked out as the optimal IFB to filter the signal.
Step 5: The Fourier transform is applied to the squared envelope of filtered signal to identify the bearing faults.

3. Simulation and Experimental Verification

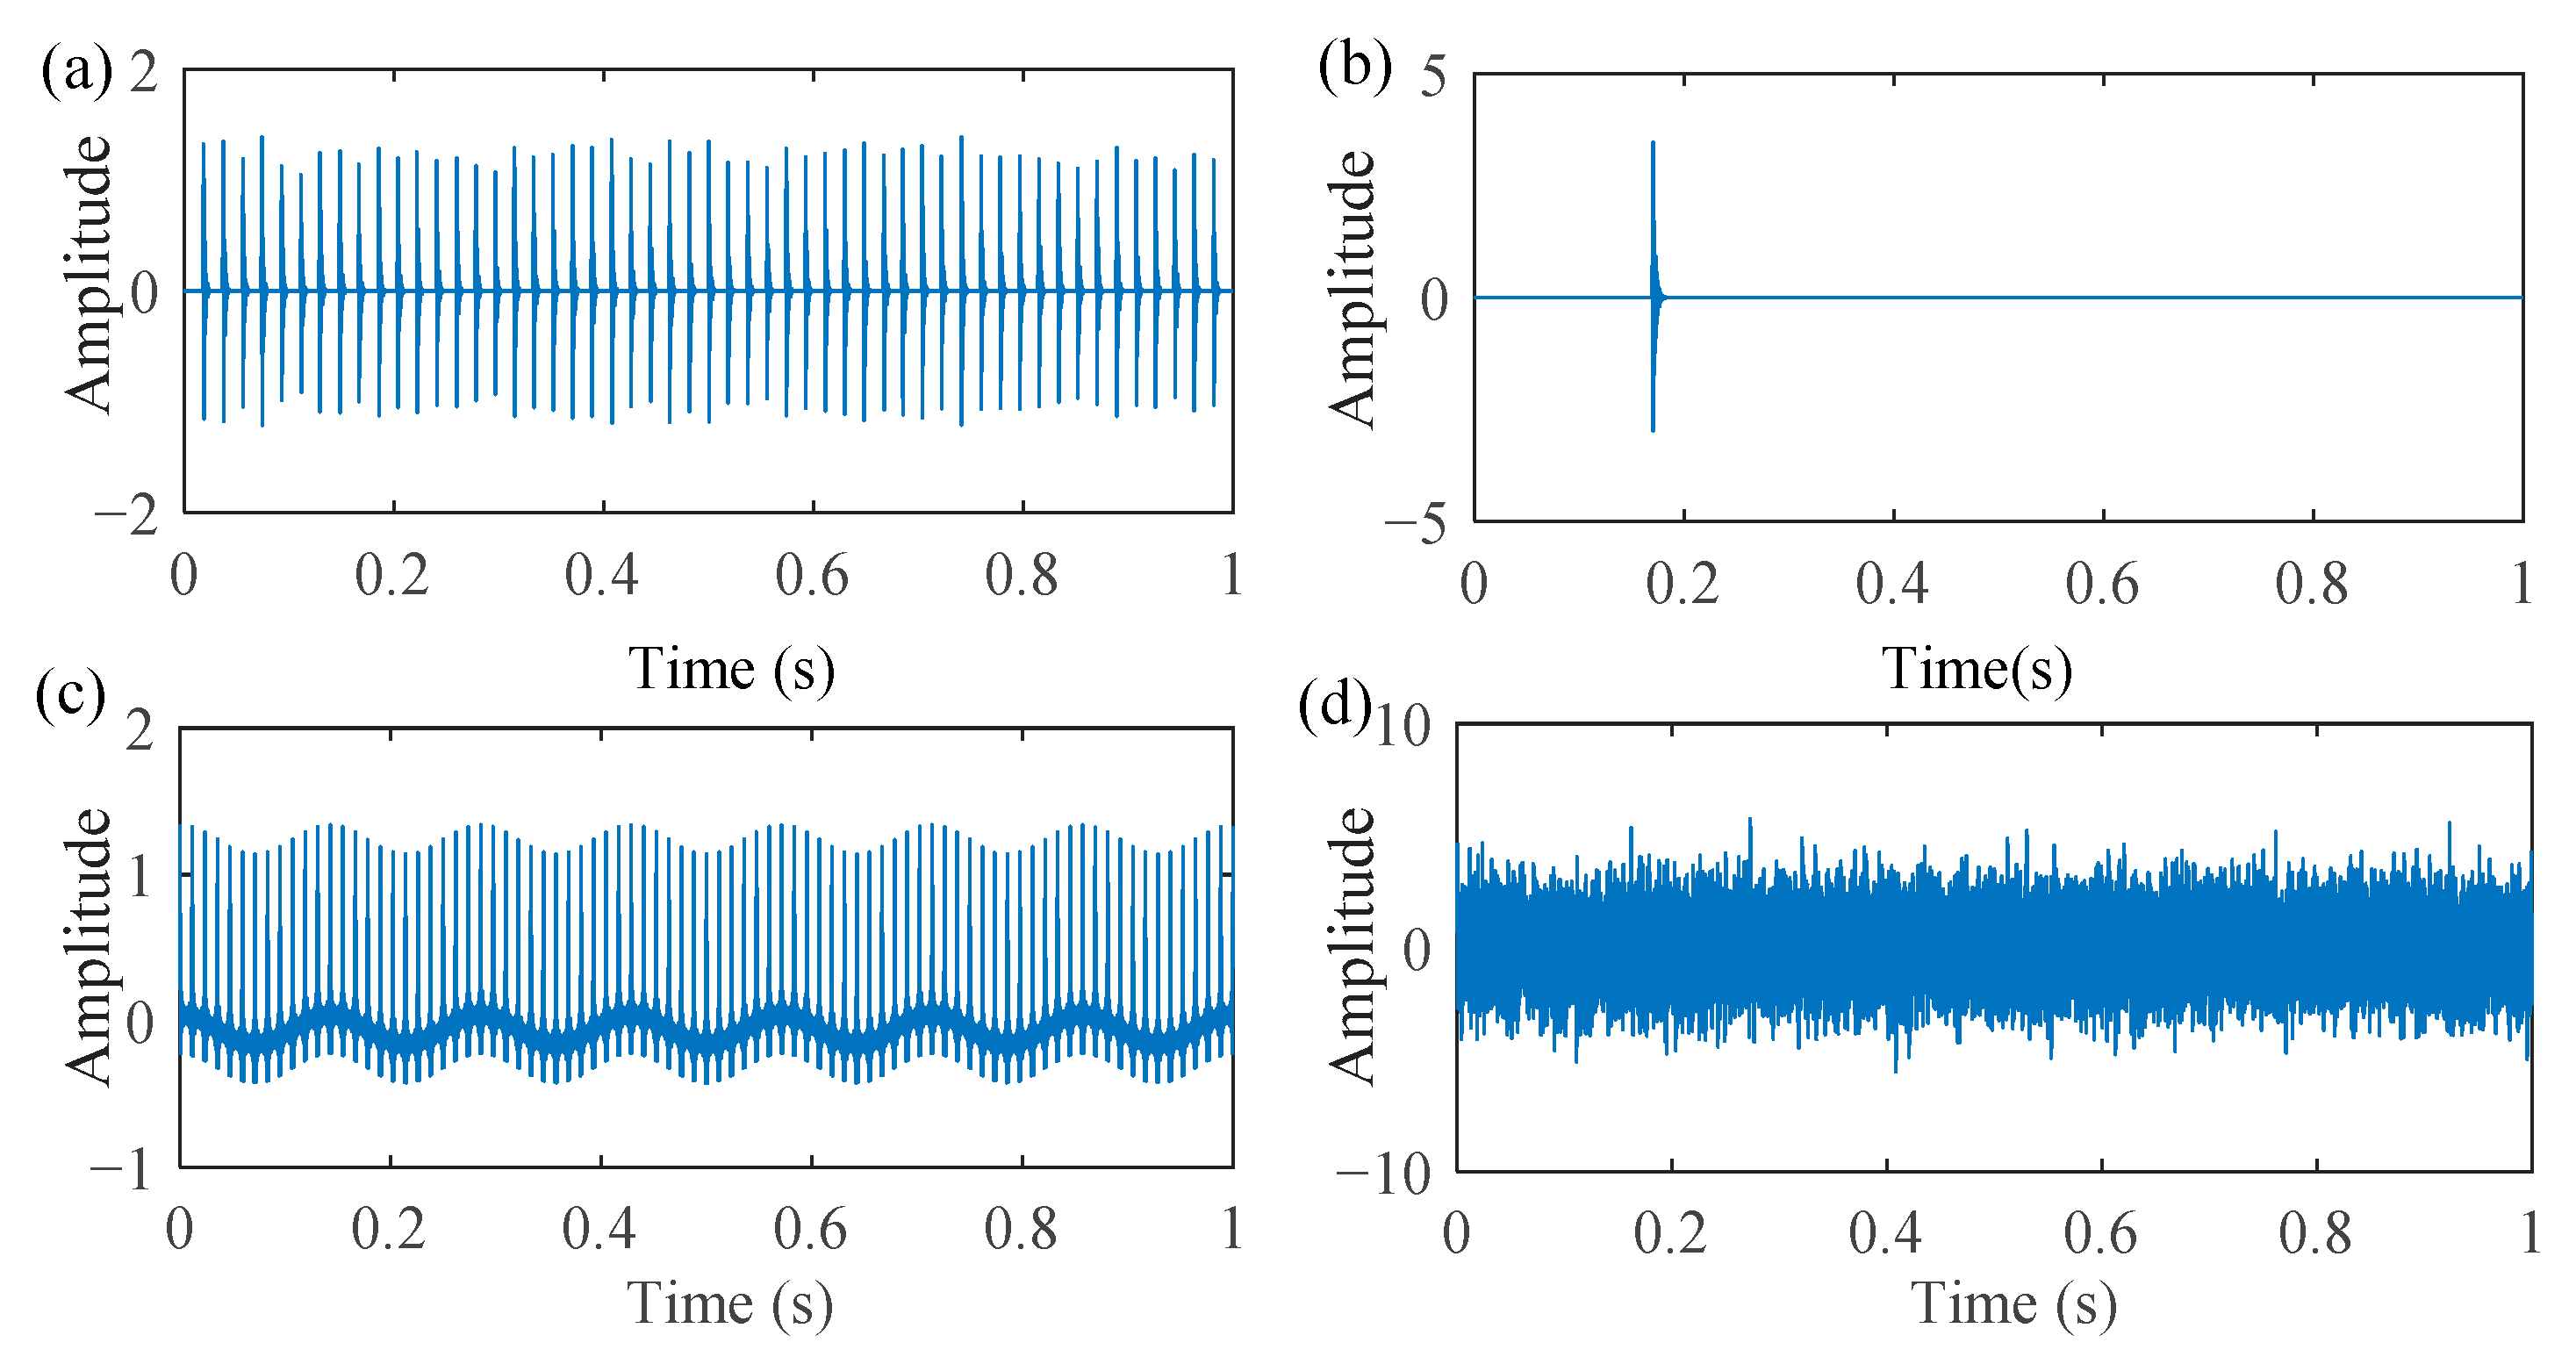
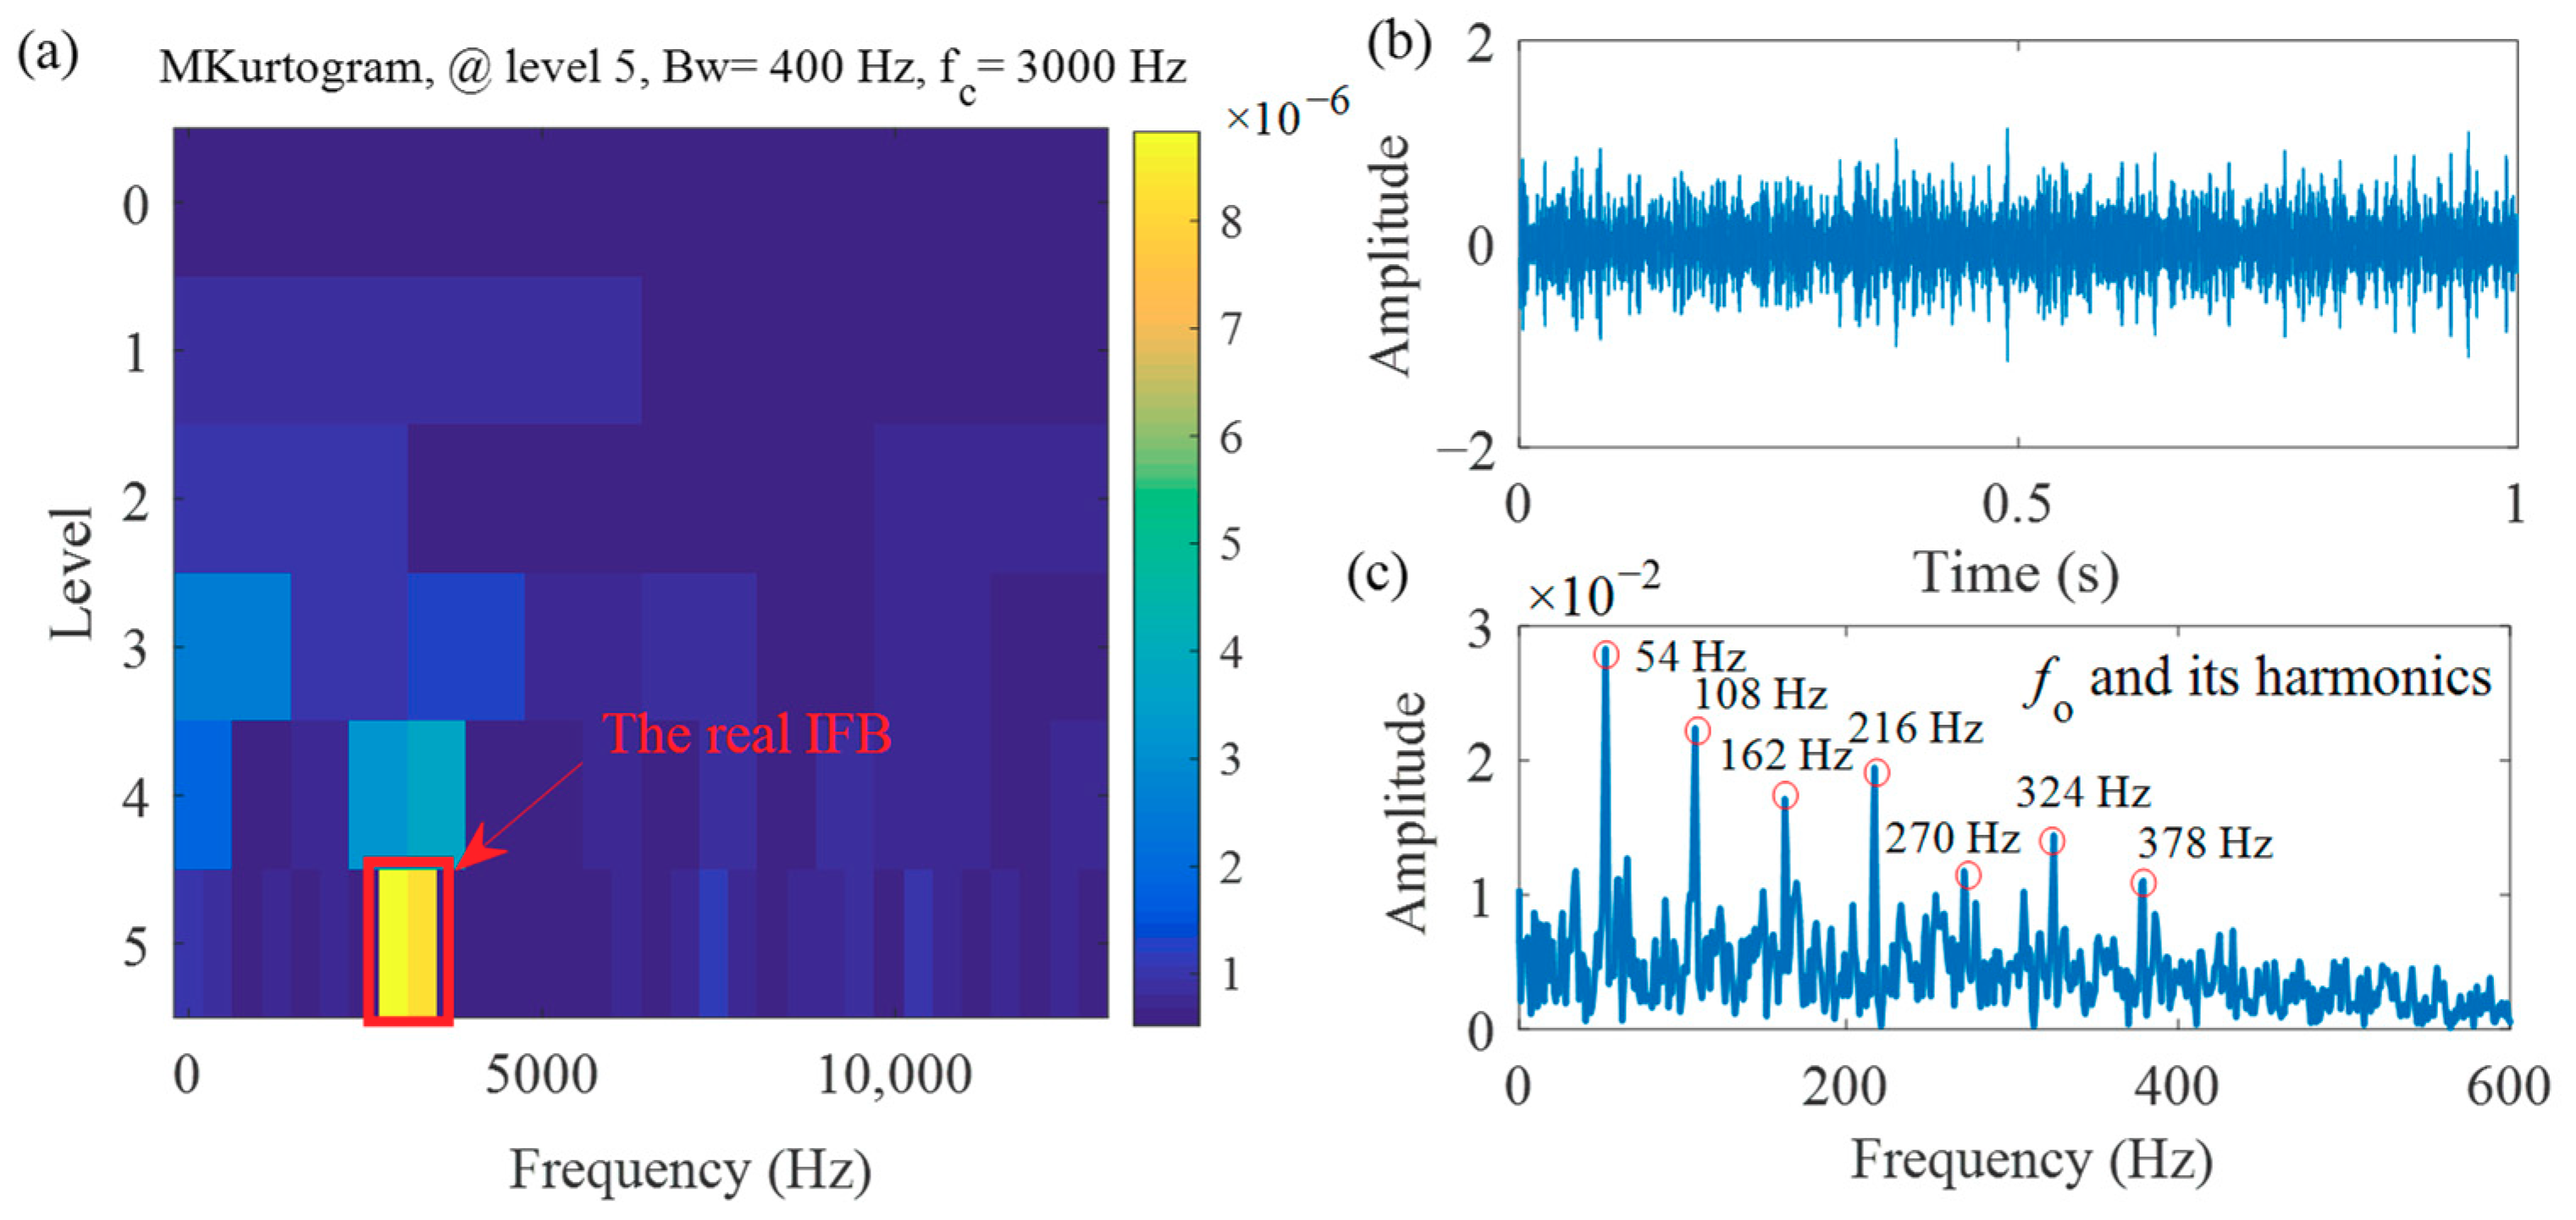
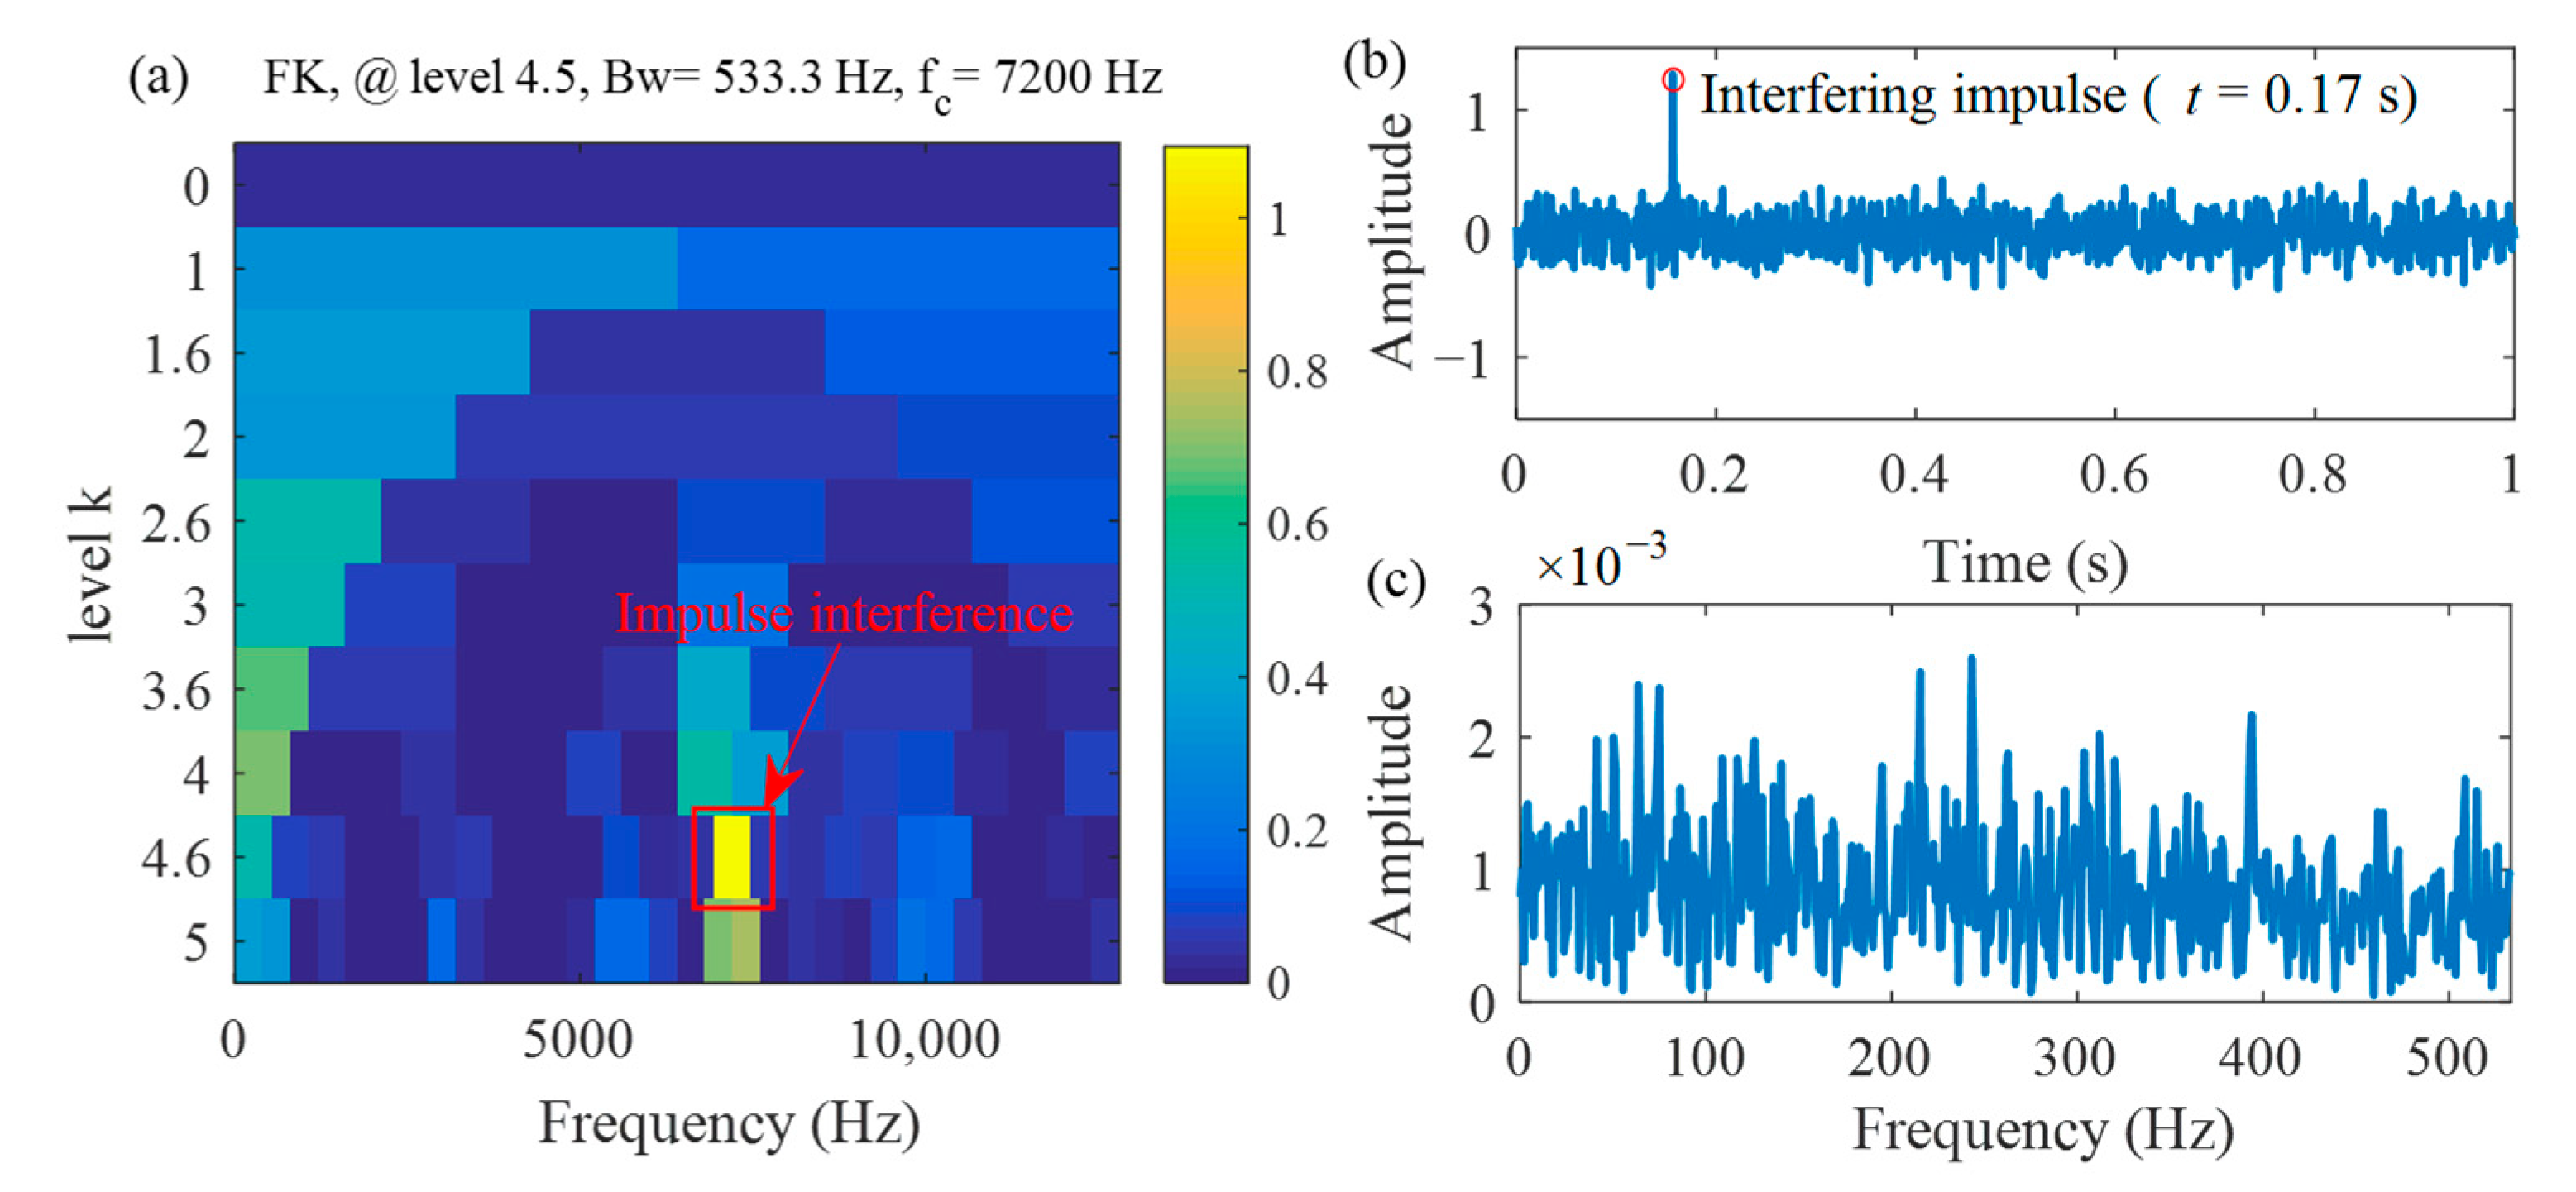
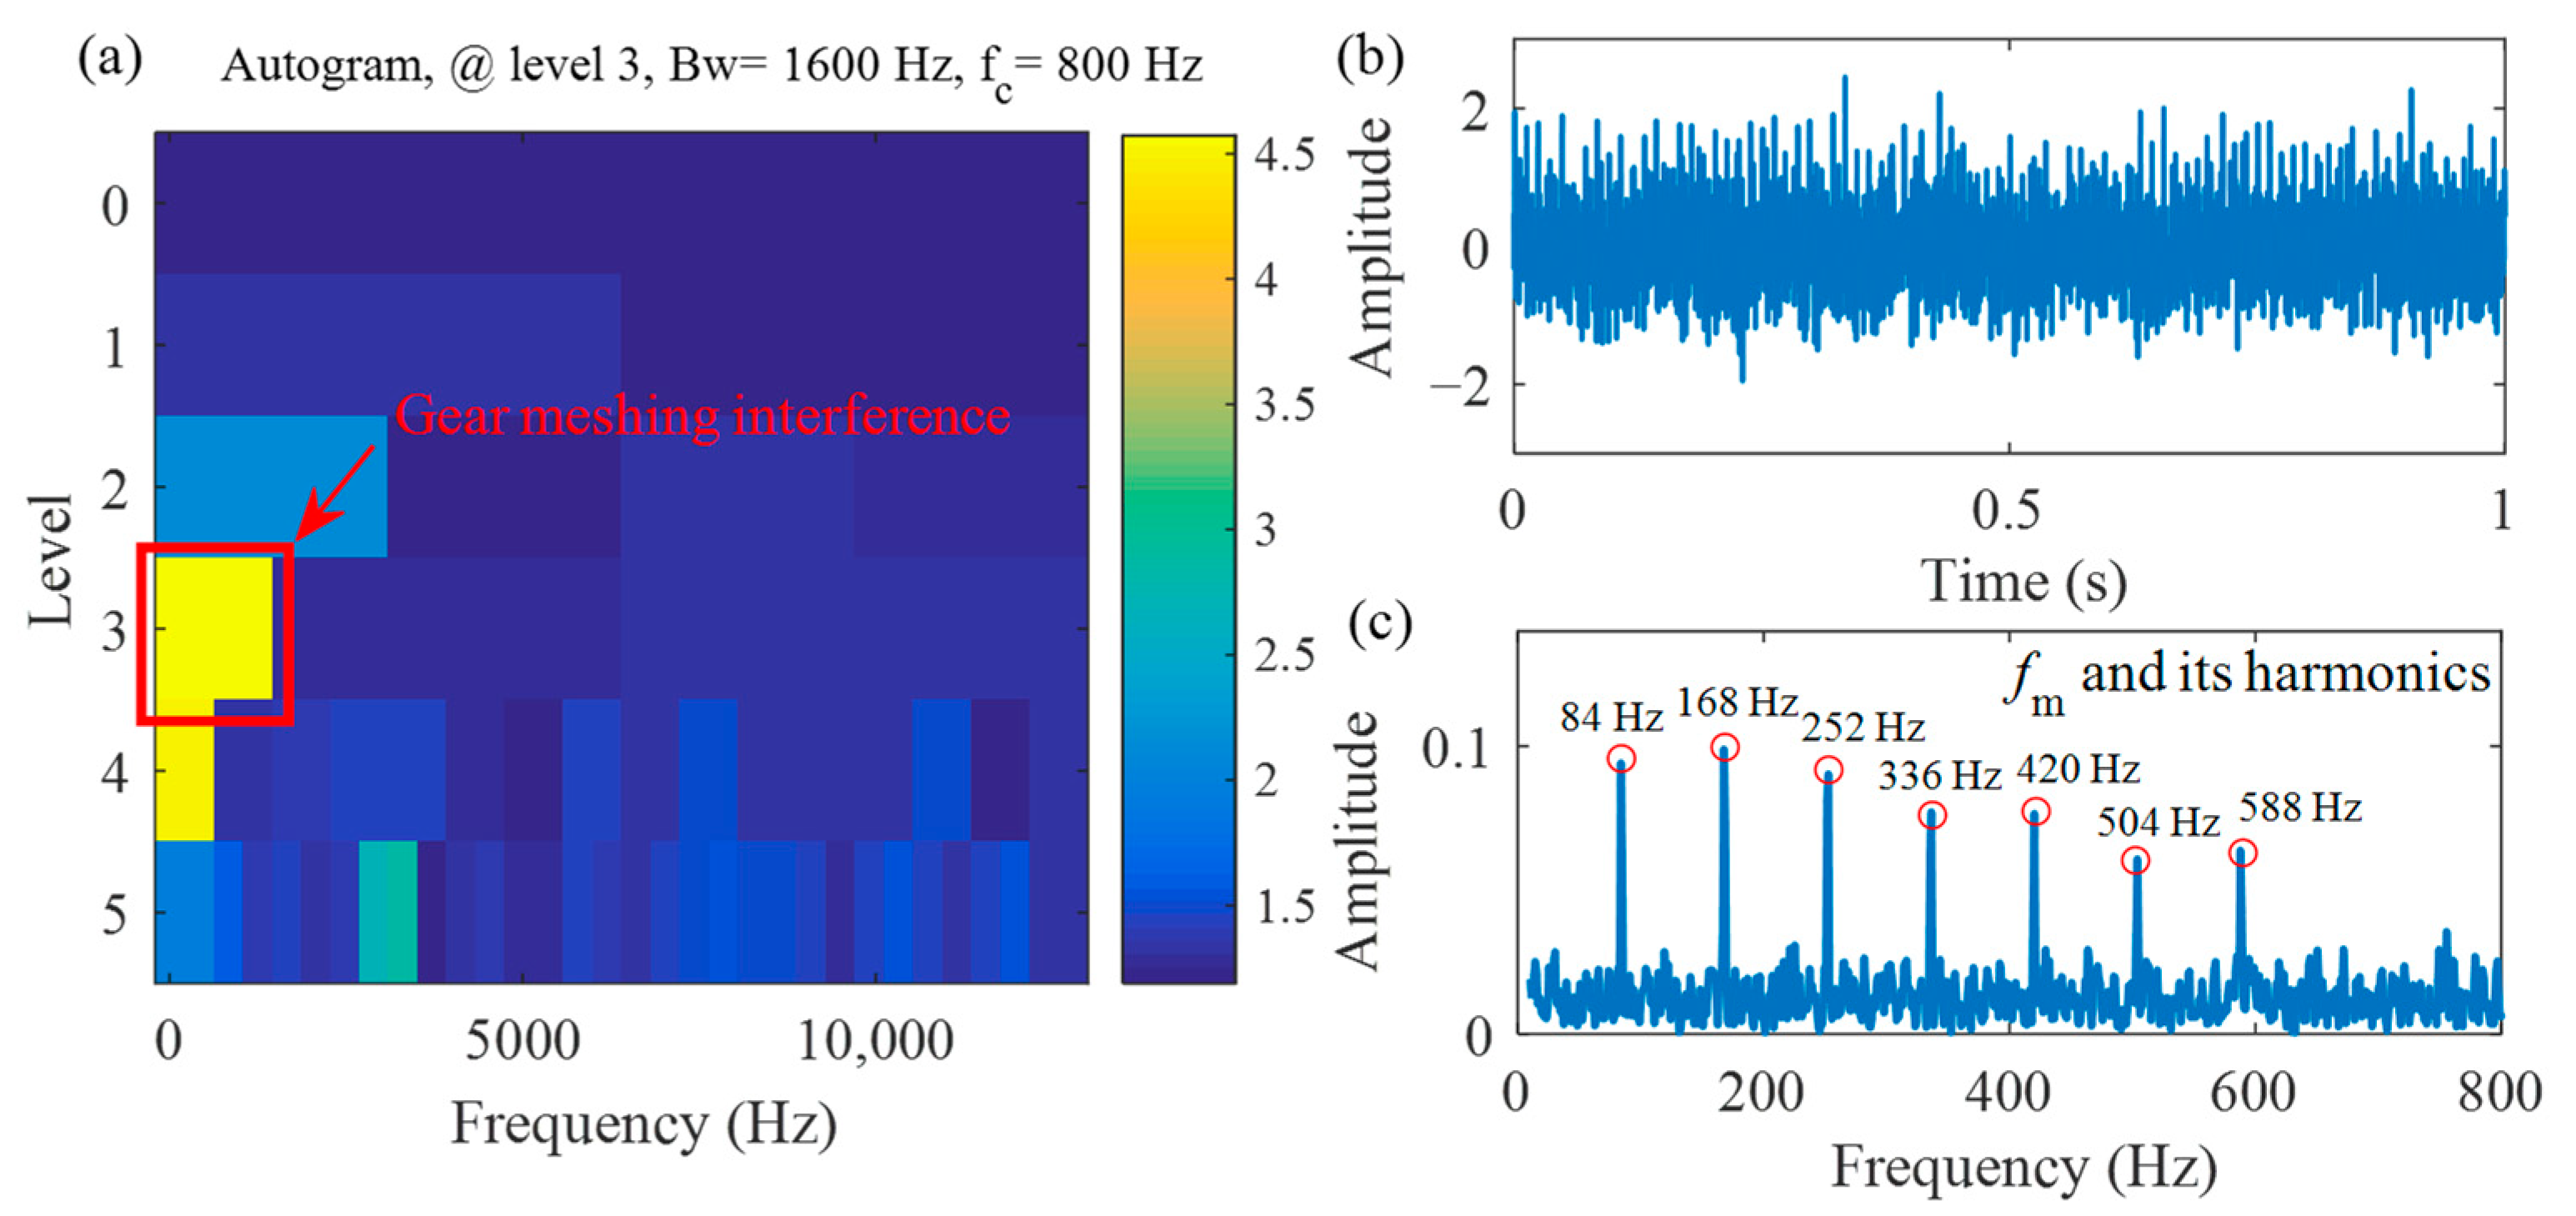
3.1. Case 1: A Numerical Experiment with Multiple Interferences

In order to demonstrate the noise immunity and anti-periodic interference of the Mkurtogram, a simulated out race bearing fault signal with the is formed with Gaussian white noise, abnormal impulsive noise and gear meshing harmonic interferences. In this case, the above mentioned multiple interferences are added to the simulated signal referring to [33,34]. Then, the simulated bearing signal can be modeled as:
x ( t ) = s ( t ) + δ ( t ) + m ( t ) + n ( t )
The first part s(t) is a sequence of repetitive impulses, which is generated as follows:
s ( t ) = A ( t ) n h ( t n / f o τ )
where A(t) signifies the amplitudes of the fault-induced repetitive impulses, and it is randomly selected from the uniform distribution U (1.2,1.5) in this section. Additionally, n is the impulse number, fo = 54 Hz is the FCF and τ represents the random fluctuation generated by the rolling elements, which generally enjoys a percentage of 2–3% of Td. Td is the time lag between two successive impulses. The impulse expression function h(t) can be modeled as:
h ( t ) = e α t sin ( 2 π f t )
where α = 860 represents the damping ratio, and f = 3200 Hz signifies the structure resonance frequency.
The second part δ(t) simulates the impulse interference, which shares the same form with Equation (15). The parameters are different from Equation (15), which match a large amplitude of 3.6, a damping ratio of 480, and the resonant frequency of 7200 Hz. The disturbance impulse is set at the time of 0.17 s. The third part m(t) is a harmonic interference generated by gear meshing, which can be modeled as:
m ( t ) = i = 1 11 [ ( 1.3 0.01 i ) cos ( i 2 π × 12 f r t ) ] + 0.1 × cos ( 2 π f r )
where the rotating frequency fr is set as 7 Hz and the meshing frequency fm = 84 Hz can be calculated. The last part n(t) is the Gaussian white noise with the SNR of −12 dB. The sampling frequency Fs = 25.6 kHz with a sampling time length of 1 s. The time domain waveform of the first three parts and synthesized signal x(t) are depicted in Figure 3.
Before applying the Mkurtogram to detect the optimal IFB, the input period T should be determined at first. In this case, the outer race fault period To = Fs/fo = 474 can be calculated. Then, the Mkurtogram is applied to the simulated data and its corresponding results are displayed in Figure 4. From the Mkurtogram plotted in Figure 4a, the optimal IFB is found at level 5, which represents the decomposition scale of MODWPT. Meanwhile, the optimal center frequency fc = 3000 Hz with a bandwidth Bw = 400 Hz is obtained, which is adjacent to the set resonant frequency of 3200 Hz. The optimal IFB is then taken to filter the simulated signal. From the SES shown in Figure 4c, the outer race FCF fo and its multiple harmonics can be found obviously. Thus, the result indicates that the proposed Mkurtogram is valid to identify the bearing fault under the multiple interferences. As an additional detection in this case, the Mkurtogram is also applied to detect the gear meshing component based on the gear meshing period Tm = Fs/fd = 304.7. The results are presented in Figure 5. From Figure 5a, the Mkurtogram finds a low-frequency band with the optimal center frequency fc = 800 Hz and bandwidth Bw = 1600 Hz. From the filtered signal plotted in Figure 5b, the gear meshing repetitive transients are clearly revealed and the meshing frequency fm along with its multiple harmonics are also dominated in the SES as displayed in the Figure 5c.
As a comparison, the FK and the Autogram are applied to analyze the simulated signal, and the results are given in Figure 6 and Figure 7, respectively. As depicted in the Figure 6a, the optimal center frequency fc = 7200 Hz and bandwidth Bw = 533.3 Hz can be found, which correspond to the resonant frequency of the added interfering impulse. From the filtered signal displayed in Figure 6b, a prominent large impulse at the time of 0.17 s is found, which indicates that the FK is sensitive to the large disturb impulse. From the SES given in Figure 6c, we cannot find any fault-related fault characteristic frequencies. The Autogram is depicted in Figure 7a, where the center frequency fc = 800 Hz and bandwidth Bw = 1600 Hz are obtained. It can be noted that the IFB identified from Figure 7a is the same with result as shown in Figure 5a, which is determined by Mkurtogram based on the gear meshing period Tm. From the SES displayed in Figure 7c, the gear meshing frequency fm and its harmonics are found clearly. From this case, we can see that the Autogram fails to avoid the interference of cyclostationary noise. In this case, both FK and Autogram are unable to detect the outer race fault duo to the complex interferences.
In this case, the FK fails to detect the bearing fault due to the large interfering impulse. After AC process, the Autogram avoids the interference of tremendous impulse, while it is still disturbed by gear meshing interference. It mainly because the kurtosis indicator can’t distinguish whether the repetitive impulses is generated by the bearing defect. However, based on the regular periodic distribution of fault-related peaks in AC domain, a unified representation of the impulsiveness and periodicity is performed by Mkurt. Therefore, the Mkurtogram method has successfully decreased the interference of both the large impulses and cyclostationary noises. By setting different interested input periods, the Mkurtogram can detect the different fault-related peaks in turn.

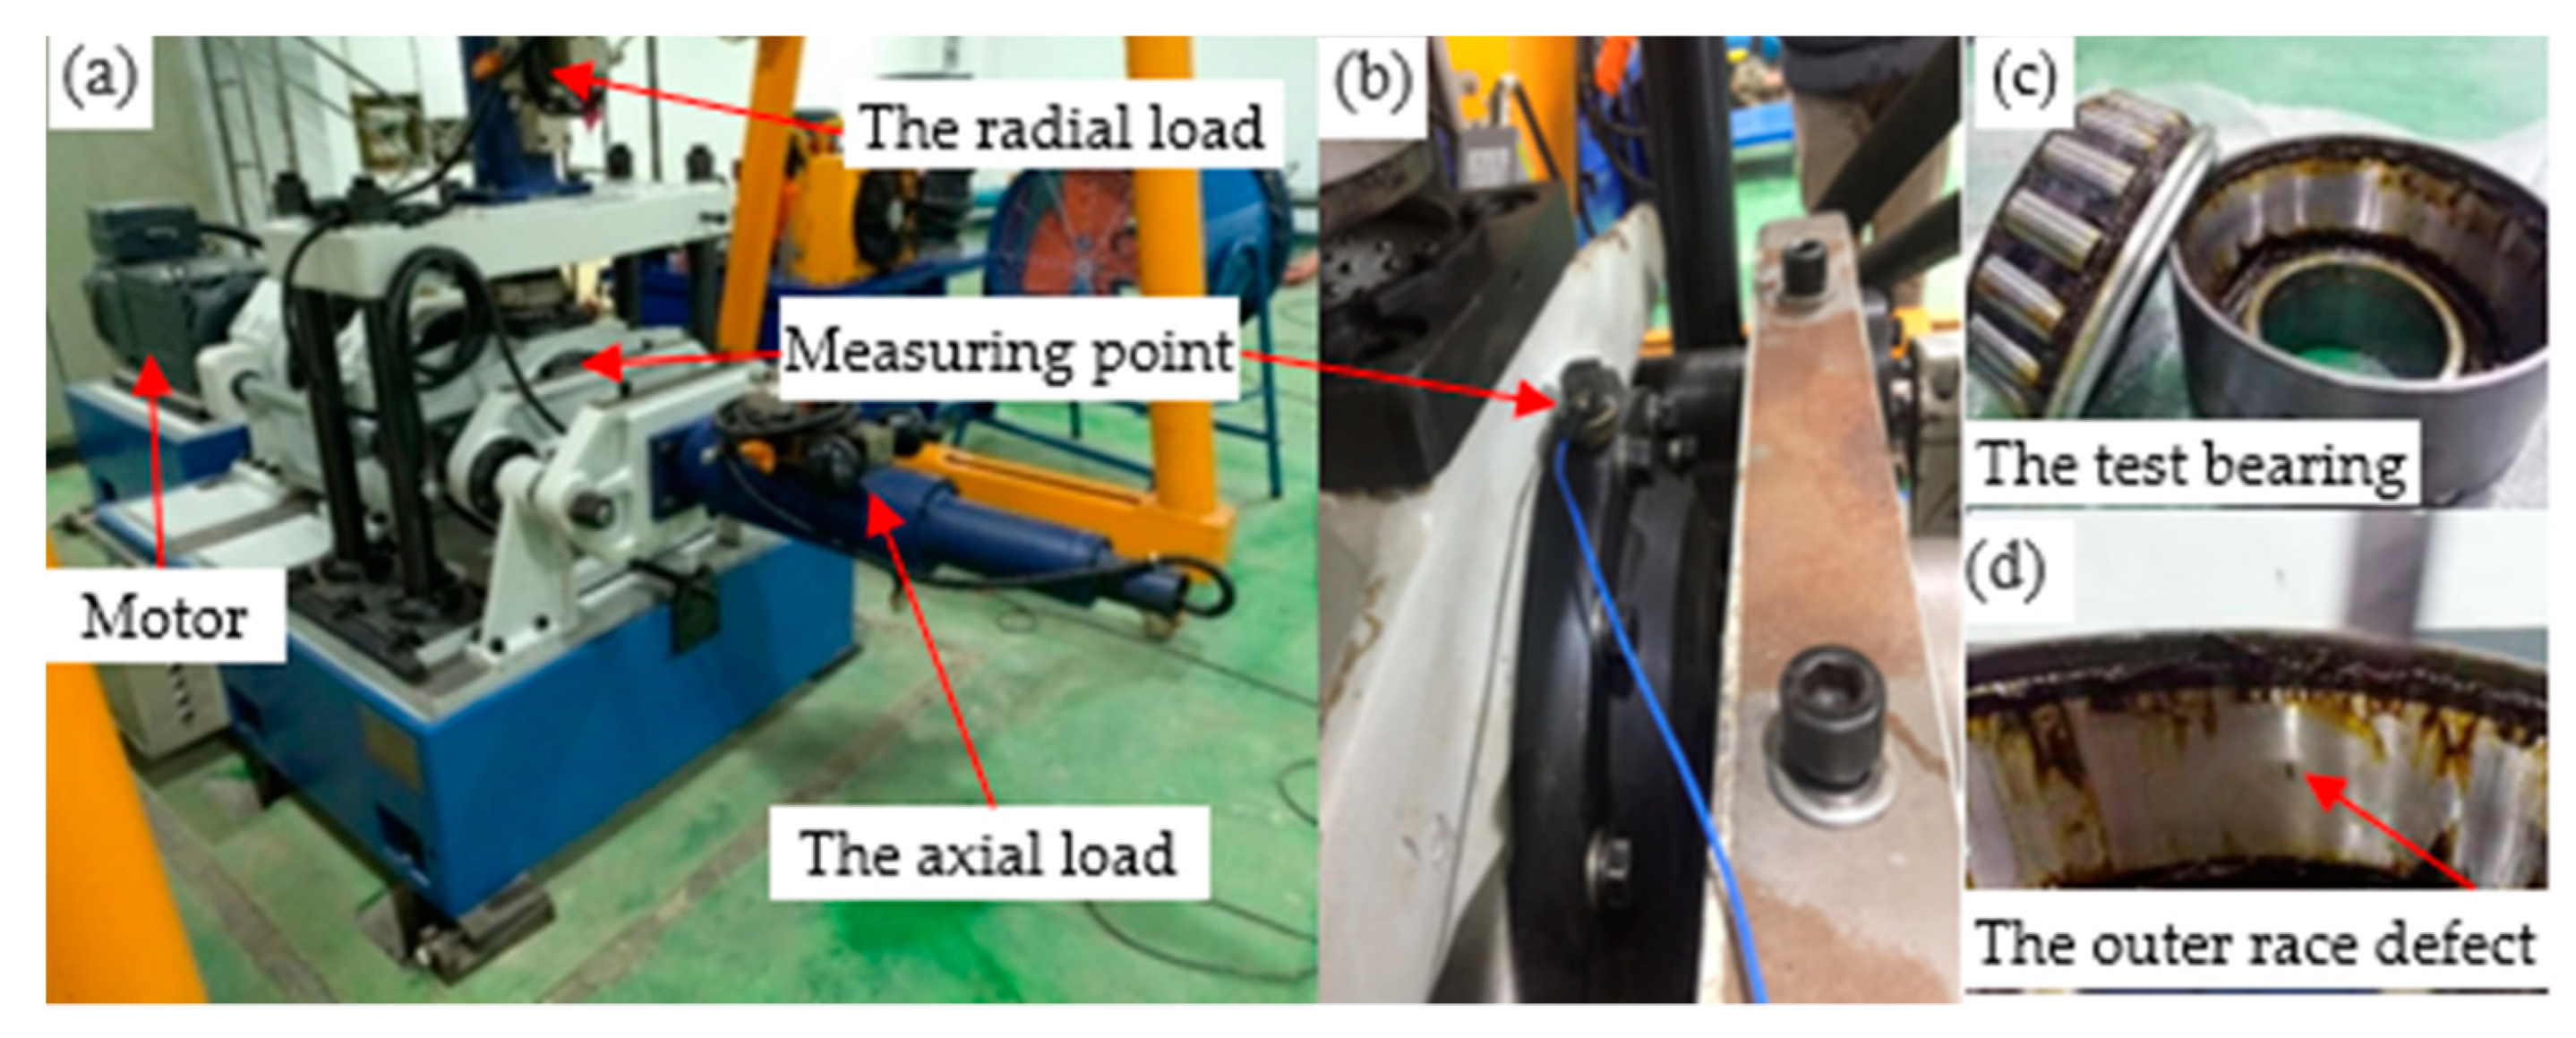
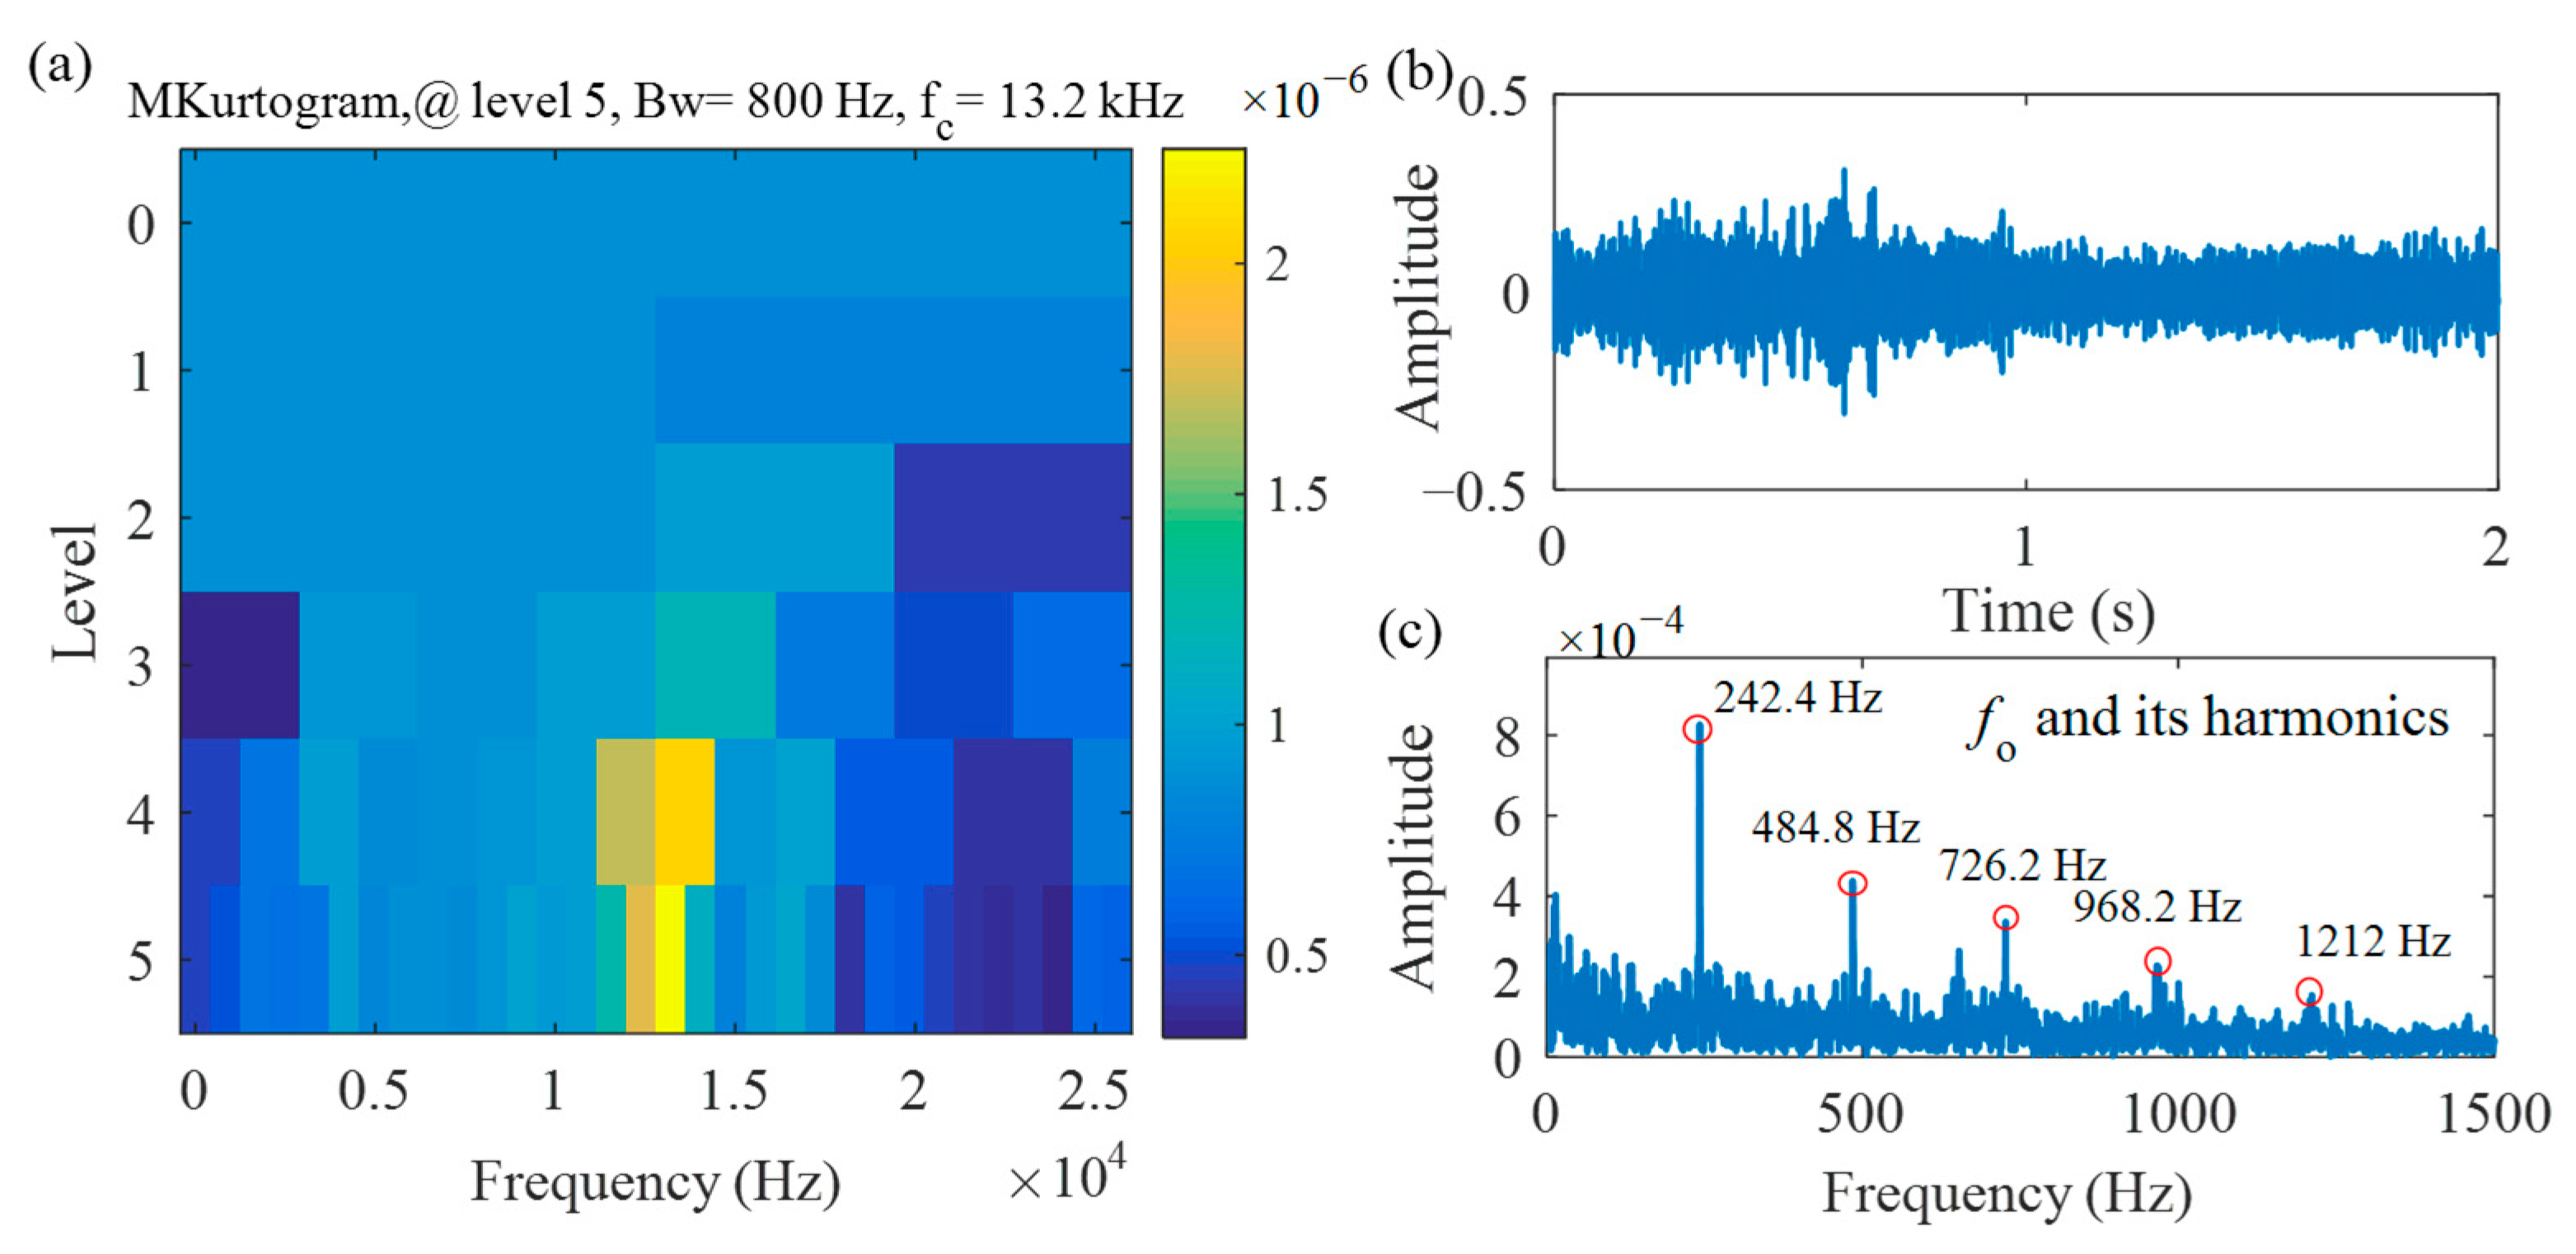
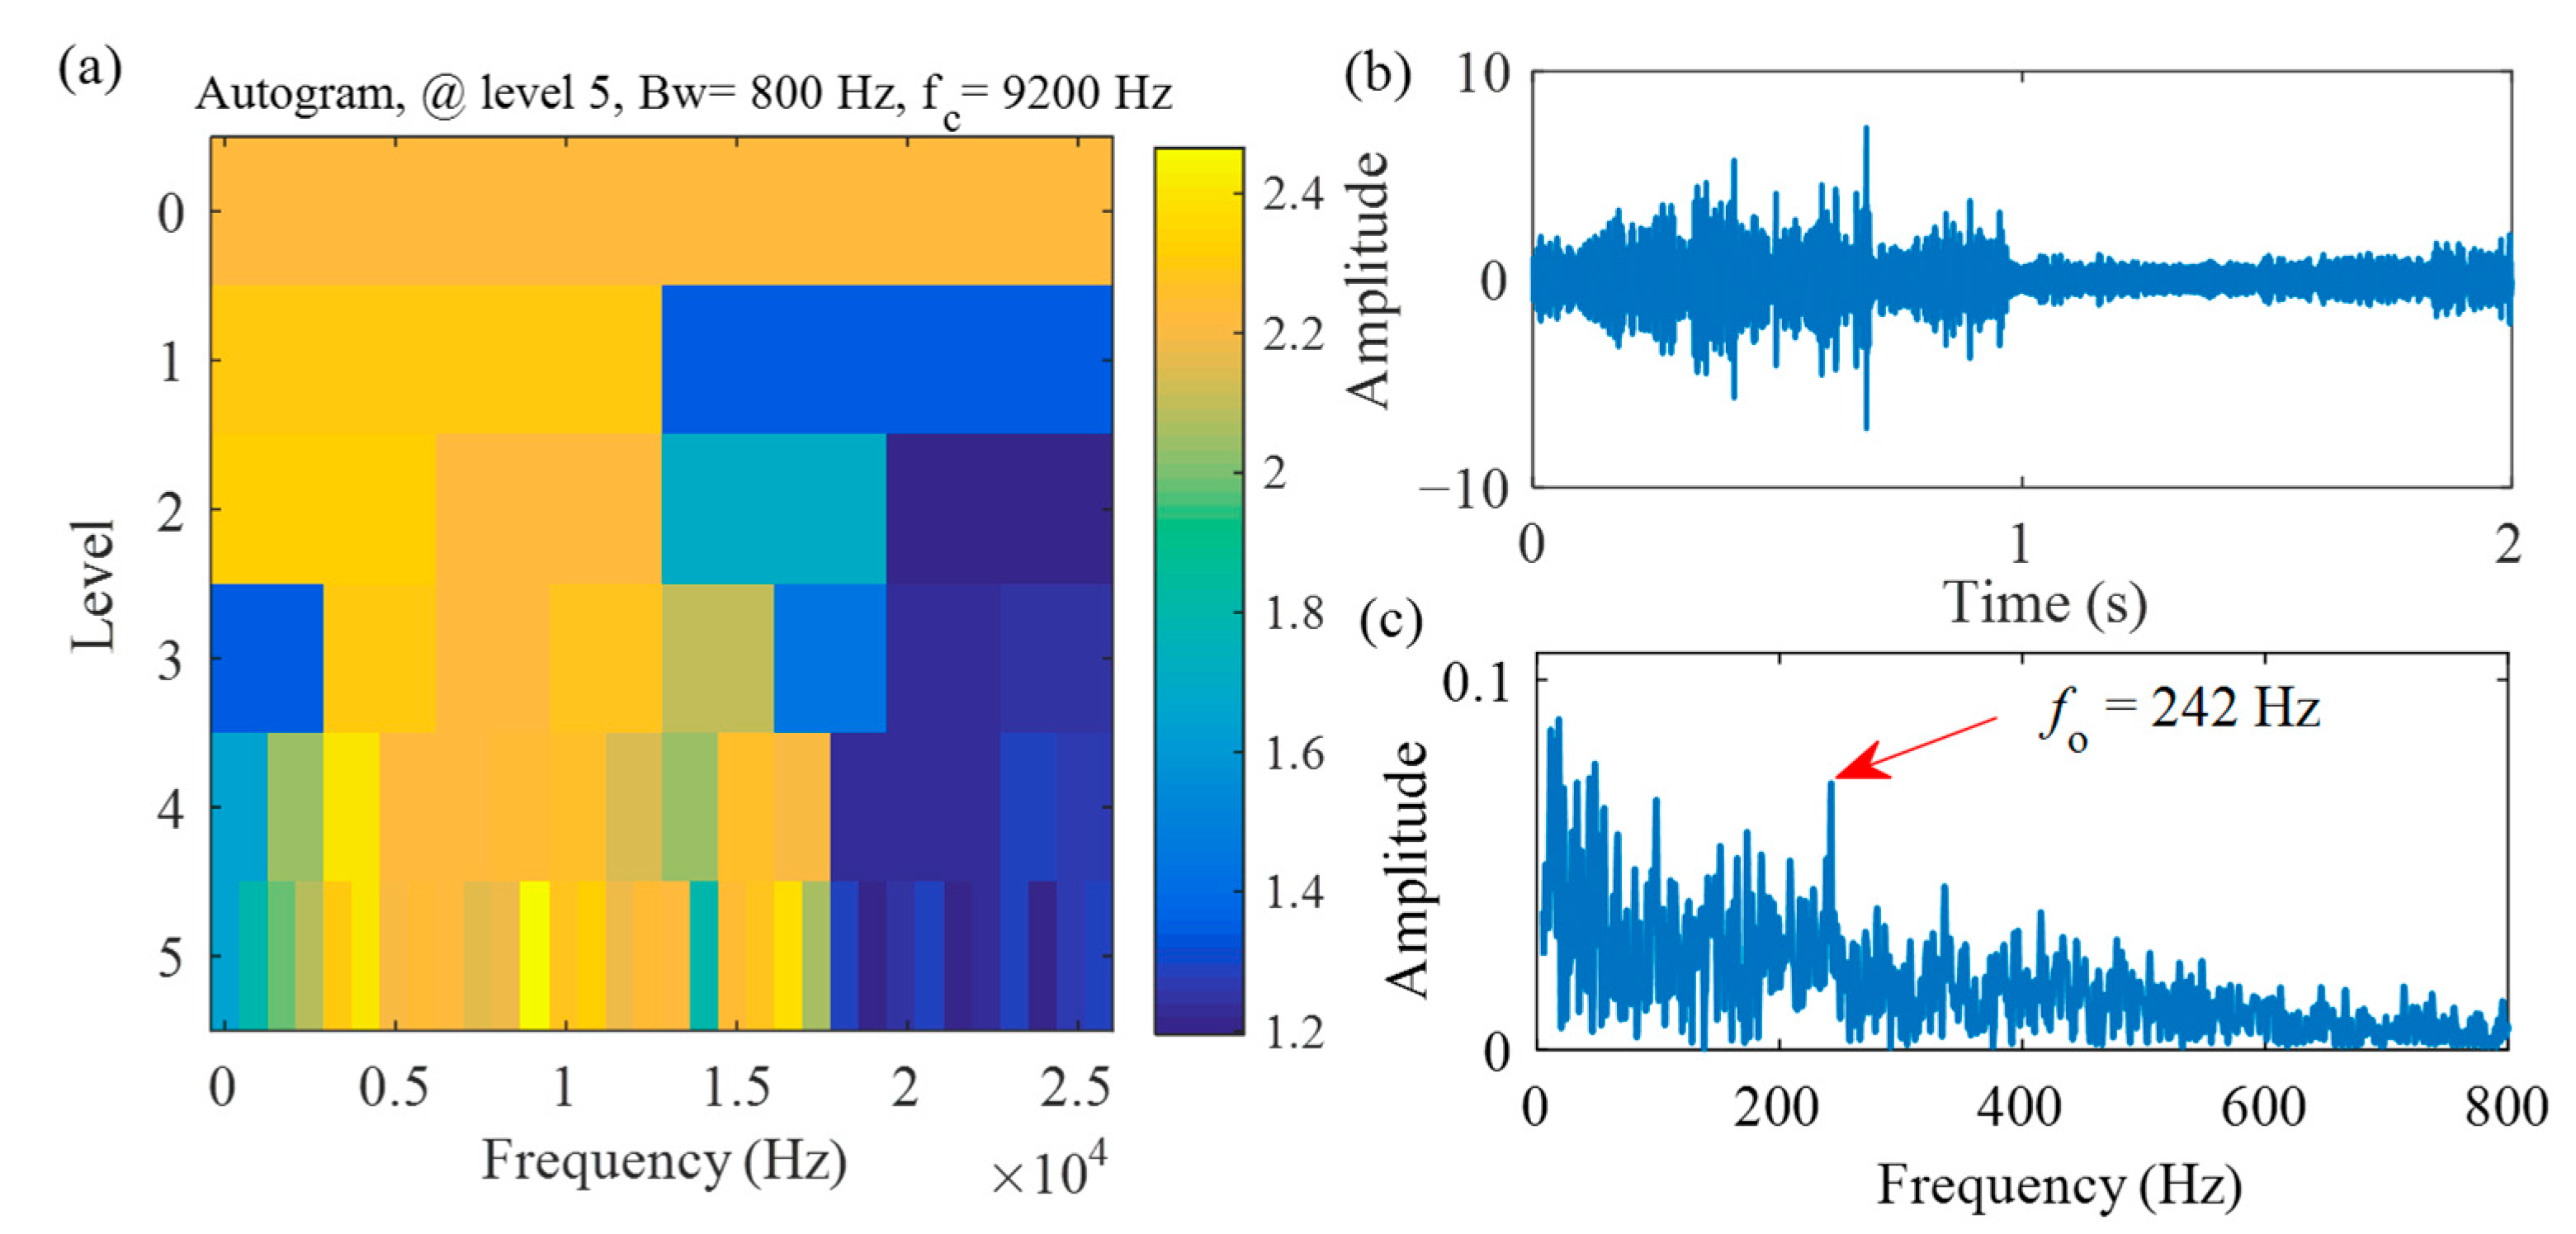
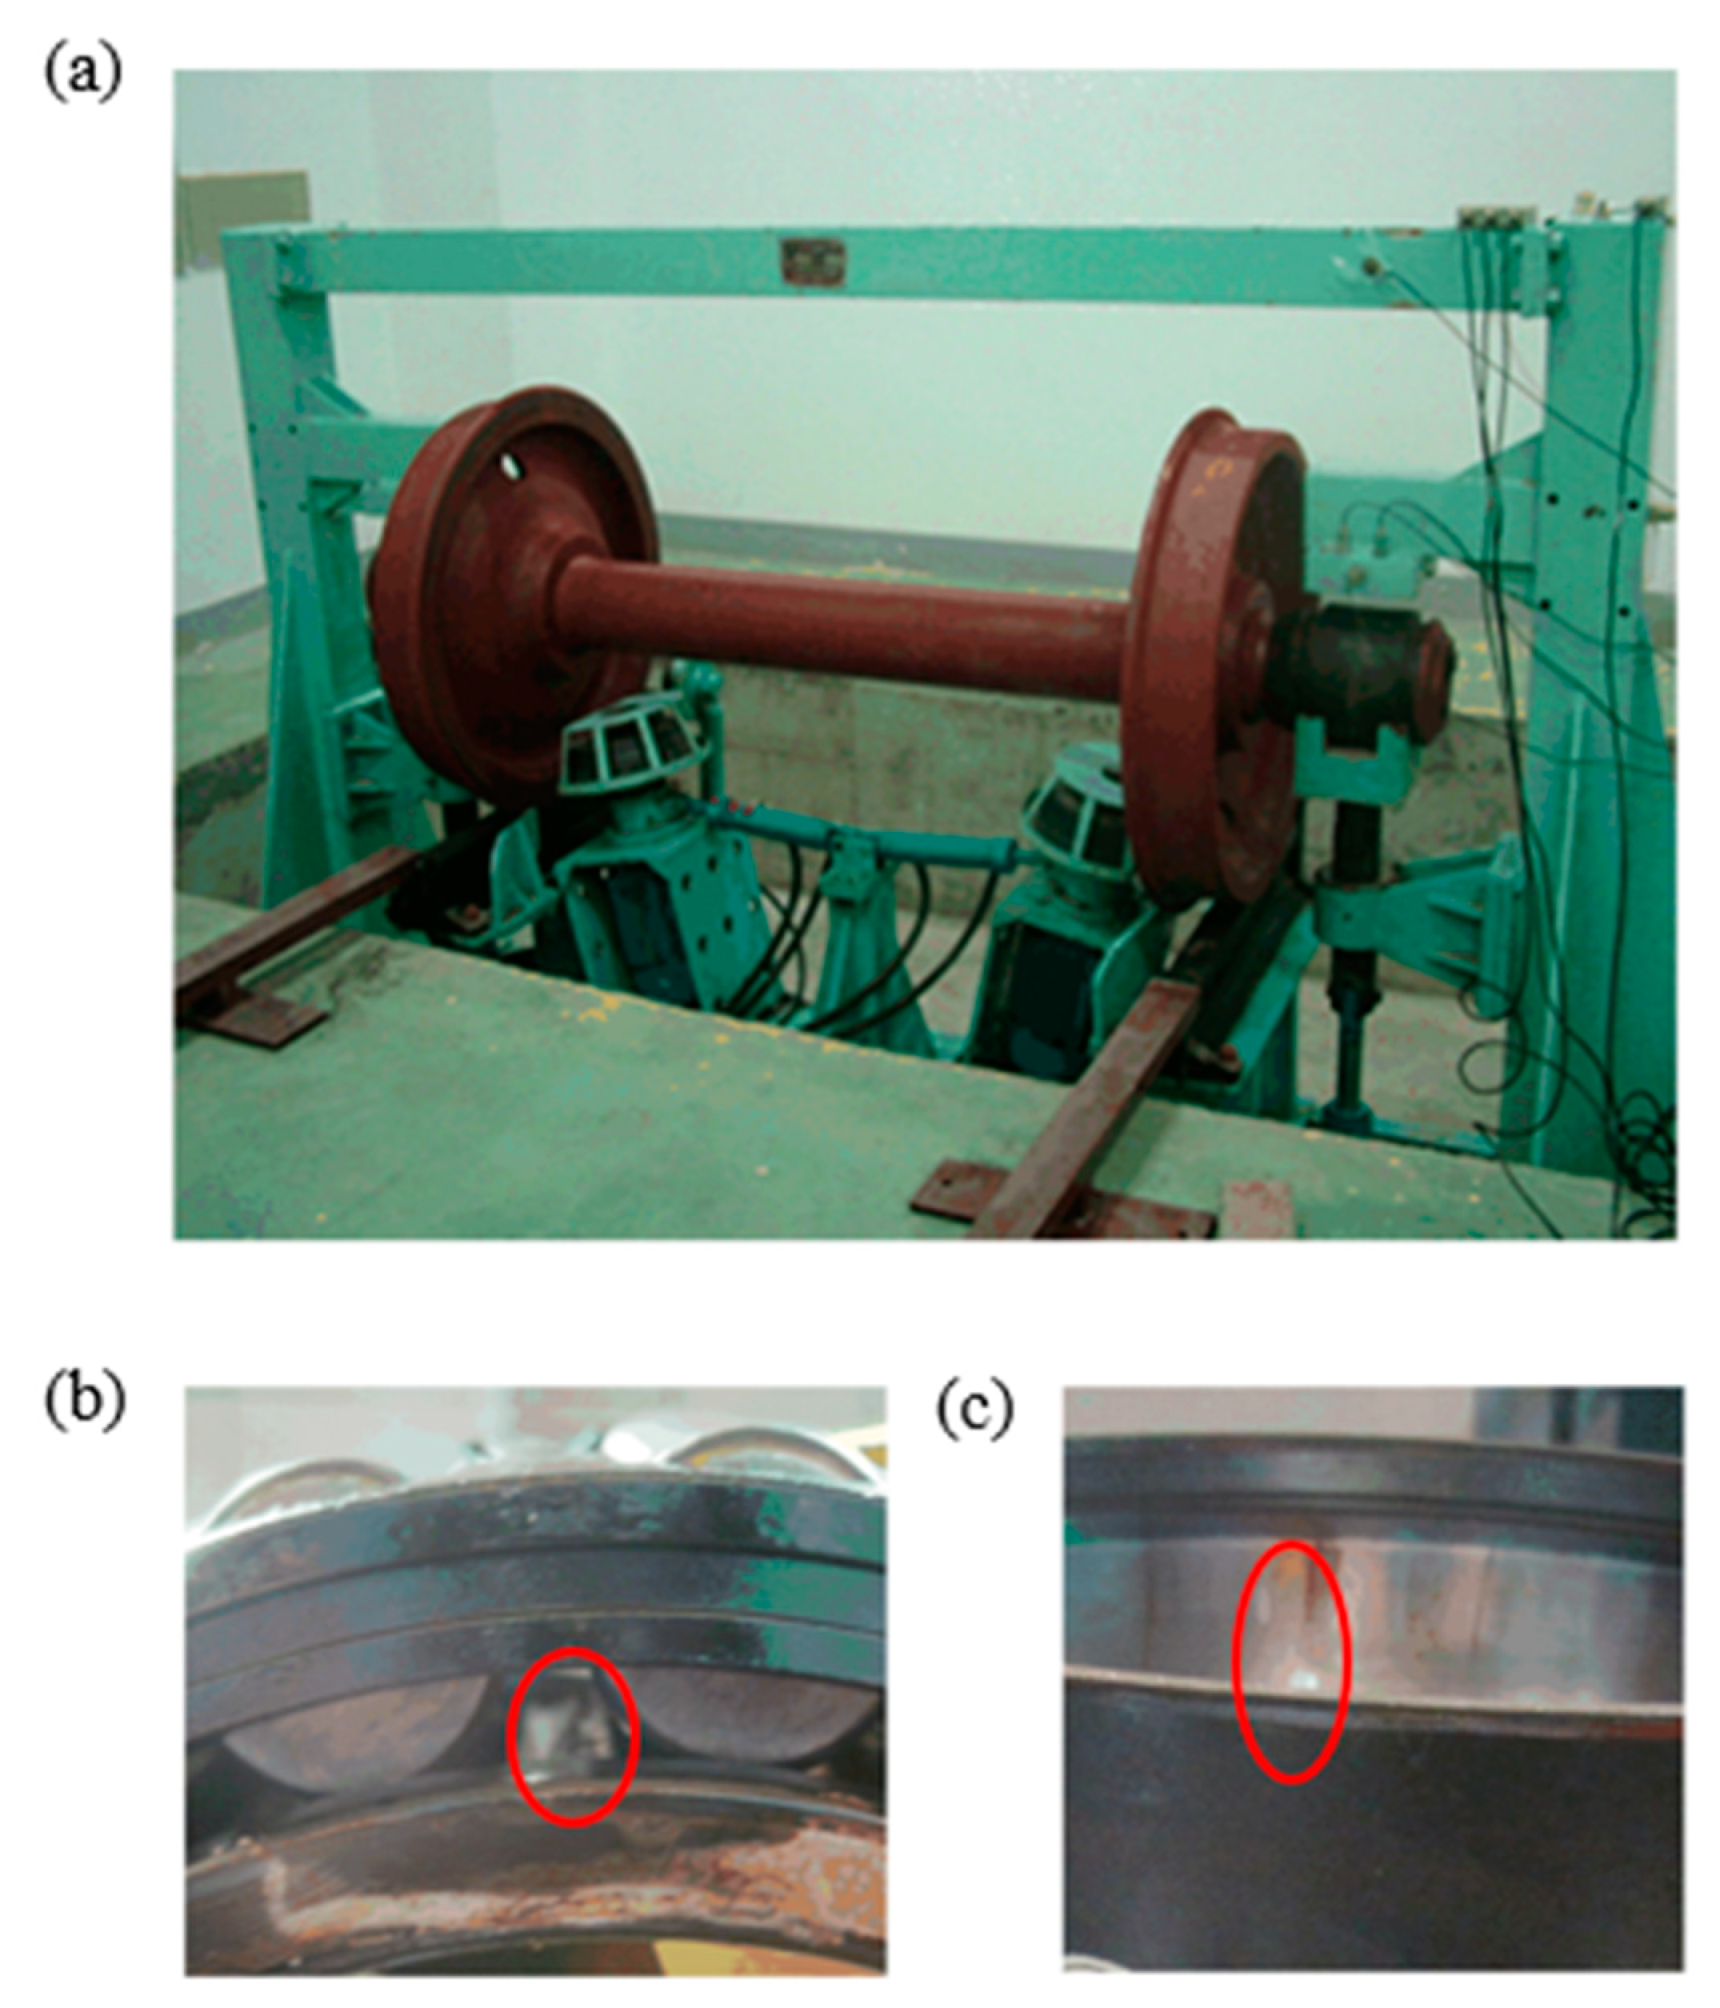
3.2. Case 2: A High-Speed Locomotive Wheelset Bearing Fault Signal under Variable Load Conditions

In this case, the vibration signal has been collected from a high-speed locomotive wheelset bearing under variable load conditions, which is carried out to further testify the validity of this proposed method. The test rig structure is presented in Figure 8. The basic experimental setups and the test bearing are depicted in Figure 9. The sensor is located at the top of the end-shield of the test bearing in Figure 9b and the vibration signal is collected by a PCB 356A25 accelerometer. The dynamic loads can be obtained by the radical and axial actuators. The structure parameters of the bearing are listed in Table 1. There is an artificial local defect in the outer race of test bearing as plotted in Figure 9d, of which the width is 1 mm and length is 5 mm. It can be noted that the artificial defect is relatively slight in comparison with its geometries.
To simulate the load changes during the operation process of a wheelset bearing, the random force is added to the vertical direction with a mean force of approximately 80 kN and a frequency range among 0.2 to 20 Hz. A random force with a maximum of 50 kN and a frequency range among 0.2 to 20 Hz is applied on the axis. The dynamic loading forces generated by the actuator are depicted in Figure 10. The sampling frequency Fs is set as 51.2 kHz and the set speed is 2 000 r/min. The measured time domain signal of the axle-box under the variable load conditions is presented in Figure 11. It can be seen that the amplitudes of the vibration signal change dramatically due to the variable loads. Therefore, this example can be used as an excellent experimental case to testify the effectiveness of the Mkurtogram for the selection of IFB under the influence of variable load conditions. The outer race FCF fo, inner race FCF fi and rolling element FCF frb can be calculated as 243.4 Hz, 323.3 Hz, and 114 Hz, respectively.
Based on the speed, its corresponding outer race fault period To = 210.5 can be calculated. The Mkurtogram is presented in Figure 12a, where optimal center frequency fc = 13.2 kHz and bandwidth Bw = 800 Hz are found. Then, the optimal IFB is taken to filter the vibration signal. From the SES depicted in Figure 12c, we can find that the outer race FCF fo and its multiple harmonics are clearly, which indicates that the test wheelset bearing has an outer race fault. Hence, in this case, the result indicates that the Mkurtogram has the ability to identify weak outer race fault even when the amplitudes of the vibration signal change dramatically due to the applied variable loads.
For better comparison, the same vibration data is processed by the FK and the Autogram, and the results are given in Figure 13 and Figure 14, respectively. The center frequency fc = 12 kHz and bandwidth Bw = 1600 Hz are determined from FK as displayed in Figure 13a. There is an obvious interfering impulse in the filtered signal as plotted in Figure 13b. From the SES in Figure 13c, we can see that only the outer race FCF fo is found and the background noise interference is obvious. Figure 14a displays the IFB determined by Autogram, where the center frequency fc = 9200 Hz and the bandwidth Bw = 800 Hz are found. From the Figure 14c, the SES obtained by Autogram, it can be seen that the outer race FCF fo is almost surrounded by the strong background noise. By the comparison, the analysis results validate that the IFB determined by Mkurtogram contains more fault characteristics information than the IFBs identified from the FK and the Autogram.
Due to the influence of the variable load conditions, the amplitude of vibration signal fluctuates dramatically, which brings some difficulty to the determination of the optimal IFB. Since FK and Autogram only represent the impulse-like characteristics by kurtosis, they both fail to identify the optimal IFB in this example. Benefiting from a unified representation of impulsivity and periodicity performed by Mkurt, the Mkurtogram characterizes the strength of concerned fault-related peaks in the sub-bands and has successfully determined an IFB contained more fault features. Therefore, the Mkurtogram is more effective to extract the wheelset bearings fault feature under complex interferences.

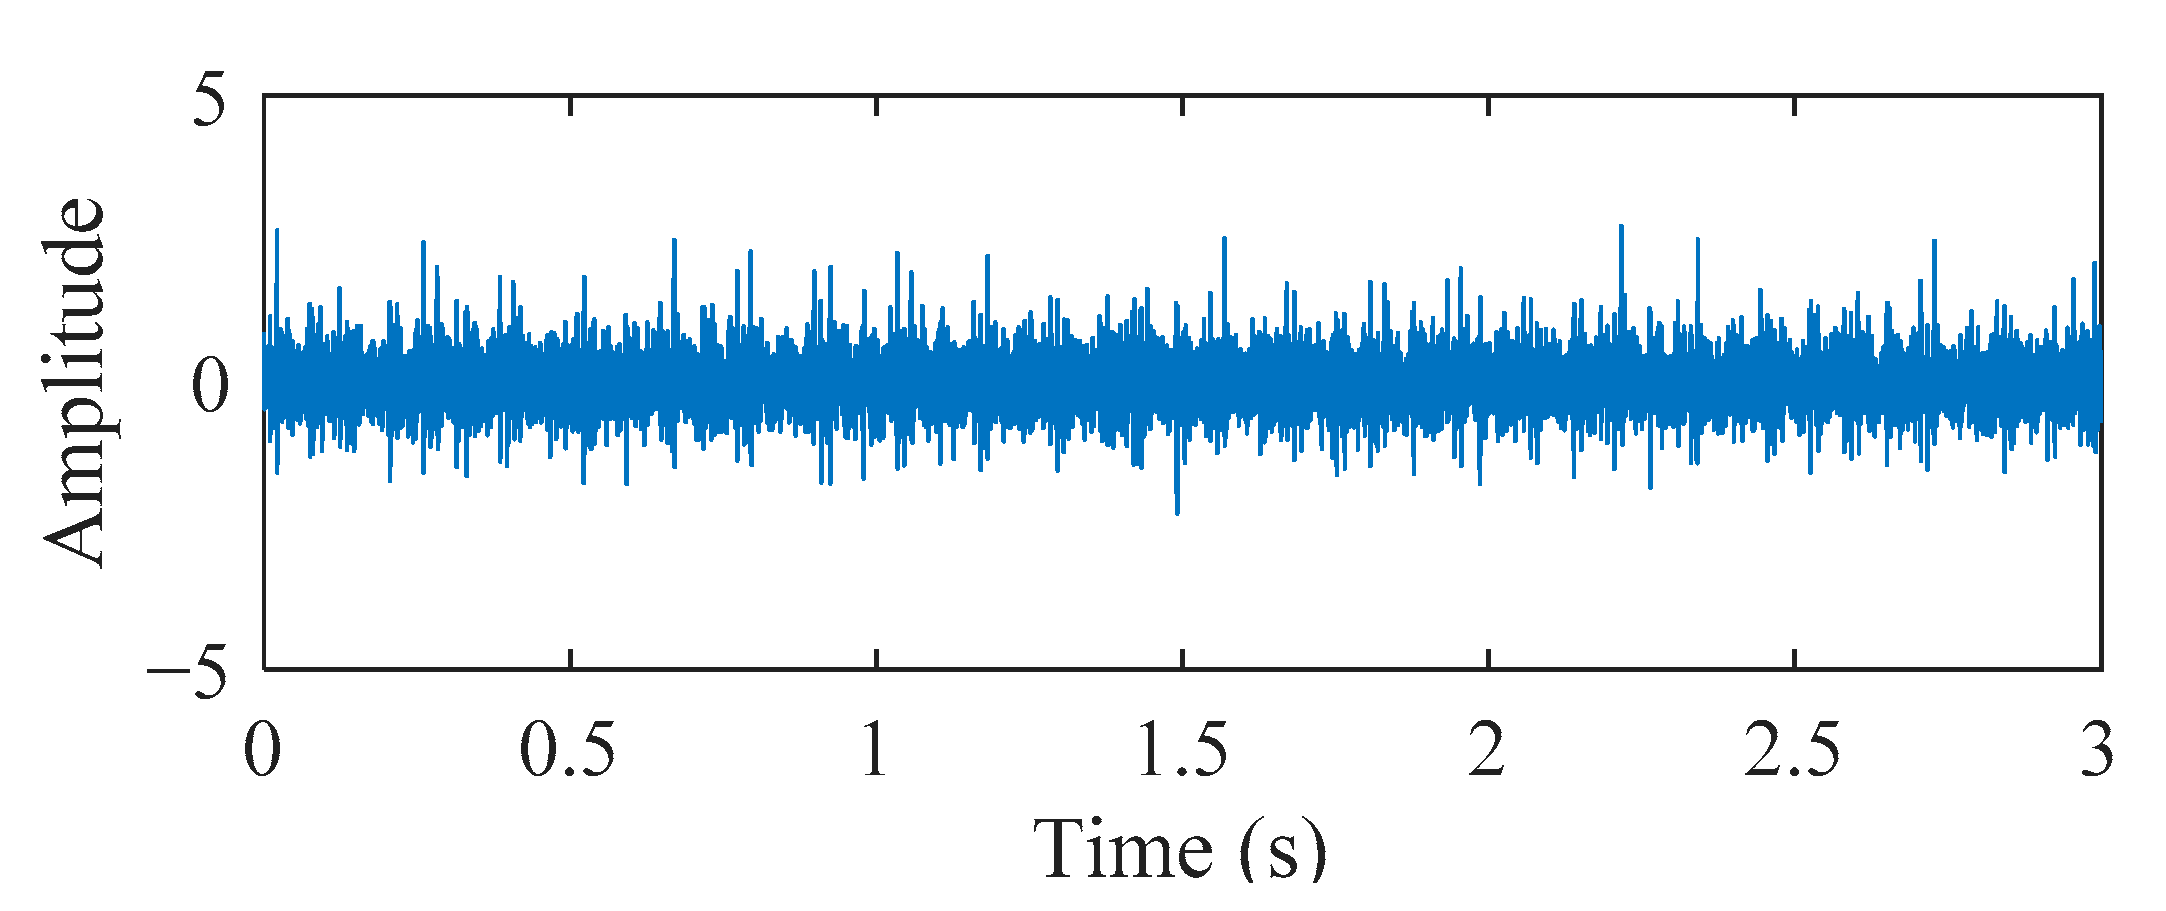
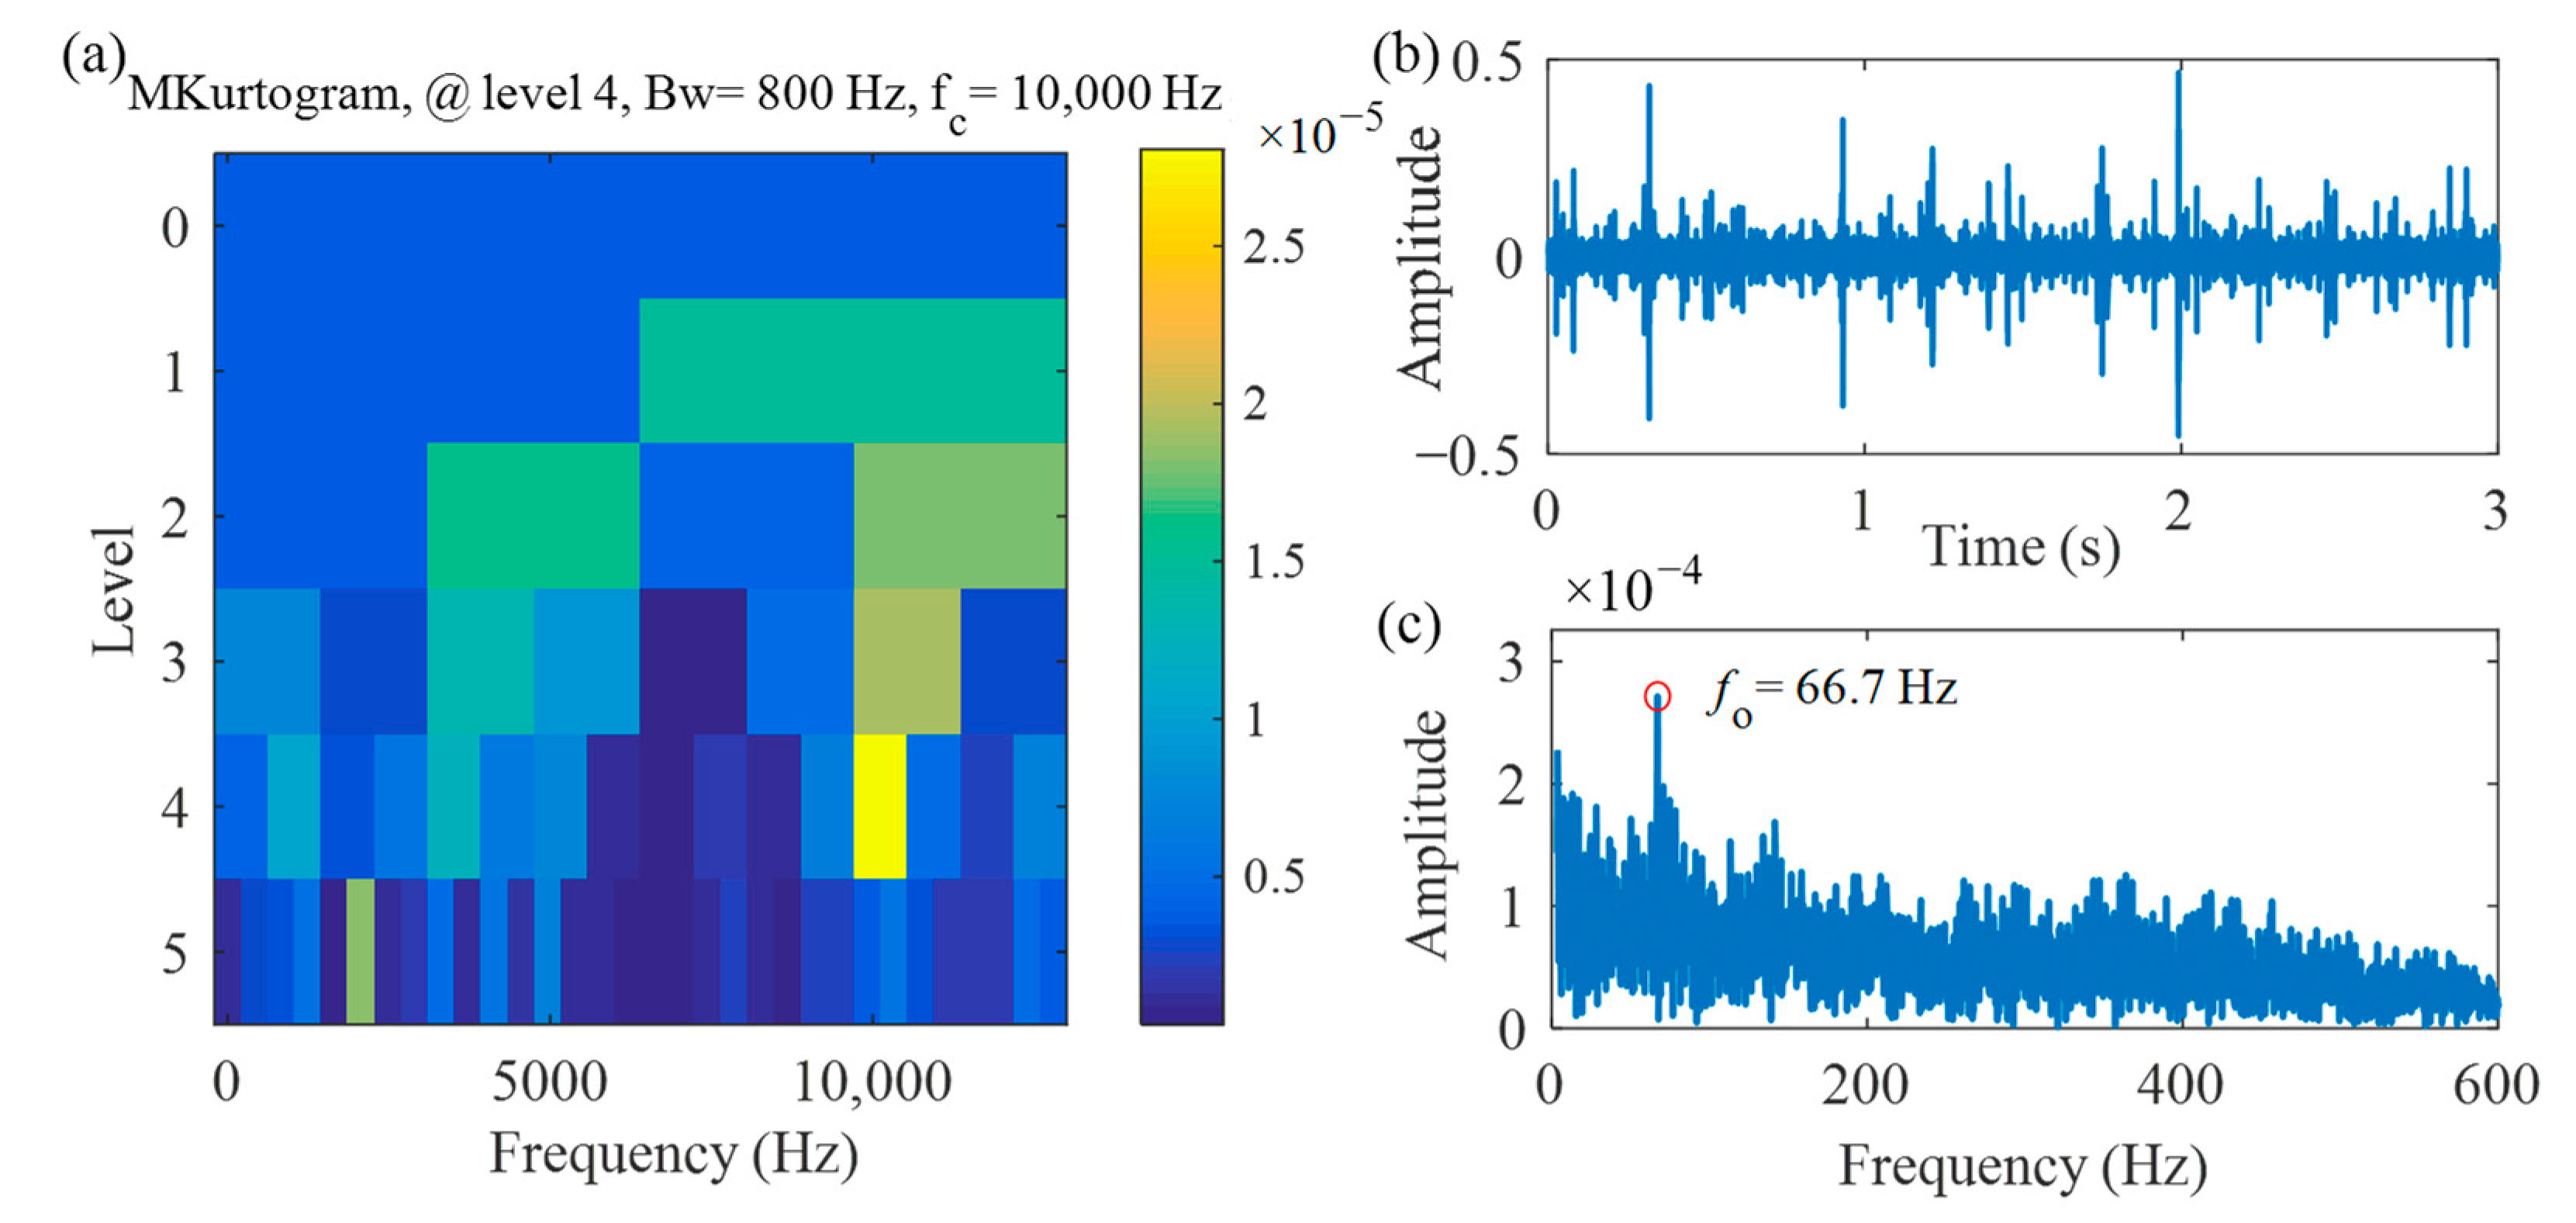
3.3. Case 3: A Freight Locomotive Wheelset Bearing Signal with Compound Faults

To further demonstrate the performance of the Mkurtogram, a compound fault experiment is carried out in this section. It is worth noting that the wheelset bearing defections are not manufactured manually. They are natural damages generated during the operation of the railway freight vehicles, which are located in the outer and inner raceway, respectively. The experimental setup and the tested wheelset bearing are shown in Figure 15, respectively. Parameters of the bearing are listed in Table 2.
The sampling frequency Fs is 25.6 kHz and the set speed is 465 r/min. Then, the bearing fault characteristic frequencies are given in Table 3. The measured time domain waveform is shown in Figure 16. In this case, the corresponding outer race fault period is To = 383.5 and the inner race fault period is Ti = 290, respectively.
In this case, we use the proposed method to identify the wheelset bearing compound faults. Firstly, based on the outer race fault period To, the Mkurtogram is carried to detect the outer race fault. The IFB identified by Mkurtogram is displayed in Figure 17a. It can be seen that the center frequency fc = 10 kHz with bandwidth Bw = 800 Hz has the highest Mkurt. Then, the filtered signal generated from the IFB and its corresponding SES are calculated as plotted in Figure 17b,c. As shown in Figure 17b, the fault-induced repetitive transients can be observed obviously in the filtered signal. From Figure 17c, it can be found that the outer race FCF fo is dominated in the SES. Therefore, the proposed Mkurtogram has successfully detected the outer race fault.
Then, based on inner race fault period Ti, the Mkurtogram is taken to detect the inner race fault. The IFB determined by Mkurtogram is plotted in Figure 18a, where the center frequency fc = 4800 Hz and bandwidth Bw = 3200 Hz are determined. Then, the filtered signal generated from the IFB and its corresponding SES are plotted in Figure 18b,c. From the filtered signal in Figure 18b, the repetitive transients generated by the bearing defect are seen clearly. In addition, from the SES presented in Figure 18c, the first seven harmonics of inner race FCF fi can be identified and their multiple side-bands are also dominated in the SES. As a result, the inner race fault is also identified by Mkurtogram.
To compare the proposed Mkurtogram with FK and the Autogram, the above vibration signal is processed by the two approaches, and the results are given in Figure 19. In this case, we can see that the FK and the Autogram find a same IFB (fc = 10 kHz and Bw = 800 Hz). By contrast, it can be seen that the IFB determined by FK and Autogram is also identical with Mkurtogram as displayed in Figure 17a. Similarly, the filtered signal generated from the IFB and its corresponding SES are same with Figure 17b,c. Hence, both the FK and the Autogram only identifies the outer race fault in this case and fail to detect the compound faults completely. The results indicate that the Mkurtogram is more effective to deal with the signals with compound faults than FK and Autogram.

4. Conclusions

In order to decrease the effects of complex interferences on the selection of the IFB, a novel approach, named Mkurtogram, is proposed in this paper, which is applied for fault detection of wheelset bearing. It takes the Mkurt of AC as a new evaluation index to extract fault-induced repetitive transients for the first time, where the impulsiveness and periodicity are taken into consideration, simultaneously. Its main contributions are summarized as follows:
(i) Apart from improving the SNR and increasing the strength of the periodic peaks, the phase synchronization property of AC process is further revealed in this paper. The AC process ignores the initial phase information, and the signal in the AC domain is synchronous with a phase of 0. As a result, the positions of the fault-related peaks are reordered regularly and the first fault peak will occurs at the time lag of fault period in the AC domain signal, which is beneficial to further distinguish the fault information from interference components.
(ii) Based on the regular periodic distribution of fault-related peaks in AC domain, a unified representation of the impulsiveness and periodicity is performed by MKurt. Through the directivity of the MKurt, only the reordered fault-related peaks are considered, thus, the influence of background noise and irrelevant periodic interferences is further eliminated.
(iii) By inputting different fault period, the proposed method can detect the fault-induced repetitive transients with different periods, thus, it can be extended to the compound fault diagnosis of the wheelset bearings.
The performance of the proposed approach is verified by a simulated signal with multiple interferences and experimental signals collected from two wheelset bearings under different operating conditions. The analysis results show that this method has high anti-interference ability. It can effectively decrease the influence of large impulse interference, the discrete harmonics, and amplitude fluctuation caused by variable working conditions. Further, benefit from periodic directivity of Mkurt, it has successfully applied to the compound faults diagnosis of the wheelset bearing. Compared with FK and Autogram, the results indicate this proposed method is more effectiveness and robustness to extract the wheelset bearing fault feature from complex interferences and to diagnose composite faults.

Author Contributions

Conceptualization: W.L.; data curation: Q.L. and Y.L.; investigation: Q.L. and R.H.; methodology: W.L.; software: S.Y.; validation: X.G.; writing—original draft: W.L.; writing—review and editing: S.Y. All authors have read and agreed to the published version of the manuscript.

Funding

The present research is supported by the National Natural Science Foundation of China (nos. 11790282, 12032017, 11802184, 11902205, and 12002221), S&T Program of Hebei (20310803D), and Natural Science Foundation of Hebei Province (no. A2020210028).

Institutional Review Board Statement

“Not applicable” for studies not involving human or animals.

Informed Consent Statement

“Not applicable” for studies not involving human.

Data Availability Statement

The data are not publicly available due to Laboratory restrictions.

Acknowledgments

The authors sincerely thank the reviewers and editors for their valuable comments and suggestions.

Conflicts of Interest

The authors declare no conflict of interest.

References

  1. Janeliukstis, R.; Clark, A.; Papaelias, M.; Kaewunruen, S. Flexural cracking-induced acoustic emission peak frequency shift in railway prestressed concrete sleepers. Eng. Struct. 2019, 178, 493–505. [Google Scholar] [CrossRef]
  2. Paweł Rolek, Stefano Bruni, Michele Carboni, Condition monitoring of railway axles based on low frequency vibrations. Int. J. Fatigue 2016, 86, 88–97. [CrossRef]
  3. Chen, Z.; Zhai, W.; Wang, K. Vibration feature evolution of locomotive with tooth root crack propagation of gear transmission system. Mech. Syst. Signal Process. 2019, 115, 29–44. [Google Scholar] [CrossRef]
  4. Yang, S.; Gu, X.; Liu, Y.; Hao, R.; Li, S. A general multi-objective optimized wavelet filter and its applications in fault diagnosis of wheelset bearings. Mech. Syst. Signal Process. 2020, 145, 106914. [Google Scholar] [CrossRef]
  5. Zhang, D.; Entezami, M.; Stewart, E.; Roberts, C.; Yu, D. Adaptive fault feature extraction from wayside acoustic signals from train bearings. J. Sound. Vib. 2018, 425, 221–238. [Google Scholar] [CrossRef]
  6. Han, L.; Yu, C.; Liu, C. Fault Diagnosis of rolling bearings in rail train based on exponential smoothing predictive segmentation and improved ensemble learning algorithm. Appl. Sci. 2019, 9, 3143. [Google Scholar] [CrossRef] [Green Version]
  7. Papaelias, M.; Amini, A.; Huang, Z.; Vallely, P.; Dias, D.C.; Kerkyras, S. Online condition monitoring of rolling stock wheels and axle bearings. Proceed. Institut. Mechan. Eng. Part F J. Rail Rapid Transit. 2014. [Google Scholar] [CrossRef]
  8. Entezami, M.; Roberts, C.; Weston, P.; Stewart, E.; Amini, A.; Papaelias, M. Perspectives on railway axle bearing condition monitoring. Proceed. Institut. Mechan. Eng. Part F J. Rail Rapid Transit. 2020, 234, 17–31. [Google Scholar] [CrossRef]
  9. Roshanmanesh, S.; Hayati, F.; Papaelias, M. Utilisation of Ensemble Empirical Mode Decomposition in Conjunction with Cyclostationary Technique for Wind Turbine Gearbox Fault Detection. Appl. Sci. 2020, 10, 3334. [Google Scholar] [CrossRef]
  10. Fan, W.; Xue, H.; Yi, C.; Xu, Z. TQWT-assisted statistical process control method for condition monitoring and fault diagnosis of bearings in high-speed rail. Proceed. Institut. Mechan. Eng. Part F J. Risk Reliab. 2020. [Google Scholar] [CrossRef]
  11. Huang, Y.; Lin, J.; Liu, Z.; Wu, W. A modified scale-space guiding variational mode decomposition for high-speed railway bearing fault diagnosis. J. Sound. Vib. 2019, 444, 216–234. [Google Scholar] [CrossRef]
  12. Ren, Y.; Li, W.; Zhang, B.; Zhu, Z.; Jiang, F. Fault diagnosis of rolling bearings based on improved kurtogram in varying speed conditions. Appl. Sci. 2019, 9, 1157. [Google Scholar] [CrossRef] [Green Version]
  13. An, X.; Zeng, H.; Li, C. Demodulation analysis based on adaptive local iterative filtering for bearing fault diagnosis. Measurement 2016, 94, 554–560. [Google Scholar] [CrossRef]
  14. McFadden, P.D.; Smith, J.D. Vibration monitoring of rolling element bearings by the high-frequency resonance technique-a review. Tribol. Int. 2015, 17, 3–10. [Google Scholar] [CrossRef]
  15. Antoni, J. The spectral kurtosis: A useful tool for characterising non-stationary signals. Mech. Syst. Signal Process. 2006, 20, 282–307. [Google Scholar] [CrossRef]
  16. Antoni, J. Fast computation of the kurtogram for the detection of transient faults. Mech. Syst. Signal Process. 2006, 21, 108–124. [Google Scholar] [CrossRef]
  17. Sun, H.; He, Z.; Zi, Y.; Yuan, J.; Wang, X.; Chen, J.; He, S. Multiwavelet transform and its applications in mechanical fault diagnosis-a review. Mech. Syst. Signal Process. 2004, 43, 1–24. [Google Scholar] [CrossRef]
  18. Lei, Y.; Lin, J.; He, Z.; Zi, Y. Application of an improved kurtogram method for fault diagnosis of rolling element bearings. Mech. Syst. Signal Process. 2011, 25, 1738–1749. [Google Scholar] [CrossRef]
  19. Wang, D.; Peter, W.T.; Tsui, K.L. An enhanced Kurtogram method for fault diagnosis of rolling element bearings. Mech. Syst. Signal Process. 2013, 35, 176–199. [Google Scholar] [CrossRef]
  20. Wang, Y.; He, Z.; Zi, Y. Enhancement of signal denoising and multiple fault signatures detecting in rotating machinery using dual-tree complex wavelet transform. Mech. Syst. Signal Process. 2010, 24, 119–137. [Google Scholar] [CrossRef]
  21. Chen, B.; Zhang, Z.; Zi, Y.; He, Z.; Sun, C. Detecting of transient vibration signatures using an improved fast spatial–spectral ensemble kurtosis kurtogram and its applications to mechanical signature analysis of short duration data from rotating machinery. Mech. Syst. Signal Process. 2013, 40, 1–37. [Google Scholar] [CrossRef]
  22. Moshrefzadeh, A.; Fasana, A. The Autogram: An effective approach for selecting the optimal demodulation band in rolling element bearings diagnosis. Mech. Syst. Signal Process. 2018, 105, 294–318. [Google Scholar] [CrossRef]
  23. Wang, D.; Tsui, K.L. Dynamic Bayesian wavelet transform: New methodology for extraction of repetitive transients. Mech. Syst. Signal Process. 2017, 88, 137–144. [Google Scholar] [CrossRef]
  24. Ma, P.; Zhang, H.; Fan, W.; Wang, C. Early fault diagnosis of bearing based on frequency band extraction and improved tunable Q-factor wavelet transform. Measurement 2019, 137, 189–202. [Google Scholar] [CrossRef]
  25. Ding, J.; Zhou, J.; Yin, Y. Fault detection and diagnosis of a wheelset-bearing system using a multi-Q-factor and multi-level tunable Q-factor wavelet transform. Measurement 2019, 143, 112–124. [Google Scholar] [CrossRef]
  26. Bozchalooi, I.S.; Liang, M. A smoothness index-guided approach to wavelet parameter selection in signal de-noising and fault detection. J. Sound Vib. 2007, 308, 246–267. [Google Scholar] [CrossRef]
  27. Miao, Y.; Zhao, M.; Lin, J. Improvement of kurtosis-guided-grams via Gini index for bearing fault feature identification. Meas. Sci. Technol. 2017, 28, 1–14. [Google Scholar] [CrossRef]
  28. Gryllias, K.C.; Antoniadis, I. A peak energy criterion (p. e.) for the selection of resonance bands in complex shifted morlet wavelet (csmw) based demodulation of defective rolling element bearings vibration response. Int. J. Wavelets Multiresolut. Inf. Process. 2009. [Google Scholar] [CrossRef]
  29. Wang, D. Spectral L2/L1 norm: A new perspective for spectral kurtosis for characterizing non-stationary signals. Mech. Syst. Signal Process. 2017, 104, 290–293. [Google Scholar] [CrossRef]
  30. Wang, D. Some further thoughts about spectral kurtosis, spectral L2/L1 norm, spectral smoothness index and spectral Gini index for characterizing repetitive transients. Mech. Syst. Signal Process. 2018, 108, 360–368. [Google Scholar] [CrossRef]
  31. Antoni, J. The infogram: Entropic evidence of the signature of repetitive transients. Mech. Syst. Signal Process. 2016, 74, 73–94. [Google Scholar] [CrossRef]
  32. Barszcz, T.; JabŁoński, A. A novel method for the optimal band selection for vibration signal demodulation and comparison with the kurtogram. Mech. Syst. Signal Process. 2011, 25, 431–451. [Google Scholar] [CrossRef]
  33. Gu, X.; Yang, S.; Liu, Y.; Hao, R. A novel Pareto-based Bayesian approach on extension of the infogram for extracting repetitive transients. Mech. Syst. Signal Process. 2018, 106, 119–139. [Google Scholar] [CrossRef]
  34. Li, C.; Cabrera, D.; de Oliveira, J.V.; Sanchez, R.V.; Cerrada, M.; Zurita, G. Extracting repetitive transients for rotating machinery diagnosis using multiscale clustered grey infogram. Mech. Syst. Signal Process. 2016, 76, 157–173. [Google Scholar] [CrossRef]
  35. McDonald, G.L.; Zhao, Q. Multipoint optimal minimum entropy deconvolution and convolution fix: Application to vibration fault detection. Mech. Syst. Signal Process. 2017, 82, 461–477. [Google Scholar] [CrossRef]
  36. Ma, H.; Feng, Z. Planet bearing fault diagnosis using multipoint optimal minimum entropy deconvolution adjusted. J. Sound Vib 2019, 449, 235–273. [Google Scholar] [CrossRef]
  37. Walden, A.T. Wavelet Analysis of Discrete Time Series. In Proceedings of the European Congress of Mathematics, Barcelona, Spain, 10 July 2020; Springer: Berlin/Heidelberg, Germany, 2001; Volume 202, pp. 627–641. [Google Scholar]
  38. Wan, S.; Peng, B. The FERgram: A rolling bearing compound fault diagnosis based on maximal overlap discrete wavelet packet transform and fault energy ratio. J. Mech. Sci. Technol. 2019, 33, 157–172. [Google Scholar] [CrossRef]
  39. Jiang, X.; Shi, J.; Huang, W.; Zhu, Z. Non-dominated solution set based on time–frequency infograms for local damage detection of rotating machines. ISA Trans. 2019, 92, 213–227. [Google Scholar] [CrossRef]
  40. Singh, J.; Darpe, A.K.; Singh, S.P. Rolling element bearing fault diagnosis based on Over-Complete rational dilation wavelet transform and auto-correlation of analytic energy operator. Mech. Syst. Signal. Process. 2018, 100, 662–693. [Google Scholar] [CrossRef]
  41. Xu, Y.; Zhen, D.; Gu, J.; Rabeyee, K.; Chu, F.; Gu, F.; Ball, A.D. Autocorrelated Envelopes for early fault detection of rolling bearings. Mech. Syst. Signal. Process. 2021, 146, 106990. [Google Scholar] [CrossRef]
Figure 1. (a) The original simulated signal; (b) the squared envelope signal generated from the IFB of (a); (c) the AC of (b).
Applsci 11 00009 g001
Figure 2. The flowchart of the MKurtogram.
Applsci 11 00009 g002
Figure 3. The time-domain waveform of the simulated signal. (a) the repetitive transients generated from outer race fault; (b) the interference impulse; (c) the cyclostationary noise; (d) the combined signal.
Applsci 11 00009 g003
Figure 4. Case 1: The results of Mkurtogram based on bearing fault period To. (a) Mkurtogram; (b) the filtered signal obtained by Mkurtogram; (c) the SES of (b).
Applsci 11 00009 g004
Figure 5. Case 1: The results of Mkurtogram based on the gear meshing period Tm. (a) Mkurtogram; (b) the filtered signal; (c) the SES of (b).
Applsci 11 00009 g005
Figure 6. Case 1: The results of FK (a) the FK; (b) the filtered signal obtained by FK; (c) the SES of (b).
Applsci 11 00009 g006
Figure 7. Case1: The results of Autogram (a) the Autogram; (b) the filtered signal obtained by Autogram; (c) the SES of (b).
Applsci 11 00009 g007
Figure 8. Case 2: The structure of the test bench.
Applsci 11 00009 g008
Figure 9. Case 2: (a) railway bearing test bench overview; (b) the local enlarged test point; (c) the test wheelset bearing; (d) the partial enlarged view of fault.
Applsci 11 00009 g009
Figure 10. Case 2: Dynamic loading forces; (a) the axis direction; (b) the vertical direction.
Applsci 11 00009 g010
Figure 11. Case 2: Time domain signal.
Applsci 11 00009 g011
Figure 12. Case2: The results of Mkurtogram (a) Mkurtogram; (b) the filtered signal; (c) the SES of (b).
Applsci 11 00009 g012
Figure 13. Case2: The results of FK (a) the FK; (b) the filtered signal obtained by FK; (c) the SES of (b).
Applsci 11 00009 g013
Figure 14. Case 2: The results of Autogram (a) the Autogram; (b) the filtered signal; (c) the SES of (b).
Applsci 11 00009 g014
Figure 15. Case 3: (a) experimental setup; (b) a fatigue spall fault on the inner raceway; (c) the slight dent fault on the outer raceway.
Applsci 11 00009 g015
Figure 16. Case 3: The bearing time domain waveform.
Applsci 11 00009 g016
Figure 17. Case 3: The results of Mkurtogram based on the outer race fault period To. (a) the Mkurtogram; (b) the filtered signal; (c) the SES of (b).
Applsci 11 00009 g017
Figure 18. Case 3: The results of Mkurtogram based on inner race fault period Ti. (a) the Mkurtogram; (b) the filtered signal; (c) the SES of (b).
Applsci 11 00009 g018
Figure 19. Case 3: The results of FK and Autogram. (a) the FK; (b) the Autogram.
Applsci 11 00009 g019
Table 1. Parameters of the bearing.
SpacesRoller DiameterPitch DiameterContact AngleRoller Number
FAG F-8078110926.5 mm185 mm10 deg17
Table 2. Parameters of the wheelset bearing.
Bearing SpacesRoller DiameterPitch DiameterContact AngleRoller Number
197,72624.74 mm176.29 mm8.833 deg20
Table 3. Bearing characteristic frequencies.
frfofifrb
7.75 Hz66.75 Hz88.25 Hz27.08 Hz
Publisher’s Note: MDPI stays neutral with regard to jurisdictional claims in published maps and institutional affiliations.

