Article

Characteristic Study of Briquette Cyanobacteria as Fuel in Chemical Looping Combustion with Hematite as Oxygen Carrier

1
Key Laboratory of Energy Thermal Conversion and Control of Ministry of Education, Southeast University, 2 Sipailou, Nanjing 210096, China
2
School of Energy and Mechanical Engineering, Nanjing Normal University, Nanjing 210042, China
3
State Key Laboratory of High-Efficiency Utilization of Coal and Green Chemical Engineering, Ningxia University, Yinchuan 750021, China
*
Authors to whom correspondence should be addressed.
Appl. Sci. 2021, 11(10), 4388; https://doi.org/10.3390/app11104388
Submission received: 25 March 2021 / Revised: 6 May 2021 / Accepted: 8 May 2021 / Published: 12 May 2021
(This article belongs to the Special Issue Chemical Looping Combustion Reactor and Its Applications)

Abstract

:
Due to the more and more serious cyanobacteria bloom problem, it is particularly urgent to find a technology suitable for large-scale disposal and the efficient recovery of abundant nitrogen and phosphorus resources in cyanobacteria. The combination of chemical looping combustion (CLC) and biomass densification technology is thought to be a promising utilization selection. Based on the experimental results, the mechanical strength and energy density of briquette cyanobacteria are evidently increased with the compressive load; whereas, 10% is the optimal moisture content in the densification process. A higher heating rate in TGA would result in the damage of the internal structure of the briquette cyanobacteria, which are conducive to the carbon conversion efficiency. The presence of a hematite oxygen carrier would enhance the carbon conversion and catalyzed crack liquid products. CO2 yield is increased 25 percent and CH4 yield is decreased 50 percent at 900 °C in the CLC process. In addition, the lower temperature and reduction atmosphere in CLC would result in a lower NO emission concentration. The reactivity and porous property of hematite OC in CLC also increased during 10 redox cycle experiments. The CLC process accelerates the generation of CaH2P2O7 and CaHPO4 in cyanobacteria ash, which is more conducive to phosphorus recovery.

1. Introduction

With the development of industry and agriculture, a large number of industrial sewage and domestic wastewater carrying nitrogen and phosphorus nutrients are continuously imported into the surrounding rivers, contributing to serious eutrophication [1,2]. The accumulation effect of eutrophication would stimulate rapid growth of phytoplankton—cyanobacteria [3,4]. The massive growth of cyanobacteria not only inhibits the growth and reproduction of other beneficial algae, but also causes poisoning or diseases of cultured animals. The traditional disposal methods for cyanobacteria include mechanical salvage, adding flocculant or algal removal agent, etc. [5]. Although mechanical salvage or adding flocculant is simple to operate, the investment is large and the problem of precipitated cyanobacteria and recovered flocculant is highlighted. Aquatic plants controlling is another method with a small impact on the ecosystem, while the treatment period is time consuming and the effect on algal bloom is limited [6]. Jacoby et al. [7] passivated the nutrients in American Green Lake by adding alum and sodium aluminate, which significantly inhibited algal growth and increased algal migration. Zhou et al. [8] found that phytoplankton could be reduced by 28.8% by the shading controlling method.
In fact, cyanobacteria are a kind of renewable bioenergy, which has high photosynthetic efficiency and strong CO2 sequestration capacity [9,10,11]. Under the background of carbon neutral, cyanobacteria as a carbon neutral energy could be utilized in the combustion process, which would not increase the total amount of greenhouse gases [12]. At present, although the carbon conversion efficiency and reaction rate of cyanobacteria are rather high through the conventional combustion treatment, the drying and dehydration of cyanobacteria before thermal treatment as well as the CO2 capture from the exit will greatly increase the application cost. The disadvantage of low energy density is enlarged for these conventional cyanobacteria treatments [13]. Biomass densification technology is one of the key options to increase energy density. The biomass raw material could be processed into an energy carrier with a specific shape by extrusion [14,15]. In addition, through the biomass densification technology, the cost of handling and conveyance is decreased and particle size distribution could also be controlled and more uniform.
However, another problem, a large amount of tar produced in the combustion process, is also particularly tricky. In the conventional biomass combustion process, tar decomposition is a cumbersome task, which would pass through the reactor and block the system tail pipe [16]. In addition, there is a high content of nitrogen and phosphorus in cyanobacteria. A large amount of thermal NOx and fuel NOx will be released in the conventional combustion process [17]. Therefore, it is necessary to find a promising combustion technology solving cyanobacteria tar generation and NOx emission. Besides, phosphorus is one of the essential nutrients for human beings. The phosphorus resource in cyanobacteria would be lost massively during the conventional combustion process [18]. It would be better if the selected technology includes a phosphorus recycling system from cyanobacteria to compensate for the global phosphorus depletion.
Chemical looping combustion (CLC) is an innovative combustion technology. Compared with the conventional combustion process, CLC has great differences in heat and mass conversion and energy utilization. CO2 capture, tar catalytic cracking, low NOx emission and phosphorus recovery are the obvious technical advantages of CLC. Fuel conversion in CLC no longer uses pure oxygen directly but relies on the lattice oxygen contained in the circulating metal oxide, i.e., oxygen carrier (OC) particles. A schematic illustration of the CLC process is shown in Figure 1. The CLC system is composed of two interconnected fluidized bed reactors, i.e., the air reactor and fuel reactor. Biomass fuel is transported into the fuel reactor and pyrolyzed and then gasified by a gasification agent. The gasification products would react with the lattice oxygen from the OC to realize completed combustion. The reacted or reduced OC is then transported to the air reactor, where it is oxidized by air to the initial state and then starts a new cycle in the fuel reactor. The circulating OC particles process remarkable catalytic properties, which can realize catalytic reaction and tar cracking, which is the biggest problem for biomass fuel disposal [19,20,21,22,23]. In addition, due to the complete elimination of airborne N2 and lower reaction of temperature (about 800–1100 °C) in the fuel reactor, the produced NOx emission from the CLC of briquette cyanobacteria is decreased greatly [24]. Besides, CLC has the potential to effectively recover phosphorus from organic wastes [25]. In the CLC process, the reduction condition in the fuel reactor would result in the potential production of water-soluble phosphate. Water-soluble phosphate is favorable as an agricultural fertilizer. Cyanobacteria contain a high content of phosphorus and represent an important secondary phosphorus source. Therefore, CLC is indicated to be an innovative cyanobacteria treatment technology with low NOx emission and the potential to recover phosphorus.
Various biomass particles have been studied in the CLC process [26,27,28,29]. These biomass fuels are all lignocellulosic biomass, which mainly includes hemicellulose, cellulose and lignin. The main components of cyanobacteria are extract, such as fat, wax or resin. The structure is totally different from the lignocellulosic biomass. So far, there are no academic reports about briquette cyanobacteria as fuel in CLC.
The combination of CLC and biomass densification technology is thought to be a promising cyanobacteria utilization selection, where the energy density of briquette cyanobacteria is evidently increased, and tar cracking, NOx emission reduction and phosphorus recovery may be realized. In the CLC of briquette cyanobacteria, the selection of an OC material is vital. Many metal oxides have been investigated as an OC for the CLC of biomass [30,31,32,33], while catalyzed cracking of tar could happen due to the presence of hematite. The active metallic Fe can mediate C-H and C-C bond cleavage, and the produced tar can be catalyzed cracking to small-molecular-weight gases by iron oxide [34]. The present work aims to investigate the characteristics of briquette cyanobacteria as a fuel in the process of CLC with hematite as an OC. First of all, the cyanobacteria powder is selected as raw material to extrude and pelletize to briquette cyanobacteria by a single briquetting unit device. Through the apparent measurement, the mechanical strength of briquette cyanobacteria samples is analyzed by varying the moisture content and compressive load. Besides, the thermochemical transformation process of briquette cyanobacteria is divided into three stages: drying (first break), devolatilization (second break) and char burnout (third break). The mechanical strength of briquette cyanobacteria after drying and devolatilization is analyzed by a thermogravimetric analysis reactor (TGA), and the combustion characteristics in the CLC process with hematite as an OC are analyzed in a single fluidized bed. The NOx release rule in CLC is also compared to that in the conventional combustion process. At last, 10 redox cycle experiments were conducted to investigate the reactivity stability, the morphological feature of hematite OC and phosphorus recovery possibility in the CLC of briquette cyanobacteria.

2. Materials and Methods

2.1. Materials

An experimental cyanobacteria sample was salvaged from Taihu Lake in Wuxi City, China. The ultimate analysis of the selected cyanobacteria sample in Table 1 was based on the air-dry basis, which is dried by natural ventilation for 48 h. The carbon content was 40.74%, hydrogen content was 13.02%, and nitrogen content reached to 11.41%. For the proximate analysis, the content of moisture (Mar) on a received basis reached 84.73%, which is relatively high for direct combustion disposal. Therefore, the pre-processing technology, especially drying, is necessary for the biomass densification process. In this work, the experimental cyanobacteria were samples from natural ventilation drying for 48 h. The volatile content on a dried basis was up to 85.32%, so study of the cyanobacteria devolatilization process is vital. Fixed carbon and ash content were relatively low and were 7.55 and 7.13%, respectively. Although densification technology would restrict the thermochemical reaction of briquette cyanobacteria, higher volatile content and lower fixed carbon are in favor of a complete reaction. Therefore, briquette cyanobacteria for CLC is one of the feasible disposals.
Natural hematite was selected as the oxygen carrier, and the properties are shown in Table 2. In order to enhance the mechanical strength of hematite as an OC, the hematite particles were firstly pulverized and calcined in a muffle oven at 950 °C for 3 h. The calcined samples were nearly spheroidal and were sieved to the particle size ranges of 0.3–0.45 mm, with an accumulation density of 2.44 kg/L.

2.2. Apparatus and Experimental Steps

2.2.1. Single Briquetting Unit

Cyanobacteria densification is conducted in a single briquetting unit (PC-15), shown in Figure 2. The unit consists of a support, a stainless steel cylinder, a plunger and a turning disc. The stainless steel cylinder works as the cyanobacteria sample model, and a plunger provides the compressive load on the cyanobacteria sample in the cylinder. Cyanobacteria powder of 0.5 g on a dried basis is loaded into the stainless steel cylinder model. The compressive load is then provided by the plunger, and the compressive load can be adjusted by rotating the turning disc connected to an Instron tester. When the setting compressive load is reached, the densification process should be maintained for enough time (1 min), and the relaxation process should also be conducted slowly. The briquette cyanobacteria are ejected from the lower position of the stainless steel cylinder.

2.2.2. Pressure Crushing Detector

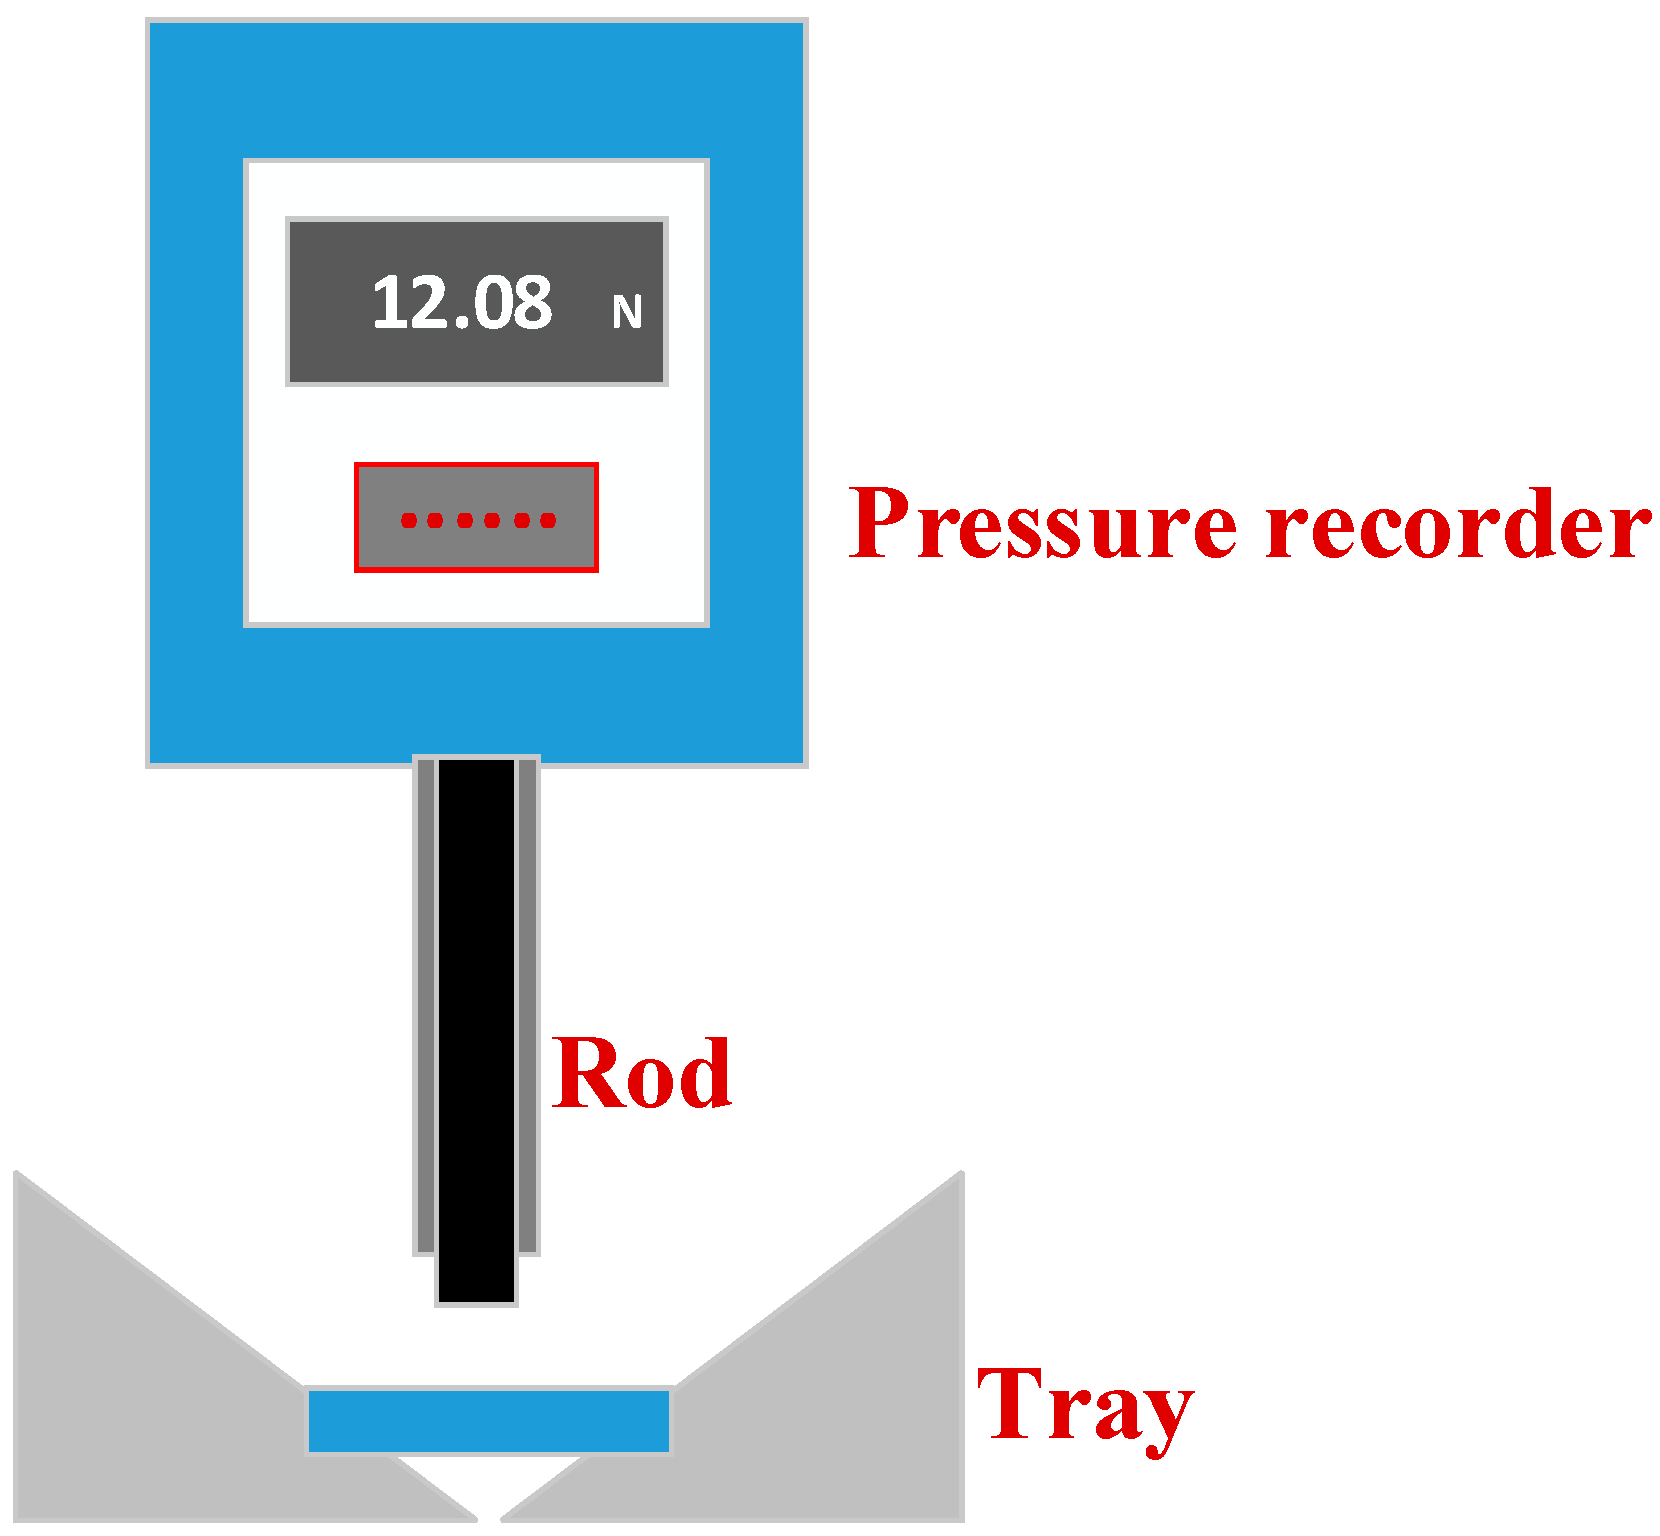
A pressure crushing detector, Digital Push–Pull Gauge (HP-500, Handpi, Shenzhen, China) shown in Figure 3, is a type of equipment used to detect the crushing pressure of shaped particles. The shaped sample is placed on the tray, and the rod moves vertically downward, and the pressure change value is recorded per 0.1 s by the above pressure recorder. The moving velocity of the rod could be set in the range of 10–50 mm/min, and all of the tests in this paper were set to 20 mm/min.

2.2.3. Thermogravimetric Analyzer

Two continuous reaction processes of briquette cyanobacteria in CLC, i.e., drying and devolatilization, were analyzed in a TGA92 thermogravimetric analyzer (TGA), which is manufactured by SETARAM. The TGA system is shown in Figure 4. Precision balance, heating furnace and data acquisition/processing microcomputer program are three important control modules. The briquette cyanobacteria sample can be programmed by heating it to the setting temperature in the heating furnace. The mass accuracy of the briquette cyanobacteria sample is 10 μg.

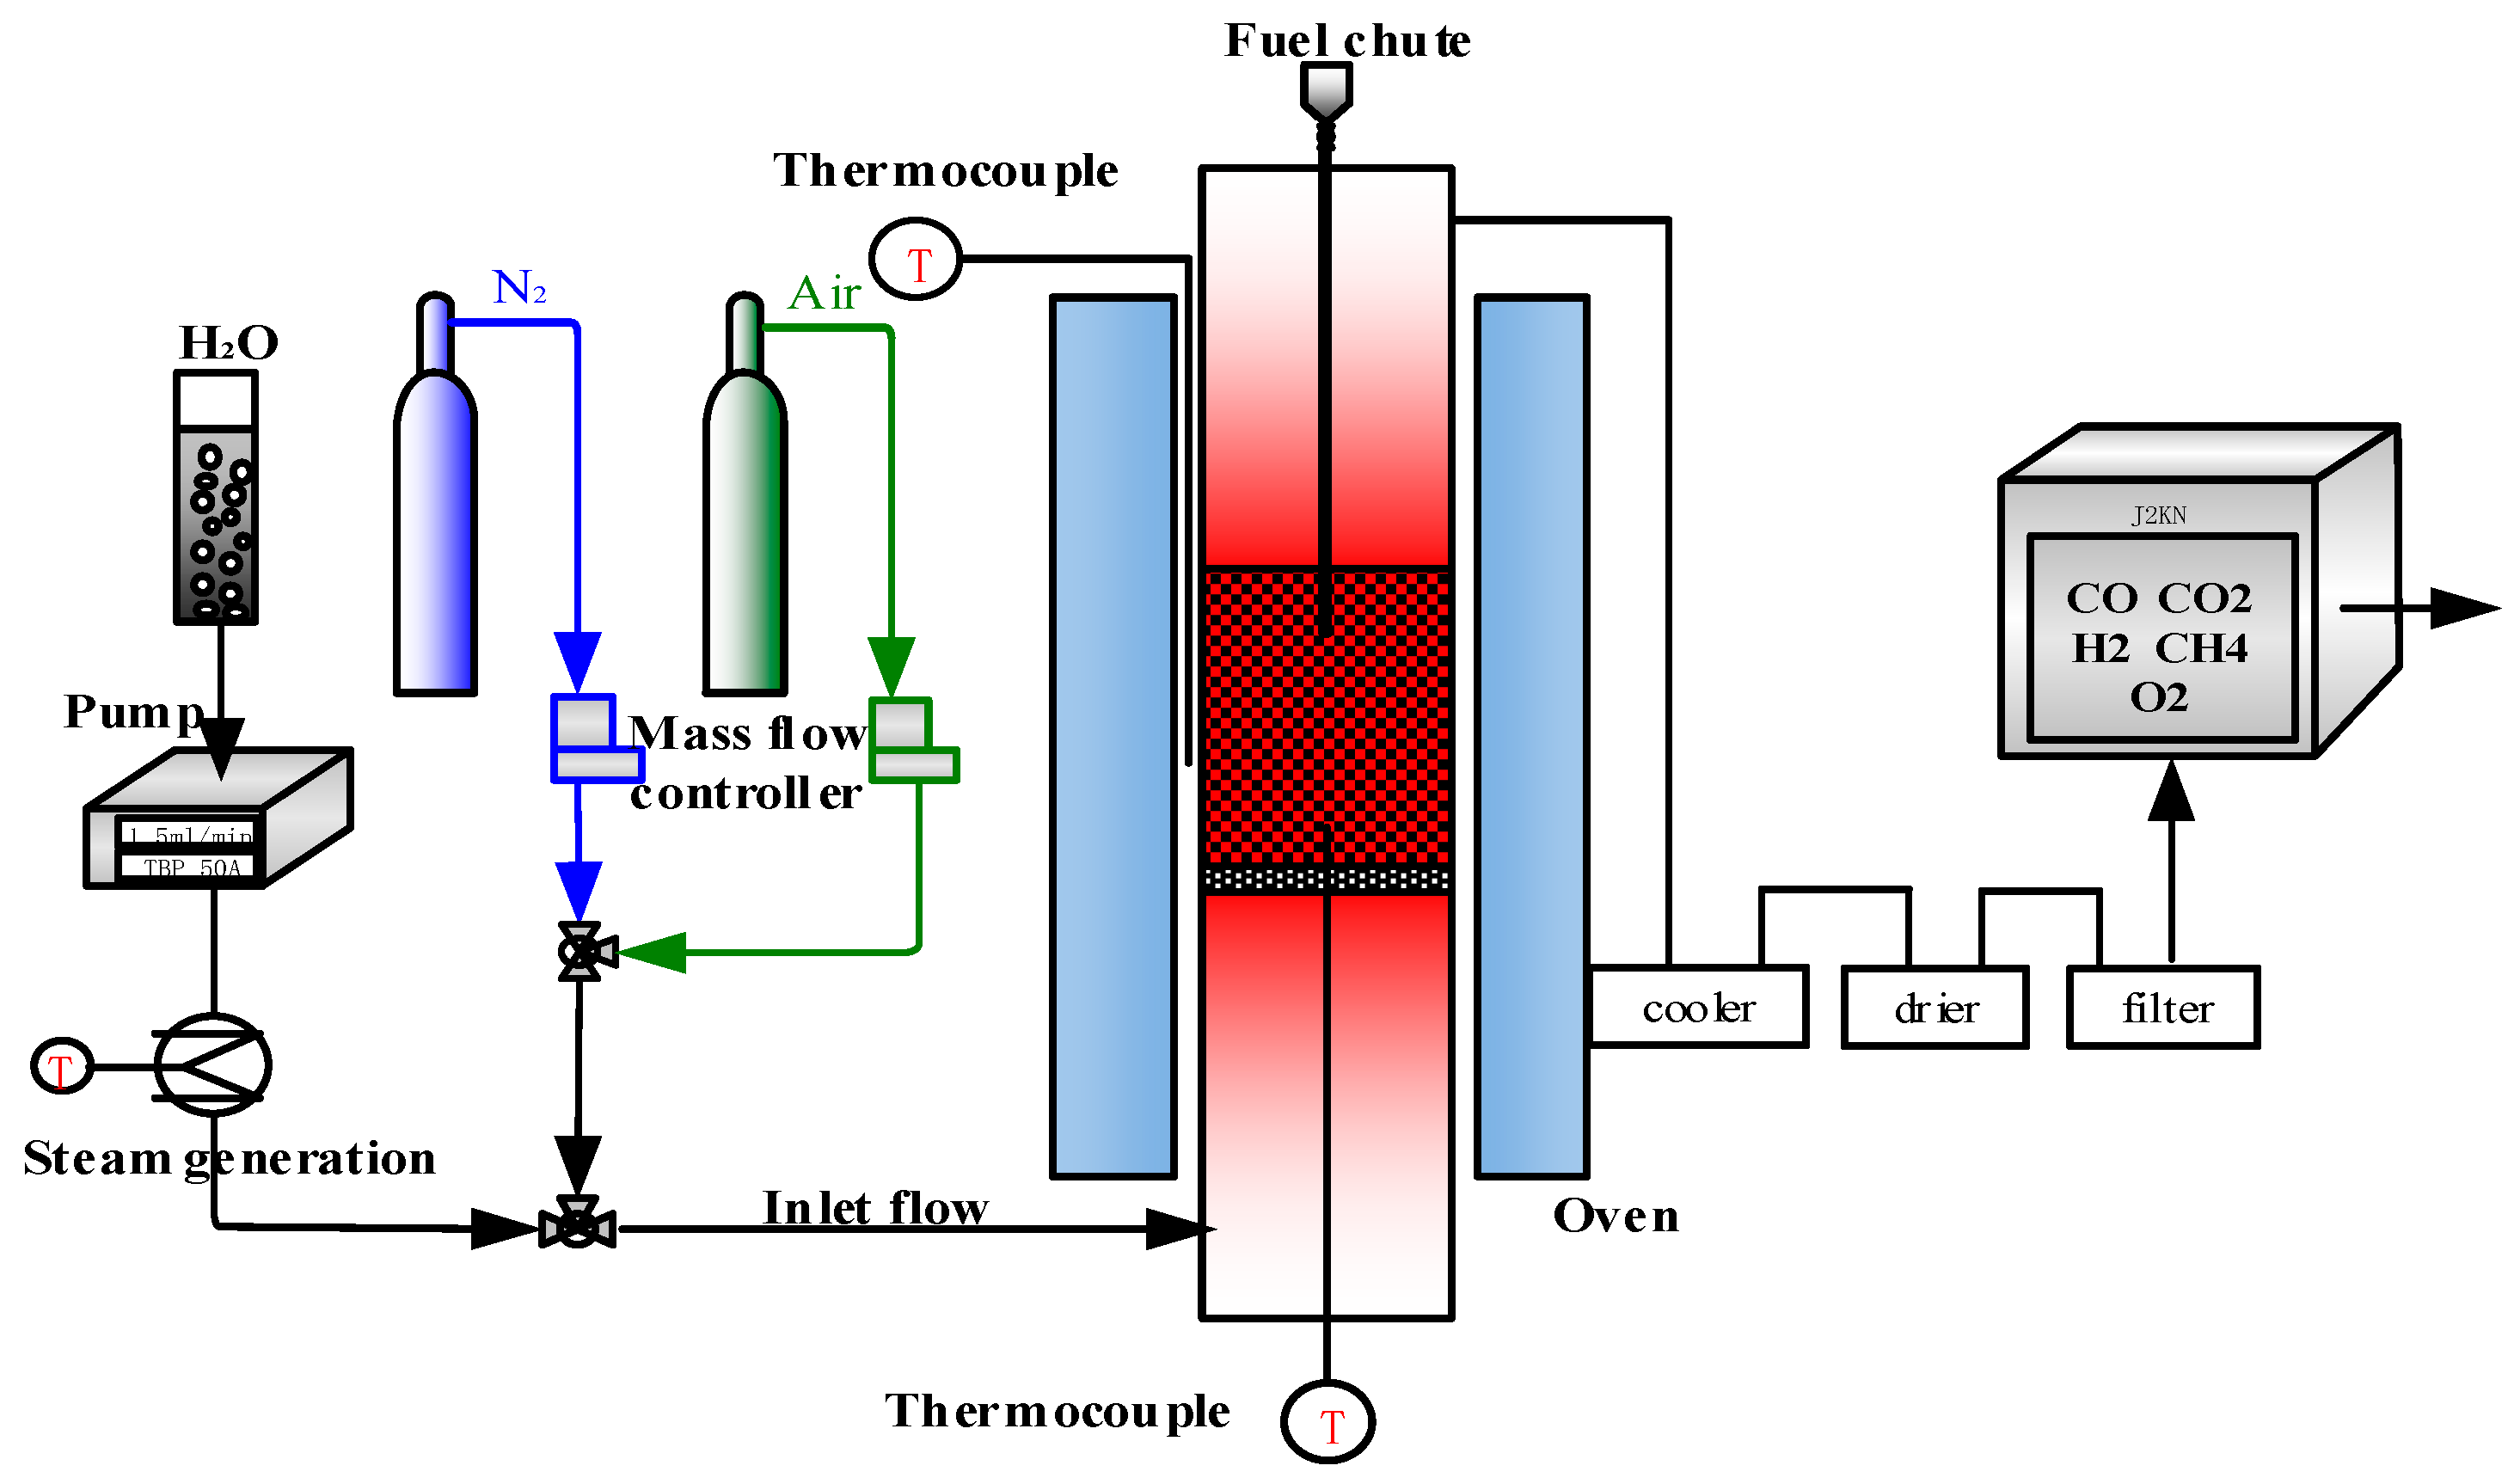
2.2.4. Single Fluidized Bed Reactor

The CLC tests were conducted in a single fluidized bed, as shown in Figure 5. The single fluidized bed 32 mm ID and 1340 mm high was electrically heated by two semicylindrical electric furnaces. A 2-mm-thick perforated plate with 100 holes located 450 mm from the bottom was used as a gas distributor and bed materials placement. In CLC tests, hematite was selected as the OC, and its mass was fixed at 30 g, when the bed height reached about 70 mm. In the blank tests, the mass of quartz sand was also 30 g, and a batch sample of 30 g hematite or quartz sand was added into the reactor under N2 (1.5 L/min) atmosphere. Meanwhile, steam (0.8 g/min) preheated at 180 °C was introduced to the bottom of the fluidized bed as a gasification agent. The fuel chute was opened, and briquette cyanobacteria of 0.5 g were introduced into the reaction zone when reaching the experimental temperature. The gaseous products passed through a cooler (15 °C), drier and filter, and the compositions were analyzed by a gas analyzer. In the cycle experiments, air was used in the oxidation process for 10 min after reduction. The specific redox cycle experimental steps are as follows:
(1)
Thirty grams of hematite particles are placed on the porous plate of the single fluidized bed, and air flow of 1.5 L/min is introduced to ensure that the hematite oxygen carrier is in the oxidation state;
(2)
When the single fluidized bed reactor is heated to the experimental temperature, steam as gasification agent is introduced and air flow is switched to nitrogen (1.5 L/min);
(3)
When the temperature of the reactor is stable, a batch of 0.5 g briquette cyanobacteria fuel is put into the reactor through the storage bin, and the reaction starts;
(4)
The total reaction time is set at 30 min, and the gas composition and concentration in the flue gas are monitored online;
(5)
When there is no carbonaceous gas detected, steam flow is cut off and nitrogen flow is switched to air again (1.5 L/min), reducted hematite starts to be oxidized and completes regeneration. Then, the air flow is switched to nitrogen (1.5 L/min), and briquette cyanobacteria of 0.5 g are put into the reactor again.

2.3. Procedures

The system of the CLC of briquette cyanobacteria involves four technologies or processes, such as raw material preparation (cyanobacteria densification process), drying at a low reaction temperature, devolatilization before reaction with OC and char burnout (main thermochemical transformation in CLC). The drying, devolatilization and char burnout are considered as the first, second and third break of briquette cyanobacteria in the CLC process. The performances of briquette cyanobacteria during raw material preparation and in the CLC process are analyzed in three reactors (Table 3): (reactor 1) single briquetting unit and pressure crushing detector to study the densification process, especially for the binding effect under different densification conditions; (reactor 2) thermogravimetric reactor to study the mechanisms of mechanical strength evolution and thermochemical transformation of briquette cyanobacteria, including the drying, devolatilization and char burnout processes; (reactor 3) single fluidized bed to study the thermochemical transformation of briquette cyanobacteria and the cyclical performance of hematite in the CLC of briquette cyanobacteria.

2.3.1. Densification Process from Single Briquetting Unit

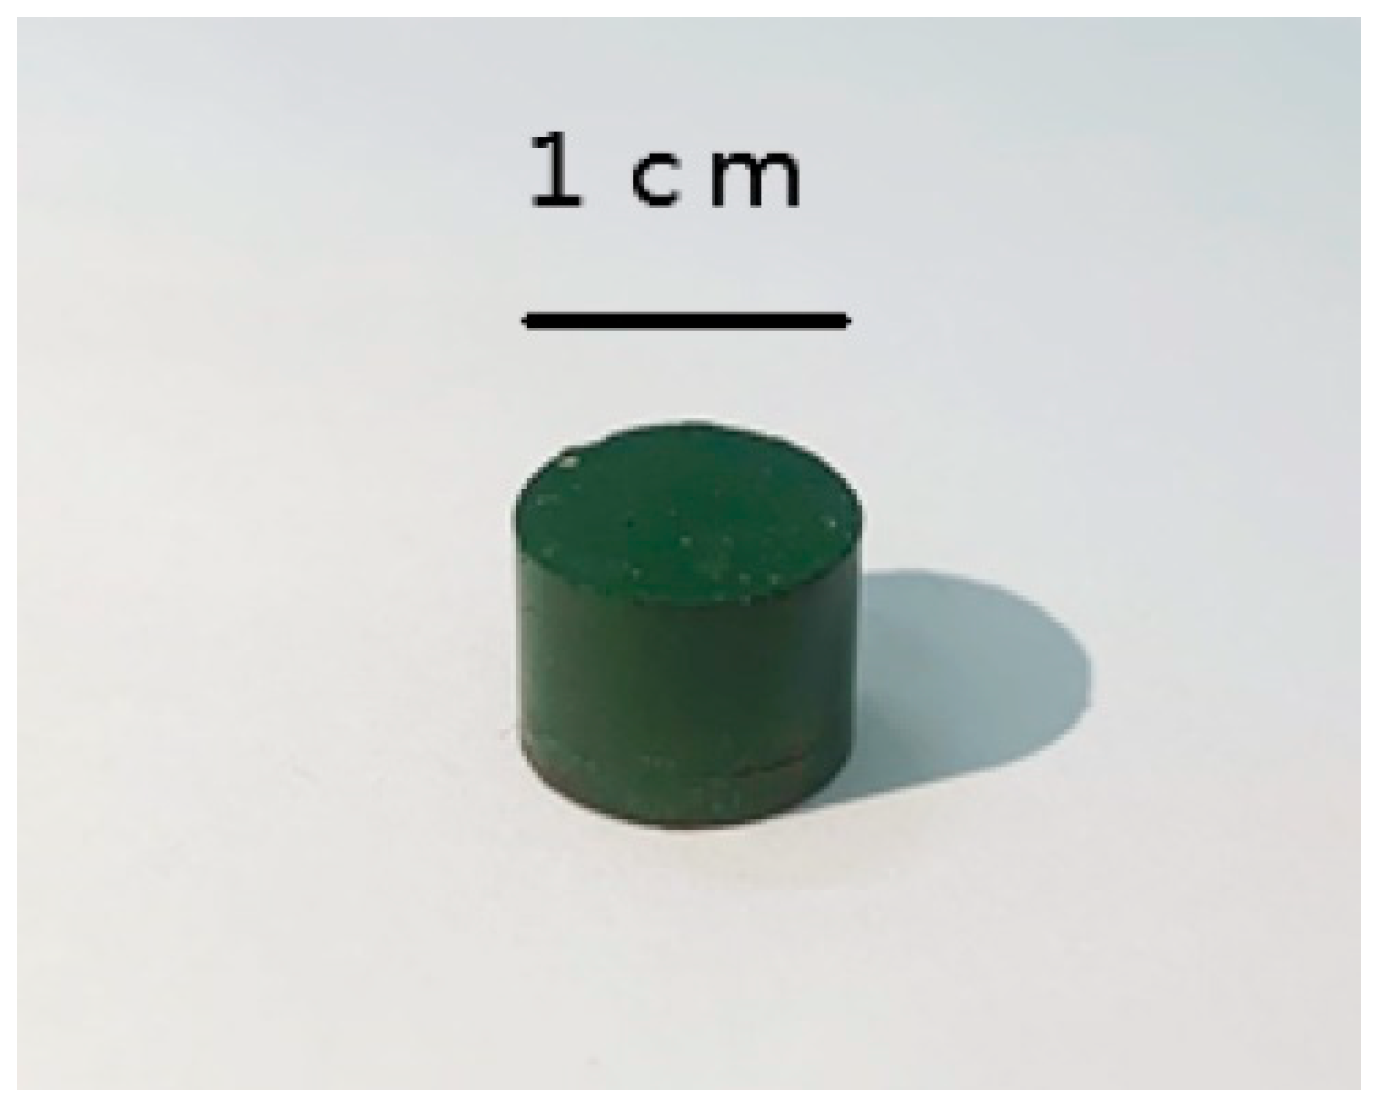
Densification experiments were carried out in the single briquetting unit according to the configuration in Figure 2. The briquette cyanobacteria sample under the compressive load of 3 tons is shown in Figure 6. The made briquette cyanobacteria were a cylinder with a diameter of about 1 cm and a height of about 1 cm. The height would decrease with the increase in compressive load, while the diameter remains unchanged due to the fixed size of the stainless steel cylinder model in the single briquetting unit (Figure 2). Three kinds of factors are analyzed, including moisture content and compressive load. In order to study the influence of the moisture content, the cyanobacteria samples on a received basis are dried in an oven at 60 °C for different drying times. According to the detected moisture content, the samples of moisture content 5, 10, 15 and 20% were taken out for studying. The compressive load was also varied from 1 ton, 3 tons, 5 tons to 7 tons. All of the tests are conducted with cyanobacteria samples of 0.5 g. The forming rate and relax density are two assessment indexes for the densification performance of briquette cyanobacteria. In addition, some pressure crushing tests of the briquette cyanobacteria samples were conducted by the pressure crushing detector (Figure 3). The compressive force data per 0.1 s were recorded to study the original mechanical strength of briquette cyanobacteria.

2.3.2. Drying Process from Thermogravimetric Analysis Reactor

Drying is the first step in the thermochemical transformation process of briquette cyanobacteria. Briquette cyanobacteria would experience the first break during the drying process. In this section, the tests about how the drying process or first break process of briquette cyanobacteria were carried out in a TGA reactor under N2 atmosphere are explained, where the experimental temperature was set to 180 °C. The heating rate was set to 10 °C/min, and the flow of N2 was fixed at 1 L/min. In addition, in order to avoid rehydration, the dried briquette cyanobacteria were cooled down and protected in sealed bags. The briquette cyanobacteria based on different heating times or heating rates were taken out from TGA reactor, to analyze its mechanical strength evolution. The gas concentration at the exhaust was continuously monitored. When the gas concentrations of CO, CO2 or CH4 are detected, and mass data after drying loss stay unchanged, the drying process is thought to be totally finished and the devolatilization process has taken place. For the experimental factors, except the moisture content and compressive load, the effects of heating time and rate were analyzed for the drying process.

2.3.3. Devolatilization Process from Thermogravimetric Analysis Reactor

Following the drying process or first break, the devolatilization process would take place and result in a second break of the briquette cyanobacteria, which are conducted in TGA under N2 atmosphere (1 L/min). The experimental temperature was set to 500 °C, and the process was continuously monitored by an online gas analyzer. When the gas concentrations of volatiles, including CO, H2, CO2 and CH4, decrease sharply and are almost disappeared, and mass data after two loss processes (drying and devolatilization loss) stay unchanged, the devolatilization process is thought to be finished, and the samples are cooled in N2 atmosphere and then taken out from the TGA.

2.3.4. Drying, Devolatilization and Char Burnout Process from Single Fluidized Bed

Based on the above TGA tests, the densification parameters for better mechanical strength of briquette cyanobacteria have been studied. The briquette cyanobacteria under the optimal densification parameters are then applied to study their thermochemical transformation in the chemical looping process by single fluidized bed. In single fluidized bed, the whole combustion process, including the drying, devolatilization and char burnout processes, is monitored by recording the gas concentrations at the exhaust. The fluidizing agent of N2 was fixed at 1.5 L/min, and steam flow as a gasification agent was at 0.8 g/min. The mass of the hematite oxygen carrier added to the reactor was 30 g (bed height: 7 cm), and the mass of the briquette cyanobacteria was still 0.5 g. Based on the tests, the carbon conversion rate, gas yield and OC stability (cycle test) were investigated under different experimental conditions including temperature and bed materials (quartz sand and hematite).

2.4. Quality Attributes and Analytical Method

2.4.1. Forming Rate

The briquette cyanobacteria samples were located in an oscillator, which ran for 5 min. M1 represents the mass of sample before the oscillator test, and M2 represents the mass of main shaped sample after the oscillator test. The forming rate ( β ) is calculated as:
β = 1 − (M1 − M2)/M1

2.4.2. Relax Density

The original briquette cyanobacteria samples would be deformed or collapsed in stored procedure, increasing the cost of transportation and storage. Relax density ( ρ ) is an index to determine the densification quality and combustion performance of briquette samples, which reflects the adhesion between particles. The relax density ( ρ ) is calculated as:
ρ = 4 m / π d 2 h
where ρ is relax density (g/cm3), m/d/h is the briquette sample mass/diameter/length after three days storage.

2.4.3. Carbon Conversion

Carbon conversion, X C , is the index of the conversion degree of biomass carbon. The biomass carbon is consumed in the combustion process, which is converted into carbonaceous gases (CO, CO2 and CH4) or some liquid products (tar). It is noted that there were no other carbon molecules similar to HCN, C2H4 detected. In the work, carbon conversion ( X C ) is calculated as:
X C = 0 t n o u t ( X C O + X C O 2 + X C H 4 ) d t n C , c o a l
where X i ( i = C O , C O 2 , C H 4 , H 2 ) are the gas concentrations of CO, CO2, CH4 and H2 at the exhaust, respectively. Additionally, n o u t is the whole molar flow rate of outlet gases, which can be calculated by the N2 mass balance method:
n o u t = n N 2 1 X C O X C O 2 X C H 4 X H 2
To investigate the reaction rate, the carbon conversion rate, r C , was introduced, which is calculated as:
r C = d X C d t
In order to evaluate the transformation principle of single carbonaceous gases, the gas yields of CO/CO2/CH4 were designed, which is the ratio of CO/CO2/CH4 in the total carbonaceous gases, respectively. It is worthwhile to point out that the calculation assumes CO, CO2 and CH4 are the main carbonaceous gases. The details of formulas are defined as follows:
f C O 2 = n o u t X C O 2 n o u t ( X C O + X C O 2 + X C H 4 )
f C O = n o u t X C O n o u t ( X C O + X C O 2 + X C H 4 )
f C H 4 = n o u t X C H 4 n o u t ( X C O + X C O 2 + X C H 4 )

3. Results

3.1. Characteristic of Briquette Cyanobacteria during Densification Process

3.1.1. Mechanical Strength Analysis Based on Single Briquetting Unit

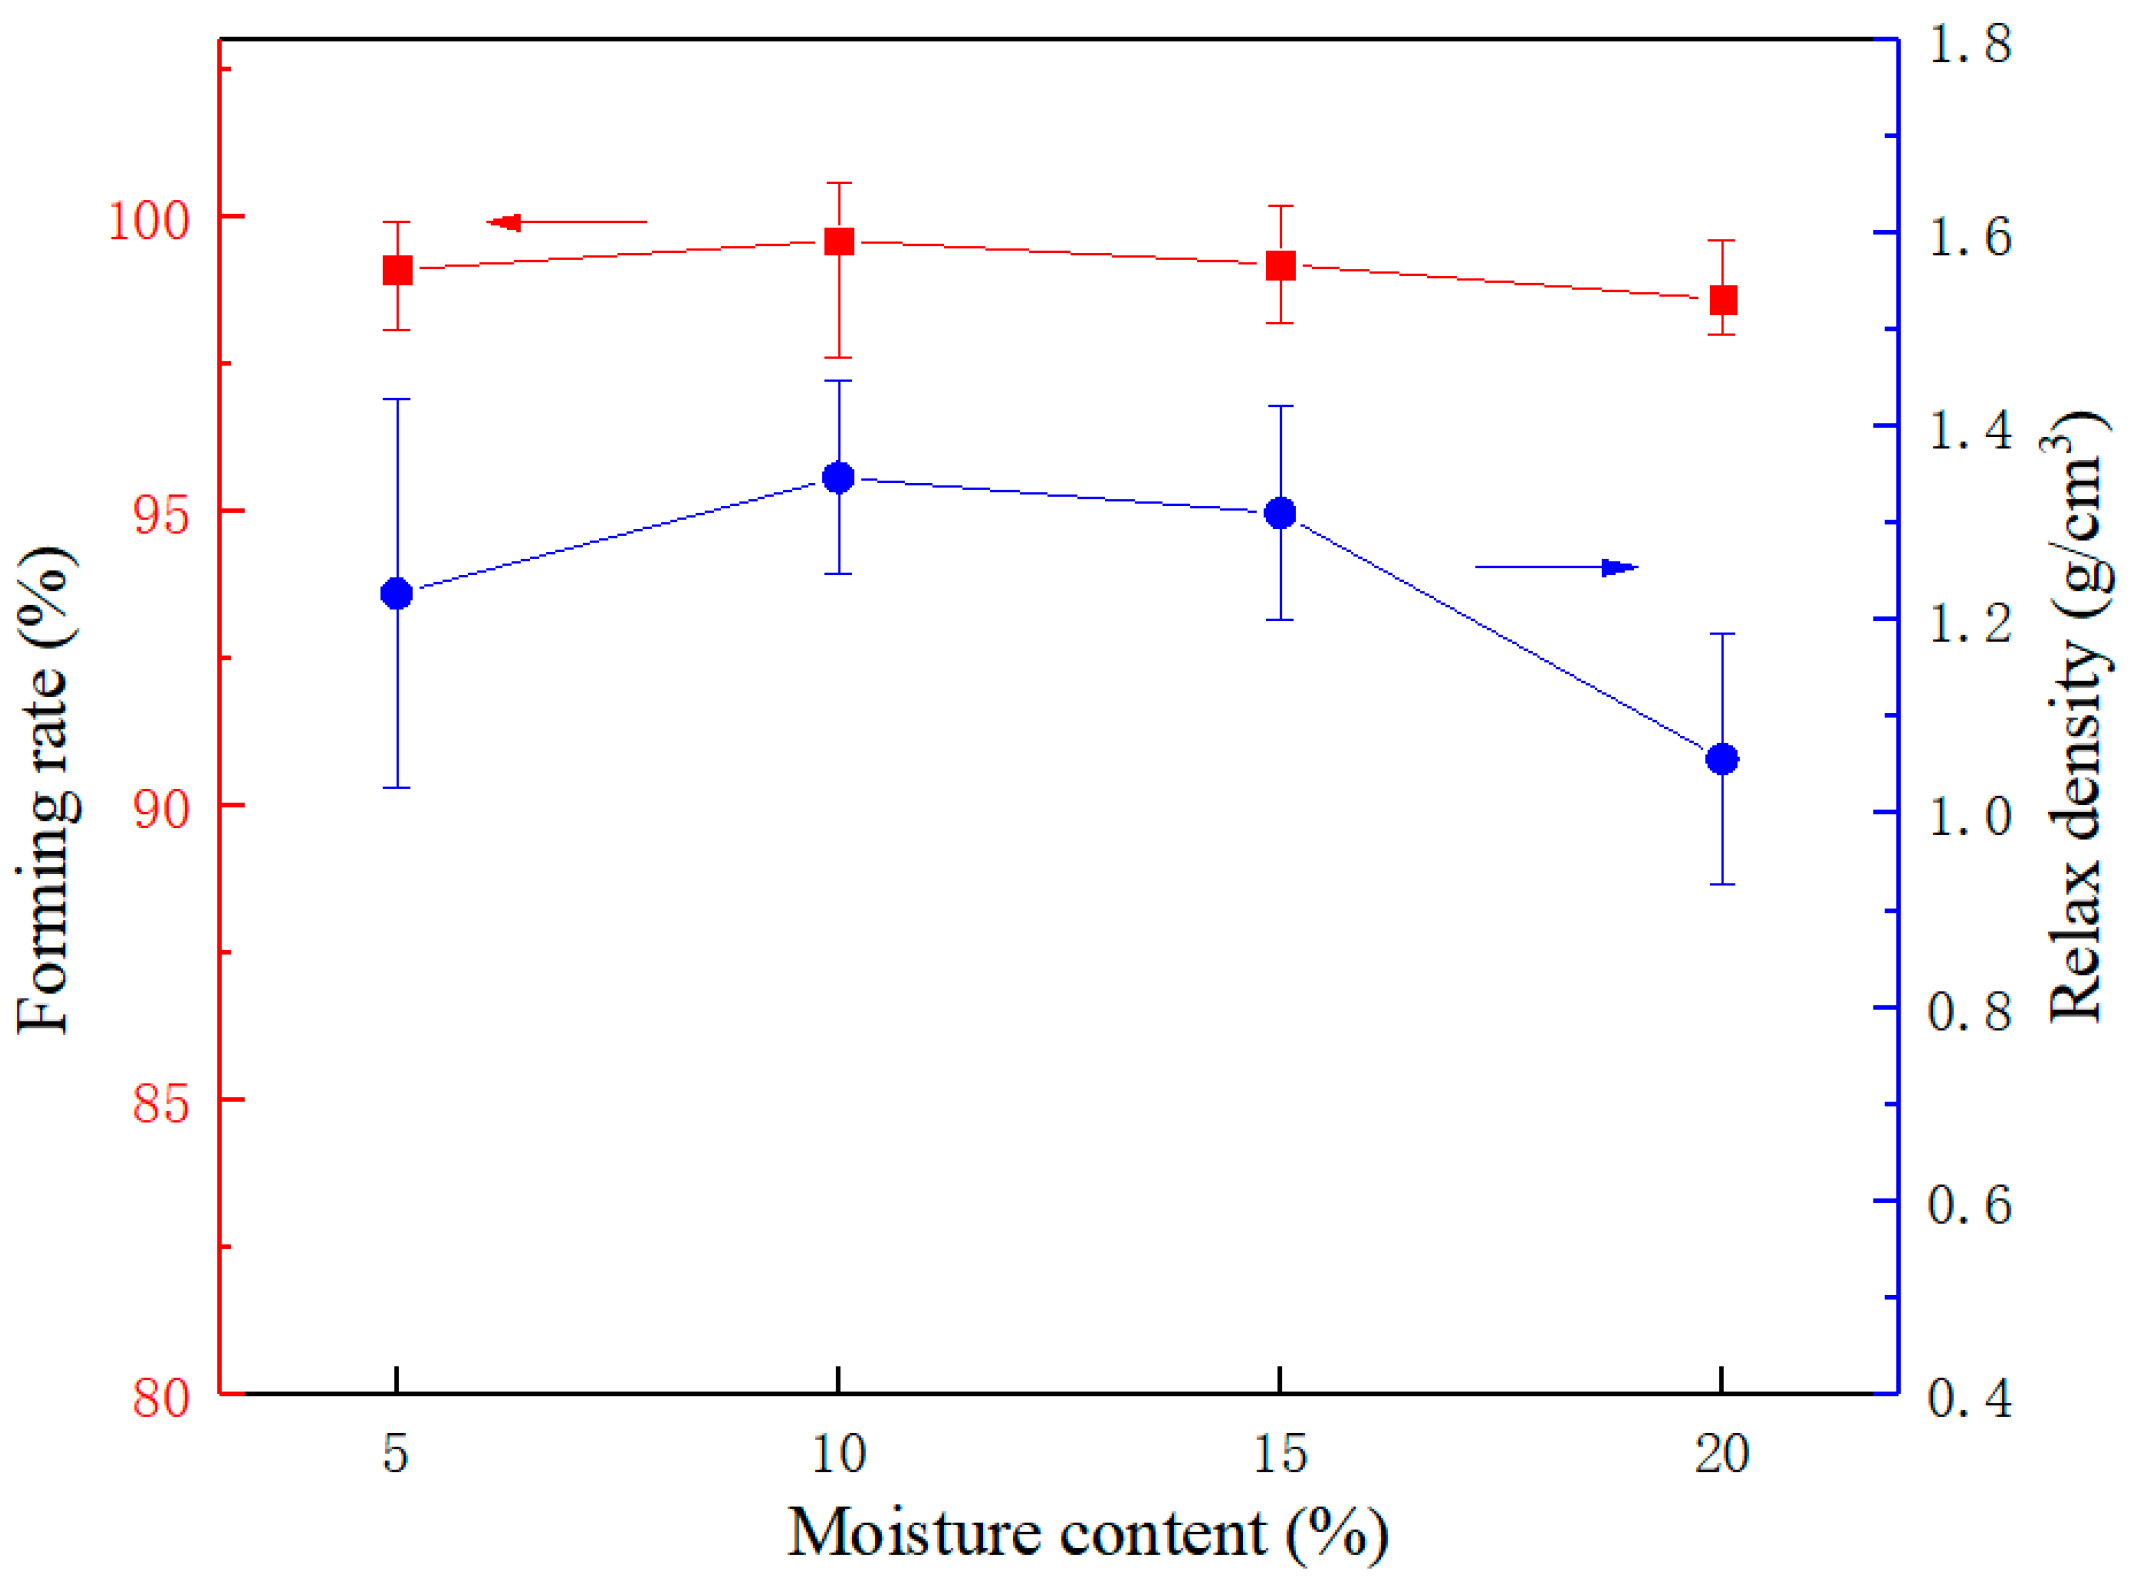
In this section, how the densification experiments of cyanobacteria were conducted in the single briquetting unit is explained. Two factors, i.e., moisture content and compressive load, were investigated. At first, the moisture content varied from 5, 10, 15 to 20% by heating cyanobacteria samples on a received basis in an oven at 60 °C for different drying times. The received cyanobacteria samples were densified under the compressive load of 3 tons. The forming rate and relax density for the briquette cyanobacteria samples of different moisture contents are shown in Figure 7.
Based on Figure 7, it is found that the influence of moisture content on forming rate is very small, which maintains at about 99%. The maximum is 99.6% when moisture content is 10%. The high forming rate is due to the fine particle size range of raw cyanobacteria. The briquette cyanobacteria are compact and surface smooth with no delamination. The high forming rate reflects a good molding effect of the single briquetting unit. On the other hand, although relax density shows the same changing trend with forming rate, the change range of relax density with moisture is relatively large, which is varied from 1.057 to 1.348 g/cm3 and reaches the peak under the moisture content of 10%. Therefore, the moisture content of 10% is the optimal moisture content for the cyanobacteria densification process of a single briquetting unit.
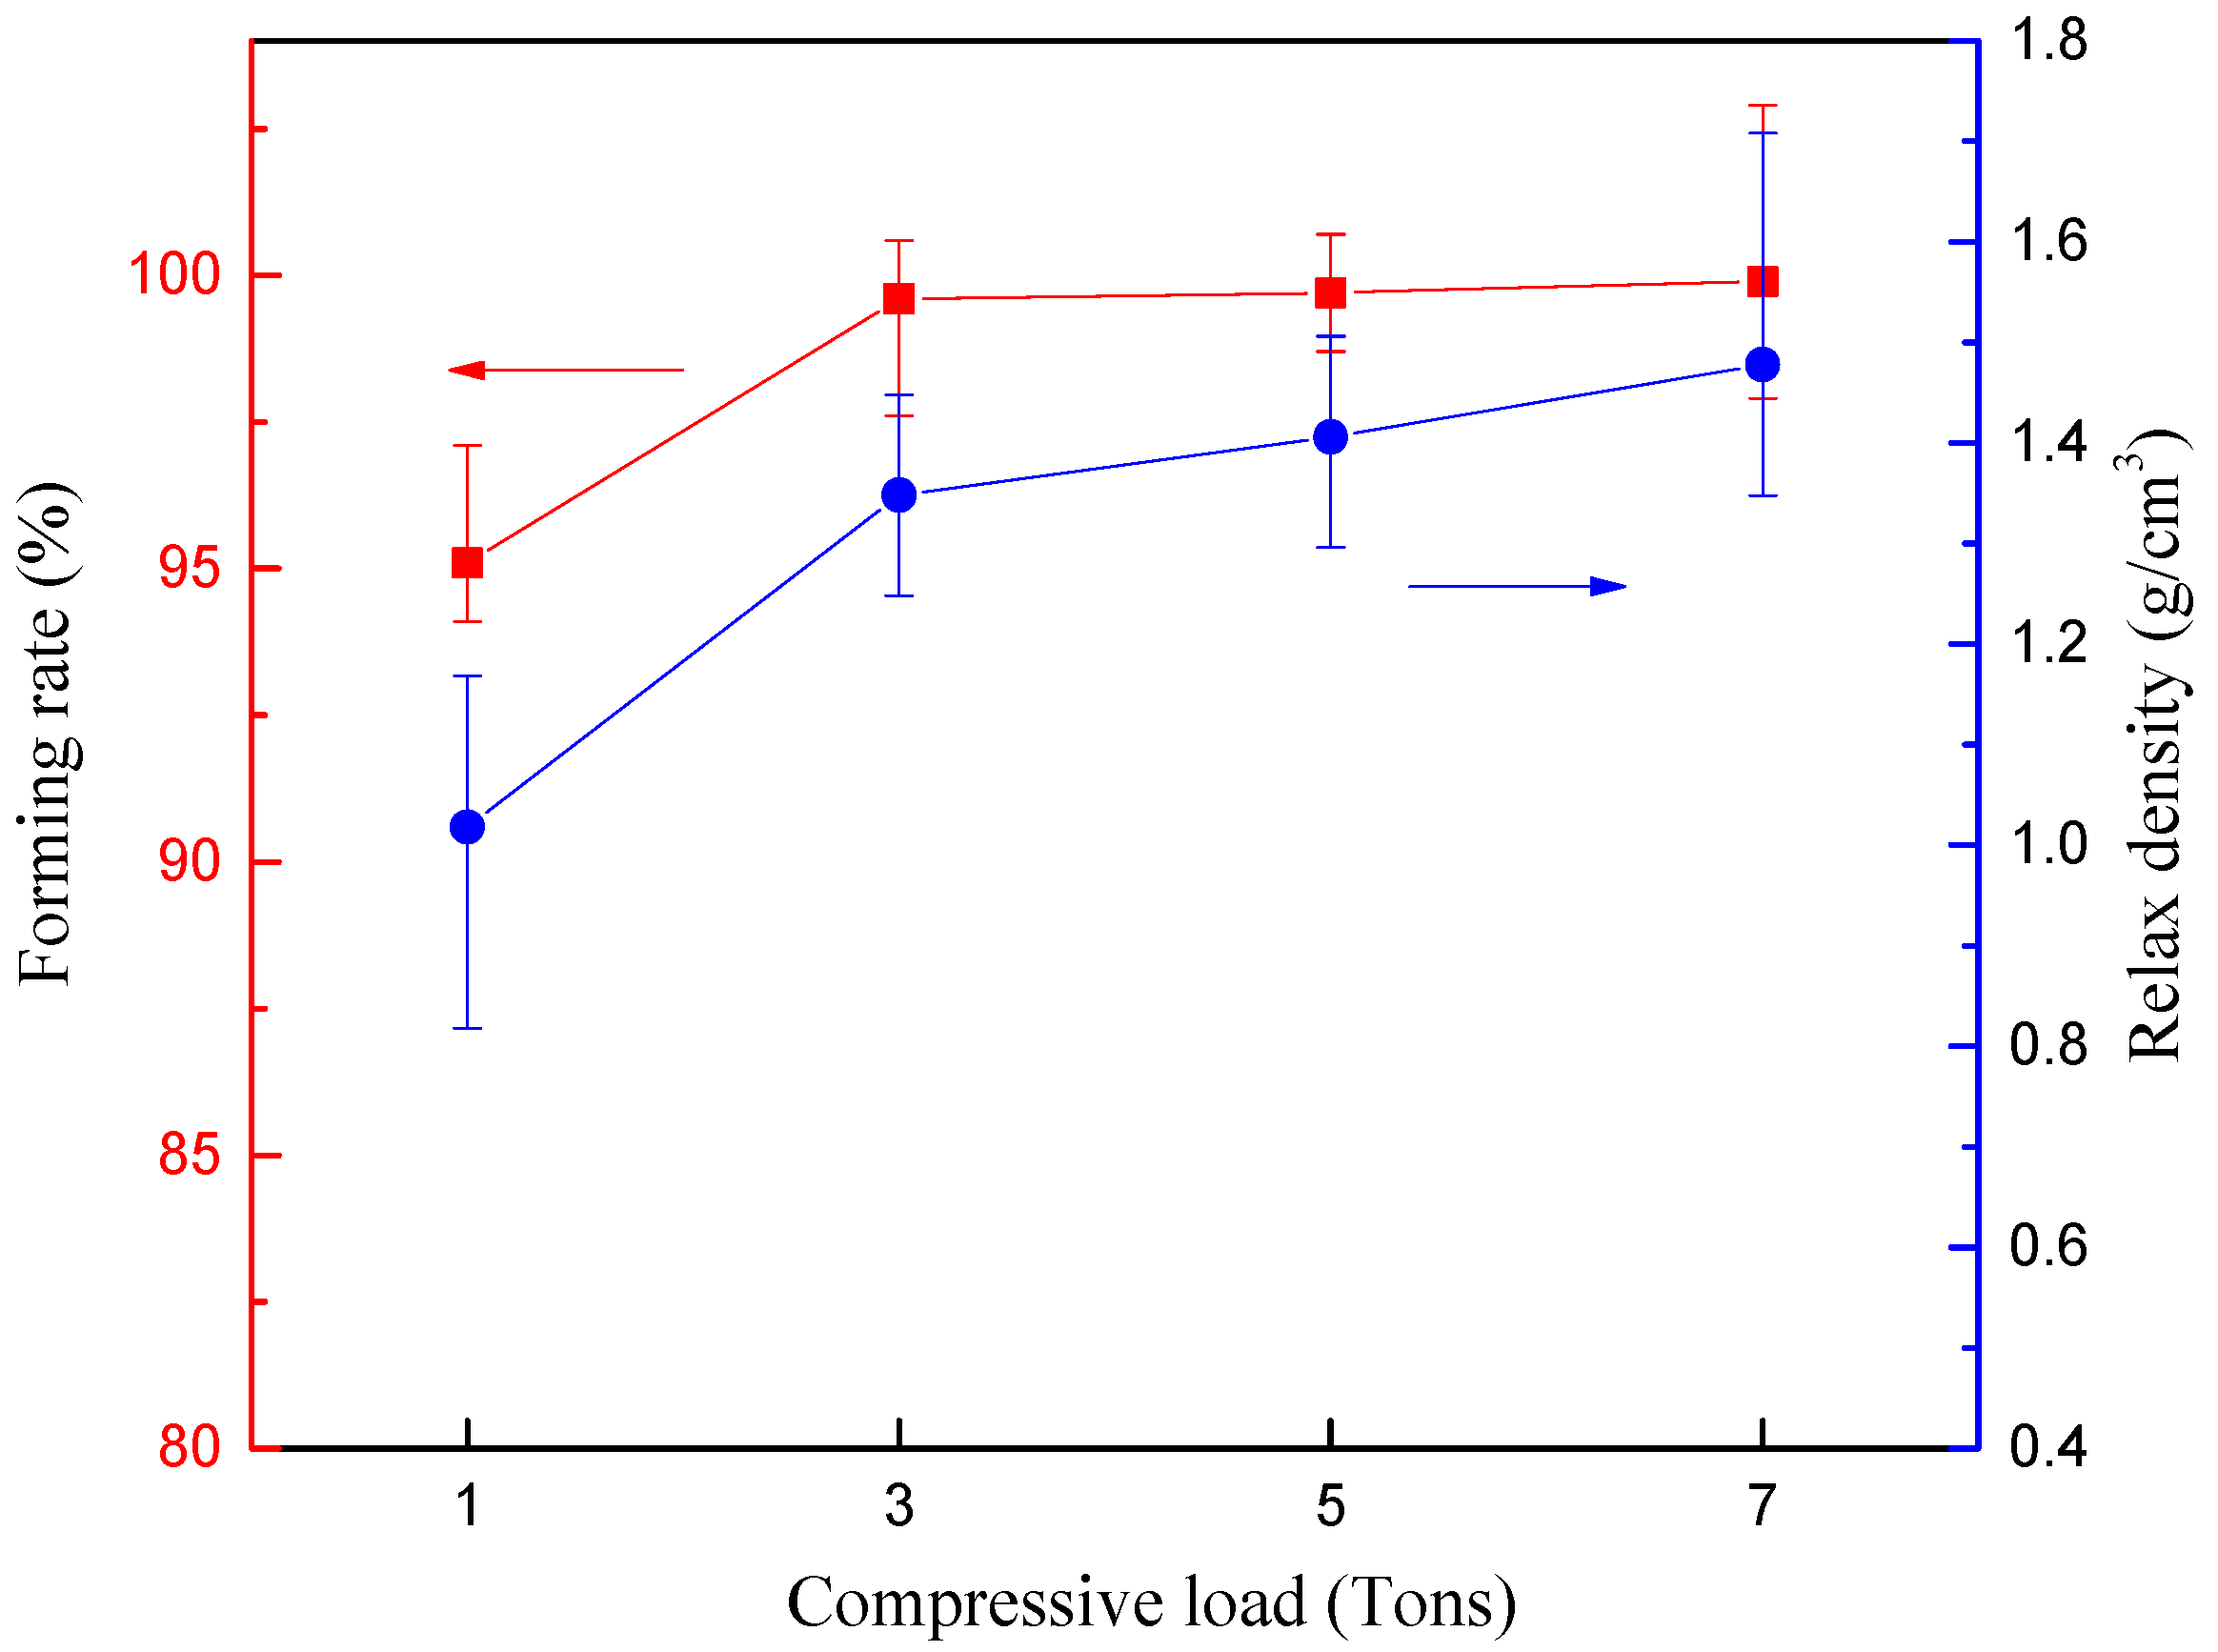
The effect of compressive load on the forming rate and relax density is shown in Figure 8. The briquette cyanobacteria were produced by the compressive load of 1, 3, 5 and 7 tons with a moisture content of 10%. The variations in the forming rate and relax density with compressive load show a similar changing trend, which increases with the increase in compressive load. The increasing extent from 1 to 3 tons is greater than other compressive load ranges. Therefore, the densification process exhibits an evident change when the compressive load increases from 1 to 3 tons, while the molding effect is not that obvious when the compressive load is over 3 tons.

3.1.2. Mechanical Strength Analysis Based on Pressure Crushing Detector

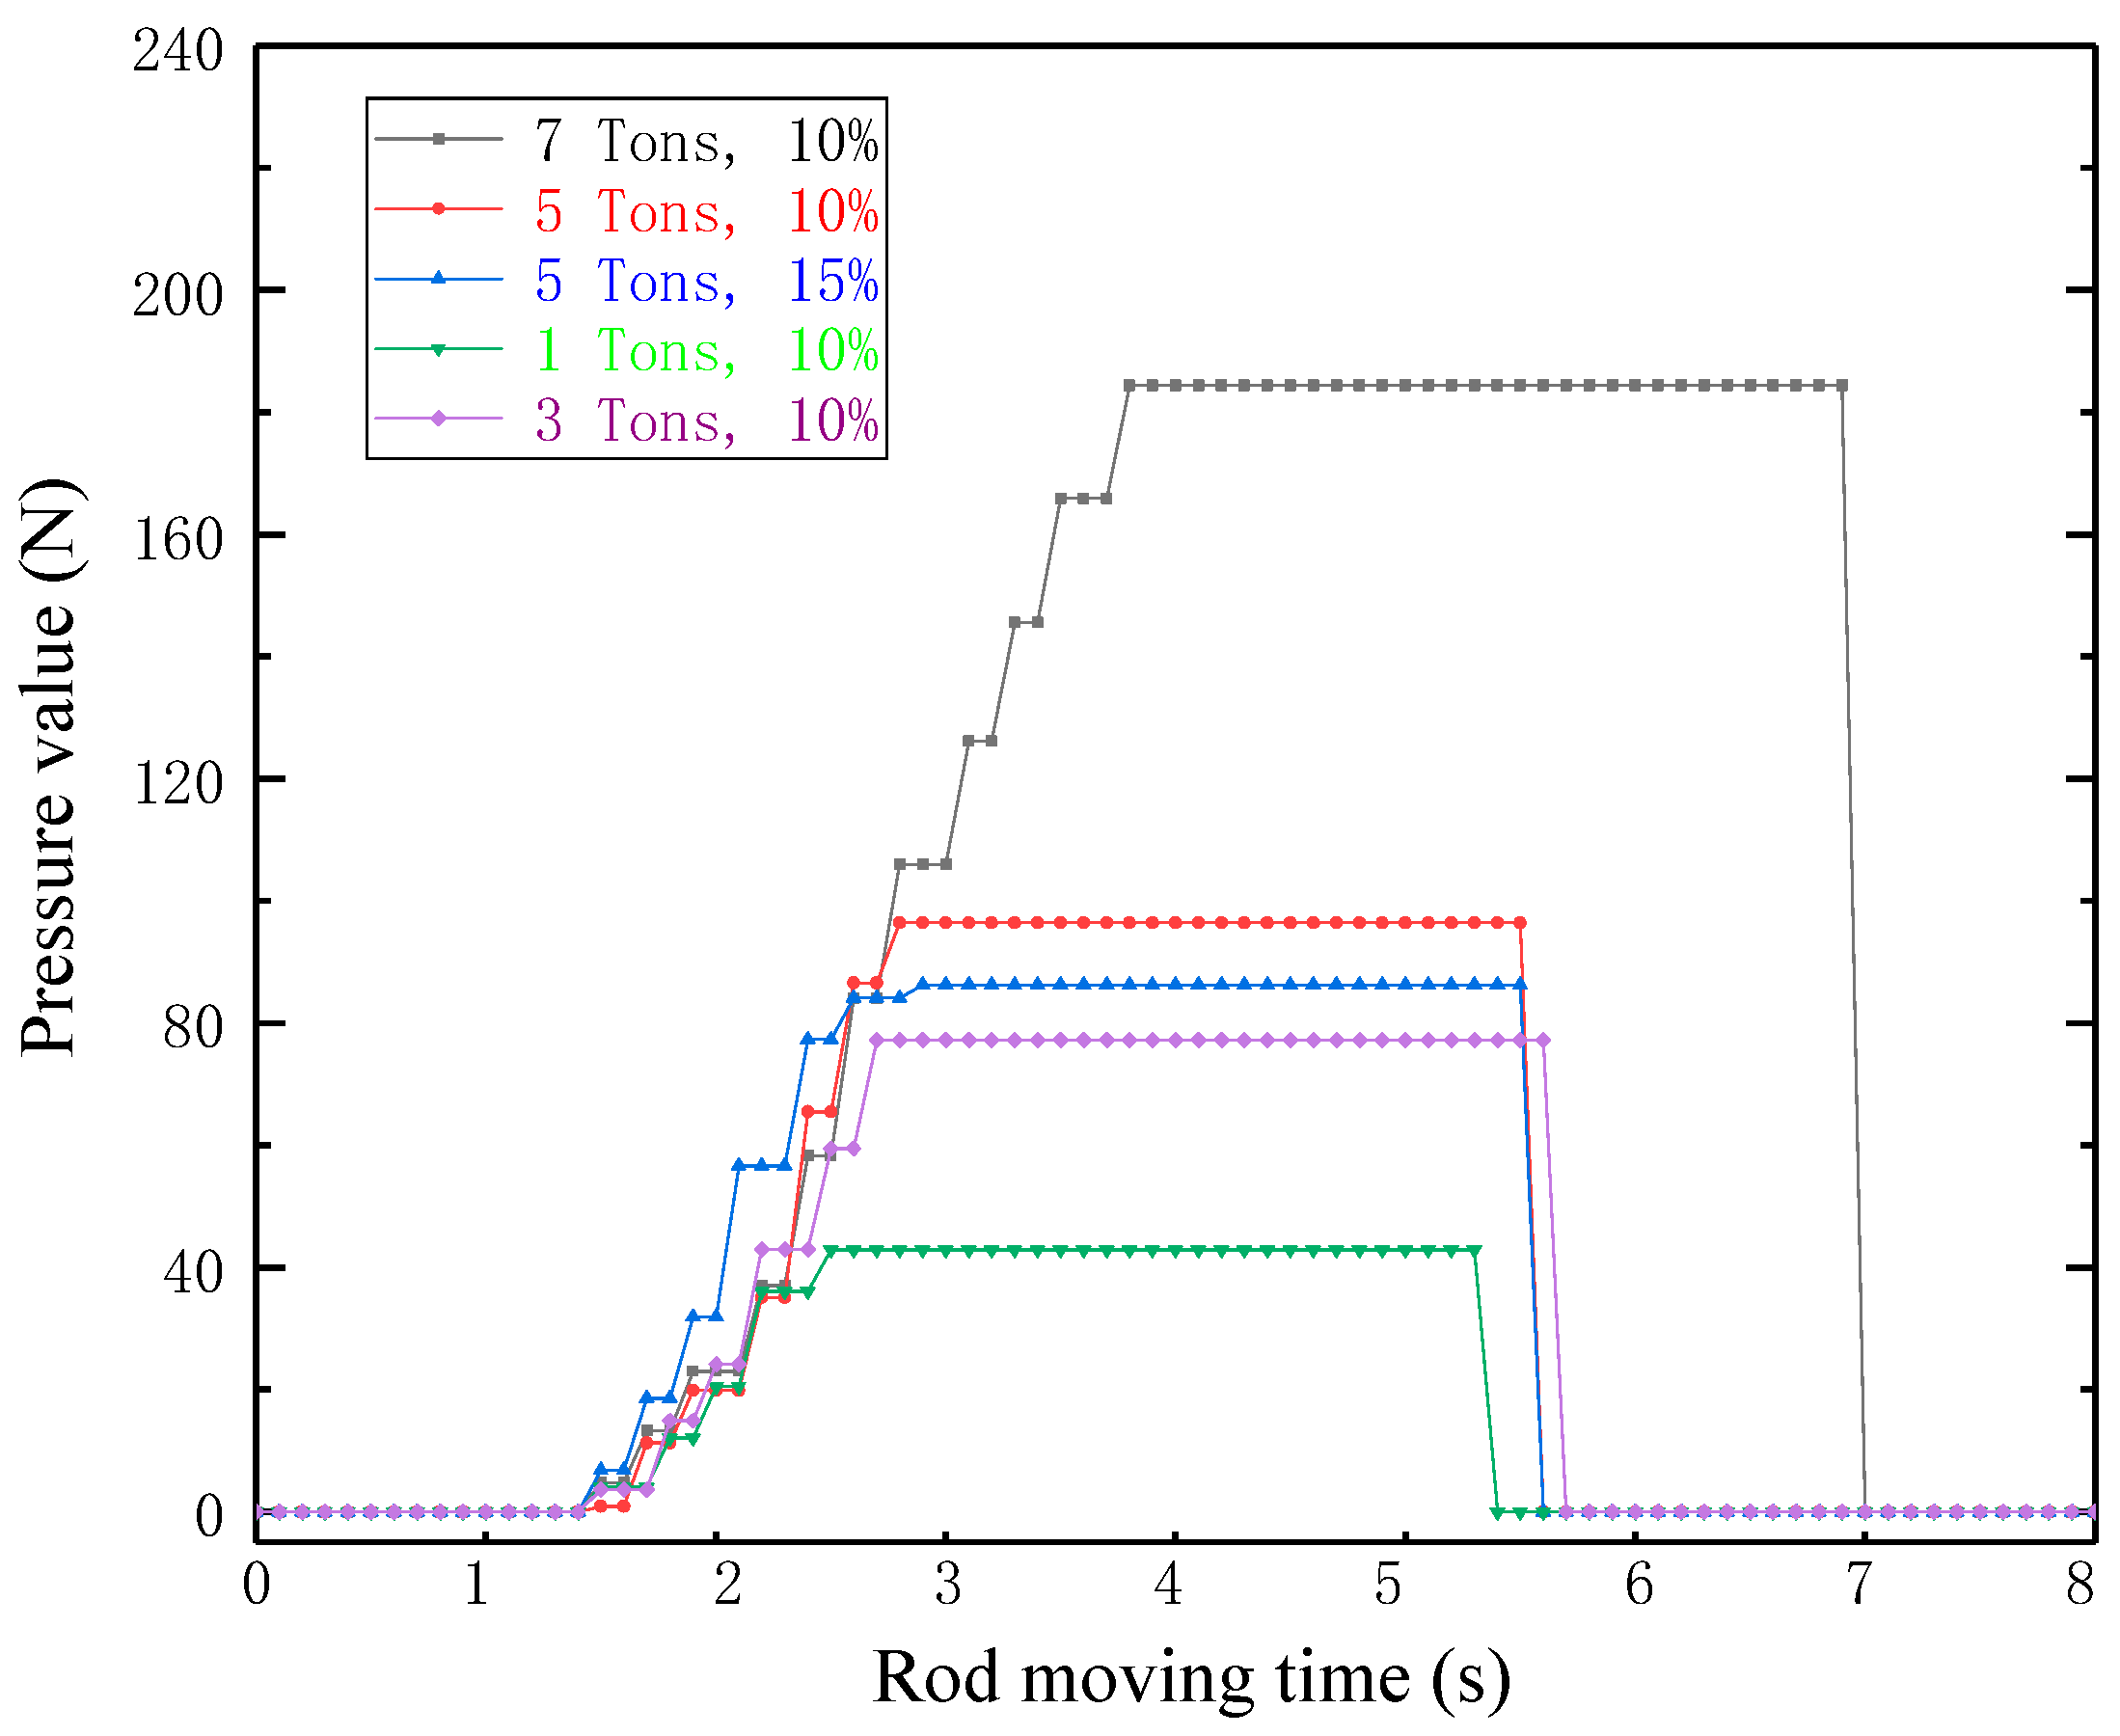
Several pressure crushing tests about briquette cyanobacteria samples were conducted, and the changes of pressure values are shown in Figure 9. The detected pressure value increased in a stepwise way and the maximum pressure value also increased when the compressive load increased from 1 to 7 tons. The maximum pressure value for different samples reached 40, 80, 98 and 185 N, which shows that compressive load is good for the original mechanical strength of briquette cyanobacteria, and the compressive load of 7 tons exhibits a multiplier effect compared with 5 tons. On the other hand, the effect of moisture content (10% and 15%) was also analyzed at the same compressive load (5 tons). The maximum pressure values for the moisture content of 10 and 15% were 98 and 88 N, respectively. The moisture content of 10% was better for the densification briquetting process of cyanobacteria. In combination with the conclusion in Figure 7, the moisture content of 10% was the best moisture content for the cyanobacteria densification process of a single briquetting unit.

3.2. Characteristic of Briquette Cyanobacteria in TGA Reactor

3.2.1. Drying Process of Briquette Cyanobacteria in TGA Reactor

In this section, how several briquette cyanobacteria samples of different moisture content and compressive load were dewatered in a TGA reactor is described, which is the first break, and the mechanical strength evolution of the residue samples, including forming rate and relax density, is also analyzed. Besides, the heating rate and heating time are varied as research objects in the TGA tests.
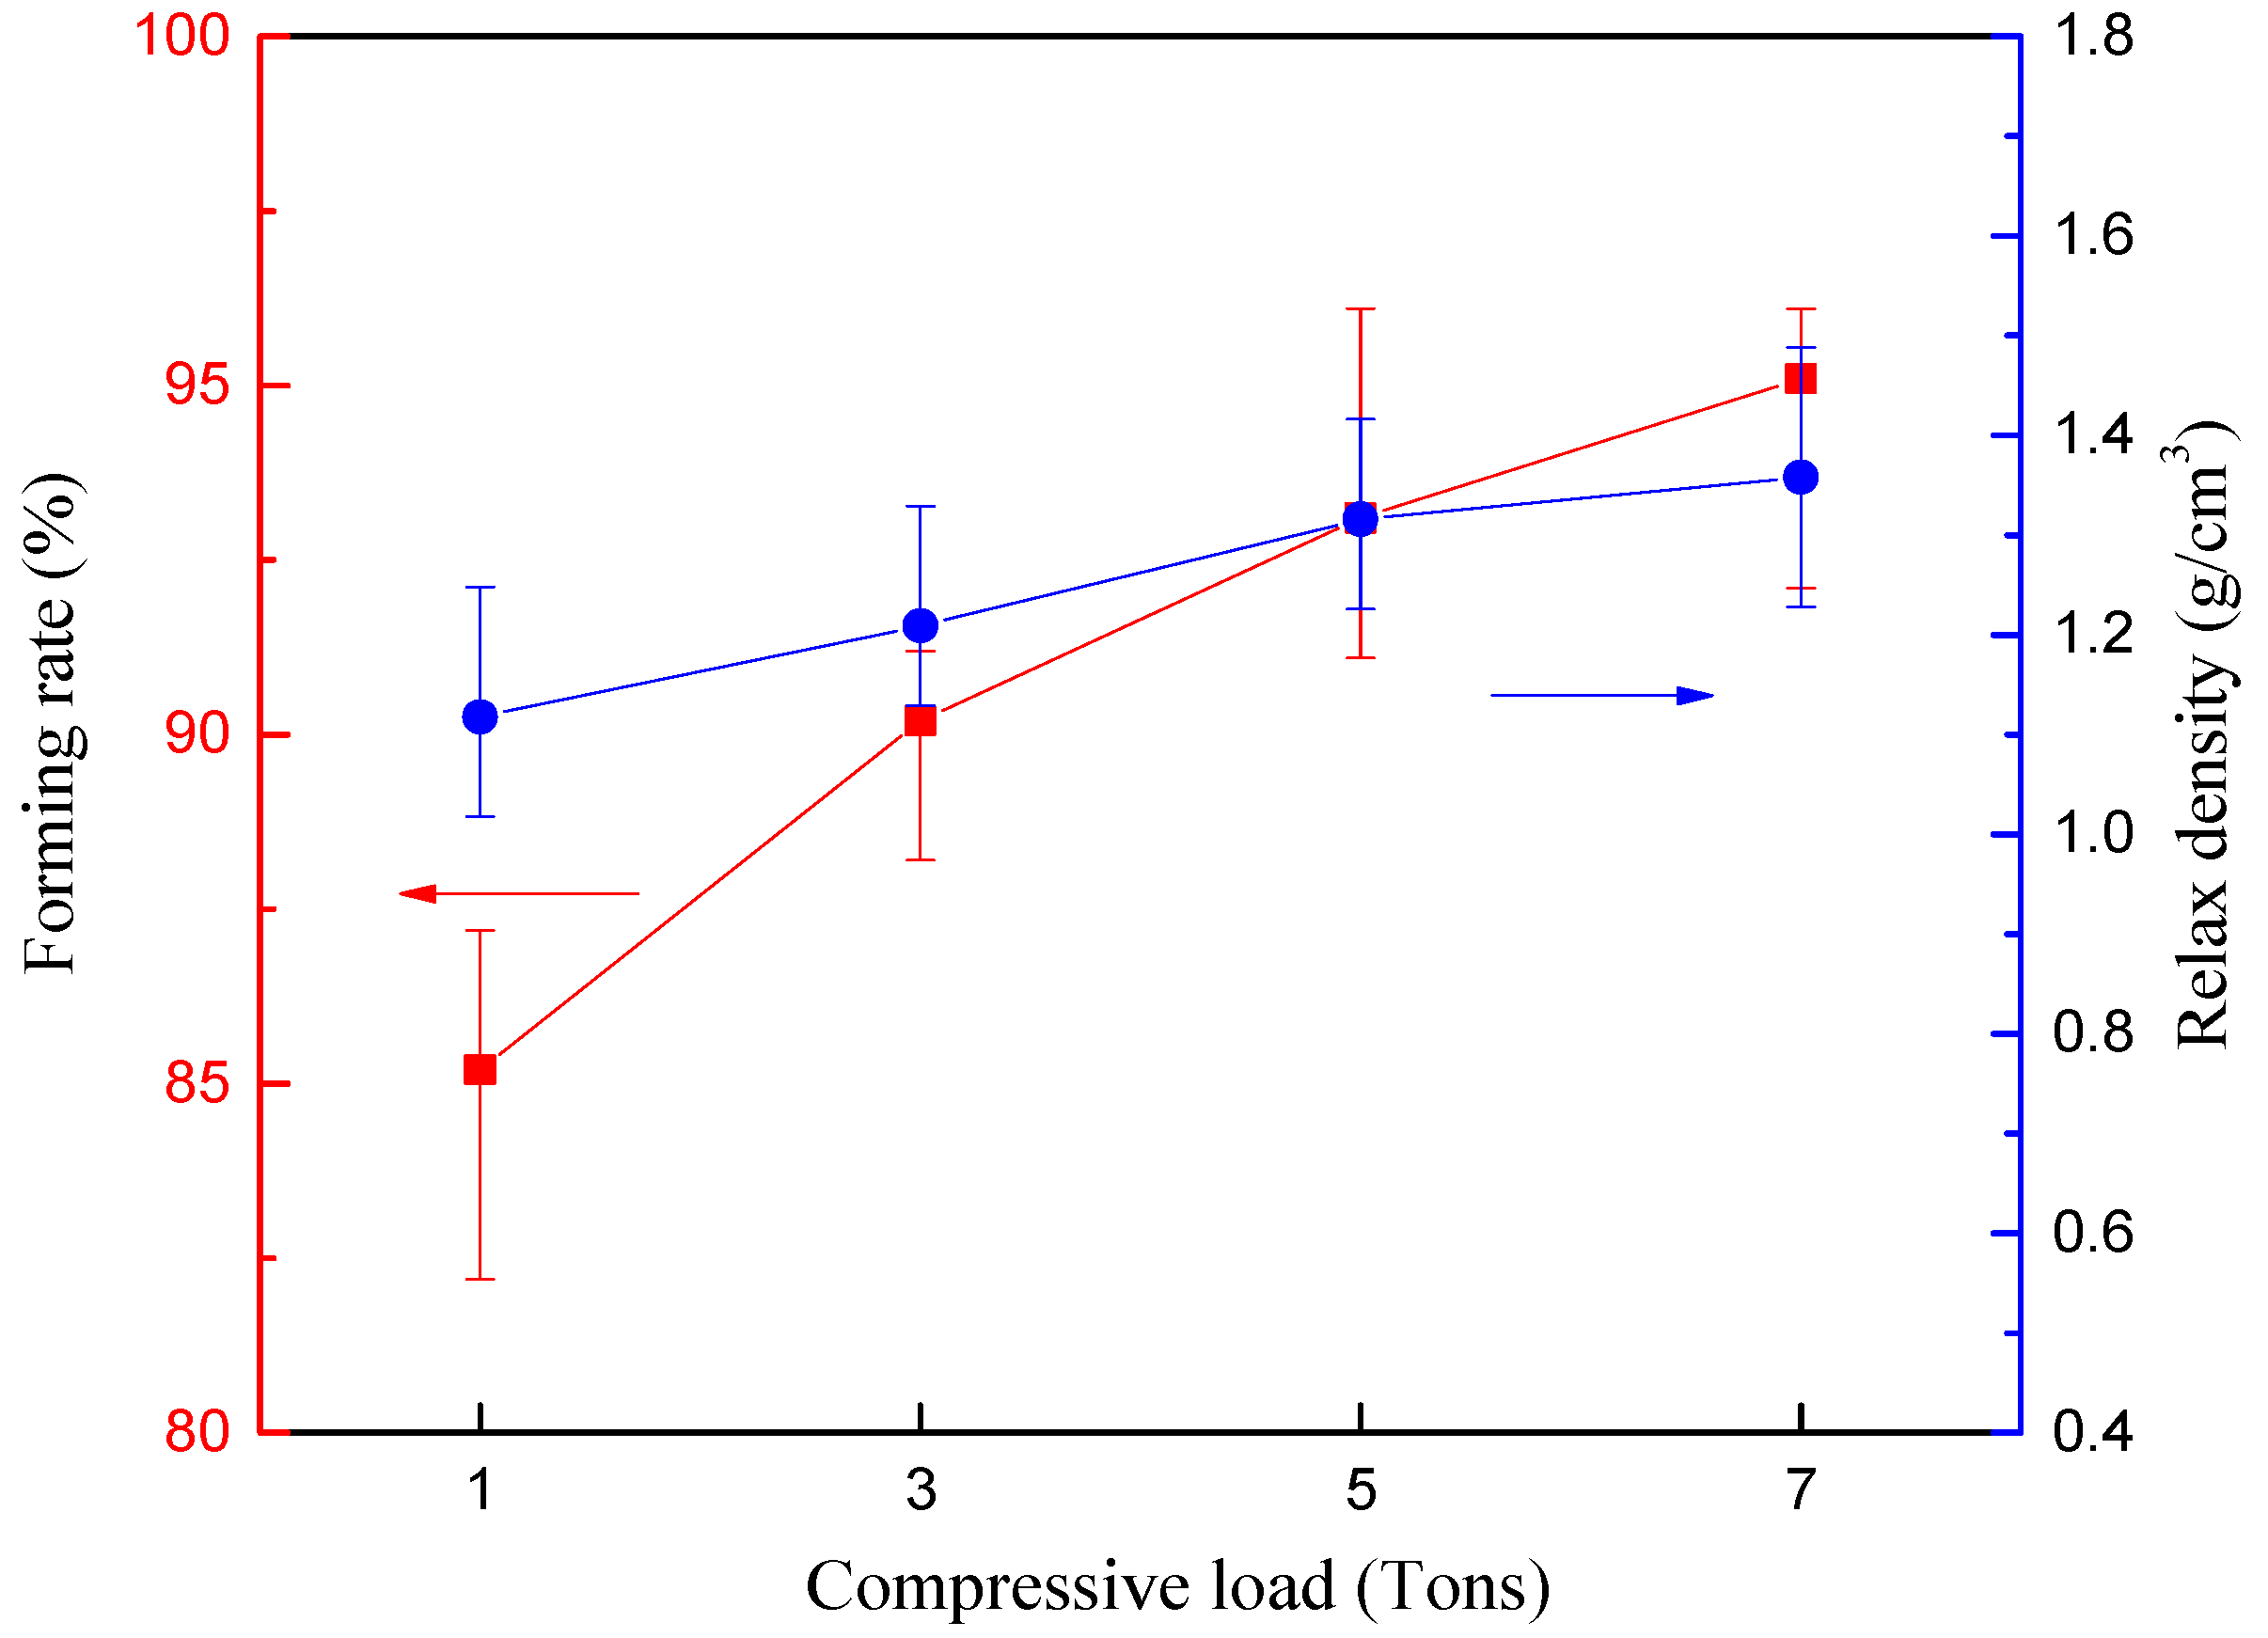
Figure 10 and Figure 11 show the variations in forming rate and relax density of residual samples through drying process of 1 h in a TGA reactor at 180 °C. In Figure 10, the values of the X axis are the moisture contents of raw briquette cyanobacteria (before the drying process). Additionally, the values of the X axis in Figure 11 are the compressive load of raw briquette cyanobacteria. It was found that the changing trends were similar with the results before the drying process (Figure 7 and Figure 8), while the decreases in forming rate and relax density from the maximum to minimum were relatively bigger. The mechanical strength after the drying process was destroyed to a certain extent for the briquette cyanobacteria. According to Figure 10 and Figure 11, the forming rate and relax density increases slowly from a moisture content of 5 to 10%, and then decreases with the moisture content. The forming rate and relax density keep increasing with the compressive load. Therefore, appropriate moisture content (10%) and greater compressive load are conducive to the mechanical strength of briquette cyanobacteria, even after the drying process in a TGA reactor.
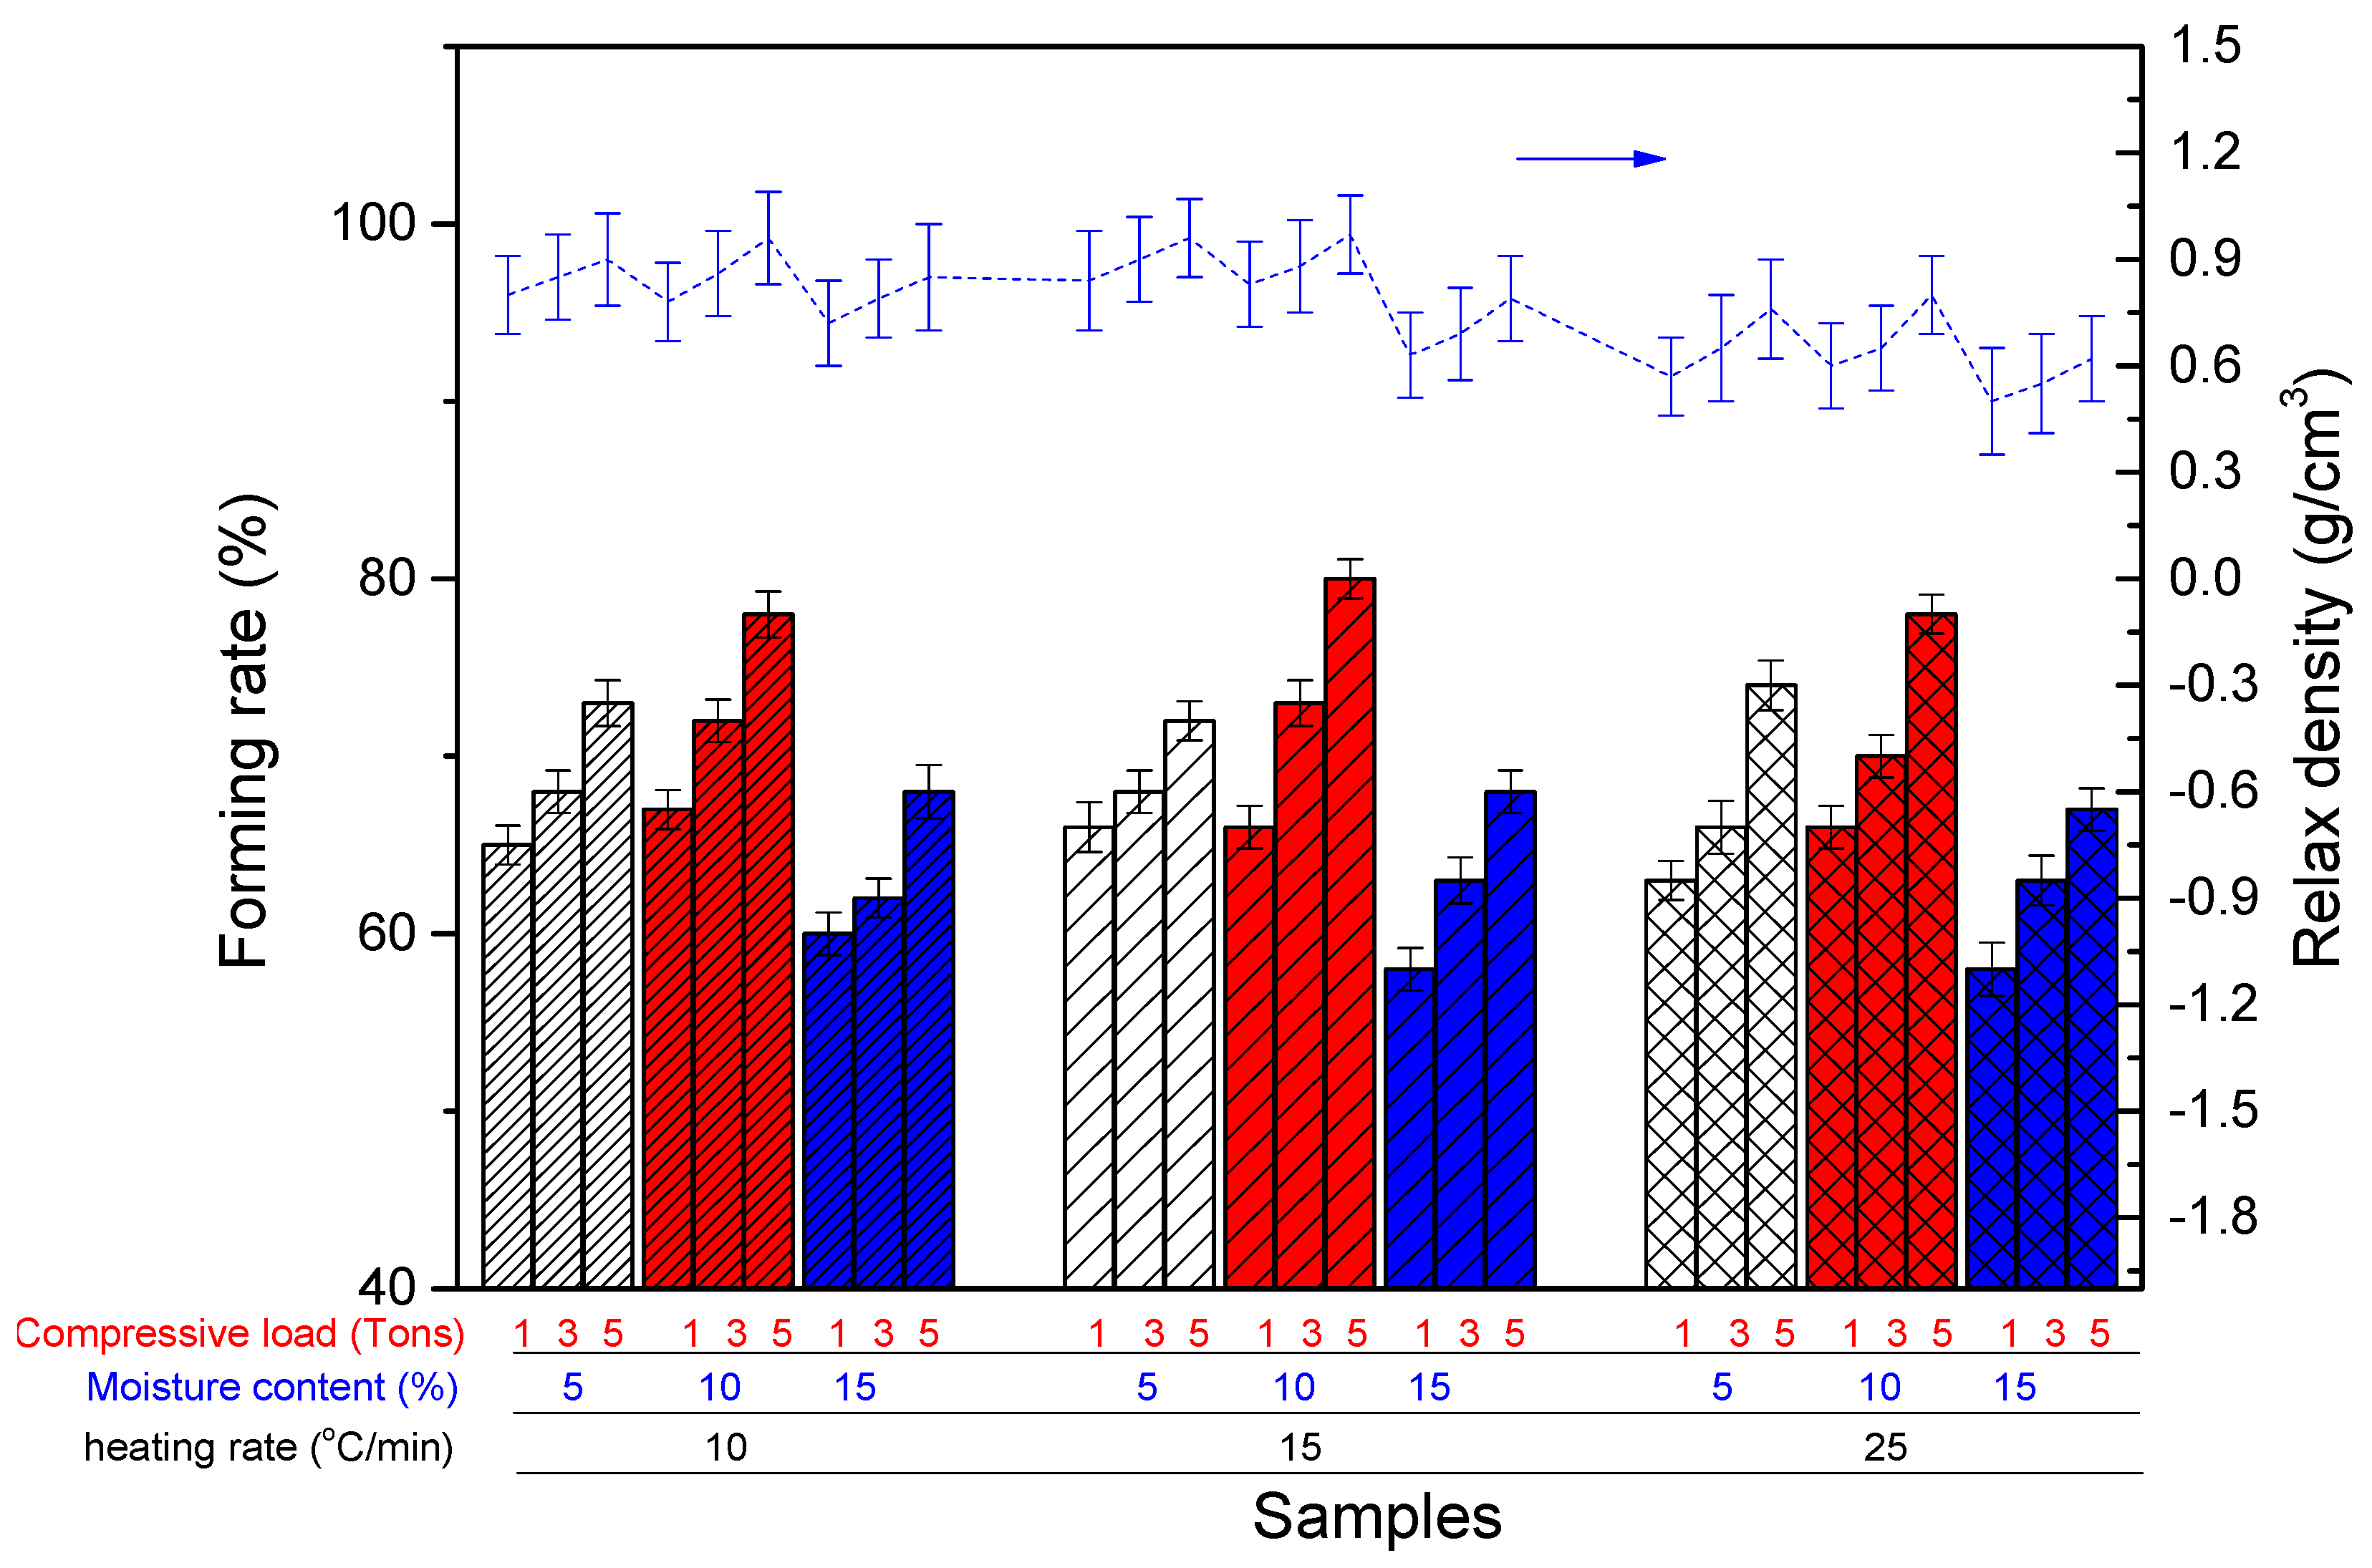
Figure 12 systematically shows the effects of compressive load, moisture content and heating rate on the forming rate and relax density. The compressive load, moisture content and heating rate are all varied in three values. Compressive load was changed in 1, 3 and 5 tons, and moisture content was varied in 5%, 10% and 15%, which are same with the previous tests. The heating rate of the TGA reactor was increased from 10, 15 to 25 °C/min. Based on the results, it is found that the compressive load is conducive to the mechanical strength of briquette dewatered cyanobacteria. The forming rate and relax density are increased with compressive load no matter what the moisture content and heating rate are. Additionally, the influence of moisture content is same with the previous conclusion, that is, the forming rate and relax density increases slightly from the moisture content of 5 to 10%, and then decreases when the moisture content continues to grow to 15%. The optimal moisture content for the mechanical strength of briquette cyanobacteria is 10%. Moderate moisture content is helpful for particle binding in the briquette process, even after the drying process.
About the heating rate, the changing trends of forming rate and relax density are quite different. When the moisture content is 5% or 10%, the forming rate and relax density keep almost unchanged. However, the mechanical strength of briquette dewatered cyanobacteria shows an evident decrease when the moisture content increases to 15%. Additionally, it is inferred that higher moisture content would result in worst mechanical strength of dewatered particles. When the moisture content is in a relatively low range (5–10%), water would be evaporated and transported out of the briquette cyanobacteria during the drying process, and the internal structure would not be very damaged. With the increase in moisture content (>15%), the binding effect between particles is weakened during the densification process, and then, the water evaporation of a longer duration would destroy the internal structure during the drying process. Additionally, a higher heating rate in the drying process would result in the drying process being more violent, and the damage for the internal structure is more severe, which is adverse to the mechanical strength of briquette dewatered cyanobacteria. However, it should be pointed out that the reaction rate under the higher heating rate would be increased.

3.2.2. Devolatilization Process of Briquette Cyanobacteria in TGA Reactor

In this section, several briquette cyanobacteria residual samples, experienced pyrolysis or the devolatilization process in the TGA reactor, are tested for their mechanical strength evolution. The process is the second break following the first break (drying process). The tests regarding the second break process of the briquette cyanobacteria were conducted under N2 atmosphere (1 L/min). In order to ensure the devolatilization process has finished, the process is continuously monitored by an online gas analyzer until the volatiles have almost disappeared. Then, the samples are cooled in N2 atmosphere and then taken out from TGA.
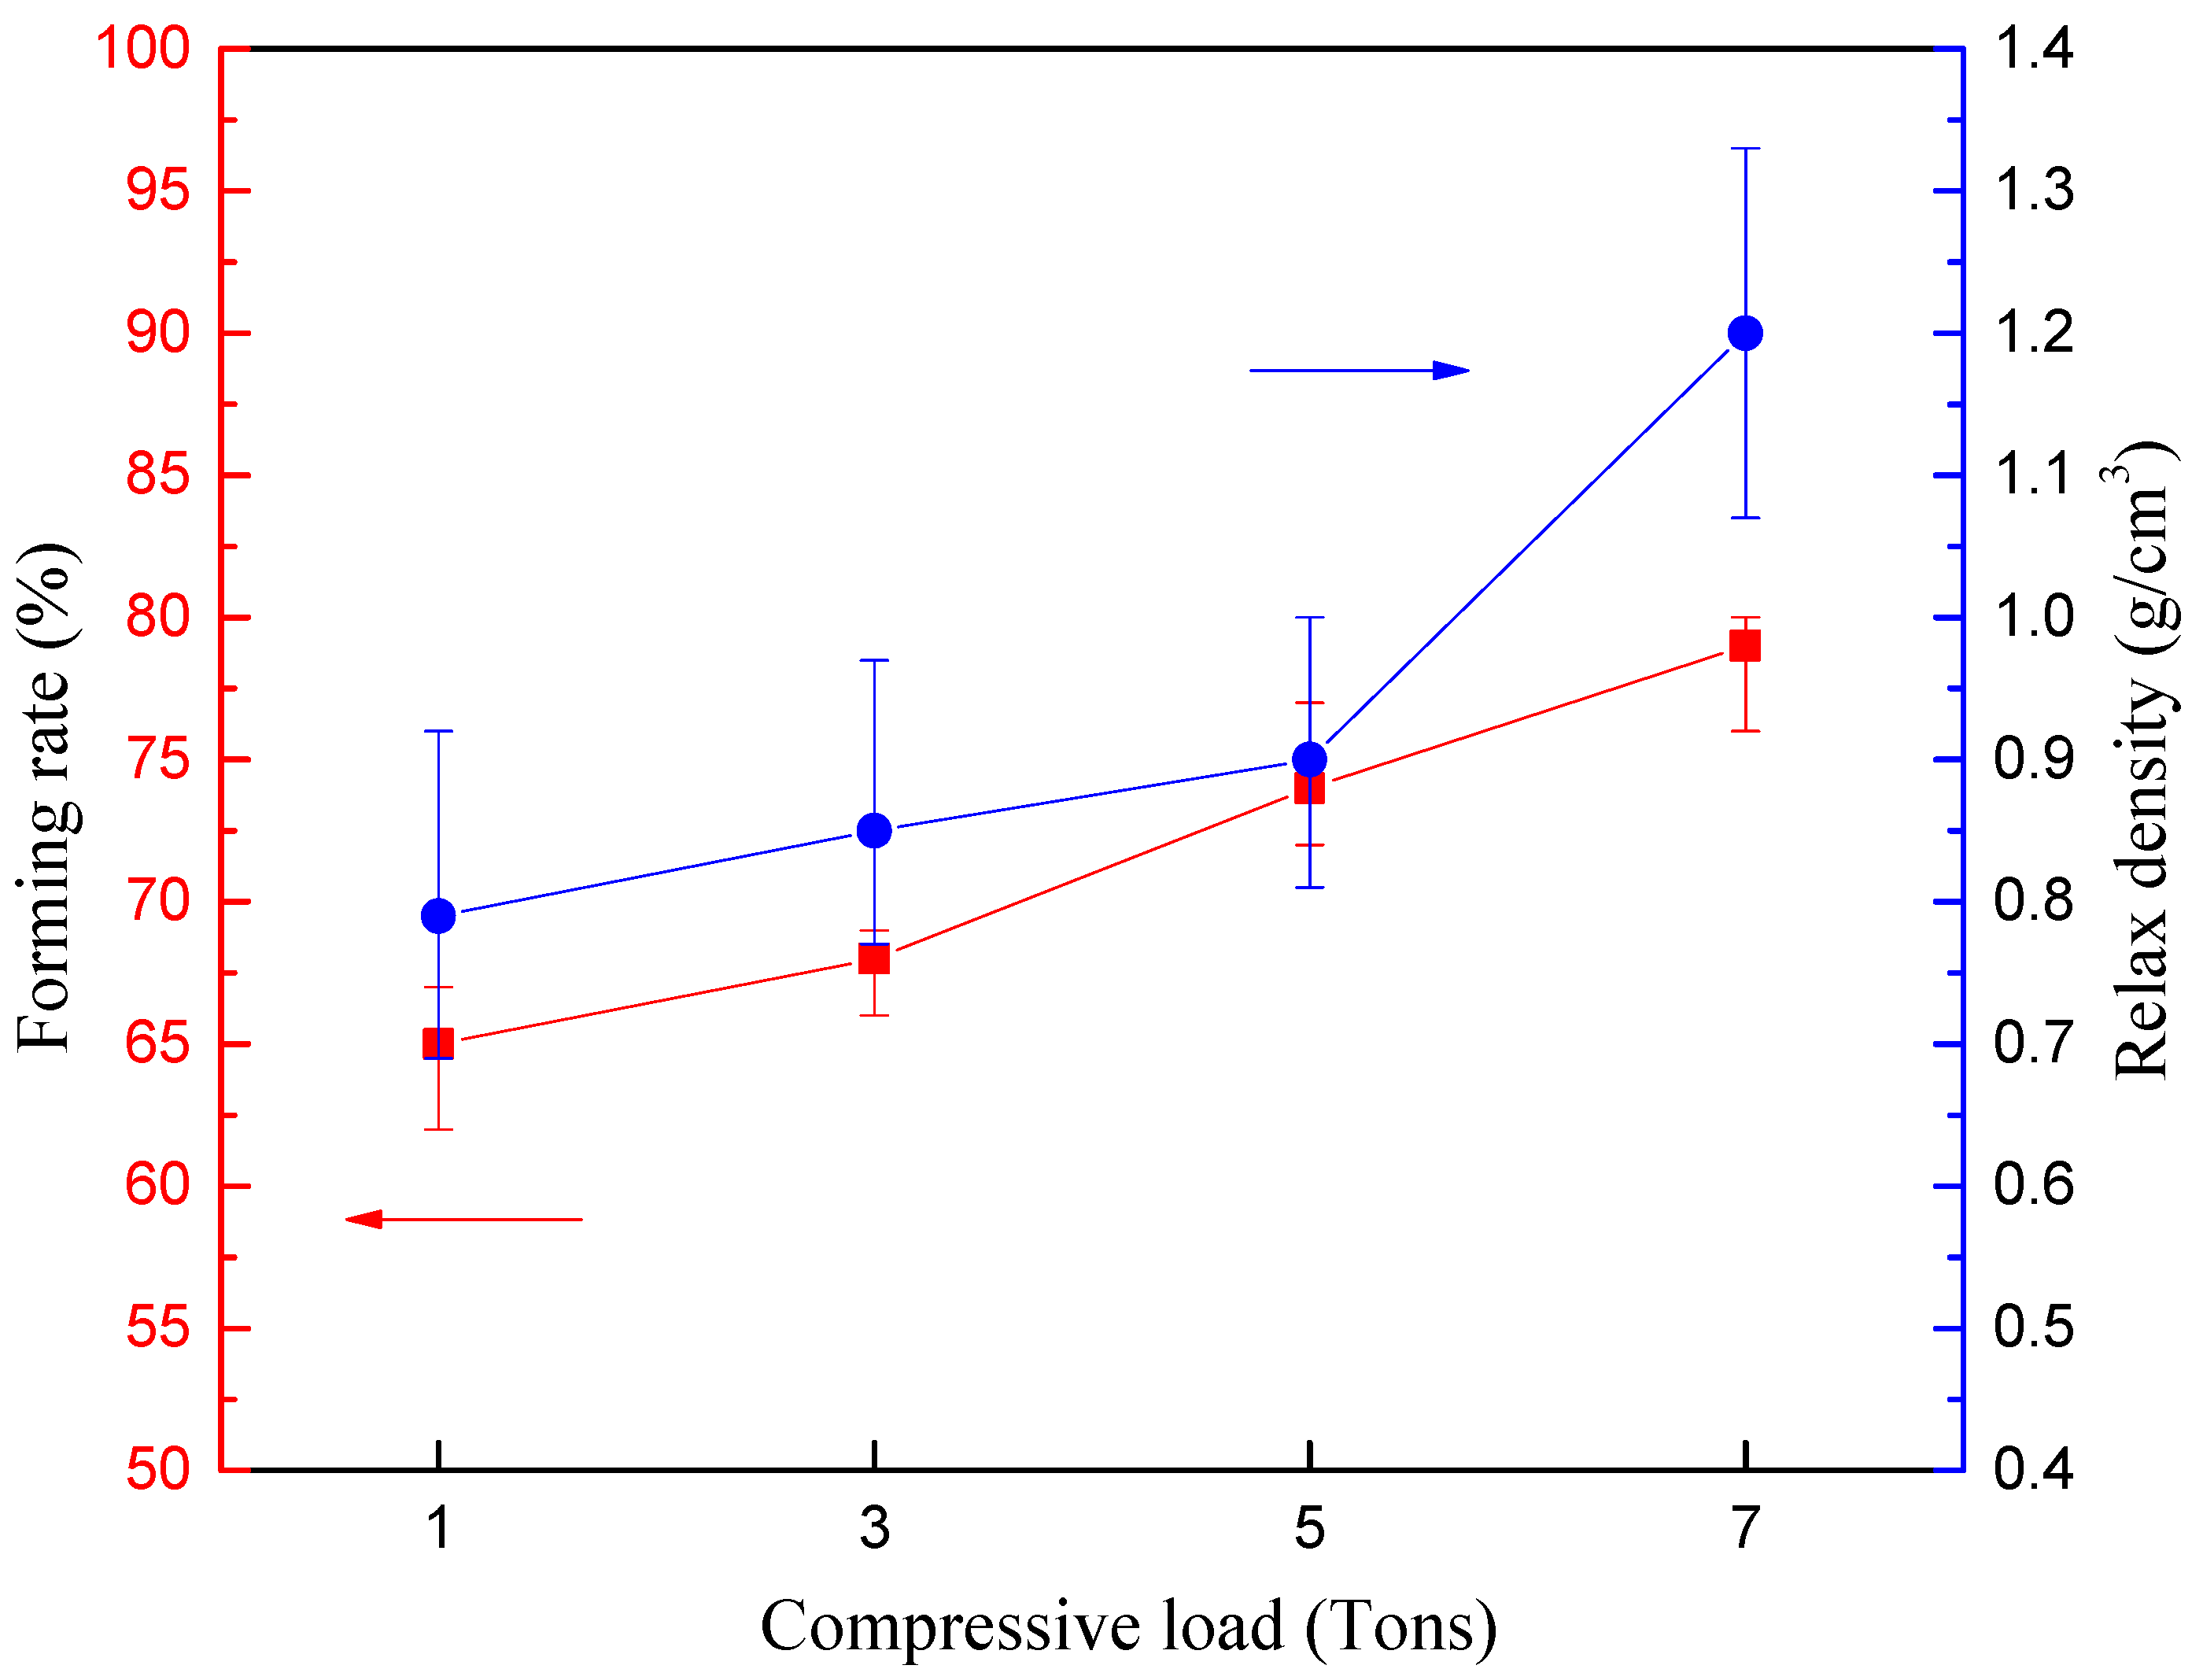
Figure 13 and Figure 14 show the variations in the forming rate and relax density in relation to moisture content and compressive load. According to Figure 13, the briquette cyanobacteria after the devolatilization process show the same characteristics with those after the drying process (Figure 10). Both forming rate and relax density reach the best values when the moisture content is 10%. Additionally, the results at moisture content of 5% are close to the optimal condition, while the difference is relatively evident with moisture content increasing further (15–20%). Based on Figure 14, the general trend is also similar with that after the drying process (Figure 11). However, the growth of relax density between the compressive load of 5 to 7 tons is relatively evident, which increases from 0.91 to 1.2 g/cm3. Above all, it is inferred that the destructive influence of pyrolysis or the devolatilization process to mechanical strength is great, while larger compressive load during the densification process could resist a mechanical strength break (second break).
Same with the drying tests (Figure 12), Figure 15 systematically shows the effects of compressive load, moisture content and heating rate on the forming rate and relax density after the devolatilization process. The mechanical strength evolution is also similar to the previous conclusion. The compressive load is conducive to the mechanical strength of devolatilization briquette cyanobacteria. The forming rate and relax density increased with compressive load no matter what the moisture content and heating rate were. The optimal moisture content for mechanical strength after the devolatilization process was also 10%. In addition, the effect of the heating rate was not that evident, even for the high moisture content (15%). During the devolatilization process, water and volatiles would escape from briquette cyanobacteria, and there is no difference in the total amount between the same briquette cyanobacteria samples. The releasing rate had no evident effect on the mechanical strength evolution during the devolatilization process.
However, the reactivity of briquette cyanobacteria is different from mechanical strength. Therefore, it is necessary to study further the influence of moisture content and compressive load to reactivity of briquette cyanobacteria.

3.3. Thermochemical Transformation of Briquette Cyanobacteria in Single Fluidized Bed

3.3.1. Thermochemical Transformation with Quartz Sand as Bed Materials

In order to study the thermochemical transformation of cyanobacteria, a series of tests about briquette samples were conducted in a single fluidized bed. At first, the tests with quartz sand were considered blank experiments to analyze the effect of the presence of hematite OC in the CLC of briquette cyanobacteria. The particle size of quartz sand and hematite are in the same size range of 0.3–0.45 mm. The briquette cyanobacteria sample was densified at the compressive load of 1 ton and the moisture content of 10%. The fluidizing agent of N2 was fixed at 1.5 L/min, and steam flow was at 0.8 g/min. The steam was preheated at 180 °C and then introduced to the bottom of the fluidized bed as a gasification agent. The mass of quartz sand added into the reactor was 30 g, and the mass of briquette cyanobacteria was 0.5 g.
Based on the previous conclusion, 10% is the optimal densification moisture content for the mechanical strength of briquette cyanobacteria, no matter its drying or devolatilization process. For the thermochemical transformation in a single fluidized bed, the gasification agent, i.e., steam, would possibly change the inner water content of the briquette cyanobacteria. Therefore, the mechanical strength change was not studied in this part, and the focus of the research was on the carbon conversion rate, gas yield and hematite oxygen carrier stability.
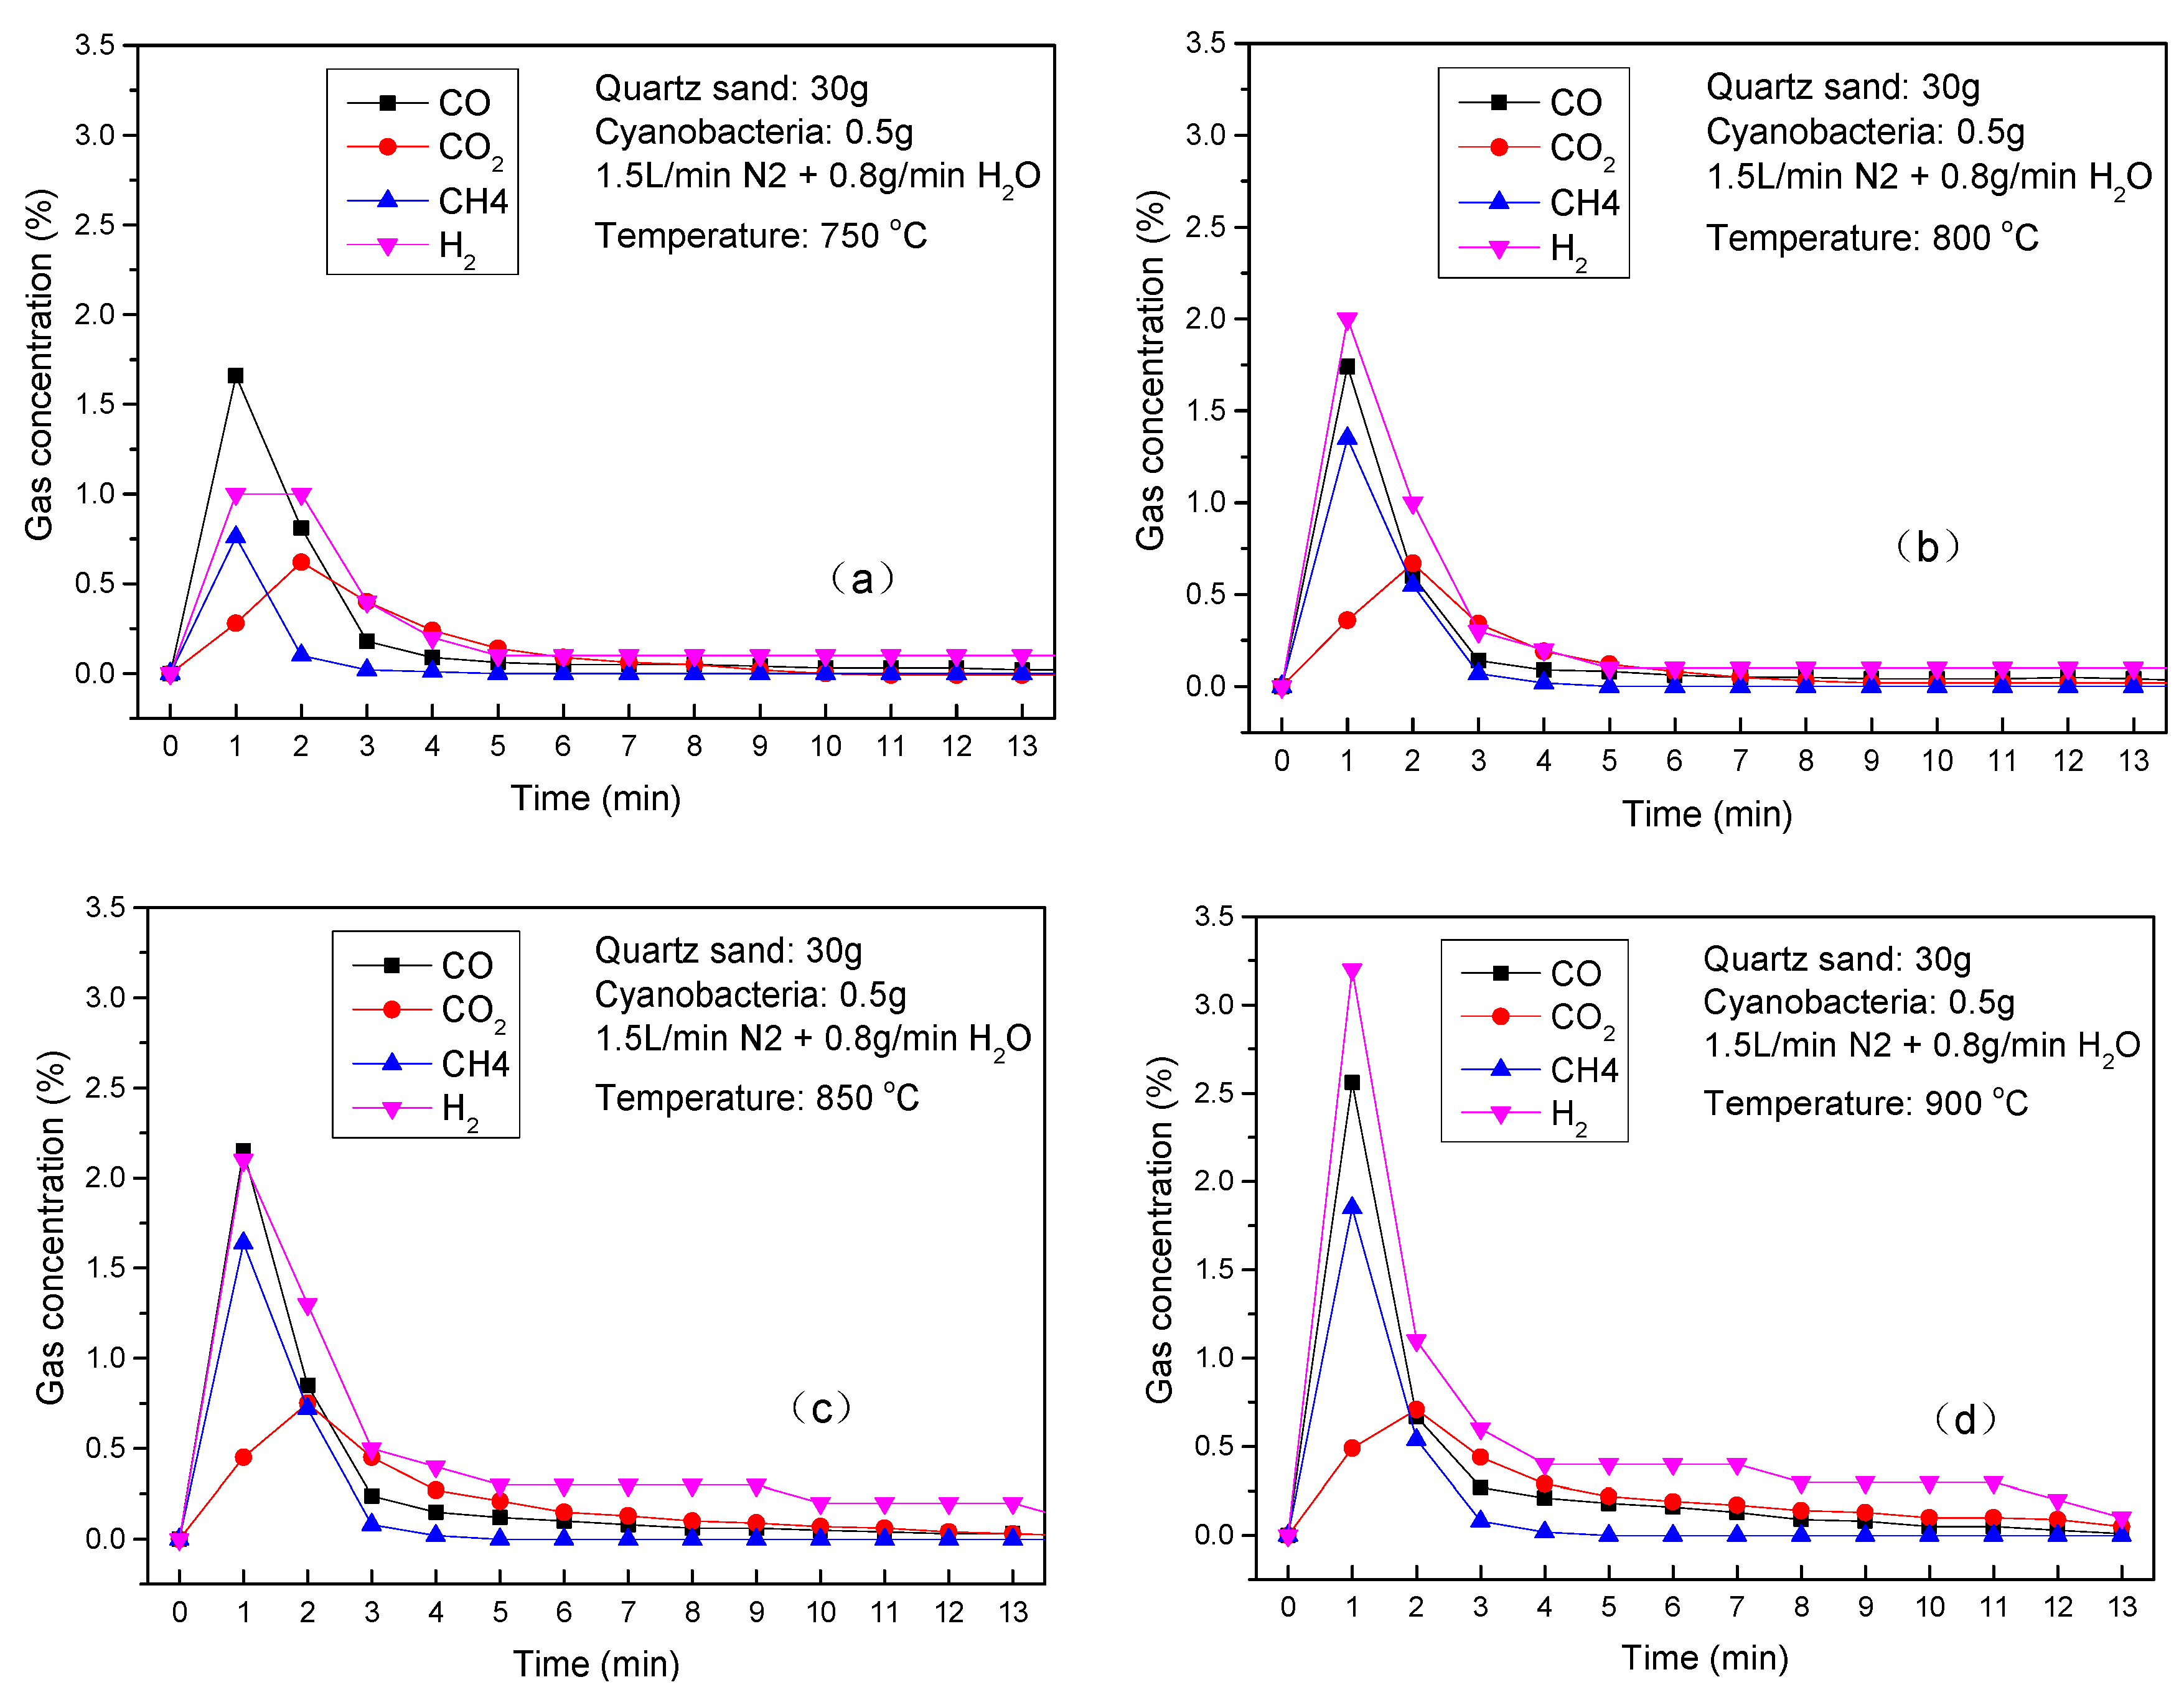
Figure 16a–d shows the variations in gas concentrations of CO, CO2, CH4 and H2 over time at different temperatures (750, 800, 850 and 900 °C). The briquette cyanobacteria in a single fluidized bed experience the whole transformation process, including drying, devolatilization and char burnout process. Meanwhile, char burnout is the longest duration process of biomass combustion following the drying and devolatilization process. In Figure 16, all of the gas concentrations show a similar changing trend, which increases during initial minutes and then decreases. The initial concentration increases in CO, CO2, CH4 and H2 were mainly caused by the release of volatiles and the gasification reaction by steam. The peaks of CO, CH4 and H2 appeared at the first minute, and the peak of CO2 was at the second minute. Additionally, the peak values increased with the temperature. It is inferred that the gasification process of briquette cyanobacteria in a single fluidized bed is enhanced by increasing temperature. The degree of gasification promotion needs to be further studied.
Figure 17 shows the variations in the carbon conversion of briquette cyanobacteria in a single fluidized bed at different temperatures. The carbon conversion could reflect the briquette cyanobacteria combustion efficiency or transformation content. All carbon conversions dramatically increase during the initial 2 min and then increase slightly. The carbon conversion curve almost displayed a linear relationship with time during the initial 2 min. The duration time of carbon conversion increasing is longer with the temperature increasing. It is found that the carbon conversions at 750 and 800 °C remain almost unchanged from the 6th minute, while the carbon conversions at 850 and 900 °C keep increasing. The final carbon conversions reach to about 35, 42, 55 and 65% at 750, 800, 850 and 900 °C, respectively.
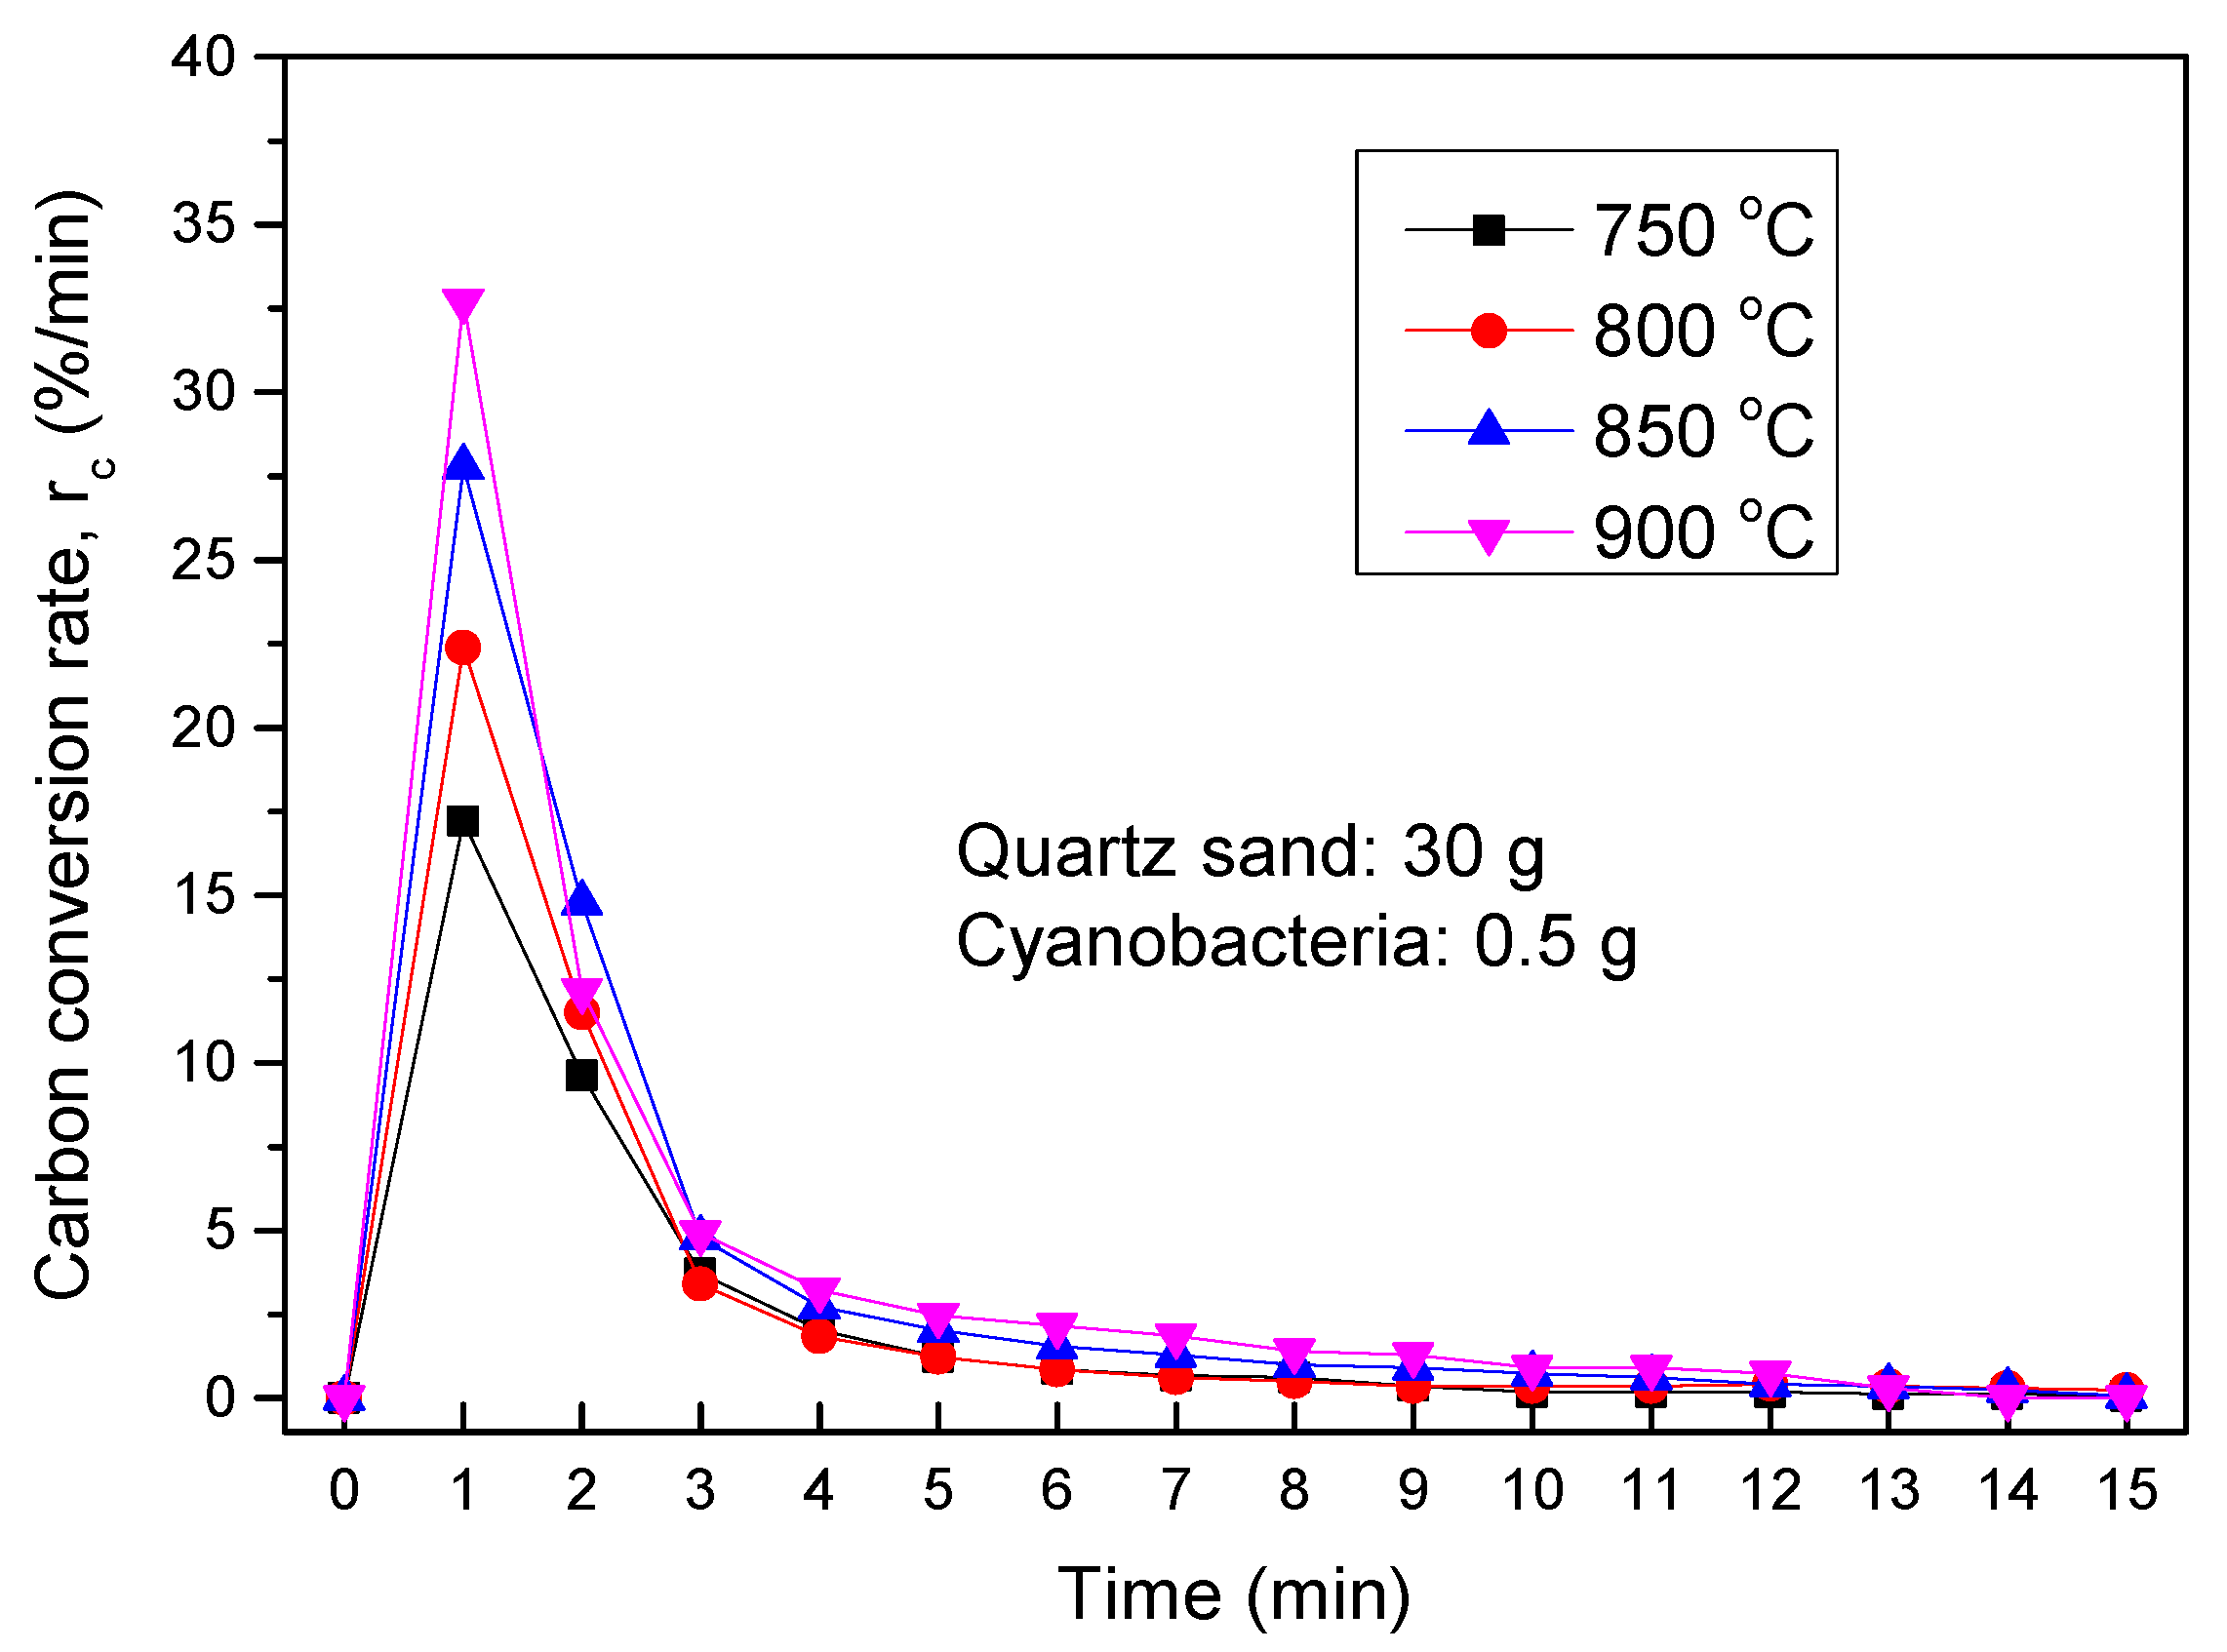
For a better understanding of carbon conversion of briquette cyanobacteria, the carbon conversion rates versus the time are shown in Figure 18. All of the curves of carbon conversion rate show a single peak changing trend. The maximum appears in the 1st minute and decreases immediately. The peak is ascribed to the release of volatile from briquette cyanobacteria. In addition, it is found that a higher temperature is in favor of carbon conversion rate. The maximums of the carbon conversion rate at 750, 800, 850 and 900 °C are 17.5, 22.2, 27.4 and 33.1%/min, respectively. It is inferred that a higher temperature not only enhances the devolatilization process, as shown in Figure 16, but also evidently promotes the char burnout process, causing a remarkable enhancement of the carbon conversion and rate.

3.3.2. Thermochemical Transformation with Hematite as Bed Materials

In order to investigate the effect of hematite on thermochemical transformation of briquette cyanobacteria in CLC process, the tests with hematite were conducted in a single fluidized bed. The test condition was same as the previous quartz sand tests. The selected briquette cyanobacteria samples were the samples densified at the compressive load of 1 ton and the moisture content of 10%. The fluidizing agent was also the mixture of 1.5 L/min N2 and 0.8 g/min steam. However, quartz sand of 30 g was replaced by hematite of the same mass (30 g). The mass of briquette cyanobacteria was still 0.5 g.
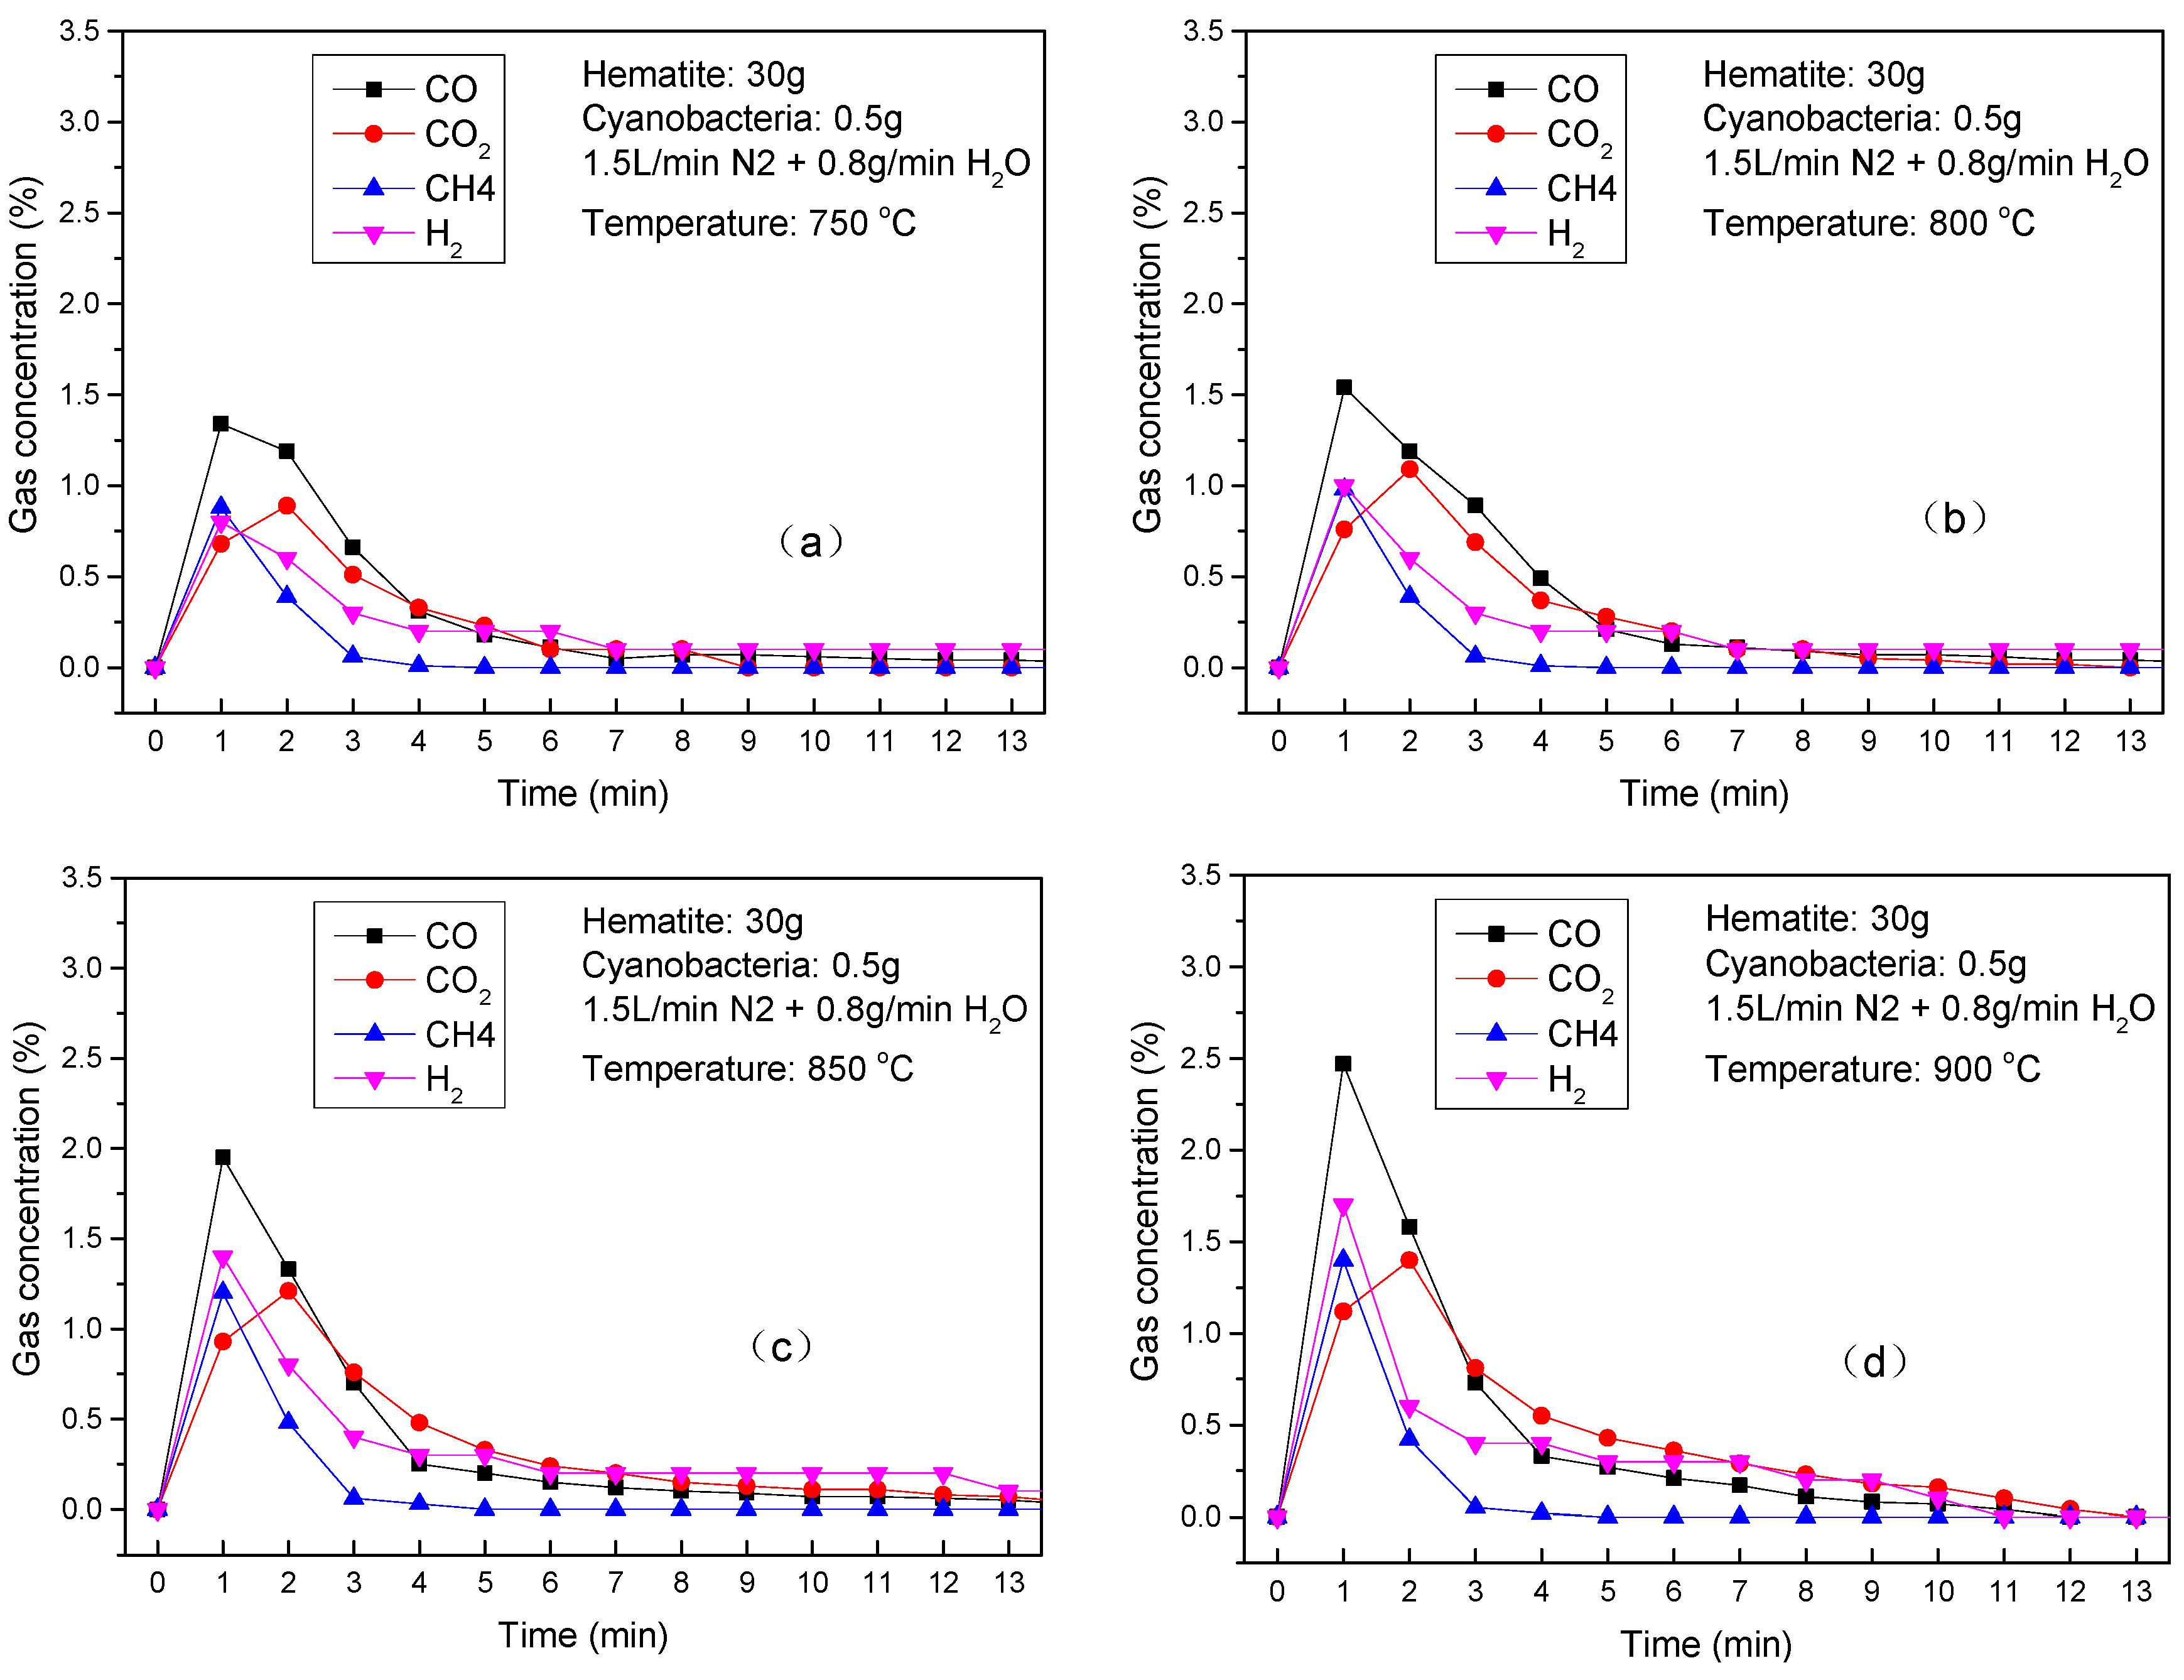
Figure 19a–d shows the concentrations of product gases as a function of time with hematite as the oxygen carrier. Similar to the results from the quartz sand test, the concentrations of CO, CO2, CH4 and H2 increased during the initial minute and then decreased. The initial increases were mainly caused by the release of volatiles and the gasification reaction by the steam. Meanwhile, the effect of the temperature on product gas concentrations was also the same. Based on the results in Figure 19a–d, the temperature is crucial for product gases from briquette cyanobacteria. By comparing the peaks, it is found that all of gas concentrations show an increasing trend with the temperature, which is ascribed to the enhanced devolatilization process by increasing temperature. However, the following concentration change in CO, H2 and CH4 shows a fast decrease with the temperature, while the decrease in CO2 concentration is relatively slowly. The product gas concentrations were the result of a series of complex and competing reactions, gas/solid mixing and hydrodynamics in the reactor. Due to the presence of hematite, a series of combustion reactions proceeded by means of a reaction (Equation (9)–(14)).
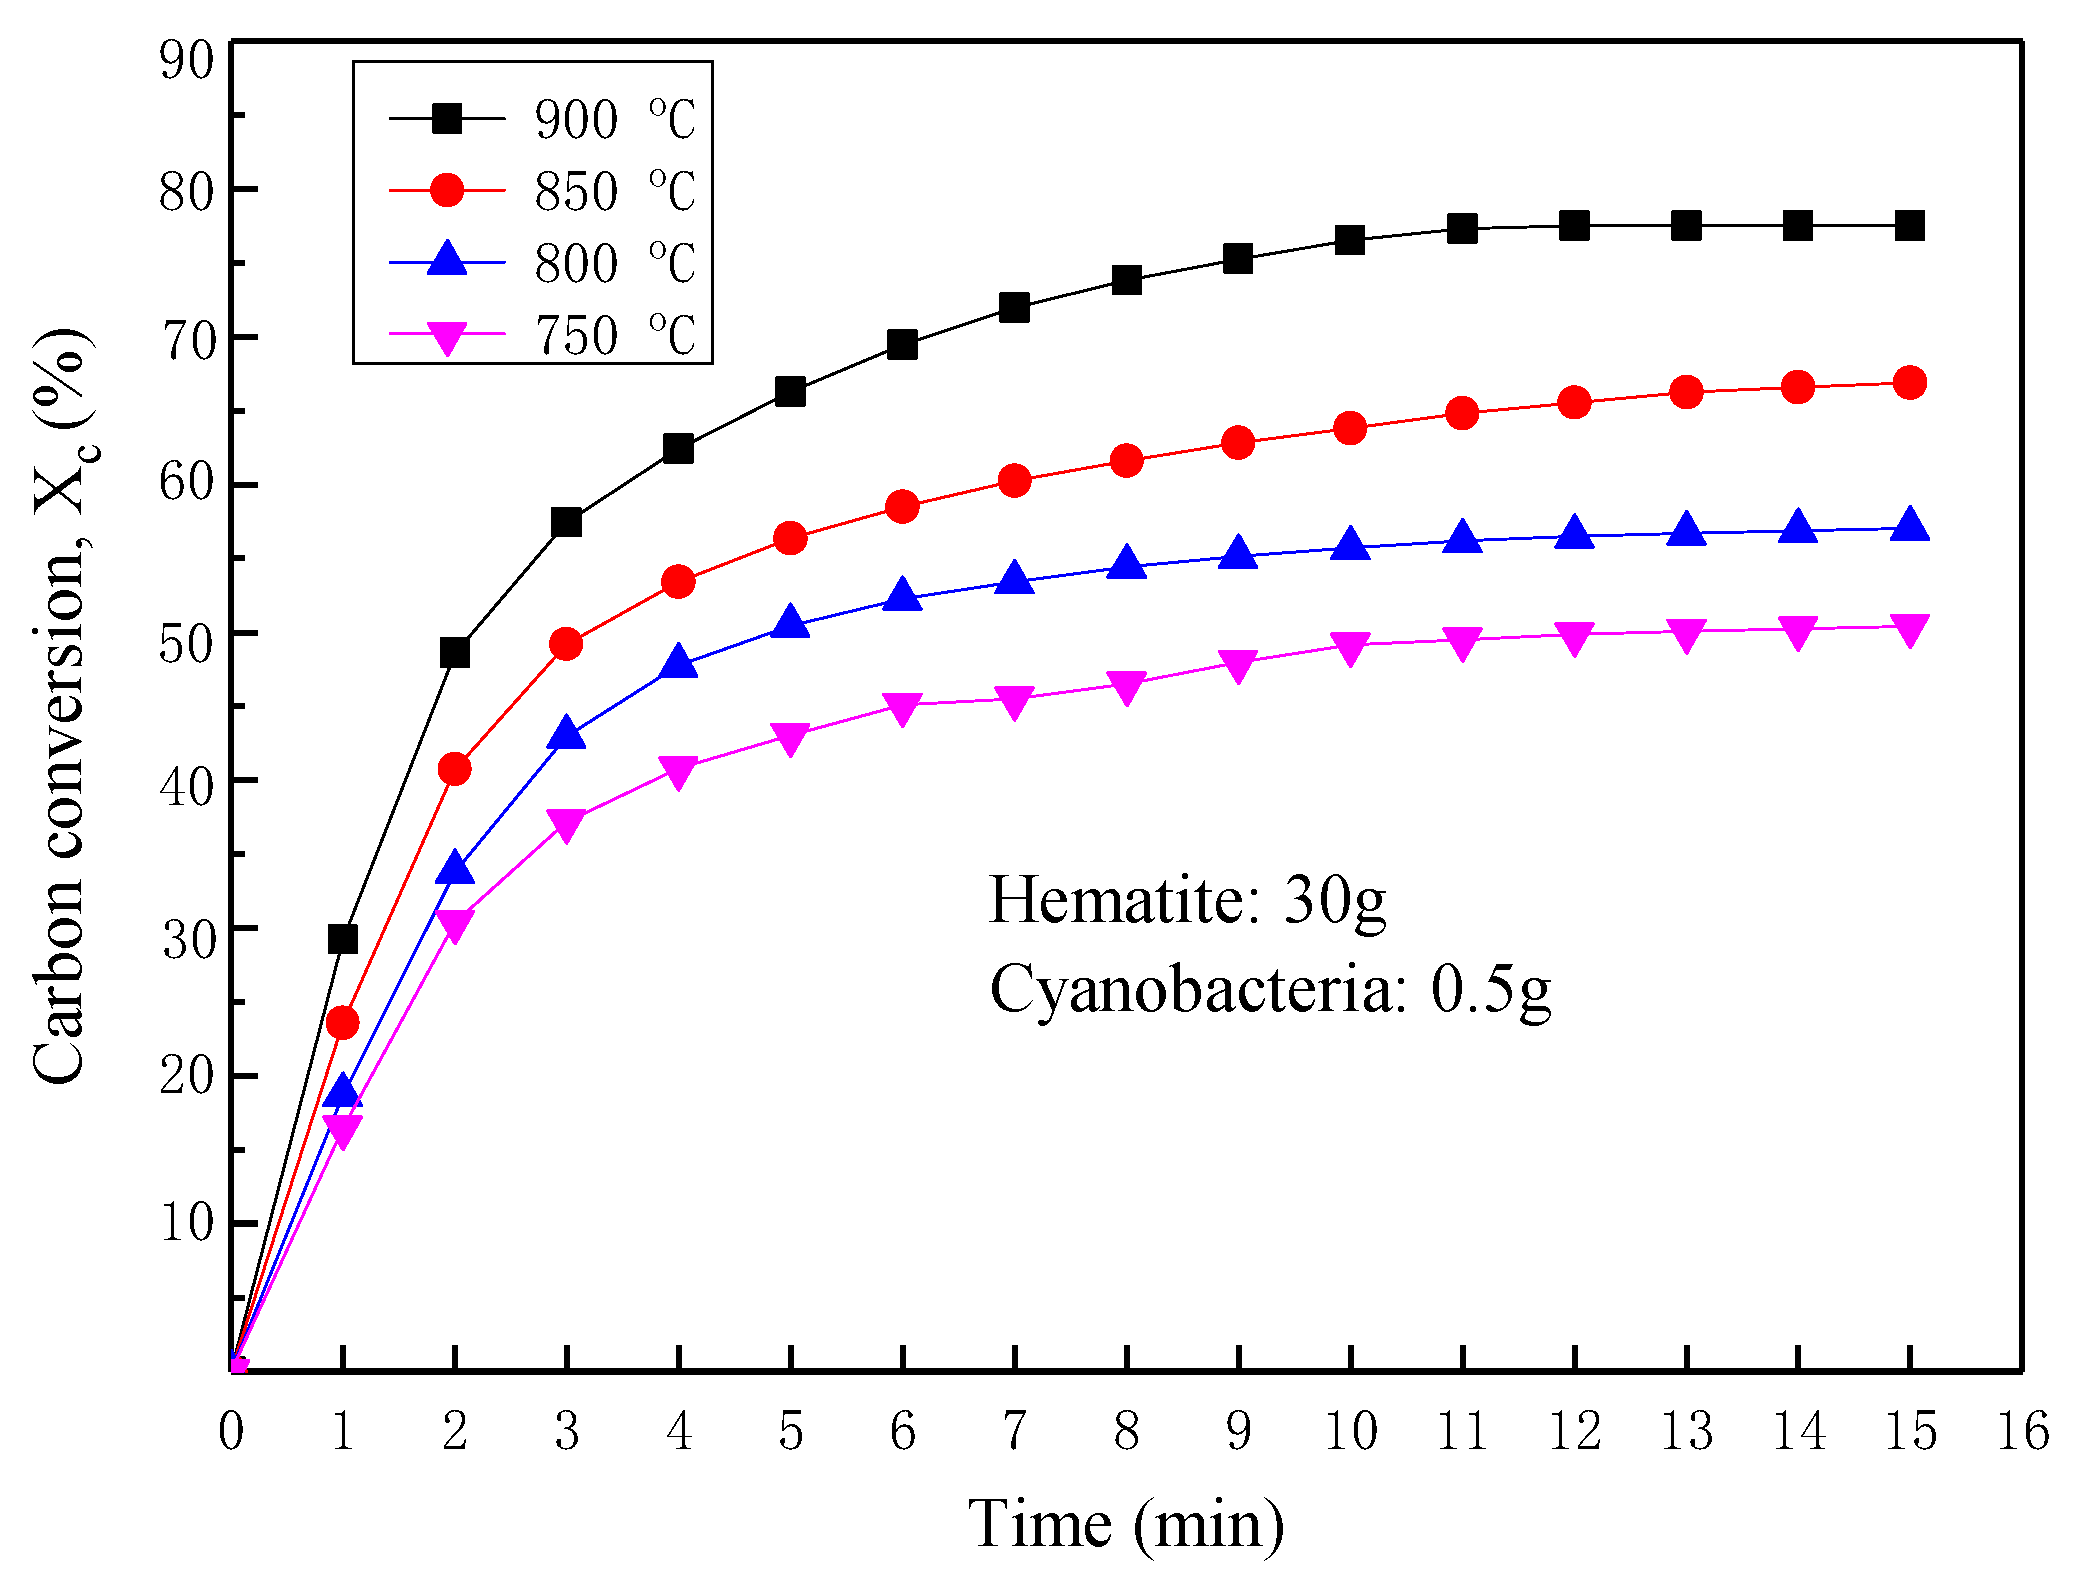
A series of cyanobacteria gasification reactions are an intensive endothermic process, and the reduction reactions (Equation (9)–(14)) are also endothermic reactions. Additionally, temperature would favor the products in the endothermic reactions. On the one hand, the products (CO and H2) from cyanobacteria gasification reactions would be increased due to the higher temperature. Then, the higher yields of CO and H2 and higher temperature would together promote the reduction reaction (Equation (9)–(14)), increasing the CO2 yield and the reactivity of hematite with briquette cyanobacteria-dried gas products. On the contrary, the consumption of CO and H2 by hematite would accelerate the cyanobacteria gasification process, improving the total carbon conversion efficiency and rate, as shown in Figure 20 and Figure 21. Additionally, compared with the results in Figure 17, the carbon conversion efficiency and rate due to the presence of hematite in CLC are evidently increased.
CO + 3 Fe2O3  2 Fe3O4 + CO2
CO + Fe2O3  2 FeO + CO2
H2 + 3 Fe2O3  2 Fe3O4 + H2O
H2 + Fe2O3  2 FeO + H2O
CH4 + 3 Fe2O3  2 Fe3O4 + CO + 2 H2
CH4 + 4 Fe2O3  8 FeO + CO2 + 2 H2O
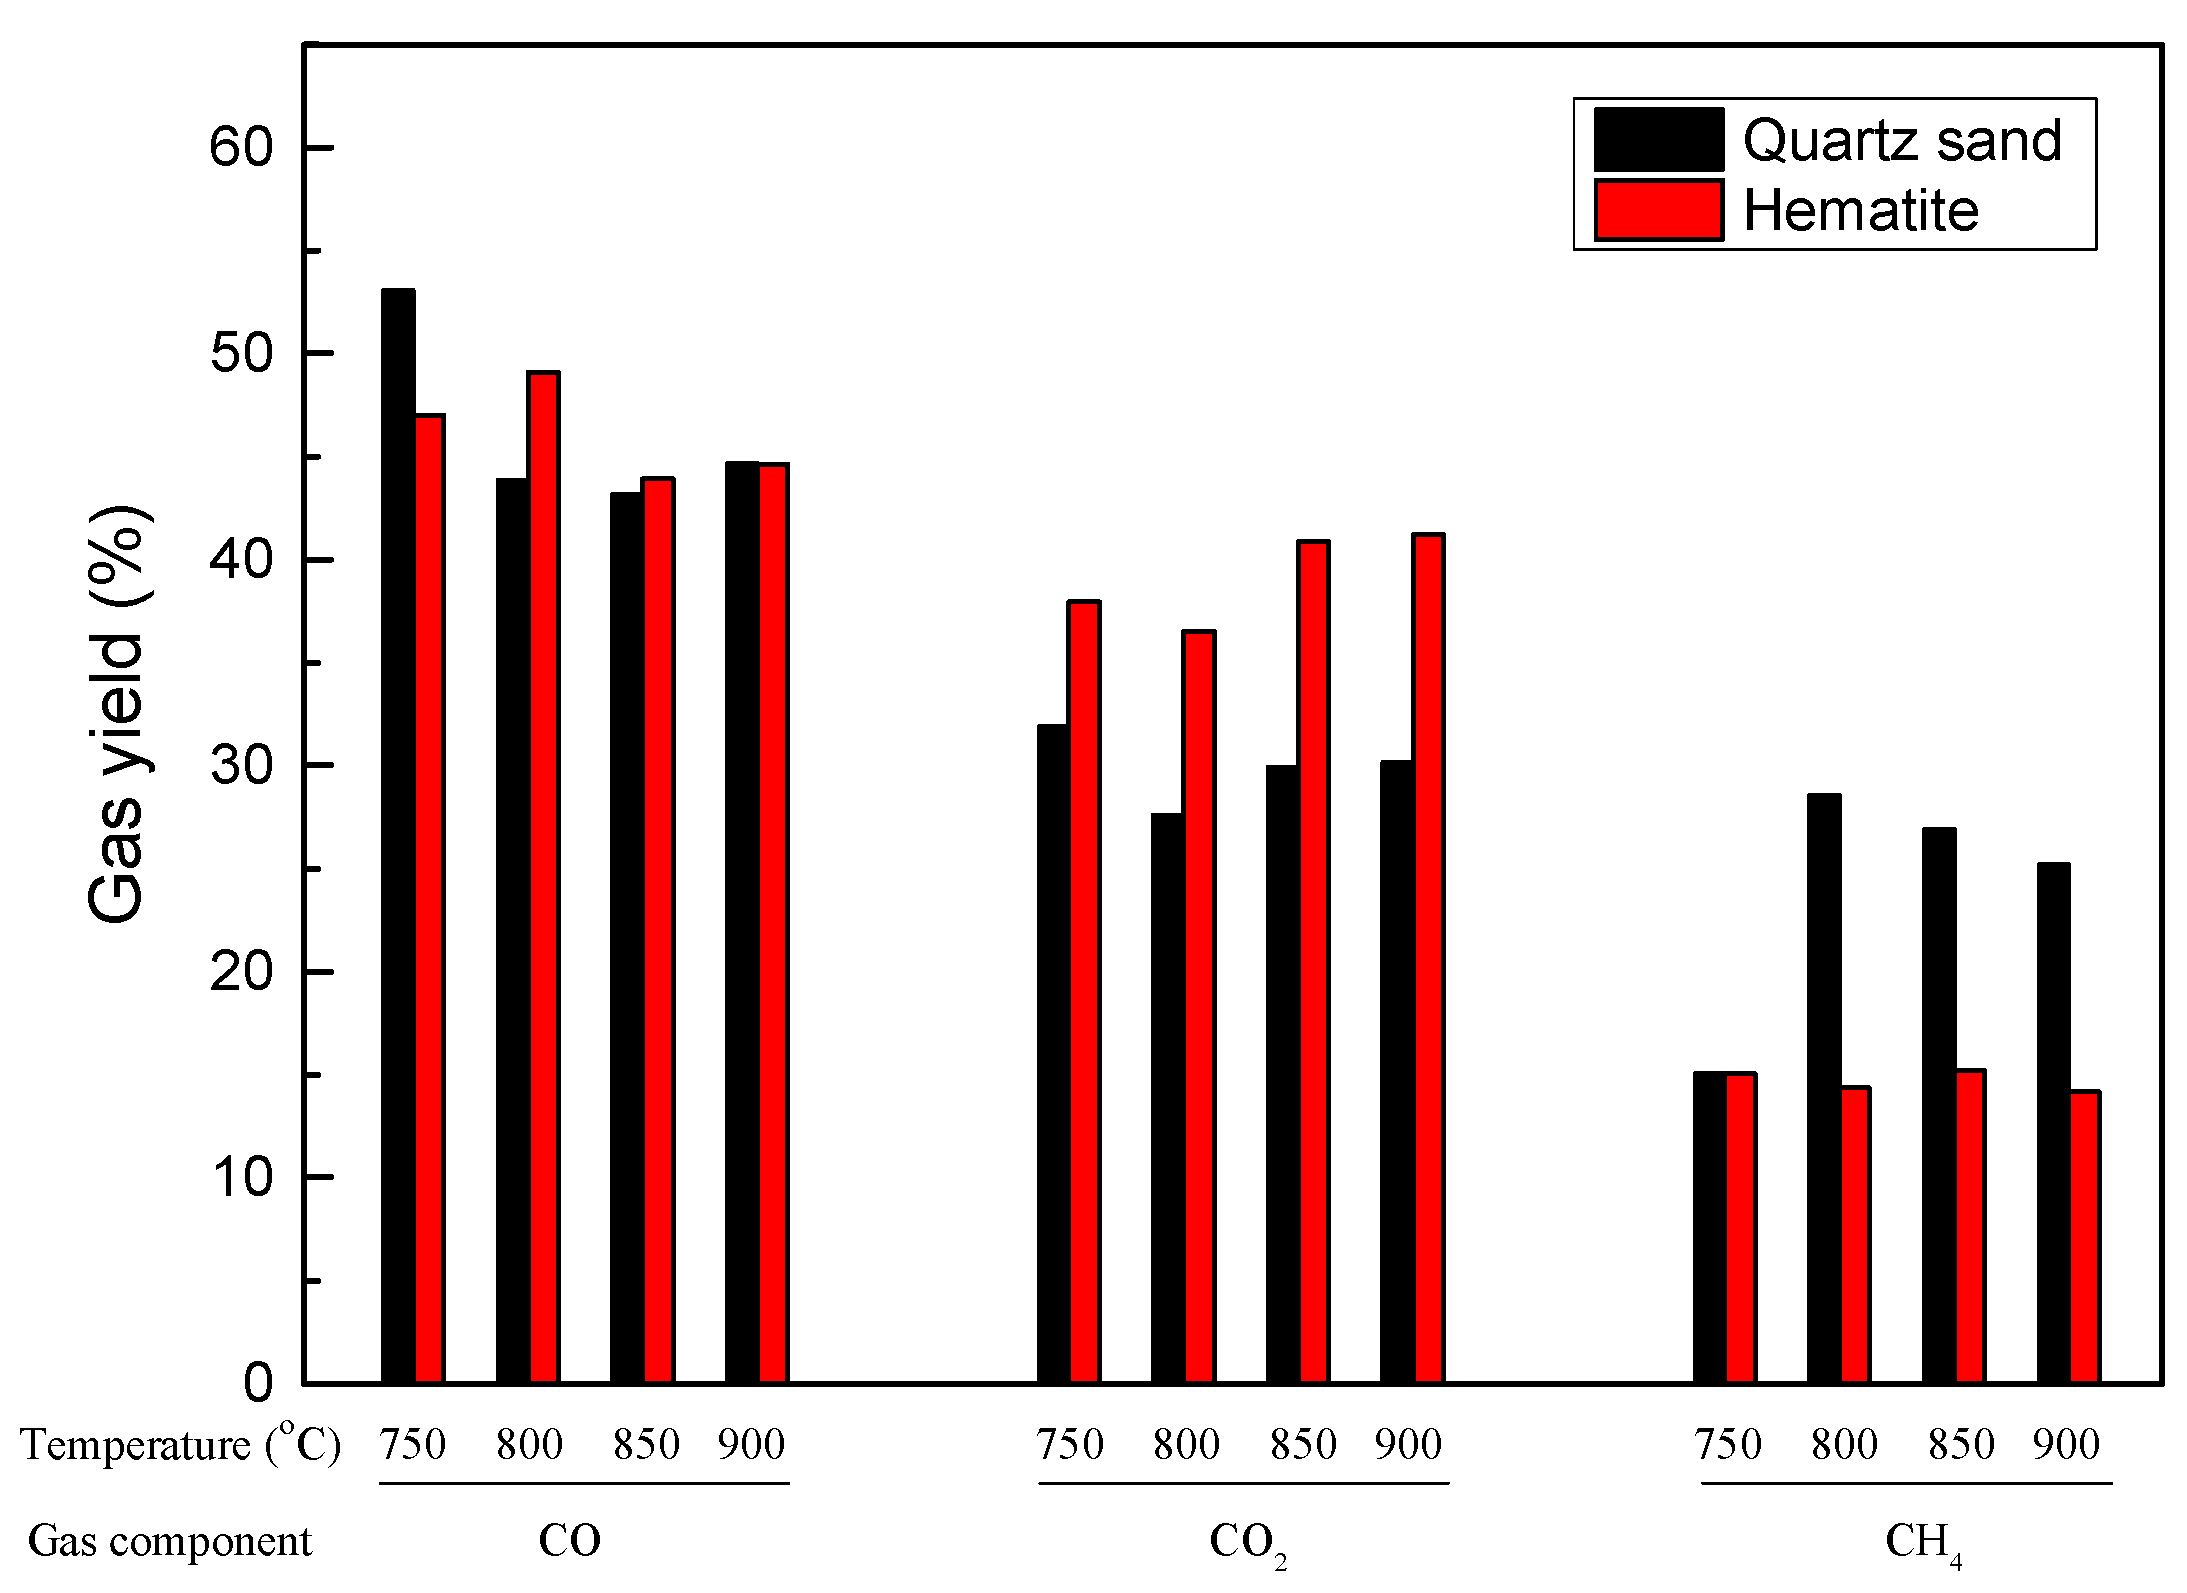
For a more intuitive understanding of the effect of hematite on the CLC of briquette cyanobacteria, Figure 22 shows the gas yield comparison between quartz sand and hematite. For quartz sand, CO yield decreases from the maximum (53.1%) at 750 °C to about the minimum (43.9%) at 850 °C, and then increases slightly at 900 °C. However, the changing trend of CO yield for hematite is completely the opposite. CO yield at 750 °C with hematite is evidently lower than that with quartz sand, and CO yield at 800 °C with hematite is higher than that with quartz sand, while the two groups of data are close at 850 or 900 °C. Due to the presence of hematite, part of CO would be oxidized by Fe2O3 based on the reaction (Equations (9) and (10)). At the same time, the presence of hematite would enhance the carbon conversion of cyanobacteria and catalyzed crack liquid products (tar) from cyanobacteria. In addition, the stronger impact force of hematite during the fluidization process would accelerate the fragmentation of briquette cyanobacteria, which is also advantageous to the carbon conversion of cyanobacteria. Combined with the above factors, the difference in CO yield between quartz sand and hematite is not so much, especially at a higher temperature (850 and 900 °C).
CO2 yields both with quartz sand and hematite decrease to the minimum at 800 °C and then increase and maintain lastly with temperature. It is found that CO2 yield with the presence of hematite is evidently higher, which is ascribed to the reactions (Equations (9), (10), (13) and (14)). The combustion reactions between hematite and cyanobacteria-derived gaseous products are the dominated reactions, which generate a large amount of CO2. Additionally, the effect is more evident with the increase in temperature. With regard to CH4 yield, less CH4 is generated during the CLC process due to the redox reactions between CH4 and Fe2O3. At 750 °C, CH4 yields with two bed materials are close. It is inferred that although CH4 is consumed by Fe2O3, the pyrolysis or gasification of cyanobacteria is enhanced by hematite.

3.4. Effect of CLC Process on Nitrogen Contaminations

As a new combustion mode, CLC provides a new path for analyzing the migration mechanism. However, most studies focused on the migration mechanism in the CLC of coal or biomass instead of briquette cyanobacteria [35,36,37]. In the CLC process, a fuel reactor is under an air-free environment; thus, NOx derived from fuel N is the main component. During the fuel combustion process, HCN and NH3 are commonly believed to be two precursors or intermediary compounds. In the process of CLC based on hematite OC, a series of competitive reactions about NOx emission are shown as follows.
H C N + 15 2 F e 2 O 3 = 1 2 N 2 + 5 F e 3 O 4 + C O 2 + 1 2 H 2 O
H C N + 9 F e 2 O 3 = 1 2 N 2 O + 6 F e 3 O 4 + C O 2 + 1 2 H 2 O
H C N + 21 2 F e 2 O 3 = N O + 7 F e 3 O 4 + C O 2 + 1 2 H 2 O
N H 3 + 9 2 F e 2 O 3 = 1 2 N 2 + 3 F e 3 O 4 + 3 2 H 2 O
N H 3 + 6 F e 2 O 3 = 1 2 N 2 O + 4 F e 3 O 4 + 3 2 H 2 O
N H 3 + 15 2 F e 2 O 3 = N O + 5 F e 3 O 4 + 3 2 H 2 O
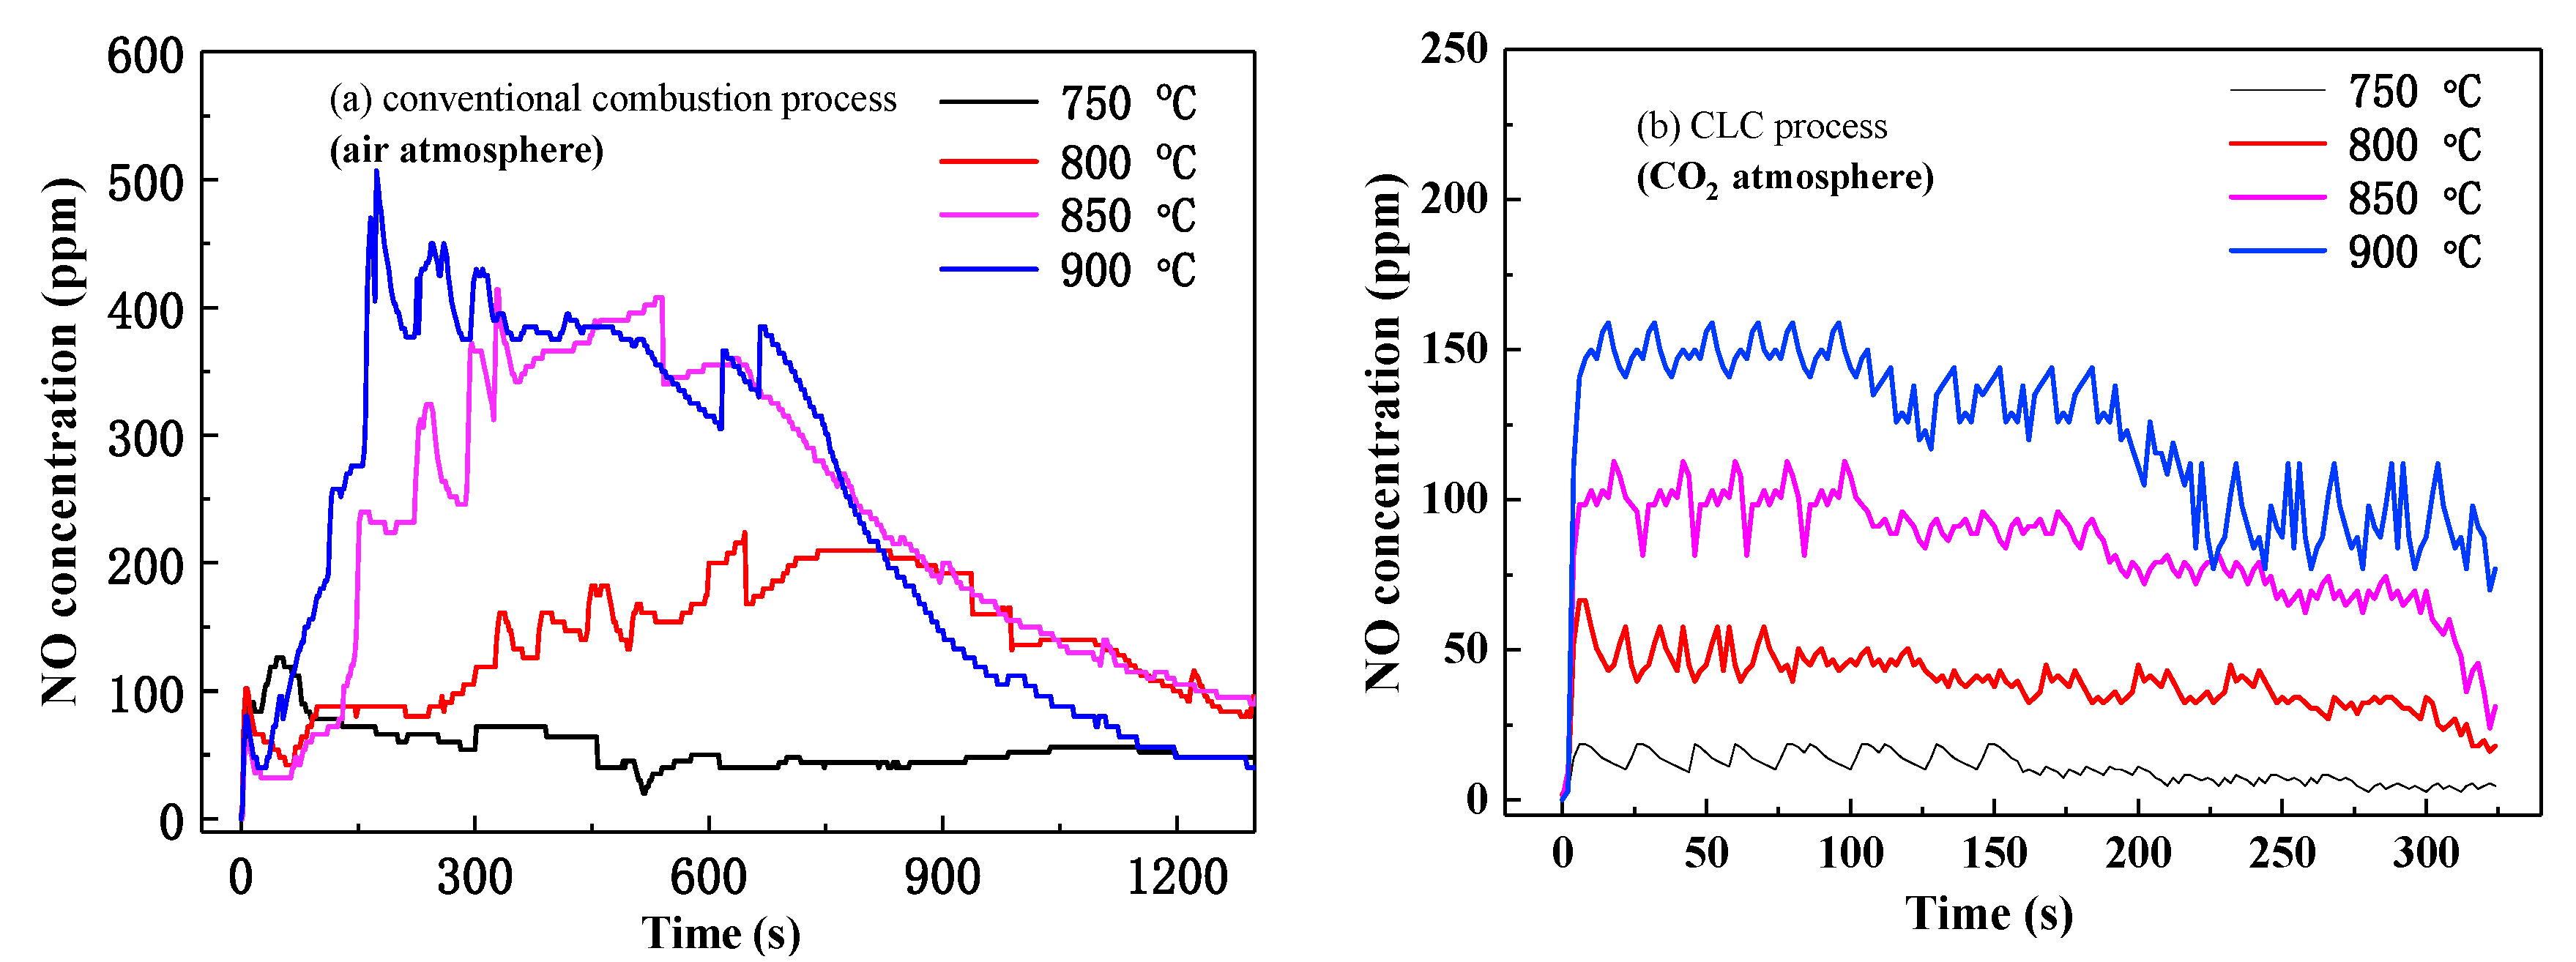
Figure 23 shows the NO concentration change from the outlet of a single fluidized bed in the conventional combustion process and CLC process, respectively. In the conventional combustion process, the selected briquette cyanobacteria of 0.5 g is the sample densified at the compressive load of 1 ton and the moisture content of 10%. The fluidizing agent is 1.5 L/min O2. In the CLC process, the fluidizing agent is the mixture of 1.5 L/min CO2 and 0.8 g/min steam, and hematite of 30 g acts as bed materials. According to Figure 23, NO emission concentration increases with the experimental temperature no matter in the conventional combustion process or the CLC process. In addition, NO emission concentration in the conventional combustion process is evidently higher than that in the CLC process under the same experimental condition. In the conventional combustion process, the NO emission is caused by thermal NOx from airborne nitrogen and fuel NOx from briquette cyanobacteria. However, NO emission from CLC is lower because the airborne nitrogen is nearly or completely eliminated in the fuel reactor. Additionally, relatively low reaction temperature in the fuel reactor compared to conventional air-fired process is also conducive to reduce NOx emission. It is worthwhile to note that the thermal NOx in the conventional combustion process would increase more evidently when the temperature reaches to above 950 °C. In addition, due to the compact structure of briquette cyanobacteria, NO emission maintains for a longer time compared to the combustion process of powder cyanobacteria.

3.5. Cyclical Performance and Phosphorus Transformation

The variation in the mechanical strength of briquette cyanobacteria and the advantage of carbon conversion in the CLC process with hematite were studied. In order to further study the characteristics of briquette cyanobacteria as fuel in CLC with hematite, the redox cycle experiments were conducted to investigate the stability of hematite reactivity in terms of gas yields.
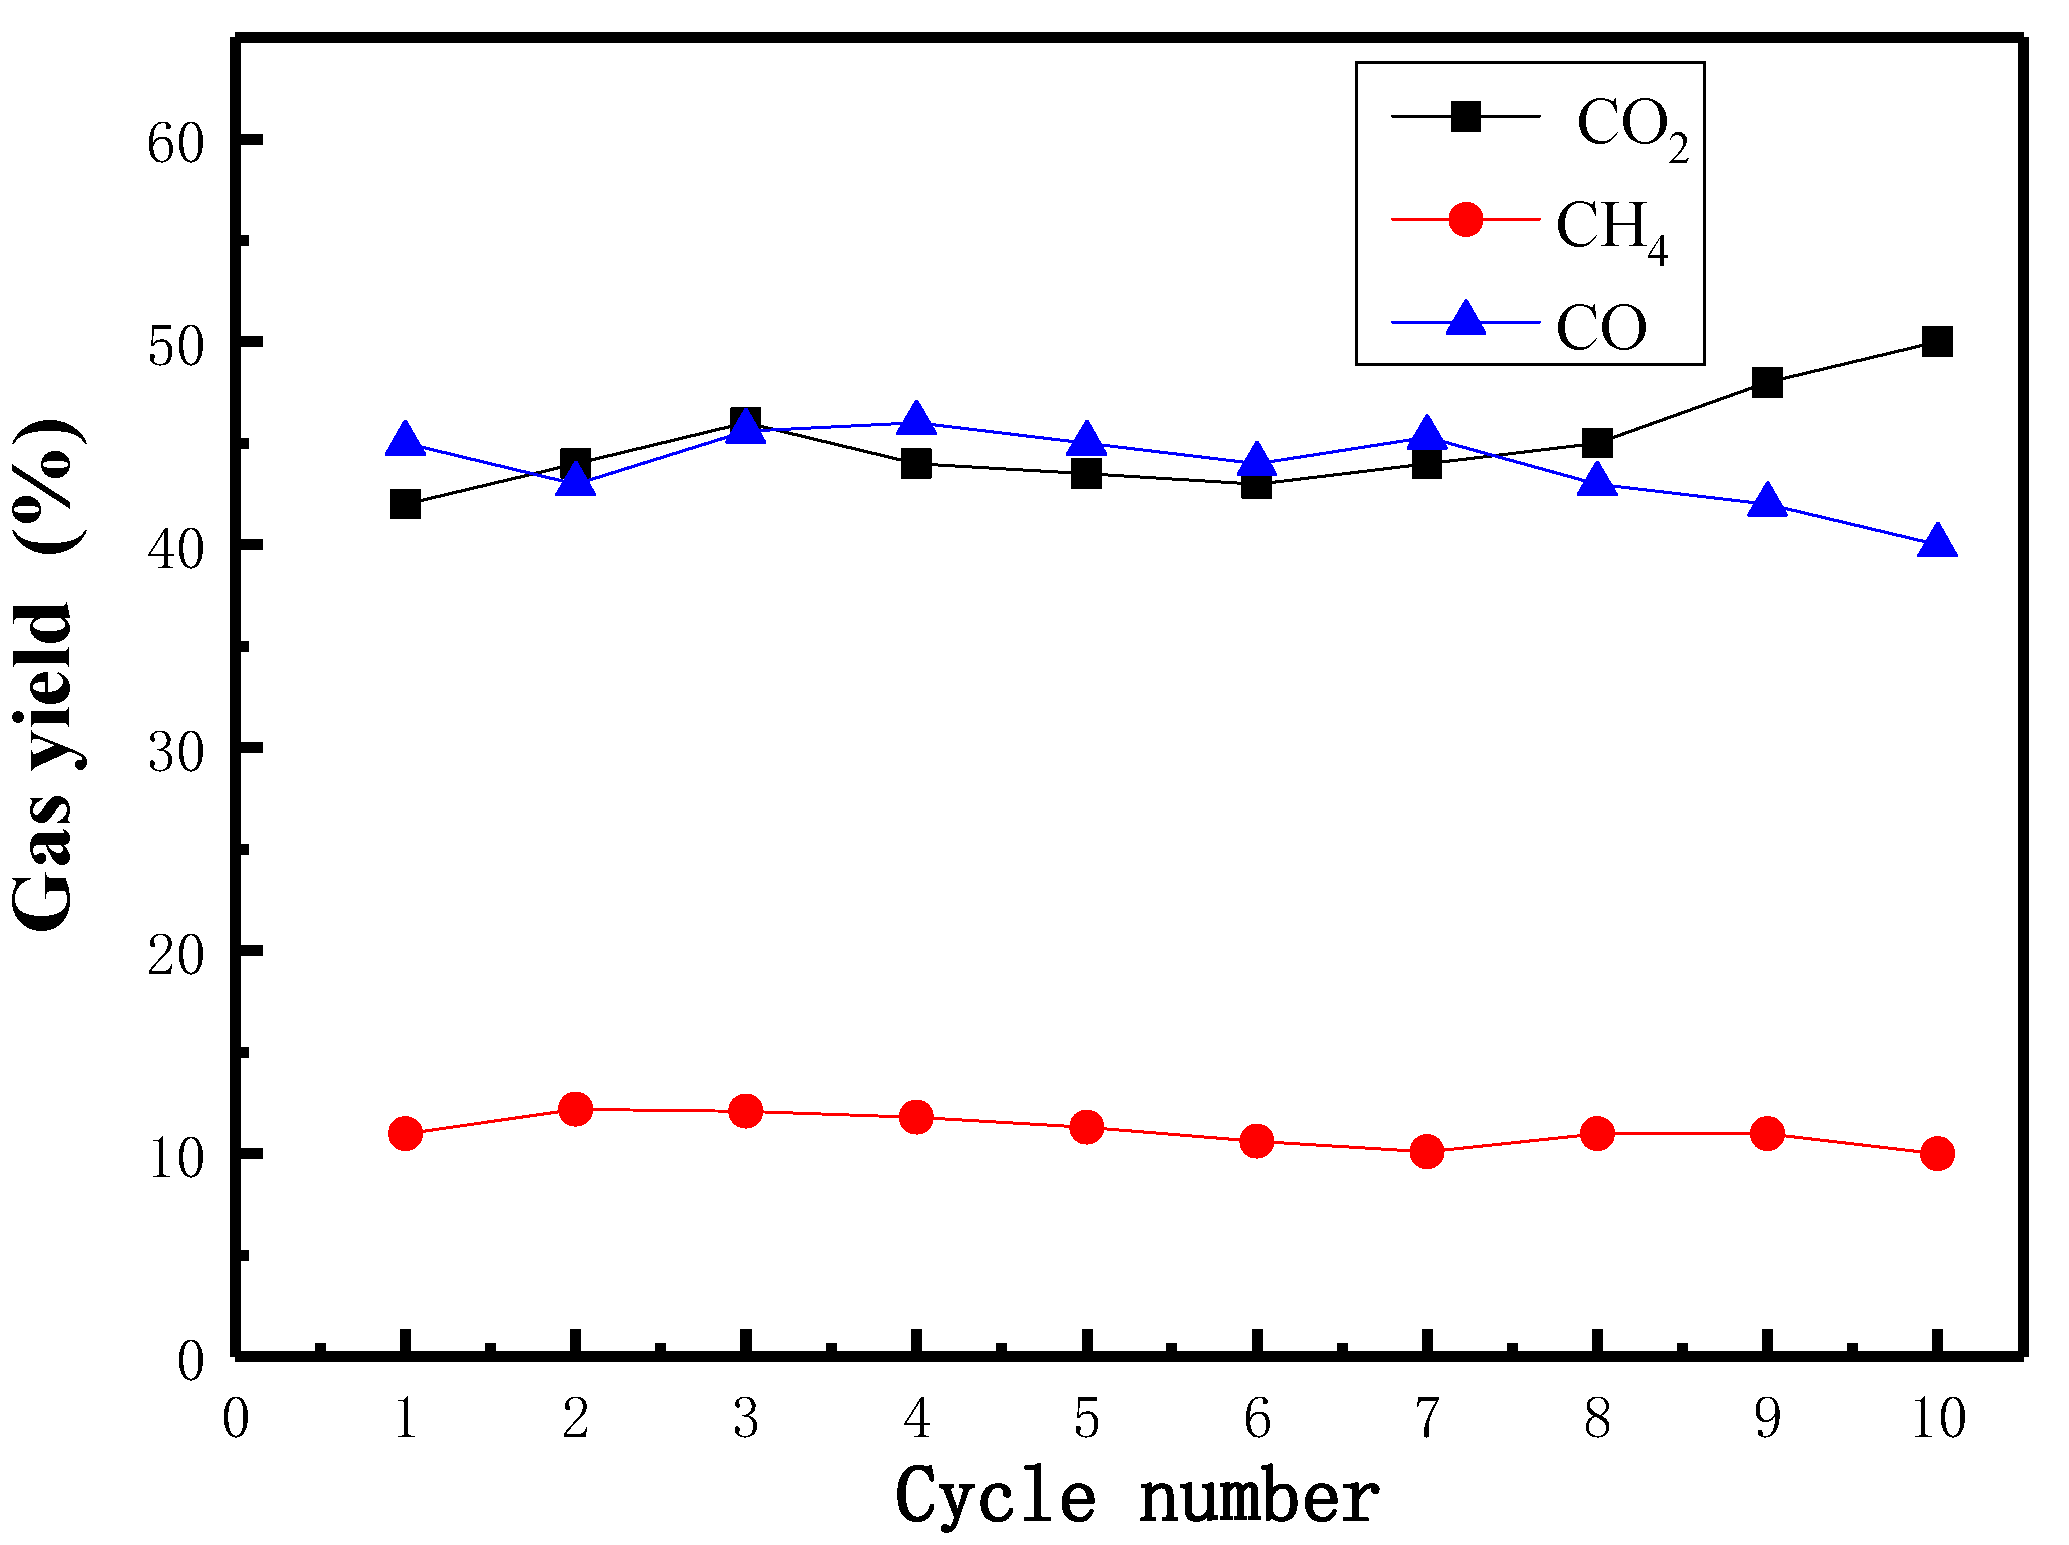
A 10-cycle experiment on the reactivity of hematite in the CLC of briquette cyanobacteria was carried out in the single fluidized bed. Figure 24 shows the variation in relative gas yields of carbonaceous gas during 10 cycles at 900 °C. It is clear that CO gas yield is relatively high, which has been maintained at about 45% for eight cycles. CO2 gas yield during eight cycles also maintains at about 45%, which is relatively lower in the combustion process. CH4 gas yield is the lowest, which is stable at 10%. It is difficult for the internal carbon components of briquette cyanobacteria to react with steam or hematite OC rapidly. Therefore, some reacted carbonaceous gases escape from the outlet of the reactor before reacting with the hematite OC. However, CO2 gas yield exhibits an evident increase and CO gas yield decreases sharply. It is inferred that the reactivity between briquette cyanobacteria and hematite increases after eight cycles.
The fresh calcinated and reacted hematite particles after three and 10 cycles were characterized by scanning electron microscopy (SEM) to achieve morphological feature, as shown in Figure 25. The fresh calcinated hematite particle (Figure 25a) was the original preparation OC, which had a visible sintering pattern in some parts on account of the high-temperature calcination process. As for the reacted hematite particle after three cycles, there was no evident change regarding the morphological feature. However, after 10 cycles, a distinct porous structure with many irregular small granules adhered to the surface was performed, which is propitious to the diffusion of reactant gases into the interior part of hematite particles. Therefore, CO2 gas yield or carbon conversion efficiency would increase and maintain at higher values after 10 cycles.
In addition, the phosphorus transformation in the CLC of briquette cyanobacteria may vary substantially compared to the conventional combustion process. The incineration ash from conventional combustion and CLC ash collected from a 10-cycle test were analyzed by an X-ray diffractometer (XRD, Rigaku Co., Neu-Isenburg, Germany) and the qualitative results are shown in Table 4.
SiO2 and CaAl2Si2O8 are two main phases in incineration ash of briquette cyanobacteria. Phosphorus species in incineration ash exist mainly in the form of Ca2P2O7. There are three main phases, i.e., Fe3O4, SiO2, CaAl2Si2O8, in the CLC ash of briquette cyanobacteria. The Fe3O4 is mainly from hematite OC. In addition, the phosphorus combines with hydrogen to form CaH2P2O7 and CaHPO4 in CLC fly ash. The species pathway of phosphorus in the CLC process has been proposed by a simplified reaction as follows:
Ca2P2O7 + H2O 2 CaHPO4
The presence of steam and the reduction atmosphere in CLC can significantly accelerate the generation of CaH2P2O7 and CaHPO4 [38]. The phosphorus forms of CaH2P2O7 and CaHPO4 have a higher acid solubility than Ca2P2O7, which means that CLC is more conducive to phosphorus recovery. The CLC ash of briquette cyanobacteria could be utilized as fertilizer or secondary raw material for fertilizer production, realizing the cyanobacteria phosphorus recycling.

4. Conclusions

This work mainly studies the characteristic of briquette cyanobacteria as fuel in CLC with hematite as OC. In this paper, the application system of CLC of cyanobacteria is divided into five stages: cyanobacteria powder densification, drying, devolatilization, char burnout and redox cycle. According to the comparative study on different measuring tests, some conclusions are made:
Cyanobacteria powder is selected as raw material to extrude and pelletize by a single briquetting unit device. Moisture content and compressive load are selected as two experimental factors. Based on the apparent measurement, it is found that the moisture content of 10% is the best moisture content for the cyanobacteria densification process through a single briquetting unit. Additionally, the densification process exhibits an evident change when the compressive load increases from 1 to 3 tons, while the molding effect is not that obvious when the compressive load is over 3 tons. At the same time, according to the pressure-crushing tests regarding briquette cyanobacteria samples, the results show that compressive load is conducive to the original mechanical strength of briquette cyanobacteria, and the moisture content of 10% seems better for the cyanobacteria powder densification process.
Besides, the drying and devolatilization processes of briquette cyanobacteria under N2 atmosphere are studied separately. The drying and devolatilization processes are considered the first and second break stage for briquette cyanobacteria in CLC. In the drying process (first break), the forming rate and relax density of residual samples after drying are increased with compressive load no matter what the moisture content and heating rate are. Additionally, the optimal moisture content for the mechanical strength of briquette cyanobacteria after drying is also 10%, which is same with the result through a single briquetting unit. Additionally, a higher heating rate in the drying process would result in the drying process being more violent, and the damage for the internal structure is more severe, which is adverse to the mechanical strength of briquette dewatered cyanobacteria. In the devolatilization process (second break), the mechanical strength evolution is also similar to the drying process. During the devolatilization process, water and volatiles would escape from the briquette cyanobacteria, and there is no difference in the total amount for the same briquette cyanobacteria samples. The releasing rate has no evident effect on the mechanical strength evolution during the devolatilization process.
Thermochemical transformation characteristics in CLC process with hematite as OC are analyzed in a single fluidized bed. Compared with the results under the traditional combustion process (quartz sand as bed materials), the carbon conversion efficiency and rate due to the presence of hematite in CLC are evidently increased. Regarding the experimental results of gas yield, the difference in CO yield between CLC and the traditional combustion process is not so much, while CO2 yield with the presence of hematite is evidently higher. Additionally, less CH4 is generated during the CLC process due to the consumption by Fe2O3 in hematite. It is inferred that the presence of hematite would enhance the carbon conversion of cyanobacteria and the catalyzed crack for liquid products (tar) from cyanobacteria. The stronger impact force of hematite during the fluidization process would accelerate the fragmentation of the briquette cyanobacteria, which is also advantageous to the carbon conversion of cyanobacteria.
At last, the redox cycle experiments are conducted to investigate the reactivity stability and morphological features of hematite in CLC. The reactivity of hematite increases after eight cycles based on the variations in gas yield. Additionally, hematite particles after 10 cycles show an improved porous property. In addition, the phosphorus forms in CLC are CaH2P2O7 and CaHPO4, which have a higher acid solubility than Ca2P2O7, formed in conventional combustion. Therefore, CLC is more conducive to phosphorus recovery.

Author Contributions

Conceptualization, H.Z. and L.S. and H.G.; methodology, H.Z. and L.S. and H.G.; software, H.B.; validation, L.S. and H.G.; formal analysis, H.Z.; investigation, H.Z.; resources, L.S. and H.G.; data curation, L.S. and H.G.; writing—original draft preparation, H.Z.; writing—review and editing, L.S. and H.G.; visualization, H.B.; supervision, L.S. and H.G.; project administration, L.S. and H.G.; funding acquisition, H.G. All authors have read and agreed to the published version of the manuscript.

Funding

This work is supported by the National Natural Foundation of China (52006108) and Natural Science Foundation of Jiangsu Province (BK20180388) and Foundation of State Key Laboratory of High-Efficiency Utilization of Coal and Green Chemical Engineering (Grant No. 2020-KF-05).

Conflicts of Interest

The authors declare no conflict of interest.

References

  1. Cloern, J.E. Our evolving conceptual model of the coastal eutrophication problem. Mar. Ecology Prog. 2001, 210, 223–253. [Google Scholar] [CrossRef]
  2. Anderson, D.M.; Glibert, P.M.; Burkholder, J.M. Harmful algal blooms and eutrophication: Nutrient sources, composition, and consequences. Estuaries 2002, 25, 704–726. [Google Scholar] [CrossRef]
  3. Davis, J.R.; Koop, K. Eutrophication in Australian Rivers, Reservoirs and Estuaries—A Southern Hemisphere Perspective on the Science and its Implications. Hydrobiologia 2006, 559, 23–76. [Google Scholar] [CrossRef]
  4. Robarts, R.D.; Zohary, T. Temperature effects on photosynthetic capacity, respiration, and growth rates of bloom forming cyanobacteria. N. Z. J. Mar. Freshw. Res. 1987, 21, 391–399. [Google Scholar] [CrossRef] [Green Version]
  5. Paerl, H.W.; Xu, H.; McCarthy, M.J.; Zhu, G.; Qin, B.; Li, Y.; Gardner, W.S. Controlling harmful cyanobacterial blooms in a hyper-eutrophic lake (Lake Taihu, China): The need for a dual nutrient (N & P) management strategy. Water Res. 2011, 45, 1973–1983. [Google Scholar]
  6. Shao, J.; Gu, J.; Peng, L.; Luo, S.; Luo, H.; Yan, Z.; Wu, G. Modification of cyanobacterial bloom-derived biomass using potassium permanganate enhanced the removal of microcystins and adsorption capacity toward cadmium (II). J. Hazard. Mater. 2014, 272, 83–88. [Google Scholar] [CrossRef]
  7. Jacoby, J.M.; Gibbons, H.L.; Stoops, K.B.; Bouchard, D.D. Response of a Shallow, Polymictic Lake to Buffered Alum Treatment. Lake Reserv. Manag. 1994, 10, 103–112. [Google Scholar] [CrossRef]
  8. Zhou, Q.; Song, L.; Li, L. Effect of shading on the algal blooms during spring Lake Dianchi. Environ. Sci. Technol. 2015, 38, 53–59. [Google Scholar]
  9. Parmar, A.; Singh, N.K.; Pandey, A.; Gnansounou, E.; Madamwar, D. Cyanobacteria and microalgae: A positive prospect for biofuels. Bioresour. Technol. 2011, 102, 10163–10172. [Google Scholar] [CrossRef] [PubMed]
  10. Alba, L.G.; Torri, C.; Fabbri, D.; Kersten, S.R.; Brilman, D.W. Microalgae growth on the aqueous phase from hydrothermal liquefaction of the same microalgae. Chem. Eng. J. 2013, 228, 214223. [Google Scholar]
  11. Gnansounou, E.; Raman, J. Life cycle assessment of algae biodiesel and its co-products. Appl. Energy 2016, 161, 300308. [Google Scholar] [CrossRef]
  12. Zhao, X.; Zhou, H.; Sikarwar, V.S.; Zhao, M.; Park, A.H.; Fennell, P.S.; Shen, L.; Fan, L.S. Biomass-based chemical looping technologies: The good, the bad and the future. Energy Environ. Sci. 2017, 10, 1865–2046. [Google Scholar] [CrossRef] [Green Version]
  13. Thiruvenkadam, S.; Izhar, S.; Yoshida, H.; Danquah, M.K.; Harun, R. Process application of Subcritical Water Extraction (SWE) for algal bioproducts and biofuels production. Appl. Energy 2015, 154, 815–828. [Google Scholar] [CrossRef]
  14. Sikkema, R.; Steiner, M.; Junginger, M.; Hiegl, W.; Faaij, A. The European wood pellet markets: Current status and prospects for 2020. Biofuels Bioprod. Biorefin. 2011, 5, 250–278. [Google Scholar] [CrossRef]
  15. Adekunle, A.; Jamiu, K.; Peter, P.; Olumuyiwa, A.; Madhurai, M.; Dayanand, P. Essential basics on biomass torrefaction, densification and utilization. Int. J. Energy Res. 2021, 45, 1375–1395. [Google Scholar]
  16. Gao, N.; Li, A.; Quan, C. A novel reforming method for hydrogen production from biomass steam gasification. Bioresour. Technol. 2009, 100, 4271–4277. [Google Scholar] [CrossRef]
  17. Chang, L. Study on the Formation and Release of Nitrogen-Containing Compounds during Coal Pyrolysis and Gasification. Ph.D. Thesis, Taiyuan University of Technology, Taiyuan, China, 2004. [Google Scholar]
  18. Tilman, D.; Fargione, J.; Wolff, B.; D’antonio, C.; Dobson, A.; Howarth, R.; Schindler, D.; Schlesinger, W.H.; Simberloff, D.; Swackhamer, D. Forecasting agriculturally driven global environmental change. Science 2001, 292, 281–284. [Google Scholar] [CrossRef] [Green Version]
  19. Huang, Z.; He, F.; Feng, Y.; Liu, R.; Zhao, K.; Zheng, A.; Chang, S.; Zhao, Z.; Li, H. Characteristics of biomass gasification using chemical looping with iron ore as an oxygen carrier. Int. J. Hydrogen Energy 2013, 38, 14568–14575. [Google Scholar] [CrossRef]
  20. Mendiara, T.; Johansen, J.M.; Utrilla, R.; Geraldo, P.; Jensen, A.D.; Glarborg, P. Evaluation of different oxygen carriers for biomass tar reforming (I): Carbon deposition in experiments with toluene. Fuel 2011, 90, 1049–1060. [Google Scholar] [CrossRef] [Green Version]
  21. Sarvaramini, A.; Larachi, F. Catalytic oxygenless steam cracking of syngas-containing benzene model tar compound over natural Fe-bearing silicate minerals. Fuel 2012, 97, 741–750. [Google Scholar] [CrossRef]
  22. Zhao, H.; Guo, L.; Zou, X. Chemical-looping auto-thermal reforming of biomass using Cu-based oxygen carrier. Appl. Energy 2015, 157, 408–415. [Google Scholar] [CrossRef]
  23. Keller, M.; Fung, J.; Leion, H.; Mattisson, T. Cu-impregnated alumina/silica bed materials for Chemical Looping Reforming of biomass gasification gas. Fuel 2016, 180, 448–456. [Google Scholar] [CrossRef]
  24. Hossain, M.; Sedor, K.; De Lasa, H. Co–Ni/Al2O3 oxygen carrier for fluidized bed chemical-looping combustion: Desorption kinetics and metal–support interaction. Chem. Eng. Sci. 2007, 62, 5464–5472. [Google Scholar] [CrossRef]
  25. Niu, X.; Shen, L. Release and transformation of phosphorus in chemical looping combustion of sewage sludge. Chem. Eng. J. 2018, 335, 621–630. [Google Scholar] [CrossRef]
  26. He, F.; Huang, Z.; Liu, H. Biomass direct chemical looping conversion in a fluidized bed reactor with natural hematite as an oxygen carrier. In Proceedings of the Power and Energy Engineering Conference (APPEEC), Wuhan, China, 25–28 March 2011; pp. 1–7. [Google Scholar]
  27. Guo, Q.; Cheng, Y.; Liu, Y. Coal chemical looping gasification for syngas generation using an iron-based oxygen carrier. Ind. Eng. Chem. Res. 2013, 53, 78–86. [Google Scholar] [CrossRef]
  28. Matsuoka, K.; Shinbori, T.; Kuramoto, K. Mechanism of woody biomass pyrolysis and gasification in a fluidized bed of porous alumina particles. Energy Fuels 2006, 20, 1315–1320. [Google Scholar] [CrossRef]
  29. Liu, Y.; Guo, Q. Investigation into syngas generation from solid fuel using CaSO4-based chemical looping gasification process. Chin. J. Chem. Eng. 2013, 21, 127–134. [Google Scholar] [CrossRef]
  30. Cho, P.; Mattisson, T.; Lyngfelt, A. Comparison of iron-, nickel-, copper-and manganese-based oxygen carriers for chemical-looping combustion. Fuel 2004, 83, 1215–1225. [Google Scholar] [CrossRef]
  31. Adánez, J.; de Diego, L.F.; García-Labiano, F.; Gayán, P.; Abad, A.; Palacios, J.M. Selection of oxygen carriers for chemical-looping combustion. Energy Fuels 2004, 18, 371–377. [Google Scholar] [CrossRef]
  32. Abad, A.; Mattisson, T.; Lyngfelt, A.; Rydèn, M. Chemical-looping combustion in a 300 W continuously operating reactor system using a manganese-based oxygen carrier. Fuel 2006, 85, 1174–1185. [Google Scholar] [CrossRef]
  33. Chuang, S.Y.; Dennis, J.S.; Hayhurst, A.N.; Scott, S.A. Development and performance of Cu-based oxygen carriers for chemical-looping combustion. Combust. Flame 2008, 154, 109–121. [Google Scholar] [CrossRef]
  34. Kuhn, J.N.; Zhao, Z.; Felix, L.G.; Slimane, R.B.; Choi, C.W.; Ozkan, U.S. Olivine catalysts for methane-and tar-steam reforming. Appl. Catal. B Environ. 2008, 81, 14–26. [Google Scholar] [CrossRef]
  35. Song, T.; Shen, L.; Xiao, J.; Chen, D.; Gu, H.; Zhang, S. Nitrogen transfer of fuel-N in chemical looping combustion. Combust. Flame 2012, 159, 1286–1295. [Google Scholar] [CrossRef]
  36. Friebel, J.; Köpsel RF, W. The fate of nitrogen during pyrolysis of German low rank coals—A parameter study. Fuel 1999, 78, 923–932. [Google Scholar] [CrossRef]
  37. Tan, L.L.; Li, C.Z. Formation of NOx and SOx precursors during the pyrolysis of coal and biomass. Part I. Effects of reactor configuration on the determined yields of HCN and NH3 during pyrolysis. Fuel 2000, 79, 1883–1889. [Google Scholar] [CrossRef]
  38. Niu, X.; Shen, L.; Gu, H.; Jiang, S.; Xiao, J. Characteristics of hematite and fly ash during chemical looping combustion of sewage sludge. Chem. Eng. J. 2015, 268, 236–244. [Google Scholar] [CrossRef]
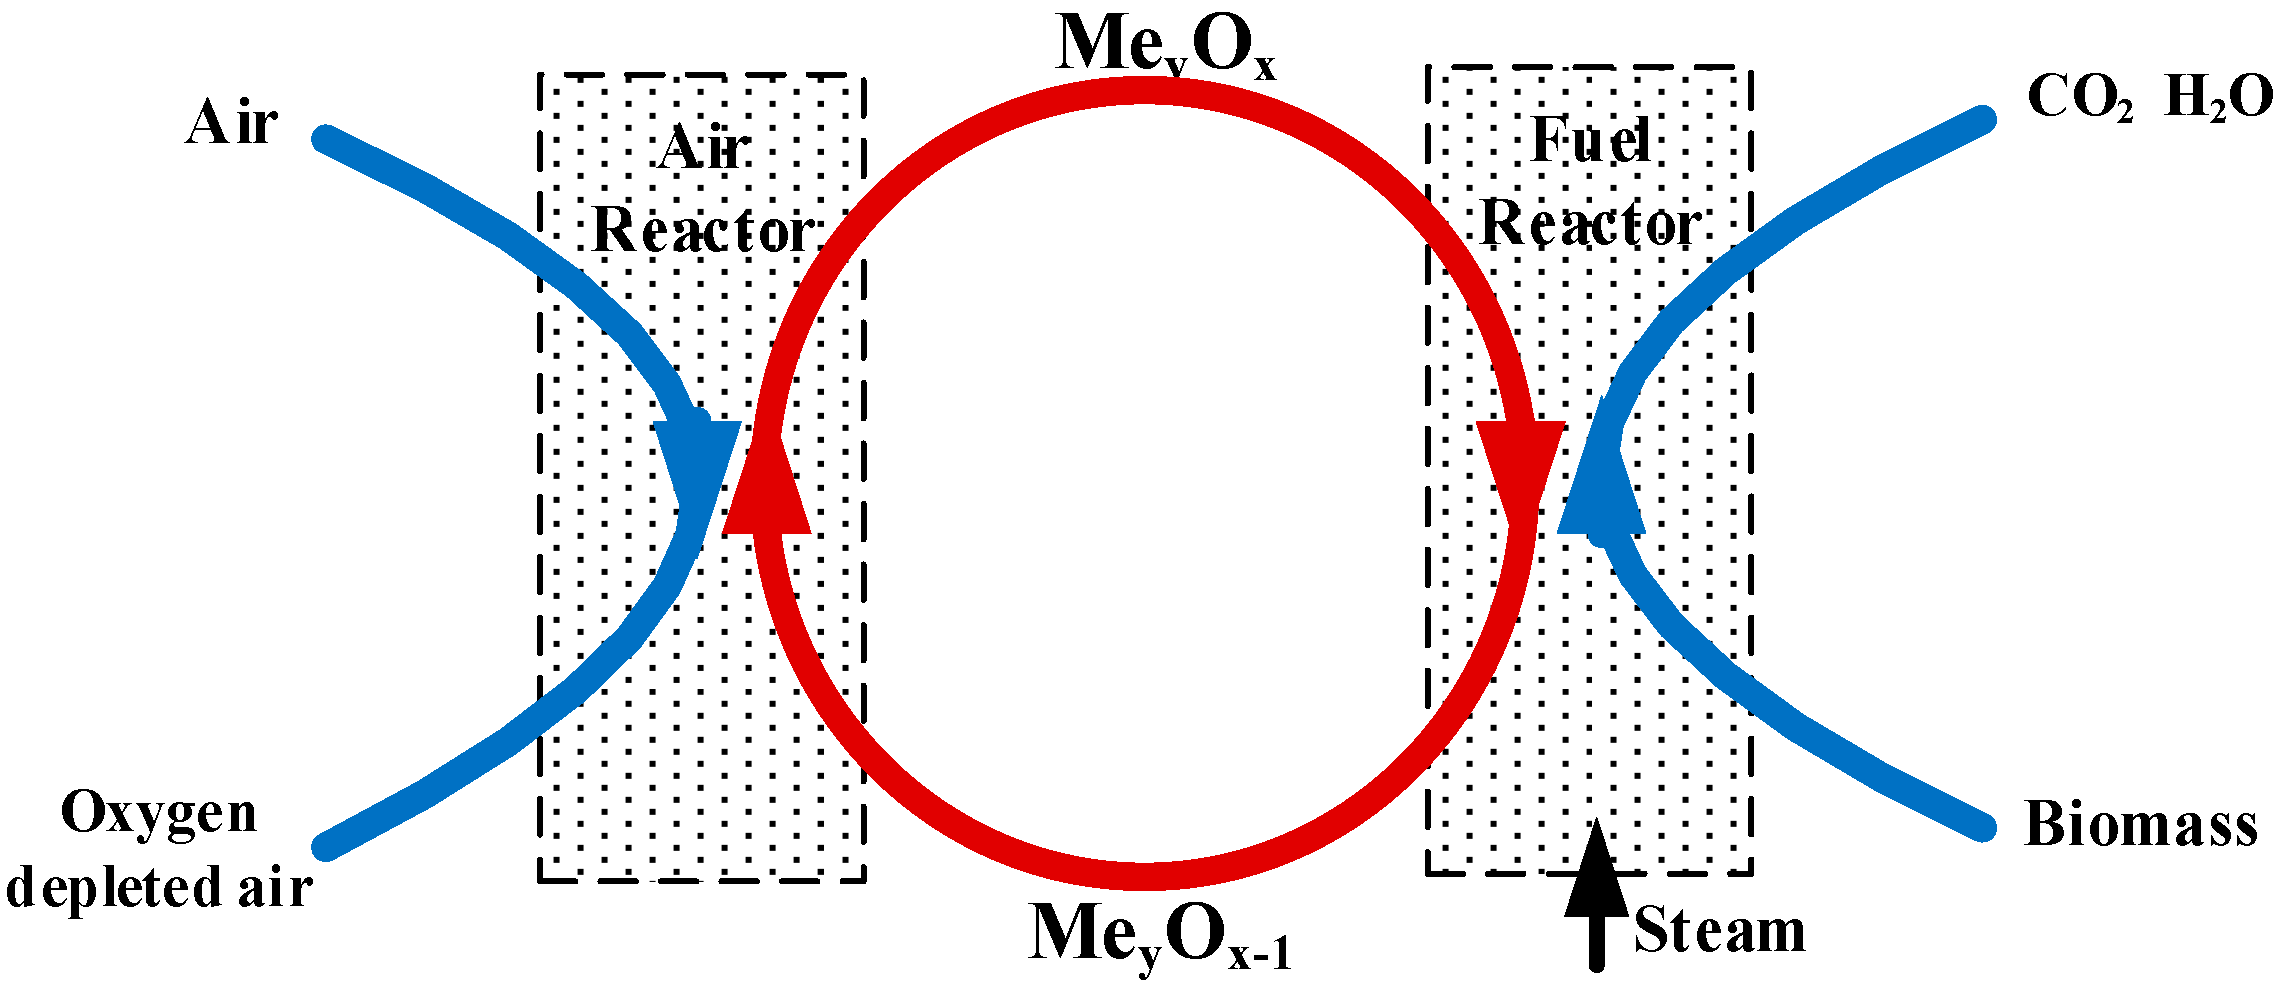
Figure 1. Schematic illustration of chemical looping combustion (CLC) process.
Applsci 11 04388 g001
Figure 2. Sketch of single briquetting unit (PC-15).
Applsci 11 04388 g002
Figure 3. Sketch of pressure crushing detector—Digital Push–Pull Gauge (HP-500).
Applsci 11 04388 g003
Figure 4. System of a TGA92 thermogravimetric analyzer (TGA).
Applsci 11 04388 g004
Figure 5. Schematic diagram of single fluidized bed.
Applsci 11 04388 g005
Figure 6. The drawing of briquette cyanobacteria by single briquetting unit.
Applsci 11 04388 g006
Figure 7. Single briquetting unit: the effects of moisture content on the forming rate and relax density.
Applsci 11 04388 g007
Figure 8. Single briquetting unit: the effects of compressive load on the forming rate and relax density.
Applsci 11 04388 g008
Figure 9. Pressure value change for different briquette cyanobacteria samples in pressure crushing tests.
Applsci 11 04388 g009
Figure 10. Samples after the drying process from a TGA reactor: the effects of moisture content of raw materials on the forming rate and relax density.
Applsci 11 04388 g010
Figure 11. Samples after the drying process from a TGA reactor: the effects of compressive load of raw materials on the forming rate and relax density.
Applsci 11 04388 g011
Figure 12. Drying process from a TGA reactor: the effects of compressive load, moisture content and heating rate on the forming rate and relax density (target temperature: 180 °C; compressive load: 1 ton, 3 tons and 5 tons; moisture content: 5%, 10% and 15%; heating rate: 10°C/min, 15°C/min and 25 °C/min).
Applsci 11 04388 g012
Figure 13. Samples after the devolatilization process from the TGA reactor: the effects of moisture content of raw materials on the forming rate and relax density.
Applsci 11 04388 g013
Figure 14. Samples after the devolatilization process from the TGA reactor: the effects of compressive load of raw materials on the forming rate and relax density.
Applsci 11 04388 g014
Figure 15. Devolatilization process from the TGA reactor: the effects of compressive load, moisture content and heating rate on the forming rate and relax density (target temperature: 500 °C; compressive load: 1, 3 and 5 tons; moisture content: 5, 10 and 15%; heating rate: 10, 15 and 25 °C/min).
Applsci 11 04388 g015
Figure 16. Concentrations of product gases with time for tests using quartz sand as bed material at different temperatures: (a) 750 °C, (b) 800 °C, (c) 850 °C, (d) 900 °C.
Applsci 11 04388 g016
Figure 17. Carbon conversion of briquette cyanobacteria in a single fluidized bed at different temperatures: 750, 800, 850 and 900 °C.
Applsci 11 04388 g017
Figure 18. Carbon conversion rate of briquette cyanobacteria in a single fluidized bed at different temperatures: 750, 800, 850 and 900 °C.
Applsci 11 04388 g018
Figure 19. Concentrations of product gases as a function of time for tests using hematite oxygen carrier as the bed material at different temperatures: (a) 750 ° C, (b) 800 ° C, (c) 850 ° C, (d) 900 ° C.
Applsci 11 04388 g019
Figure 20. Carbon conversion of briquette cyanobacteria with hematite in single fluidized bed at different temperatures: 750 °C, 800 °C, 850 °C, 900 °C.
Applsci 11 04388 g020
Figure 21. Carbon conversion rate of briquette cyanobacteria with hematite in single fluidized bed at different temperatures: 750 °C, 800 °C, 850 °C, 900 °C.
Applsci 11 04388 g021
Figure 22. Comparison of gas yield between quartz sand and hematite at 750, 800, 850, 900 °C.
Applsci 11 04388 g022
Figure 23. Comparison of NO concentration between (a) conventional combustion and (b) CLC at 750, 800, 850, 900 °C.
Applsci 11 04388 g023
Figure 24. Variations in carbonaceous gas yield during a 10-cycle test at 900 °C.
Applsci 11 04388 g024
Figure 25. SEM analysis (X20000) of hematite oxygen carrier after different cycles (900 °C).
Applsci 11 04388 g025
Table 1. Ultimate analysis, proximate analysis and chemical components of cyanobacteria powder.
Ultimate Analysis/(wt.%)Proximate Analysis/(wt.%)
Cad40.74Mar84.73
Had13.02Vd85.32
Oad34.44FCd7.55
Nad11.41Ad7.13
Sad0.39
Table 2. Chemical analysis of the hematite oxygen carrier.
ComponentsFe2O3Al2O3SiO2TiO2P2O5CaOK2OOthers
Content (wt.%)83.215.377.060.080.380.230.033.64
Table 3. Facts and quality attributes for briquette cyanobacteria in three reactors.
ReactorStageFactorsConditionQuality Attributes
Single briquetting unitDensification processMoisture content
Compressive load
(5–20%)
(1–7 tons)
Forming rate
Relax density
Crushing pressure
Thermogravimetric analysis (TGA) reactor Stage 1: Drying
Stage 2:
Devolatilization
Moisture content
Compressive load
Heating rate
(5–20%)
(1–7 tons)
180 °C (drying)
500 °C (Devolatilization)
(10–25 °C/min)
Forming rate
Relax density
Single fluidized bedThermochemical transformation including char burnoutTemperature
Hematite
SEM analysis
Cycle number
Batch feeding
(750–900 °C)
Hematite 30 g
N2 1.5 L/min+steam 0.8 g/min
Carbon conversion rate
Gas yield
Reaction stability
NO emission
Phosphorus phase
Table 4. XRD results for main compositions.
Composition
Incineration ashSiO2(major), CaAl2Si2O8(major), Ca2P2O7(trace)
CLC fly ashFe3O4(major), SiO2(major), CaAl2Si2O8(major), CaH2P2O7(trace), CaHPO4(trace)
* The markings trace, minor and major give a comparative measure of the amount of each compound. Trace means less than approximately 3%, minor approximately 10% and major more than 10%.
Publisher’s Note: MDPI stays neutral with regard to jurisdictional claims in published maps and institutional affiliations.