
Determination of the Waterway Parameters as a Component of Safety Management System


Abstract
:1. Introduction
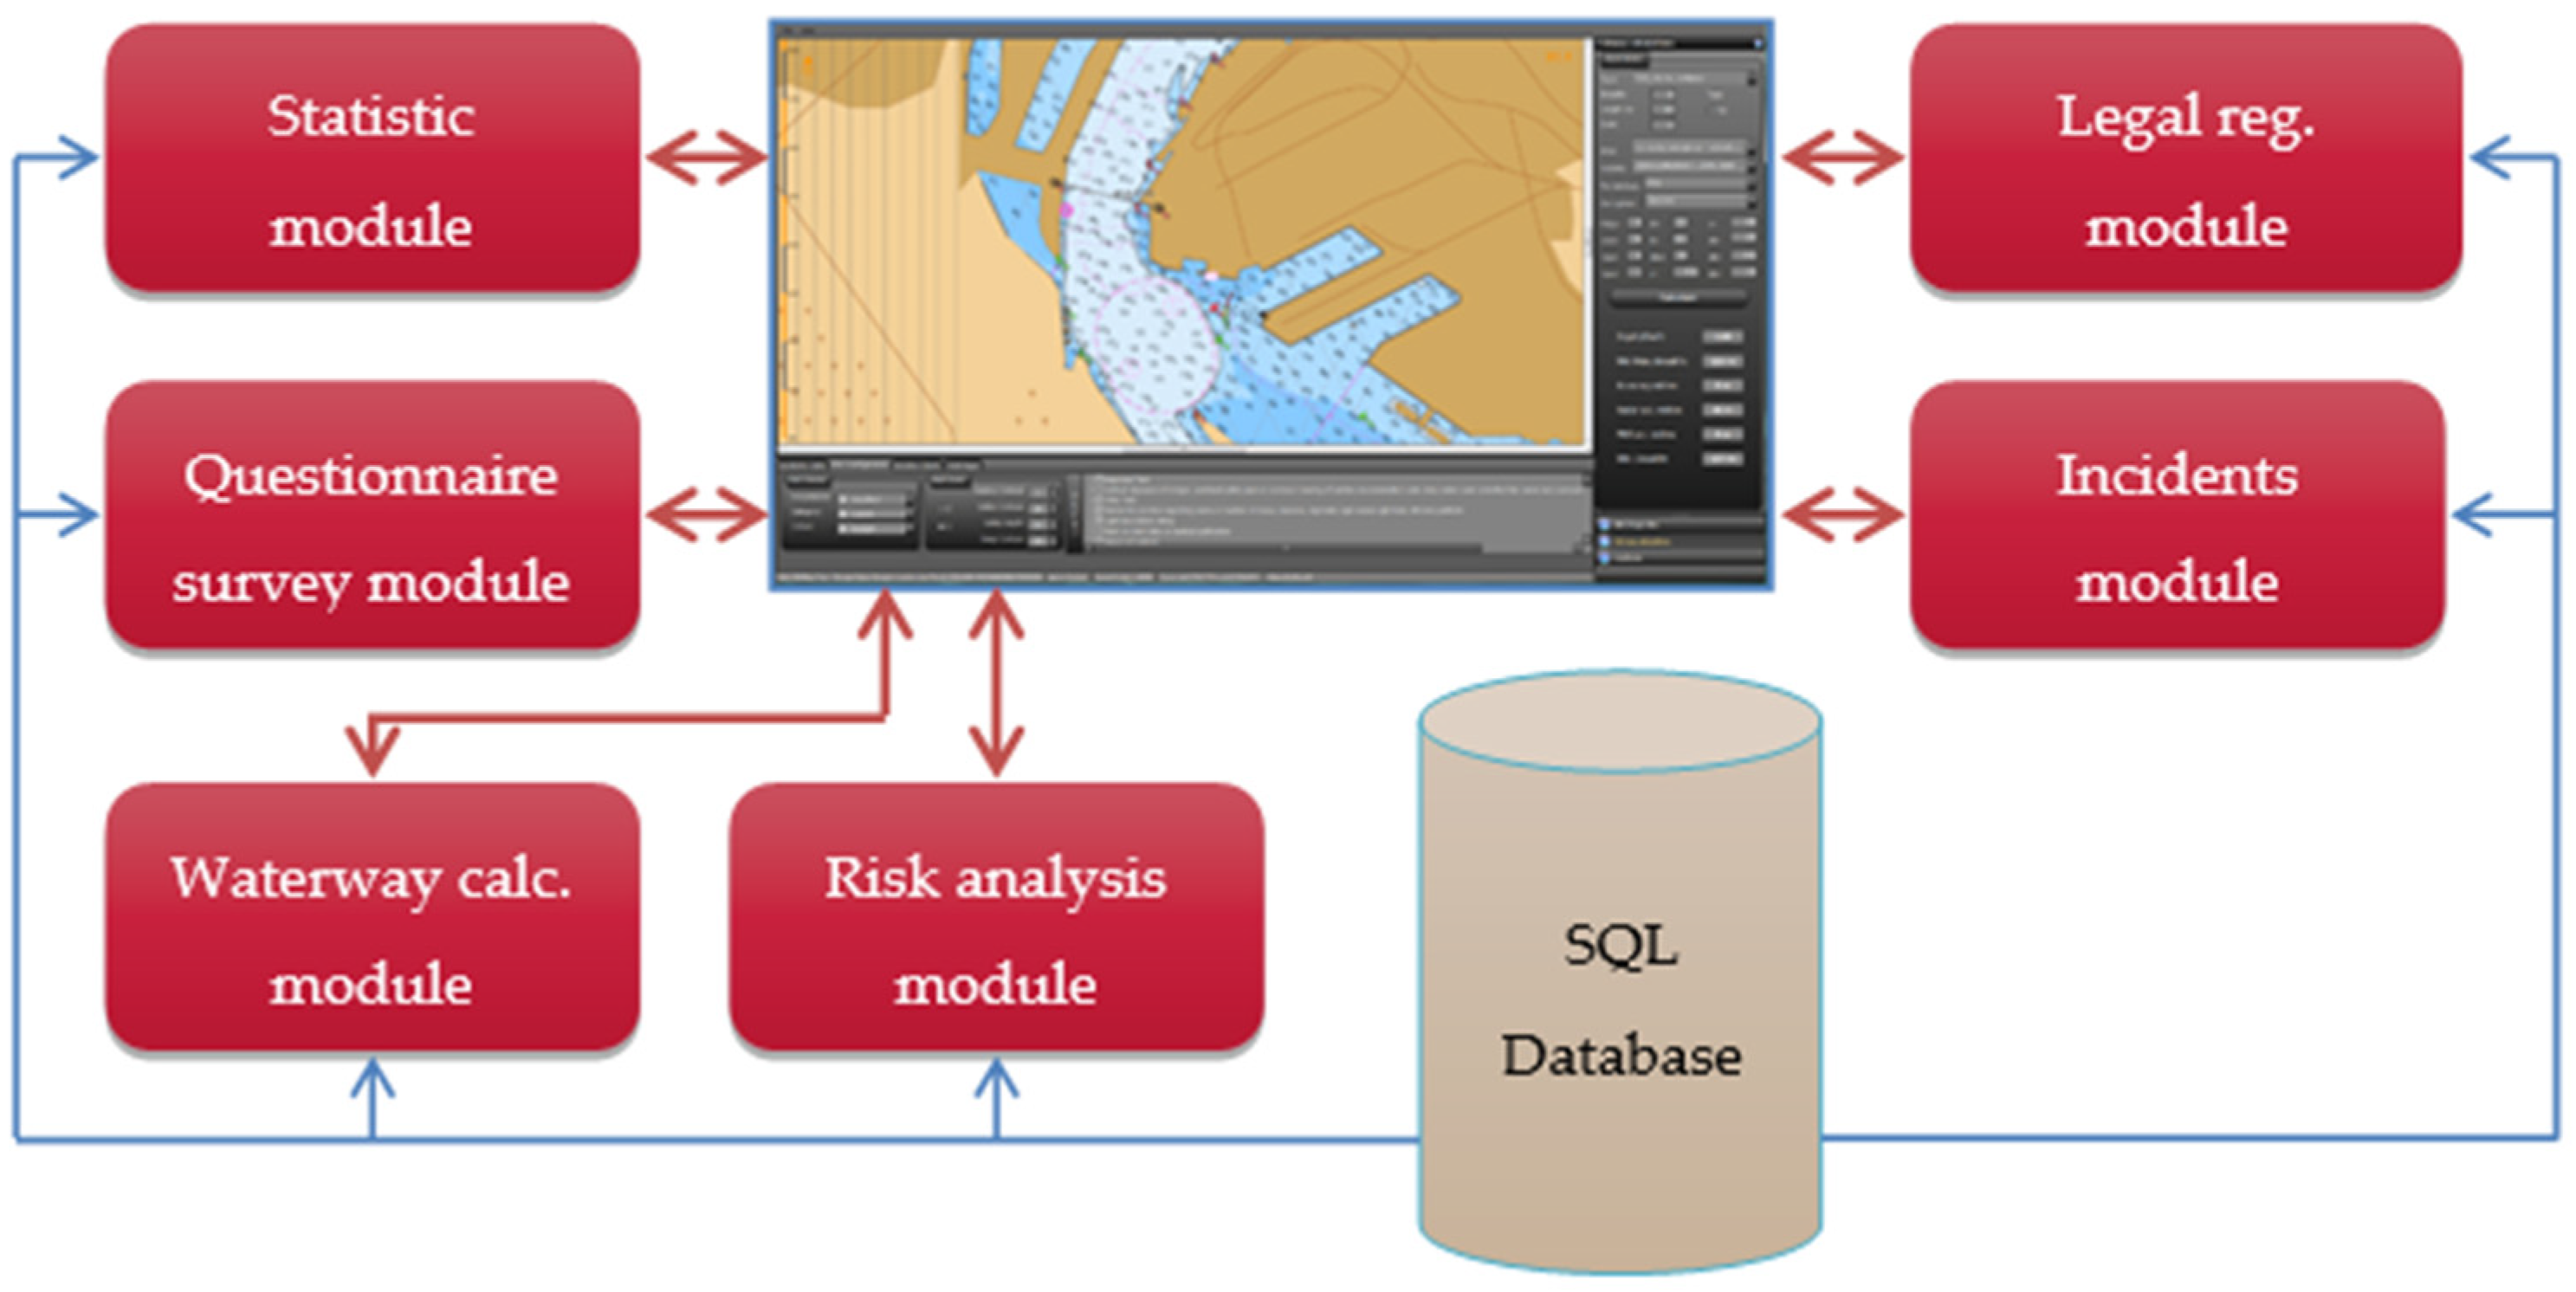
- (1)
- marine accident statistics module;
- (2)
- questionnaire survey module;
- (3)
- waterway calculation module for a given part of fairway;
- (4)
- risk analysis module;
- (5)
- recommendation module for the route being implemented based on the incident analysis;
- (6)
- legal regulation analysis module.
2. Related Works
3. Scope of Research
- (1)
- maximum speeds of the vessels, taking into account their types and dimensions;
- (2)
- maximum speeds and directions of the prevailing winds, especially crosswinds;
- (3)
- maximum speeds and directions of the prevailing lateral and longitudinal currents;
- (4)
- maximum parameters of the wind wave mainly affecting the vessels sailing on sea waterways in the open sea or inland waters.
- (1)
- sediment depositing on the slopes and the bottom of the fairway, carried or dragged by the water current; this deposition intensifies during storm surges, backwater, and very low water levels;
- (2)
- gathering of sediments at the bottom coming from adjacent waters reservoirs, usually very shallow;
- (3)
- sliding of fairway slopes to the bottom of the fairway as a result of the interactions of the currents and waves caused by vessels.
4. Materials and Methods
- —directional error of the ship’s side at the confidence level [m];
- —directional error in determining the vessel’s position (observer’s position) at the confidence level [m];
- —error in determining and maintaining the ship’s course on a straight section of the fairway, confidence level (°);
- —the distance between the bow and the bridge of the ship [m].
- directional error of the buoy deflection perpendicular to the fairway axis at the confidence level 0.95;
- buoy anchorage depth (m);
- coefficient that depends on the wave height in the given water area.
- —safe width of the manoeuvring area for a bend at the confidence level [m];
- —manoeuvring component of the width of the safe manoeuvring area in a bend [m];
- —manoeuvring component of the width of the safe manoeuvring area on a straight section [m];
- —widening of the ship’s lane in the bend (m).
- —turning angle (course change) on a bend (°);
- V—vessel speed (m/s);
- F—a coefficient of 1 for one-way traffic, 2 for two-way traffic;
- R—radius of the arc in the bend (m);
- s—the minimum required visibility from the ship’s bridge ≥2446 m (m);
- kz—the ship’s steering coefficient (1—poor, 2—good, and 3—very good).
- —directional error of the ship’s bow position at the confidence level [m];
- —directional error in determining the vessel’s position (observer’s position) at the confidence level [m];
- —error in determining the ship’s course in a bend, confidence level [°].
4.1. Vessel and Area Parameters
- (1)
- Maximum vessel: Bulk carrier: Lc = 230 m, B = 36.0 m, T = 11.0 m
- (2)
- Under keel clearance: ∆ = 1.5 m
- (3)
- Maximum vessel speed limit: V ≤ 8 knots
- (4)
- Tug assistance: none
- (5)
- Permissible hydrometeorological conditions: Time of day: no limits
- (1)
- Navigation system used: Good visibility:
- (a)
- day
- (b)
- PNS
- (c)
- Terrestrial
- (2)
- Good visibility:
- (a)
- night
- (b)
- PNS
- (c)
- Terrestrial
- (3)
- Restricted visibility:
- (a)
- Z < 2 Mm
- (b)
- PNS
- (c)
- Radar
- (1)
- positioning method: terrestrial based on lateral navigation marks;
- (2)
- day;
- (3)
- good visibility Z > 2 NM.
- (1)
- d1—vessel speed = 8 kn;
- (2)
- d2—prevailing transverse wind = 0 kn;
- (3)
- d3—prevailing transverse current = 0 kn;
- (4)
- d4—prevailing longitudinal current = 1 kn;
- (5)
- d5—height and length of the significant wave, hW = 1.0 m, λW = 50.0 m;
- (6)
- d7—type of bottom = soft;
- (7)
- d8—the ratio of the depth to the draft of the vessel h/T = 1.136;
- (1)
- r (m)—distance between beacons;
- (2)
- x (m)—distance to the closest beacon;
- (3)
- h (m)—depth of the water area;
- (4)
- type of the coast: dredged.
- dmp = 1.5 B (good steerability) = 54.00 m;
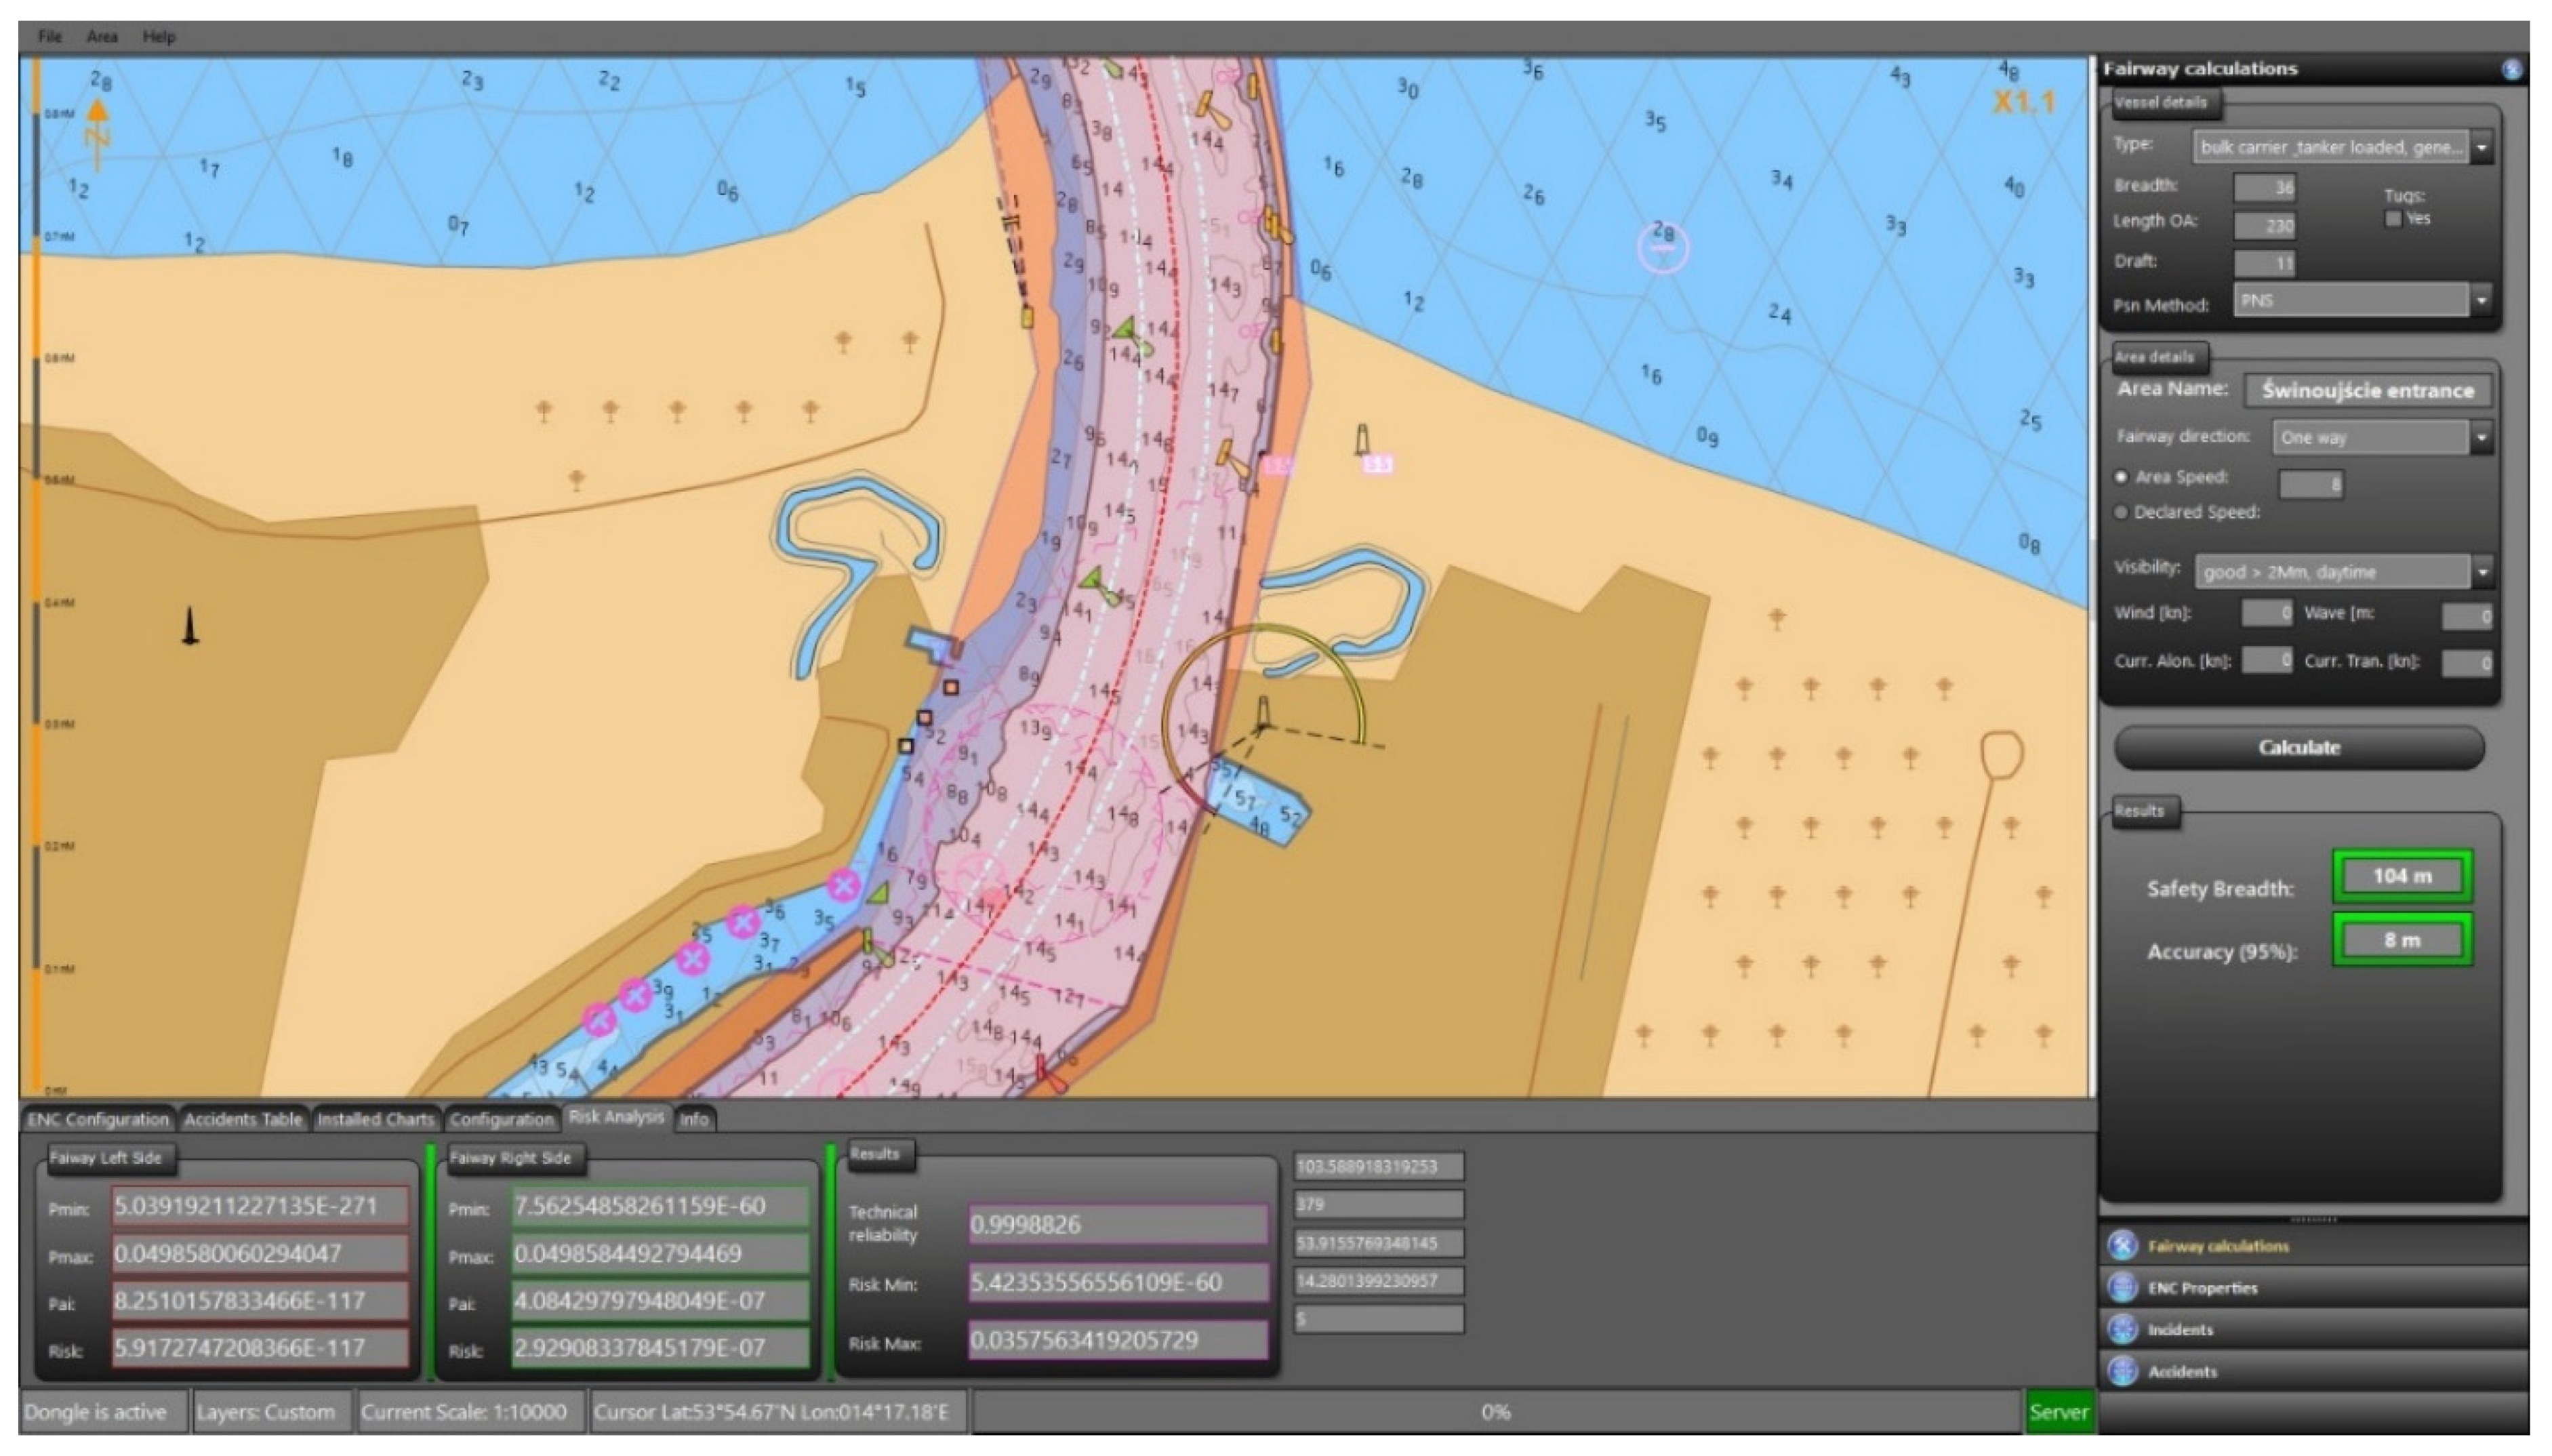
4.2. Implementation of the Algorithm of the Deterministic-Probabilistic Method in NEPTUN Application
- (1)
- type of vessel and its breadth, length, and draft;
- (2)
- section of the waterway (choosing directly from the digital chart by clicking the left mouse button);
- (3)
- visibility;
- (4)
- positioning system and its options;
- (5)
- allowed vessel speed;
- (6)
- wind and current parameters.
- (1)
- underwater clearance;
- (2)
- minimum width of the fairway section for the given input parameters;
- (3)
- fairway width correction for accuracy;
- (4)
- fairway width correction for the used positioning systems (PNS, radar, terrestrial);
- (5)
- corrected width of the fairway section for the given input parameters at the confidence level set or confidence level achieved via the risk assessment.
4.3. Research Results of Determining the Width of the Fairway by INSMS “NEPTUN” Application
5. Discussion
- (1)
- accepted confidence level (acceptable risk);
- (2)
- traffic intensity;
- (3)
- water parameters;
- (4)
- parameters of the manoeuvre being performed.
- (1)
- bulk carriers and container ships (L = 220 m, B = 32.3 m, and T = 11.00 m);
- (2)
- passenger cruisers (L = 260 m, B = 33.0 m, and T = 9.00 m).
- (1)
- for the straight sections, d = 110 m;
- (2)
- for the transitional sections, d = 130 m (min. 250 m before or after the turn);
- (3)
- for the turns, d = 150 m.
6. Conclusions
Author Contributions
Funding
Institutional Review Board Statement
Informed Consent Statement
Data Availability Statement
Conflicts of Interest
References
- DNV-GL. Recommended Practice: Efficient Updating of Risk Assessments, DNVGL-RP-G107. 2016. Available online: https://oilgas.standards.dnvgl.com/download/dnvgl-rp-g107-efficient-updating-of-risk-assessments (accessed on 5 April 2021).
- Ohtsu, K.; Yoshimura, Y.; Hirano, M.; Tsugane, M.; Takahashi, H. Design standard for fairway in next generation, Asia Navigation Conference 26. Navigation 2006, 165. [Google Scholar] [CrossRef]
- Gucma, S.; Zalewski, P. Optimization of fairway design parameters: Systematic approach to manoeuvring safety. Int. J. Nav. Arch. Ocean Eng. 2020, 12, 129–145. [Google Scholar] [CrossRef]
- Gil, M.; Montewka, J.; Krata, P.; Hinz, T.; Hirdaris, S. Determination of the dynamic critical maneuvering area in an encounter between two vessels: Operation with negligible environmental disruption. Ocean Eng. 2020, 213, 107709. [Google Scholar] [CrossRef]
- Fernández-Muñiz, B.; Montes-Peón, J.M.; Vázquez-Ordás, C.J. Safety management system: Development and validation of a multidimensional scale. J. Loss Prev. Process. Ind. 2007, 20, 52–68. [Google Scholar] [CrossRef]
- Bottani, E.; Monica, L.; Vignali, G. Safety management systems: Performance differences between adopters and non-adopters. Saf. Sci. 2009, 47, 155–162. [Google Scholar] [CrossRef]
- Silverleaf, A. Marine Traffic Engineering: An Introduction to Marine Traffic Engineering. J. Navig. 1972, 25, 379–380. [Google Scholar] [CrossRef]
- PIANC. Approach Channels. In A. Guide for Designs. PTC II-30, Final Report for the Joint Working Group PIANC and IAPH in Cooperation with IMPA and IALA, Supplement to Bulletin, no. 95.; PIANC: Brussels, Belgium, 1997. [Google Scholar]
- IMO. Revised Maritime Policy and Requirements for a Future Global Navigation Satellite System (GNSS). Res. A.915(22). IMO. 2001. Available online: https://www.imo.org/en/KnowledgeCentre/IndexofIMOResolutions/Pages/A-2001-03.aspx (accessed on 5 April 2021).
- Zalewski, P. Integrity Concept for Maritime Autonomous Surface Ships’ Position Sensors. Sensors 2020, 20, 2075. [Google Scholar] [CrossRef] [PubMed] [Green Version]
- Demichela, M.; Piccinini, N.; Romano, A. Risk analysis as a basis for safety management system. J. Loss Prev. Process. Ind. 2004, 17, 179–185. [Google Scholar] [CrossRef]
- Bai, Y.; Bai, Q. Subsea Pipeline Integrity and Risk Management; Elsevier BV: New York, NY, USA, 2014. [Google Scholar]
- Alises, A.; Molina, R.; Gómez, R.; Pery, P.; Castillo, C. Overtopping hazards to port activities: Application of a new methodology to risk management (POrt Risk MAnagement Tool). Reliab. Eng. Syst. Saf. 2014, 123, 8–20. [Google Scholar] [CrossRef]
- PIANC. PIANC Report N° 121, Maritime Navigation Commission: Harbour Approach Channels Design Guidelines, PI-ANC Secrétariat Général; PIANC: Bruxelles, Belgium, 2014. [Google Scholar]
- Del Estado, P. ROM 3.1-99, Design of the Maritime Configuration of Ports, Approach Channels and Harbour Basins; Spanish National Ports & Harbours Authority: Madrid, Spain, 2007. [Google Scholar]
- USACE. Coastal Engineering Manual—Part V, Chapter 5: Navigation Projects, EM 1110-2-1100; Department of the Army, US Army Corps of Engineers: Washington, DC, USA, 2008. [Google Scholar]
- Canadian Coast Guard. Safe Waterways (A Users Guide to the Design, Maintenance and Safe Use of Waterways), Part 1(a) Guidelines for the Safe Design of Commercial Shipping Channels; Waterways Development Division, Fisheries and Oceans Canada: Ottawa, ON, Canada, 2015. [Google Scholar]
- Buchler, D.; Lück, R.; Markert, M. Propulsion and control system for shallow water ships based on surface cutting double Propellers. In Proceedings of the IFAC Proceedings Volumes; Elsevier BV: New York, NY, USA, 2010; Volume 43, pp. 46–51. [Google Scholar]
- Illes, L.; Kalina, T.; Jurkovic, M.; Luptak, V. Distributed Propulsion Systems for Shallow Draft Vessels. J. Mar. Sci. Eng. 2020, 8, 667. [Google Scholar] [CrossRef]
- Raven, H. A new correction procedure for shallow-water effects in ship speed trials. In Proceedings of the 13th In-ternational Symposium on PRActical Design of Ships and Other Floating Structures PRADS ’2016, Copenhagen, Denmark, 4–8 September 2016. [Google Scholar]
- Rotteveel, E.; Hekkenberg, R.; van der Ploeg, A. Inland ship stern optimization in shallow water. Ocean Eng. 2017, 141, 555–569. [Google Scholar] [CrossRef]
- Lahtinen, J.; Banda, O.A.V.; Kujala, P.; Hirdaris, S. Remote piloting in an intelligent fairway—A paradigm for future pilotage. Saf. Sci. 2020, 130, 104889. [Google Scholar] [CrossRef]
- Zhang, M.; Montewka, J.; Manderbacka, T.; Kujala, P.; Hirdaris, S. A Big Data Analytics Method for the Evaluation of Ship - Ship Collision Risk reflecting Hydrometeorological Conditions. Reliab. Eng. Syst. Saf. 2021, 213, 107674. [Google Scholar] [CrossRef]
- Gucma, S.; Zalewski, P. Deterministic-Probabilistic Method of Waterway Design Parameters Determination. Annu. Navig. 2012, 19, 19–30. [Google Scholar] [CrossRef]
- Diab, H.; Younes, R.; Lafon, P. Survey of research on the optimal design of sea harbours. Int. J. Nav. Arch. Ocean Eng. 2017, 9, 460–472. [Google Scholar] [CrossRef]
- Artyszuk, J.; Gralak, R.; Gucma, M.; Gucma, S.; Ślączka, W.; Zalewski, P. Optimization of waterway bend widths using computer simulation methods of ship movement. Sci. J. Marit. Univ. Szczec. 2006, 115–121. [Google Scholar] [CrossRef]


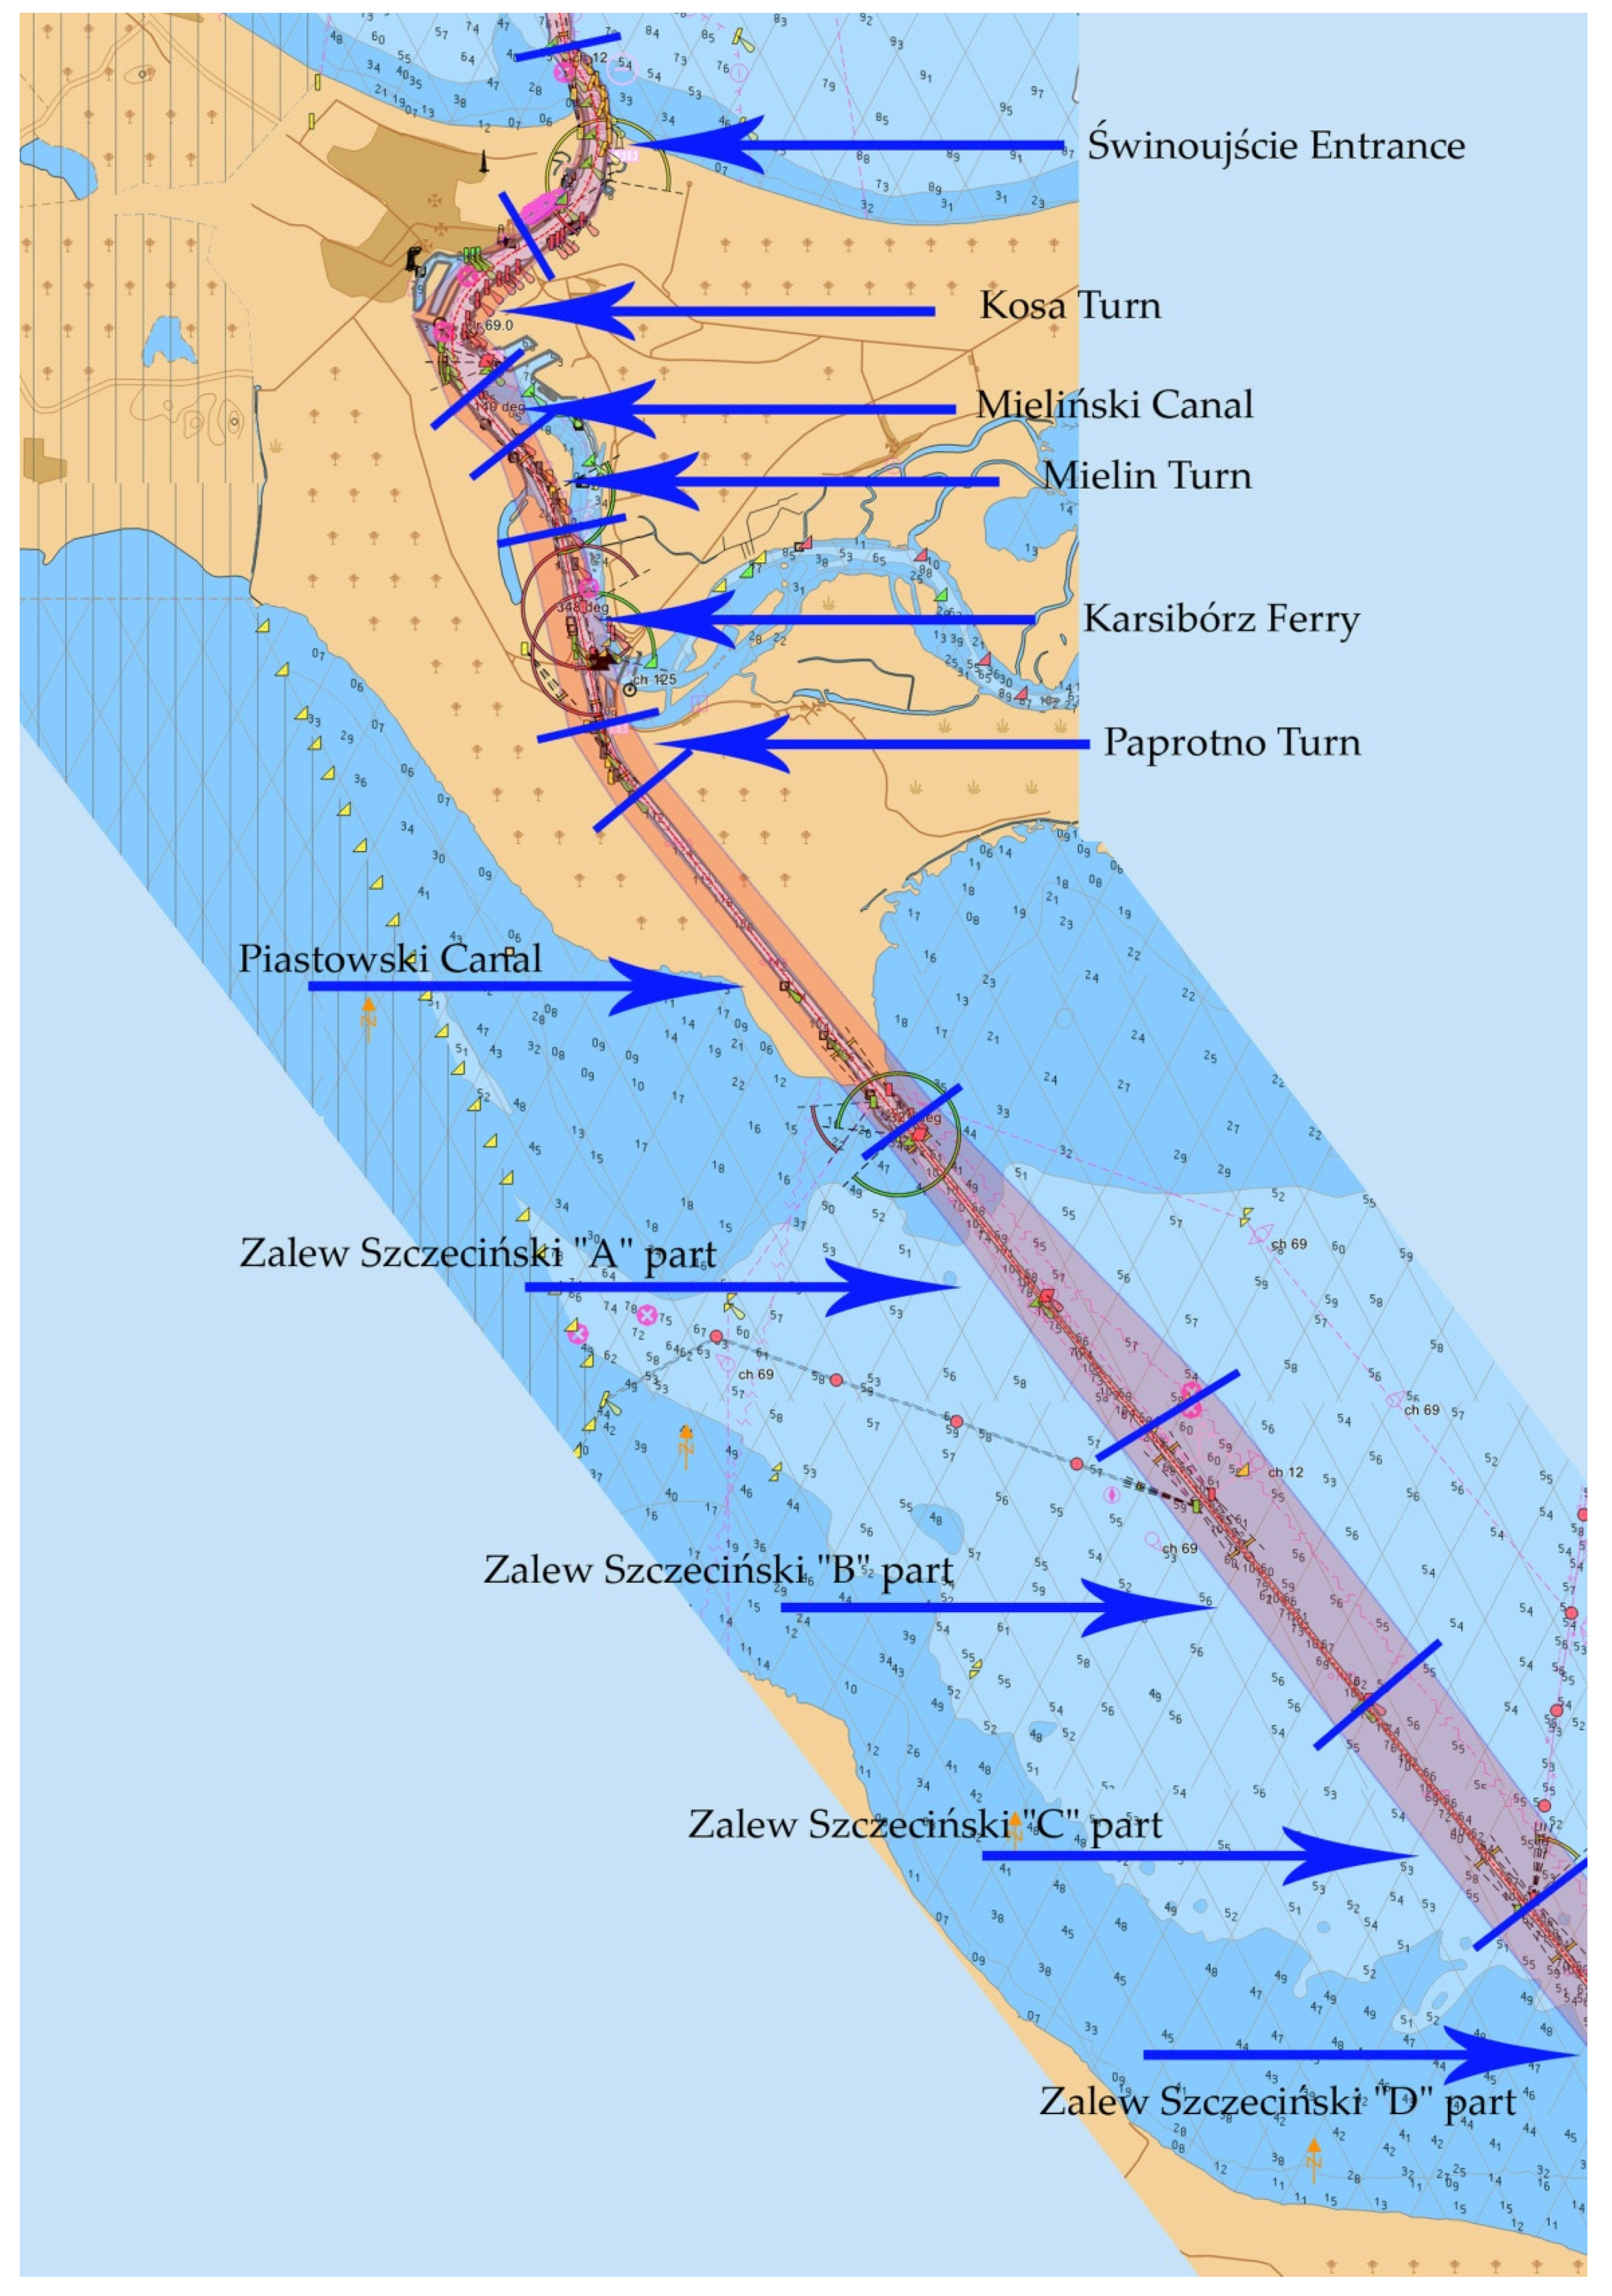
| Section No. | Name | Section Length [m] | Description |
|---|---|---|---|
| 1 | Świnoujście Entrance | 3200 | from 0.5 km north approaching the fairway to Świnoujście (A buoy) to 2.7 km Świnoujśćie–Szczecin fairway |
| 2 | Kosa Turn | 2700 | from 2.7 km to 5.4 km (Light on N Cape of Mielin Island) (entrance in Mielin S leading lights) |
| 3 | Mielieński Canal | 875 | from 5.4 km to 6.275 km (Lignt No1 on Mielieński Canal) (exit from Mielin S leading lights) |
| 4 | Mielin Turn | 1275 | from 6.275 km to 7.55 km (Light No4 on Mieleński Canal) (entrance in Mielin N-Paprotno leading lights) |
| 5 | Karsibórz Ferry | 2600 | from 7.55 km to 10.2 km (Light No1 Paprotno) (exit form Mielin N -Paprotno leading lights) |
| 6 | Paprotno Turn | 900 | from 10.15 km to 11.1 km Light on W coast of Piastowski Canal (entrance in Karsibórz leading lights) |
| 7 | Piastowski Canal | 5600 | from 11.1 km to 16.8 km (breakwater light at exit from Piastowski Canal) |
| 8 | Zalew Szczeciński “A” part | 5100 | from 16.8 km to 21.9 km (special buoy at BT II anchorage) |
| 9 | Zalew Szczeciński “B” part | 4600 | from 21.9 km to 26.45 km (pair of buoys no. 5/no. 6) |
| 10 | Zalew Szczeciński “C” part | 3400 | from 26.45 km to BT III |
| 11 | Zalew Szczeciński “D” part | 5700 | from BT III to 35.5 km (pair of buoys no. 9/no. 10) |
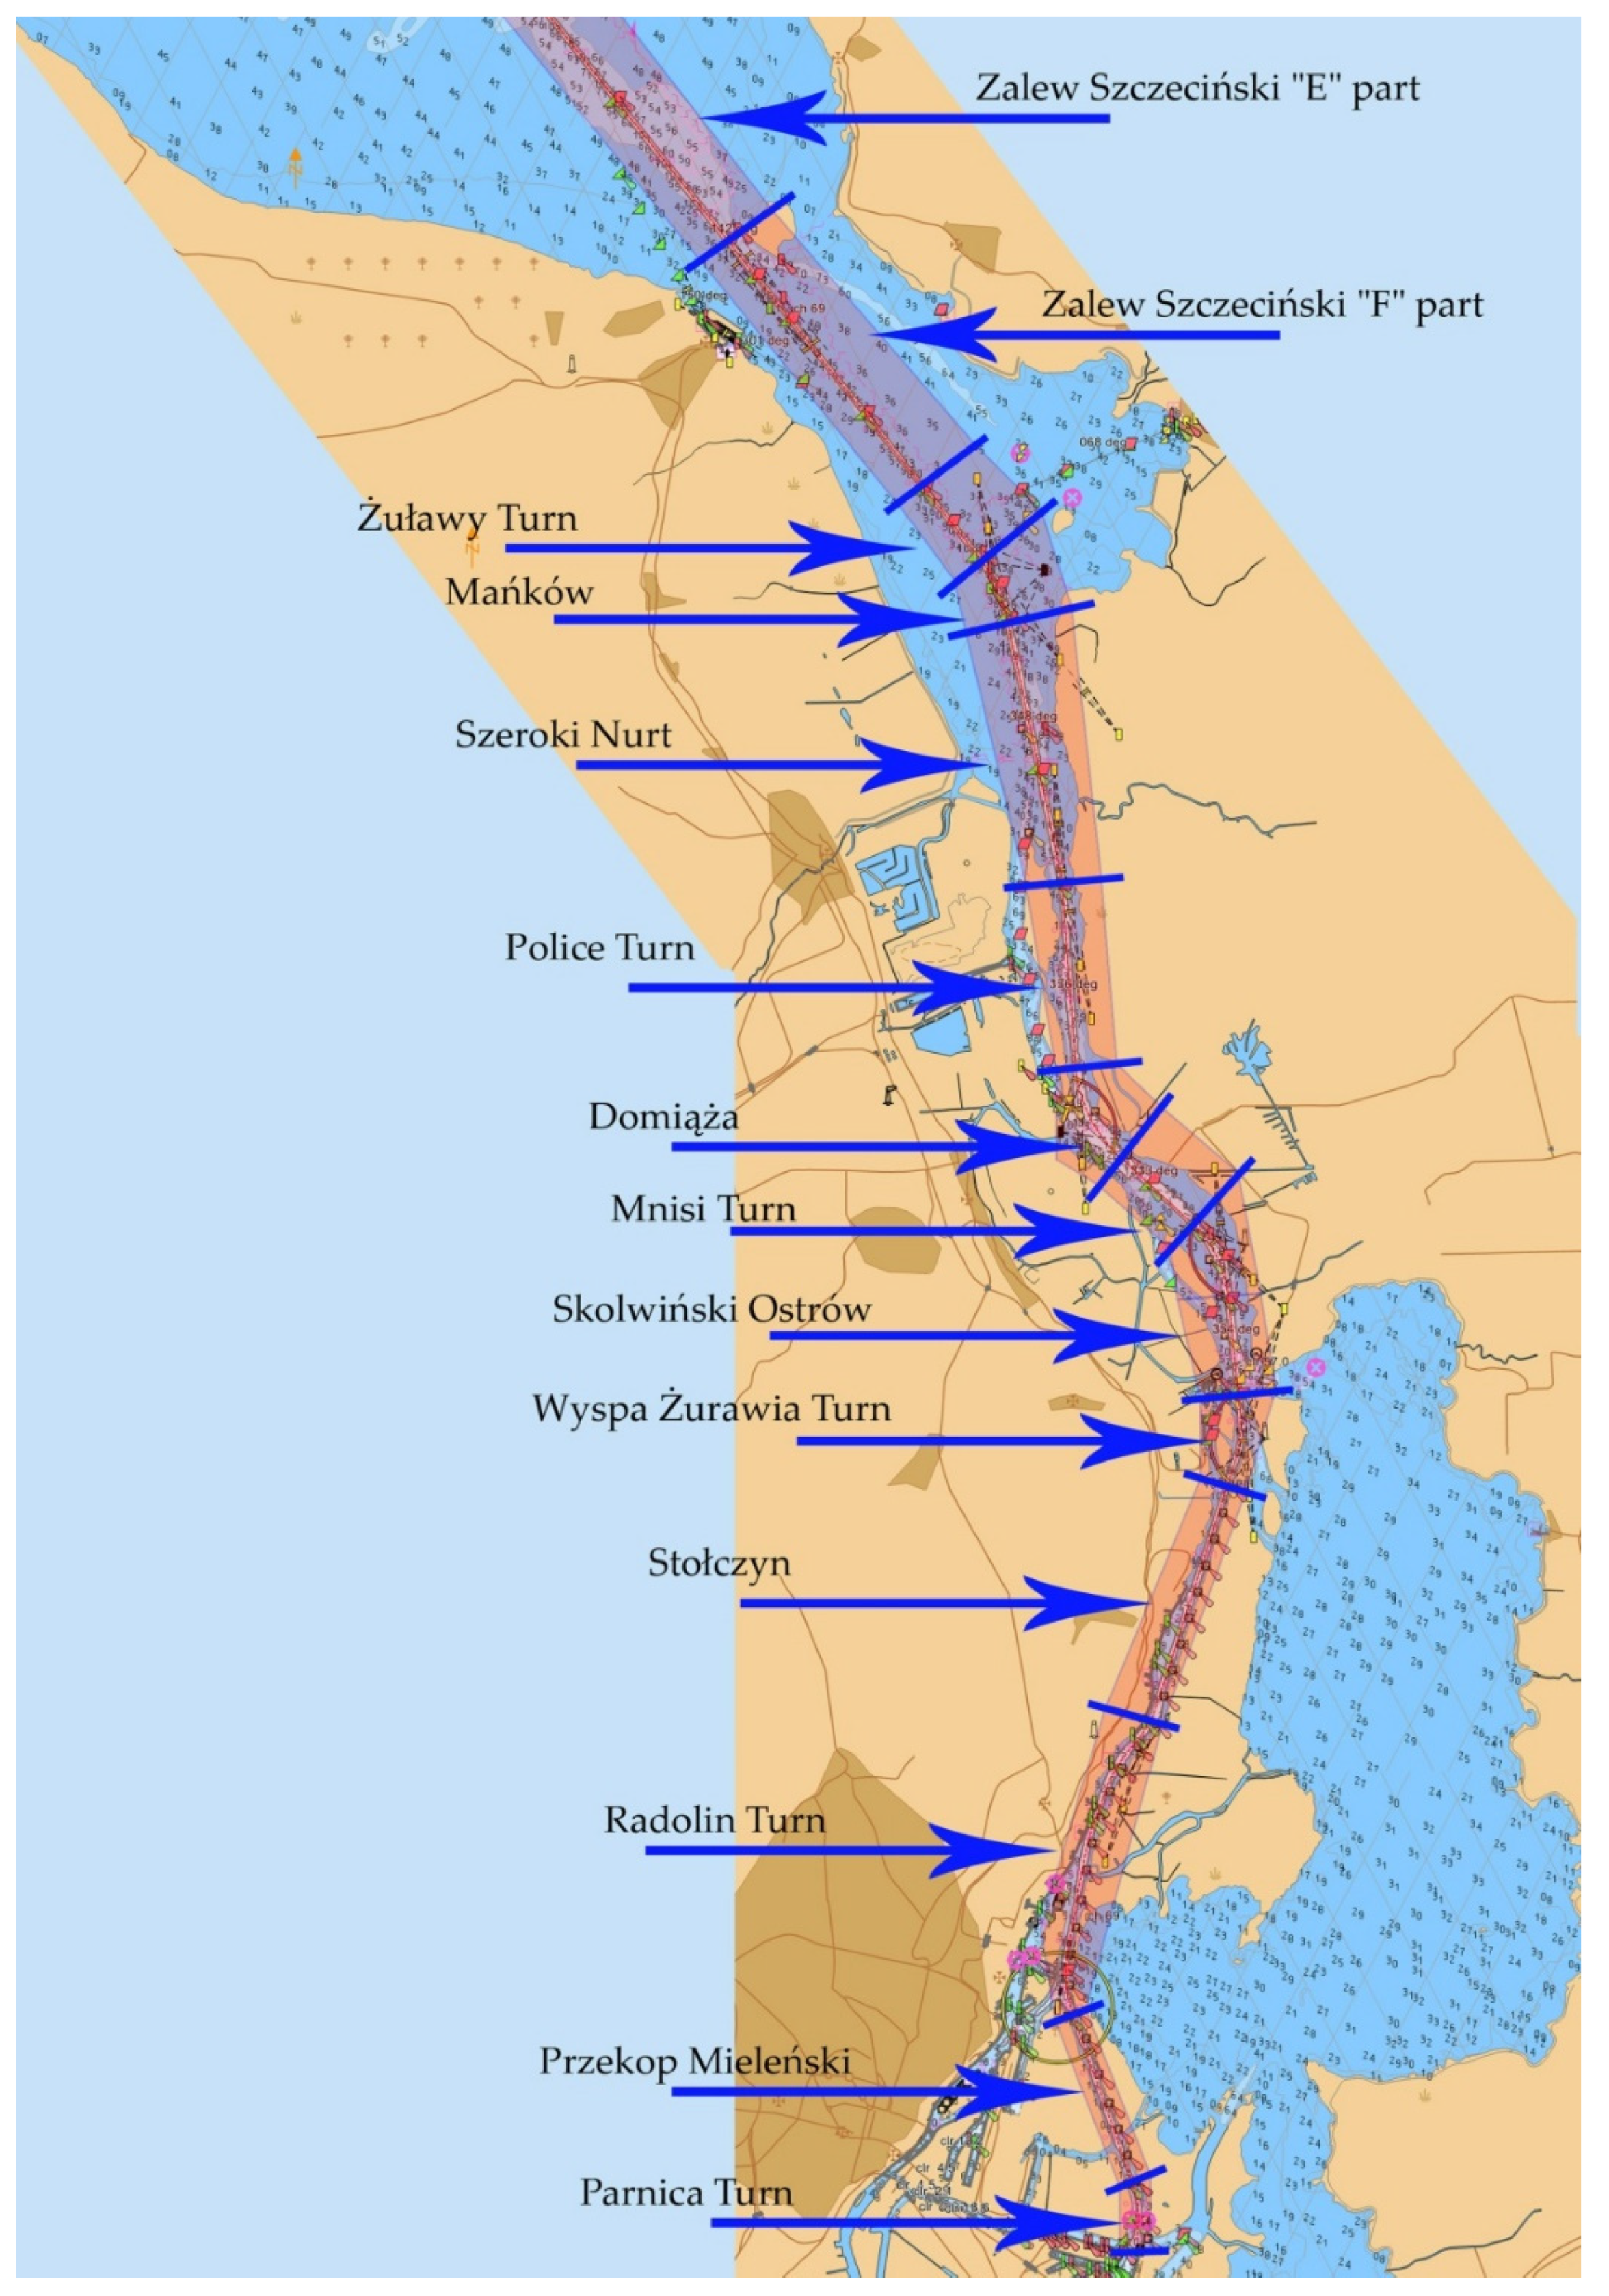
| 12 | Zalew Szczeciński “E” part | 4600 | from 35.5 km to 40.1 km (pair of buoys no. 17/no. 18) |
| 13 | Zalew Szczeciński “F” part | 1250 | from 40.1 km to 41.36 km (pair of buoy no. 19/beacon no. 20) (exit from Mańków leading lights) |
| 14 | Żuławy Turn | 1040 | from 41.36 km to 42.4 km (buoy no. 23 / beacon no. 24). (entrance in Stepnica-Raduń leading lights) |
| 15 | Mańków | 3900 | from 42.4 km to 46.3 km (buoys 33 /34) (transition from Stepnica-Raduń leading lights to Krępa-Domańce leading lights) |
| 16 | Szeroki Nurt | 2700 | from 46.3 km to 49 km (exit from Krępa/Domańce leading lights) |
| 17 | Police Turn | 1500 | from 49 km to 50.5 km (dolphin no. 36) (entrance in Police/Ina leading lights) |
| 18 | Domiąża | 1500 | from 50.5 km to 51.956 km (buoy no. 39/dolphin no. 40) |
| 19 | Mnisi Turn | 1200 | from 51.956 km to 53.2 km (buoy no. 43/dolphin no. 44) (entrance in Łąki/Bykowo leading lights) |
| 20 | Skolwiński Ostrów | 1400 | from 53.23 km to 54.6 km (North dolphin at Żurawia Island) (exit form Łąki/Bykowo leading lights) |
| 21 | Wyspa Żurawia Turn | 1400 | from 54.6 km to 56.0 km (dolphin no. 48) (entrance in Ina S/Święta leading lights) |
| 22 | Stołczyn | 3600 | from 56.0 km to 59.6 km (dolphin no. 66) (exit form Ina S/Święta leading lights) |
| 23 | Radolin Turn | 4500 | from 59.6 km to 64.1 km (pair of dolphins no. 87/88) |
| 24 | Przekop Mieleński | 2700 | from 64.1 km to 66.8 km (pair of dolphins no. 99/100) |
| 25 | Parnica Turn | 700 | from 66.8 km to 67.5 km (dolphin no. 104) |
| Type of Correction | Vessel Speed (kn) | Outer Channel (Open Water) | Inner Channel (Protected Water) | |
|---|---|---|---|---|
| d1 | Vessel speed (kn, through the water): | |||
| V > 12 | 0.1 B | 0.1 B | ||
| V = 8–12 | 0.0 | 0.0 | ||
| V = 5–8 | 0.0 | 0.0 | ||
| d2 | Prevailing cross wind (kn): | |||
| light ≤ 15 kn (≤Beaufort 4) | V > 12 kn V = 8–12 kn V = 5–8 kn | 0.1 B 0.2 B 0.3 B | 0.1 B 0.2 B 0.3 B | |
| moderate 15–33 kn (Beaufort 4–7) | V > 12 kn V = 8–12 kn V = 5–8 kn | 0.3 B 0.4 B 0.6 B | 0.3 B 0.4 B 0.6 B | |
| strong 33–48 kn (Beaufort 7–9) | V > 12 kn V = 8–12 kn V = 5–8 kn | 0.5 B 0.7 B 1.1 B | 0.5 B 0.7 B 1.1 B | |
| d3 | Prevailing cross current (kn): | |||
| negligible < 0.2 | all | 0.0 | 0.0 | |
| low 0.2–0.5 kn | V > 12 kn V = 8–12 kn V = 5–8 kn | 0.2 B 0.25 B 0.3 B | 0.1 B 0.2 B 0.3 B | |
| moderate 0.5–1.5 kn | V > 12 kn V = 8–12 kn V = 5–8 kn | 0.5 B 0.7 B 1.0 B | 0.4 B 0.6 B 0.8 B | |
| strong 1.5–2.0 kn | V > 12 kn V = 8–12 kn V = 5–8 kn | 1.0 B 1.2 B 1.6 B | – – – | |
| d4 | Prevailing longitudinal current (kn): | |||
| low ≤ 1.5 kn | all | 0.0 | 0.0 | |
| moderate 1.5–3.0 kn | V > 12 kn V = 8–12 kn V = 5–8 kn | 0.0 0.1 B 0.2 B | – 0.1 B 0.2 B | |
| strong > 3.0 kn | V > 12 kn V = 8–12 kn V = 5–8 kn | 0.1 B 0.2 B 0.4 B | – 0.2 B 0.4 B | |
| d5 | Height (hF) and length (λF) of wave (m): | |||
| hF ≤ 1 m; λF ≤ L | all | 0.0 | 0.0 | |
| 3 m > hF > 1 m; λF = L | V > 12 kn V = 8–12 kn V = 5–8 kn | 2.0 B 1.0 B 0.5 B | ||
| hF > 3 m; λF >L | V > 12 kn V = 8–12 kn V = 5–8 kn | 3.0 B 2.2 B 1.5 B | ||
| d7 | Bottom surface: | |||
| soft (mud. clay) | 0.0 | 0.0 | ||
| medium (sand. gravel) | 0.1 B | 0.2 B | ||
| rough (stones. rocks) | 0.2 B | 0.4 B | ||
| d8 | Depth to draft ratio: | |||
| 0.0 | 0.0 | |||
| 0.1 B | 0.2 B | |||
| 0.2 B | 0.4 B | |||
| Type of the Slope | Vessel Speed (kn) | Outer Channel (dr) | Inner Channel (dr) |
|---|---|---|---|
| Gentle underwater channel slope (1:10 or less steep) | V > 12 kn | 0.2 B | 0.2 B |
| V = 8–12 kn | 0.1 B | 0.1 B | |
| V = 5–8 kn | 0.0 B | 0.0 B | |
| Sloping channel edges and shoals | V > 12 kn | 0.7 B | 0.7 B |
| V = 8–12 kn | 0.5 B | 0.5 B | |
| V = 5–8 kn | 0.3 B | 0.3 B | |
| Steep and hard embankments, structures | V > 12 kn | 1.3 B | 1.3 B |
| V = 8–12 kn | 1.0 B | 1.0 B | |
| V = 5–8 kn | 0.5 B | 0.5 B |
| Straight Part of Fairway | r (m) | D (m) |
|---|---|---|
| Świnoujście Entrance | 3200.0 | 121.26 |
| Mieliński Canal | 875.0 | 120.14 |
| Karsibórz Ferry | 2650.0 | 120.89 |
| Piastowski Canal | 5700.0 | 123.60 |
| Zalew Szczeciński “A” part | 5100.0 | 122.96 |
| Zalew Szczeciński “B” part | 4550.0 | 122.41 |
| Zalew Szczeciński “C” part | 3400.0 | 121.42 |
| Zalew Szczeciński “D” part | 5650.0 | 123.55 |
| Zalew Szczeciński “E” part | 4600.0 | 122.46 |
| Zalew Szczeciński “F” part | 1260.0 | 120.24 |
| Mańków | 3900.0 | 121.82 |
| Szeroki Nurt | 2700.0 | 120.93 |
| Domiąża | 1456.0 | 120.31 |
| Skolwiński Ostrów | 1400.0 | 120.29 |
| Stołczyn | 3600.0 | 121.57 |
| Przekop Mieleński | 2700.0 | 120.93 |
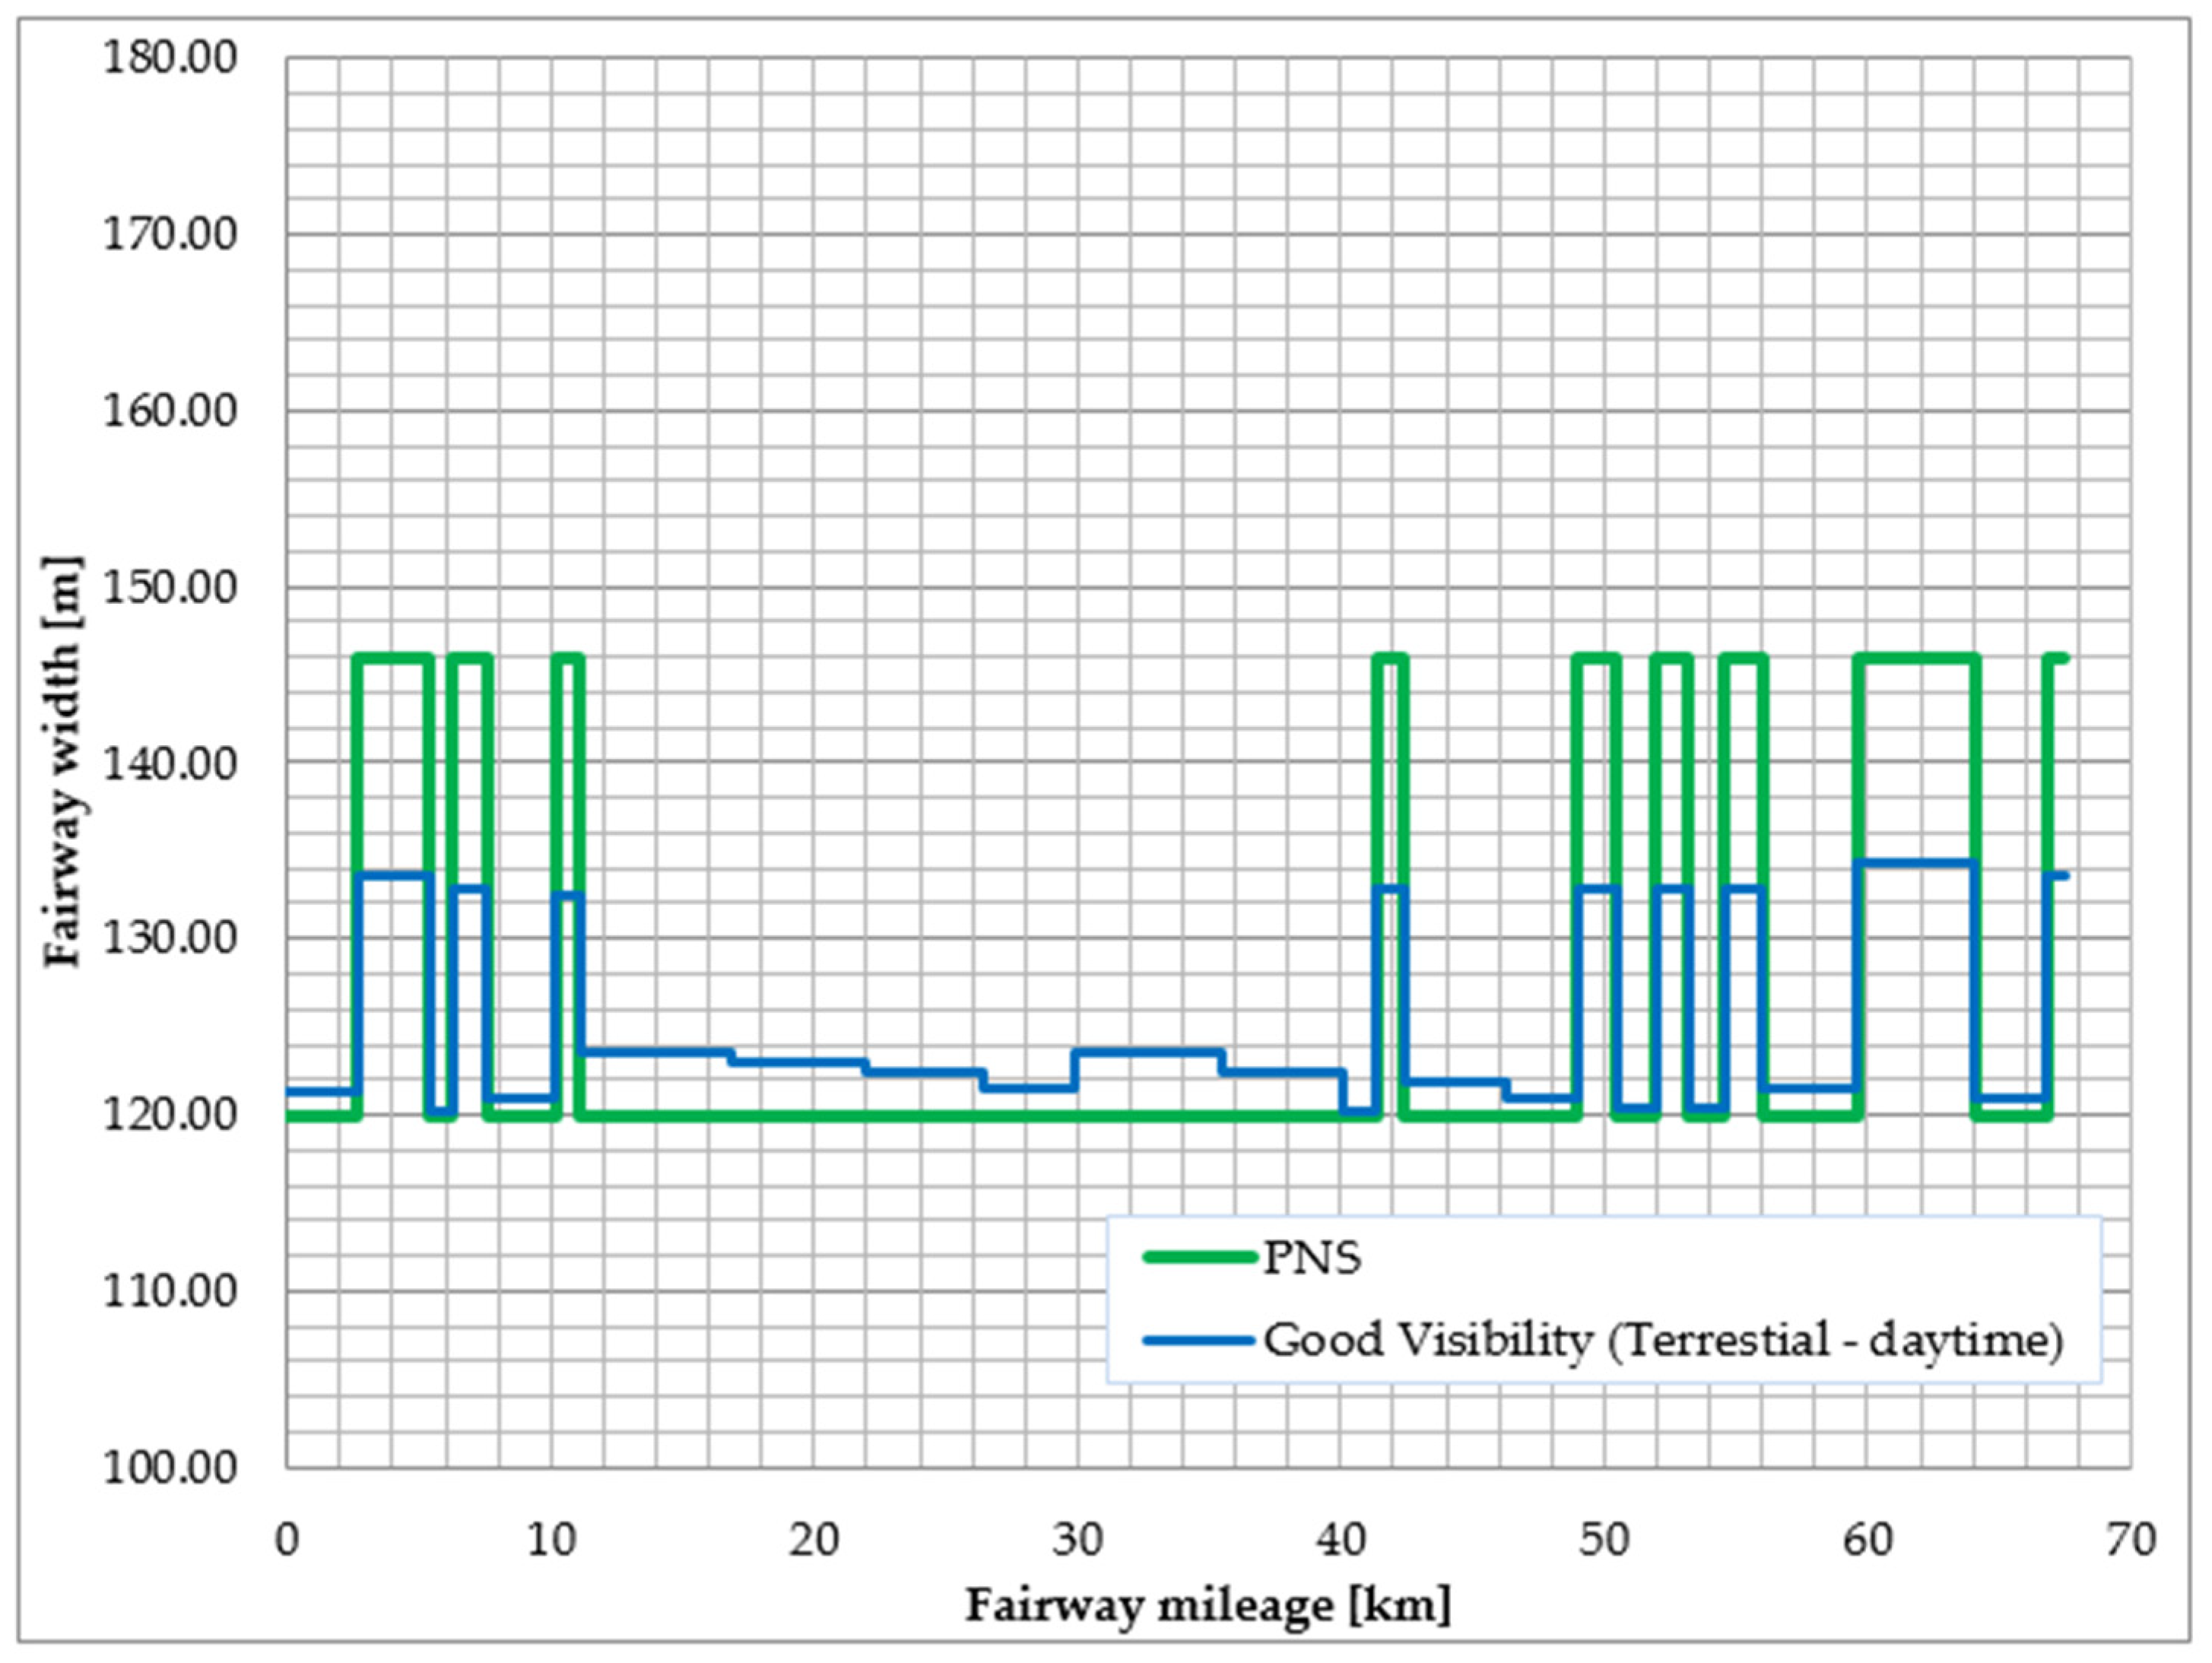
| Fairway Section | Beginning of Section (km) | PNS | Restricted Visibility (Radar—Daytime) | Good Visibility (Terrestrial—Daytime) | Good Visibility (Terrestrial—Night) | Fairway Widths |
|---|---|---|---|---|---|---|
| Świnoujście Entrance | −0.5 | 120.00 | 158.03 | 121.26 | 121.91 | 150 |
| Kosa Turn | 2.7 | 146.00 | 159.62 | 133.54 | 133.61 | 150 |
| Mieliński Canal | 5.4 | 120.00 | 145.08 | 120.14 | 120.19 | 150 |
| Mielin Turn | 6.275 | 146.00 | 152.48 | 132.82 | 132.86 | 150 |
| Karsibórz Ferry | 7.55 | 120.00 | 154.94 | 120.89 | 121.35 | 150 |
| Paprotno Turn | 10.2 | 146.00 | 150.67 | 132.53 | 132.55 | 150 |
| Piastowski Canal | 11.1 | 120.00 | 172.20 | 123.60 | 125.28 | 110 |
| Zalew Szczeciński “A” part | 16.8 | 120.00 | 168.78 | 122.96 | 124.37 | 110 |
| Zalew Szczeciński “B” part | 21.9 | 120.00 | 165.66 | 122.41 | 123.59 | 110 |
| Zalew Szczeciński “C” part | 26.45 | 120.00 | 159.16 | 121.42 | 122.13 | 110 |
| Zalew Szczeciński “D” part | 29.85 | 120.00 | 171.91 | 123.55 | 125.21 | 110 |
| Zalew Szczeciński “E” part | 35.5 | 120.00 | 165.95 | 122.46 | 123.66 | 110 |
| Zalew Szczeciński “F” part | 40.1 | 120.00 | 147.20 | 120.24 | 120.35 | 110 |
| Żuławy Turn | 41.36 | 146.00 | 151.34 | 132.82 | 132.86 | 150 |
| Mańków | 42.4 | 120.00 | 161.98 | 121.82 | 122.73 | 150 |
| Szeroki Nurt | 46.3 | 120.00 | 155.22 | 120.93 | 121.40 | 150 |
| Police Turn | 49 | 146.00 | 153.58 | 132.82 | 132.86 | 150 |
| Domiąża | 50.5 | 120.00 | 148.29 | 120.31 | 120.45 | 110 |
| Mnisi Turn | 51.956 | 146.00 | 152.33 | 132.82 | 132.86 | 150 |
| Skolwiński Ostrów | 53.2 | 120.00 | 147.98 | 120.29 | 120.42 | 110 |
| Wyspa Żurawia Turn | 54.6 | 146.00 | 153.09 | 132.82 | 132.86 | 150 |
| Stołczyn | 56 | 120.00 | 160.29 | 121.57 | 122.36 | 110 |
| Radolin Turn | 59.6 | 146.00 | 169.05 | 134.24 | 134.34 | 150 |
| Przekop Mieleński | 64.1 | 120.00 | 155.22 | 120.93 | 121.40 | 110 |
| Parnica Turn | 66.8 | 146.00 | 157.08 | 133.54 | 133.61 | 150 |
| Fairway Section | Beginning of Section (km) | Good Visibility (PNS—Daytime) | Fairway Widths |
|---|---|---|---|
| Świnoujście Entrance | −0.5 | 120.00 | 150 |
| Kosa Turn | 2.7 | 146.00 | 150 |
| Mieliński Canal | 5.4 | 120.00 | 150 |
| Mielin Turn | 6.275 | 146.00 | 150 |
| Karsibórz Ferry | 7.55 | 120.00 | 150 |
| Paprotno Turn | 10.2 | 146.00 | 150 |
| Piastowski Canal | 11.1 | 120.00 | 110 |
| Zalew Szczeciński “A” part | 16.8 | 120.00 | 110 |
| Zalew Szczeciński “B” part | 21.9 | 120.00 | 110 |
| Zalew Szczeciński “C” part | 26.45 | 120.00 | 110 |
| Zalew Szczeciński “D” part | 29.85 | 120.00 | 110 |
| Zalew Szczeciński “E” part | 35.5 | 120.00 | 110 |
| Zalew Szczeciński “F” part | 40.1 | 120.00 | 110 |
| Żuławy Turn | 41.36 | 146.00 | 150 |
| Mańków | 42.4 | 120.00 | 150 |
| Szeroki Nurt | 46.3 | 120.00 | 150 |
| Police Turn | 49 | 146.00 | 150 |
| Domiąża | 50.5 | 120.00 | 110 |
| Mnisi Turn | 51.956 | 146.00 | 150 |
| Skolwiński Ostrów | 53.2 | 120.00 | 110 |
| Wyspa Żurawia Turn | 54.6 | 146.00 | 150 |
| Stołczyn | 56 | 120.00 | 110 |
| Radolin Turn | 59.6 | 146.00 | 150 |
| Przekop Mieleński | 64.1 | 120.00 | 110 |
| Parnica Turn | 66.8 | 146.00 | 150 |
Publisher’s Note: MDPI stays neutral with regard to jurisdictional claims in published maps and institutional affiliations. |
© 2021 by the authors. Licensee MDPI, Basel, Switzerland. This article is an open access article distributed under the terms and conditions of the Creative Commons Attribution (CC BY) license (https://creativecommons.org/licenses/by/4.0/).
Share and Cite
Bąk, A.; Zalewski, P. Determination of the Waterway Parameters as a Component of Safety Management System. Appl. Sci. 2021, 11, 4456. https://doi.org/10.3390/app11104456
Bąk A, Zalewski P. Determination of the Waterway Parameters as a Component of Safety Management System. Applied Sciences. 2021; 11(10):4456. https://doi.org/10.3390/app11104456
Chicago/Turabian StyleBąk, Andrzej, and Paweł Zalewski. 2021. "Determination of the Waterway Parameters as a Component of Safety Management System" Applied Sciences 11, no. 10: 4456. https://doi.org/10.3390/app11104456