Article

Application of Machine Learning Algorithms to Predict the Effectiveness of Radial Jet Drilling Technology in Various Geological Conditions

1
Petroleum Geology Department, Perm National Research Polytechnic University, Perm 614990, Russia
2
LUKOIL-Engineering Limited PermNIPIneft Branch Office in Perm, Perm 614990, Russia
3
Mining and Oil Faculty, Perm National Research Polytechnic University, Perm 614990, Russia
4
Oil and Gas Engineering Department, Perm National Research Polytechnic University, Perm 614990, Russia
*
Author to whom correspondence should be addressed.
Appl. Sci. 2021, 11(10), 4487; https://doi.org/10.3390/app11104487
Submission received: 19 April 2021 / Revised: 7 May 2021 / Accepted: 11 May 2021 / Published: 14 May 2021
(This article belongs to the Section Earth Sciences)

Abstract

:
This study presents a methodological approach to forecasting the efficiency of radial drilling technology under various geological and physical conditions. The approach is based upon the integration of mathematical statistical methods and building machine learning models to forecast the liquid production rate increment, as well as to forecast technological indexes using a hydrodynamic model. This paper reviewed the global practice of radial drilling and well intervention efficiency modeling. The efficiency of the technology in question was analyzed on the oil deposits of the Perm Territory. Mathematical statistical methods were used to determine the geological and technological parameters of the efficient technology use. Based on the determined parameters, machine learning models were built, allowing us to forecast the oil and liquid production rate. A script was developed to integrate machine learning methods into a hydrodynamic simulator. When the method was tested, the deviations in the difference between the actual and the forecast cumulative oil production did not exceed 10%, which proves the reliability of the method. At the same time, the hydrodynamic model allows for taking into account the mutual influence of oil wells, the dynamics of water cut, and reservoir pressure.

1. Introduction

Many oil fields around the world face the growth of residual hard-to-extract oil deposits. Conditions such as the reduction of oil recovery efficiency, the growth of zones not covered with the water-oil displacement process, and a complex geological structure require specific geological and technical operations. However, the operations are not equally efficient and sometimes are not economically feasible. The search for technologies for the increasing of oil production efficiency, involving distant oil-saturated areas into production, reducing costs of hard-to-extract oil recovery, and increasing the current technology efficiency is one of the main priorities of the oil industry. The affordable and efficient technology of radial jet drilling (RJD) has been used globally, allowing for the recovery of non-drainable reserves by making highly-permeable channels up to 100 m long [1,2,3].
The analysis of the technology use reveals the variability of its efficiency under different geological and physical conditions. There is still no reliable tool for assessing the technology efficiency depending on the geological, physical, and technological properties of the oil site.
The RJD technology was developed by Rad Tech International Inc, which completed the first trials on oil sites in the late 1970s. At the depth of the pay zone, a whipstock is installed. An opening is cut through in the casing string into which a coil tubing and a high-pressure hose with a hydraulic motor are pulled. The liquid is supplied to the jet nozzle through the flexible hose under high pressure (up to 100 MPa) [1,2]. A distinctive feature of the nozzle is its blasting and reactive canals. The liquid impact occurs in front of the nozzle, and the reactive canals push the nozzle from behind with liquid jets. Due to the water jet impact, a permeable channel is formed [1,2]. After drilling, the radial canals are washed with acid liquids to eliminate contamination and to additionally increase canal permeability [1,3,4].
The study [5] describes the process and results of radial jet drilling at some fields for improved oil production. At the Tarim oil field in China, the oil production rate was increased significantly by 200%.
Cinelli and Kamel (2013) carried out a survey RJD at the Donelson West oil field (the reservoir consists of limestone). Research showed that the monthly recovery oil rate increased from 197 barrels before radial drilling to 1100 barrels per month after RJD [5].
Abdel-Ghany et al. 2011 described experiments of the application of radial jet drilling technology on three oil wells in Egypt (Belaym oil field), where there was a decrease in oil production and at one of the three experimental oil wells, no oil production rate increase was achieved. The reason was the poorly cemented sandstone and the canal colmation. This demonstrates one of the disadvantages of radial drilling since it is not recommended for use in unconsolidated sandstone [6,7].
Deepak Jain et al. [8] describe the experimental use of RJD at Oil India Limited (OIL) to recover oil from a low-permeability reservoir with a high recovery rate near the well bore, by means of reinforced stimulation, in order to stimulate the oil selection. Research shows that the conditions for the successful use of the technology are: shorter time of stimulation with pumped liquids; presence of a thick oil-saturated reservoir; radial canals that stretch beyond the mined zone, involving the non-covered interlayers into production; good reservoir energy.
Ahmed Kamel [9] assesses the application of RJD in different reservoir conditions. It may be noted that the greatest production increments are typical for low-permeability reservoirs with four radial canals. Comparing the production rate increment depending on the quantity and length of canals and the reservoir permeability, it can be concluded that the greatest effect is achieved at low permeability of the reservoir, four canals, and with a canal length of 300 feet (91 m).
The study [10] describes the use of radial drilling in Egypt. The technology was used in two oil wells for stimulating oil production in a carbonate reservoir. In the first well, the oil production rate increased from 220 to 289 barrels per day, and in the second well, it grew from 465 to 686 barrels per day.
The papers [9,10,11,12] note that RJD is most efficient for high-viscosity oil that frequently forms stagnant zones in the low-permeability parts of the reservoirs.
The study [13] analyzes the efficiency of using the radial jet drilling technology at the D1 site of the Vakhitovskoe oil field (Russia). The success of the radial jet drilling was assessed as 75%. The technology increased the oil production rate by 1.5 to 5 times.
Ilyushin P.Y. et al. [14] show the average annual efficiency indexes of well stimulation during the recent years in the Perm Territory. According to which the efficiency changed from 38 to 48% for acid treatment, from 38 to 49% for hydraulic formation fracturing, ND from 42 to 78% for RJD. The effect of the drilling was assessed as the achievement of the planned production rate [1].
According to the research data [15], RJD can be regarded as the main alternative to extra small-radius sidetracks.
In the articles [16,17,18], statistical methods were applied to compare RJD, acid treatment, and re-perforation in the Perm Territory. Radial jet drilling was more effective for the oil production rate increment.
From the literature, it was noted that the radial drilling technology is a global practice, but the actual data that the previous studies are based upon appear insufficient, therefore, the influence of the geological and physical properties of the reservoir on the efficiency of the technology has not been properly studied. The accumulated experience of using the technology at the Perm Territory oil fields (Russia) allows for the use of statistical methods and machine learning methods for the analysis.

2. Materials and Methods

During the study, an analysis of the efficiency of radial formation drilling technology at the Perm Territory oil fields was carried out. It is important to note that the effect of radial jet drilling is different in various geological conditions. To identify the dominant properties of the reservoir and technological parameters, the methods of mathematical statistics were used—t-test, Pearson’s criterion, and linear discriminant analysis. On the basis of the dominant parameters, models of neural networks and support vector machines are constructed for regression tasks. A program has been developed that allows for the combination of machine learning models and the reservoir simulator (Tempest More). A retrospective analysis was carried out to validate the new approach.

2.1. Analysis of the Efficiency of Radial Jet Drilling Technology at the Perm Territory Oil Fields

At the oil fields of the Perm Territory, the RJD technology has been used since 2006. By now, to date, 648 RJD operations have been completed (Figure 1) [9].
The number of operations carried out on the carbonate reservoir (594) was much greater than that on the terrigenous one (54). The efficiency of the operations carried out on the carbonate reservoir was much higher than that on the terrigenous one. The average incremental oil production was 33,291 barrels per well at the carbonate sites, while at the terrigenous sites it was 25,880 barrels. For one-third of all the operations, the effect of RJD at the terrigenous sites lasts for less than one year, and in 15% of cases the oil production increment was less than 14.56 barrels. At the carbonate sites, the number of well interventions with the effect lasting for less than a year was 7%, while the number of failed interventions was only 1%.
The main reason for the high efficiency of the RJD technology at carbonate reservoirs is the additional hydrochloric acid treatment (HAT) which is much more efficient for carbonate rocks than for terrigenous ones. There are several possible reasons for the low efficiency of RJD at terrigenous sites, such as clay swelling, canal colmation, the Jamin effect, and low residual oil reserves at the moment of RJD. The technological characteristics of RJD and the variability of its efficiency create the need for detailed special research of the conditions for using the RJD technology on carbonate and terrigenous sites [1]. Due to the rare use and low efficiency of RJD at terrigenous reservoirs, this study will only elaborate on its use on carbonate reservoirs.
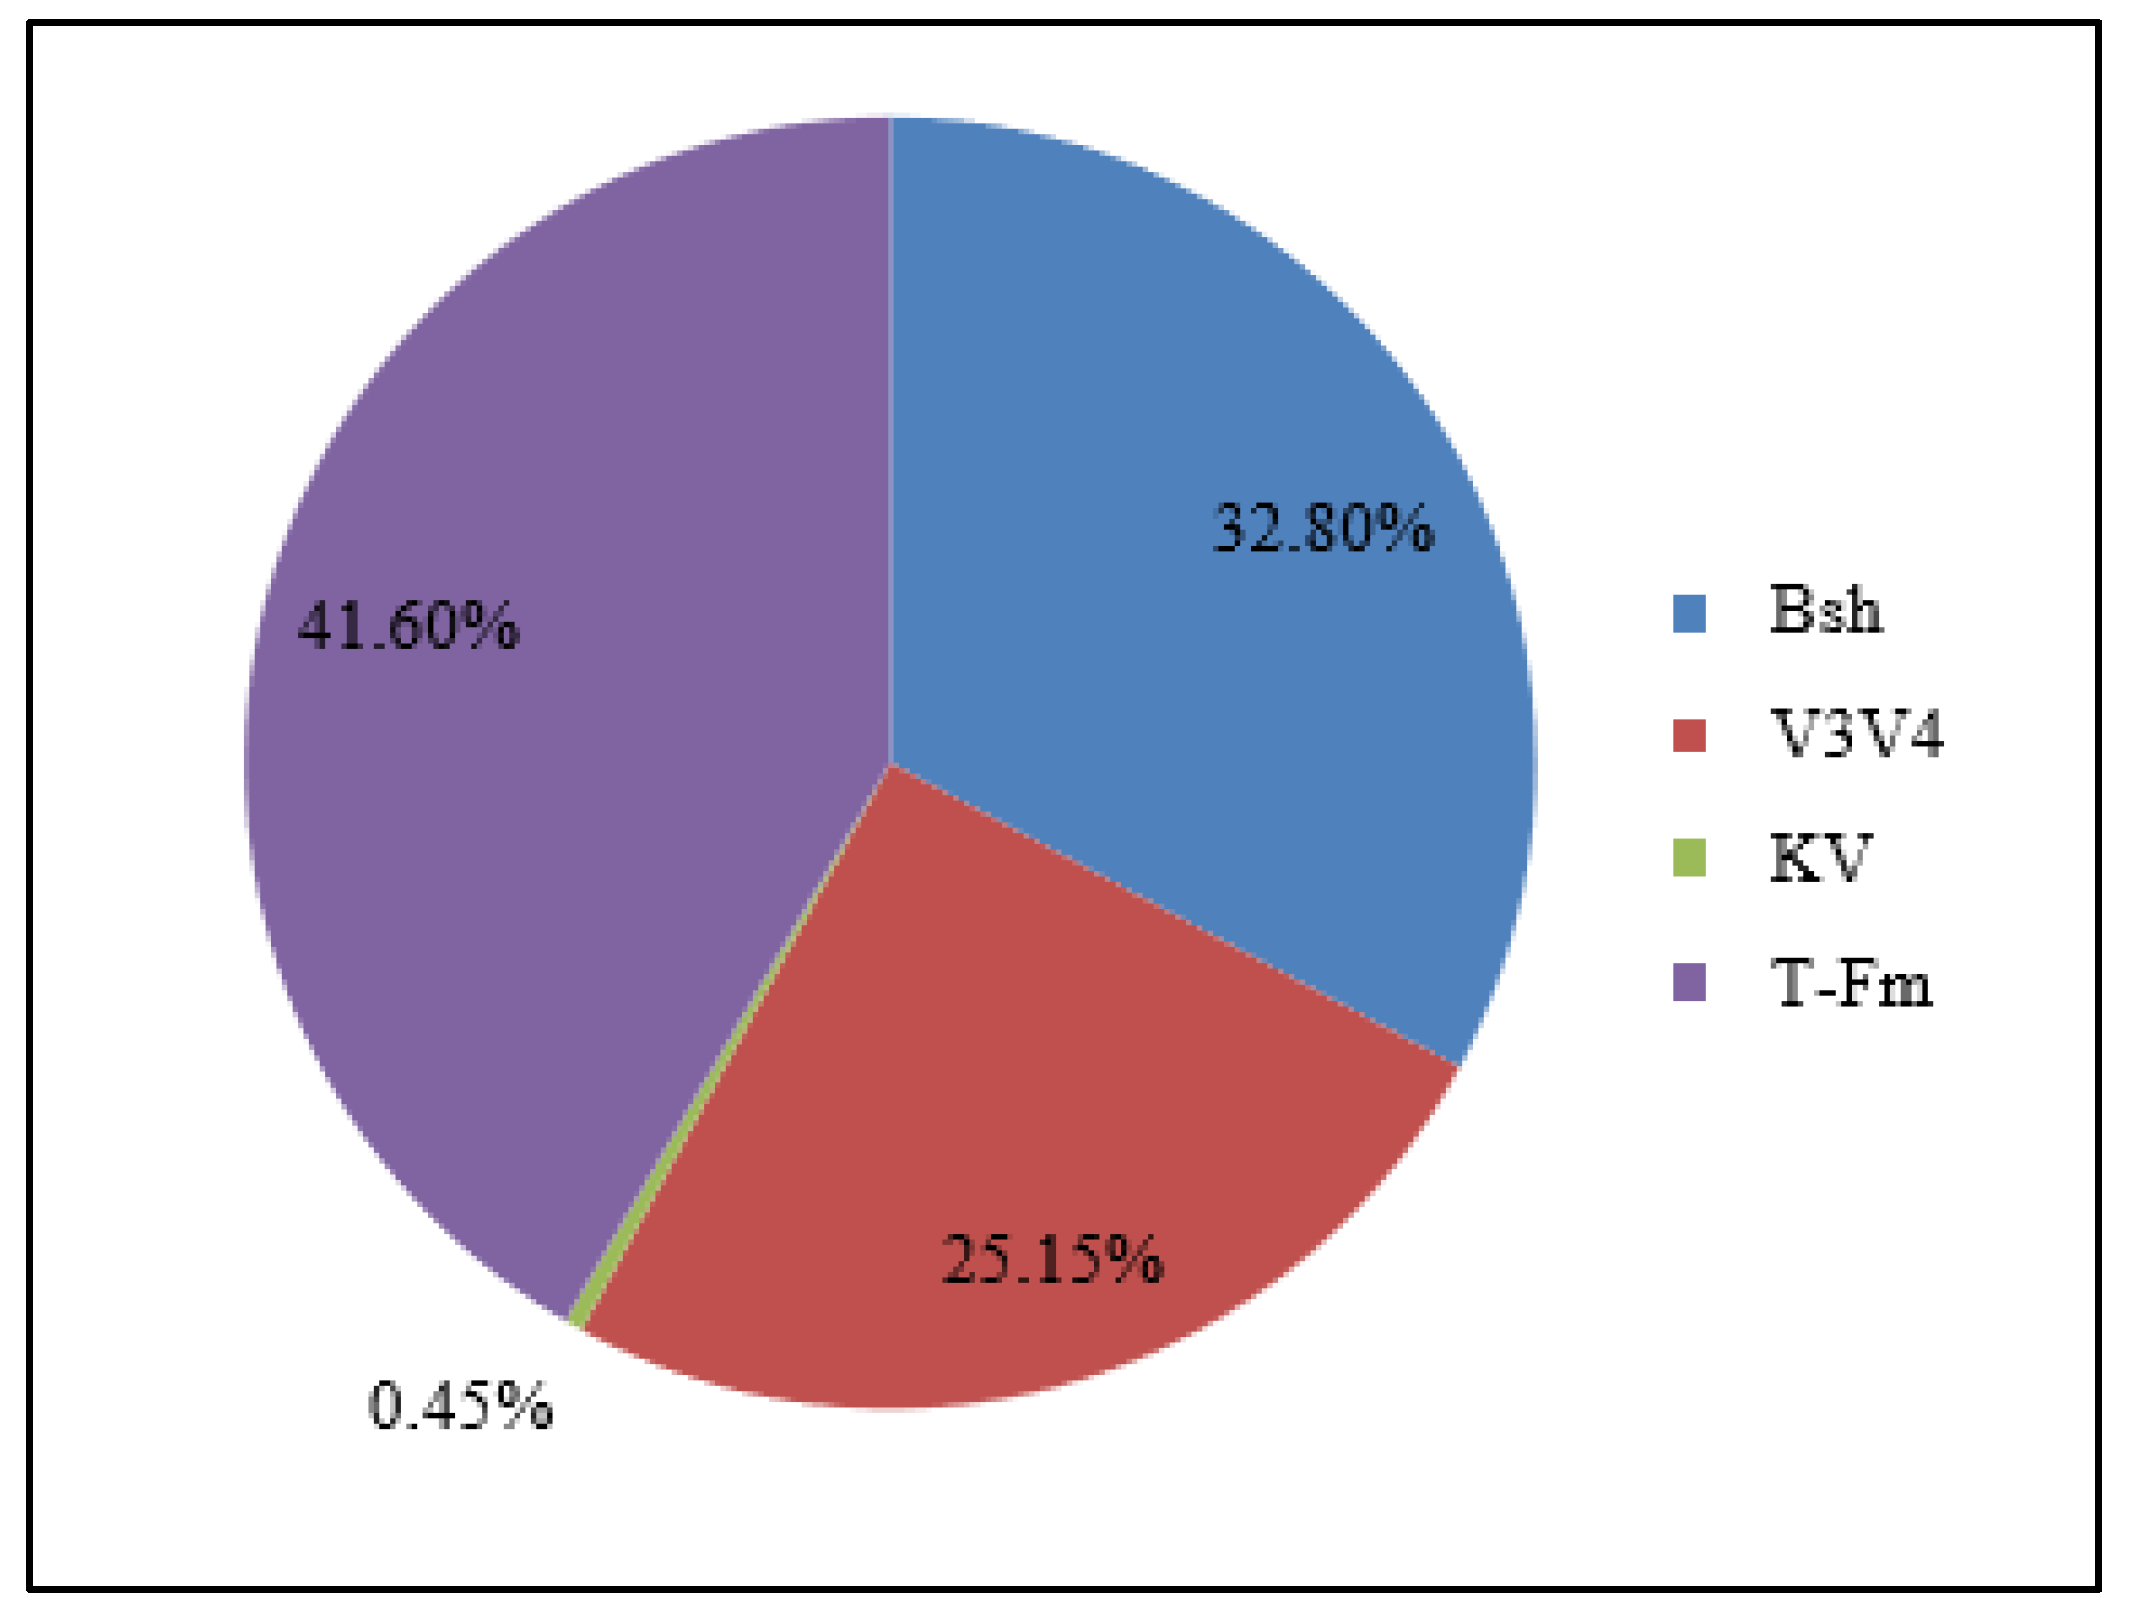
At carbonate sites, 590 RJD operations were carried out. Figure 2 shows the distribution of sites by the cumulative incremental oil production due to RJD.
The greatest amount of the incremental production was registered at the T-Fm sites (42%—8386 thousand barrels); a comparable amount was collected from the Bsh sites (33%—6610 thousand barrels); they are followed by the V3V4 sites (25%—5059 thousand barrels) and an insignificant contribution was made by the KV1 sites (0.5%—87 thousand barrels).
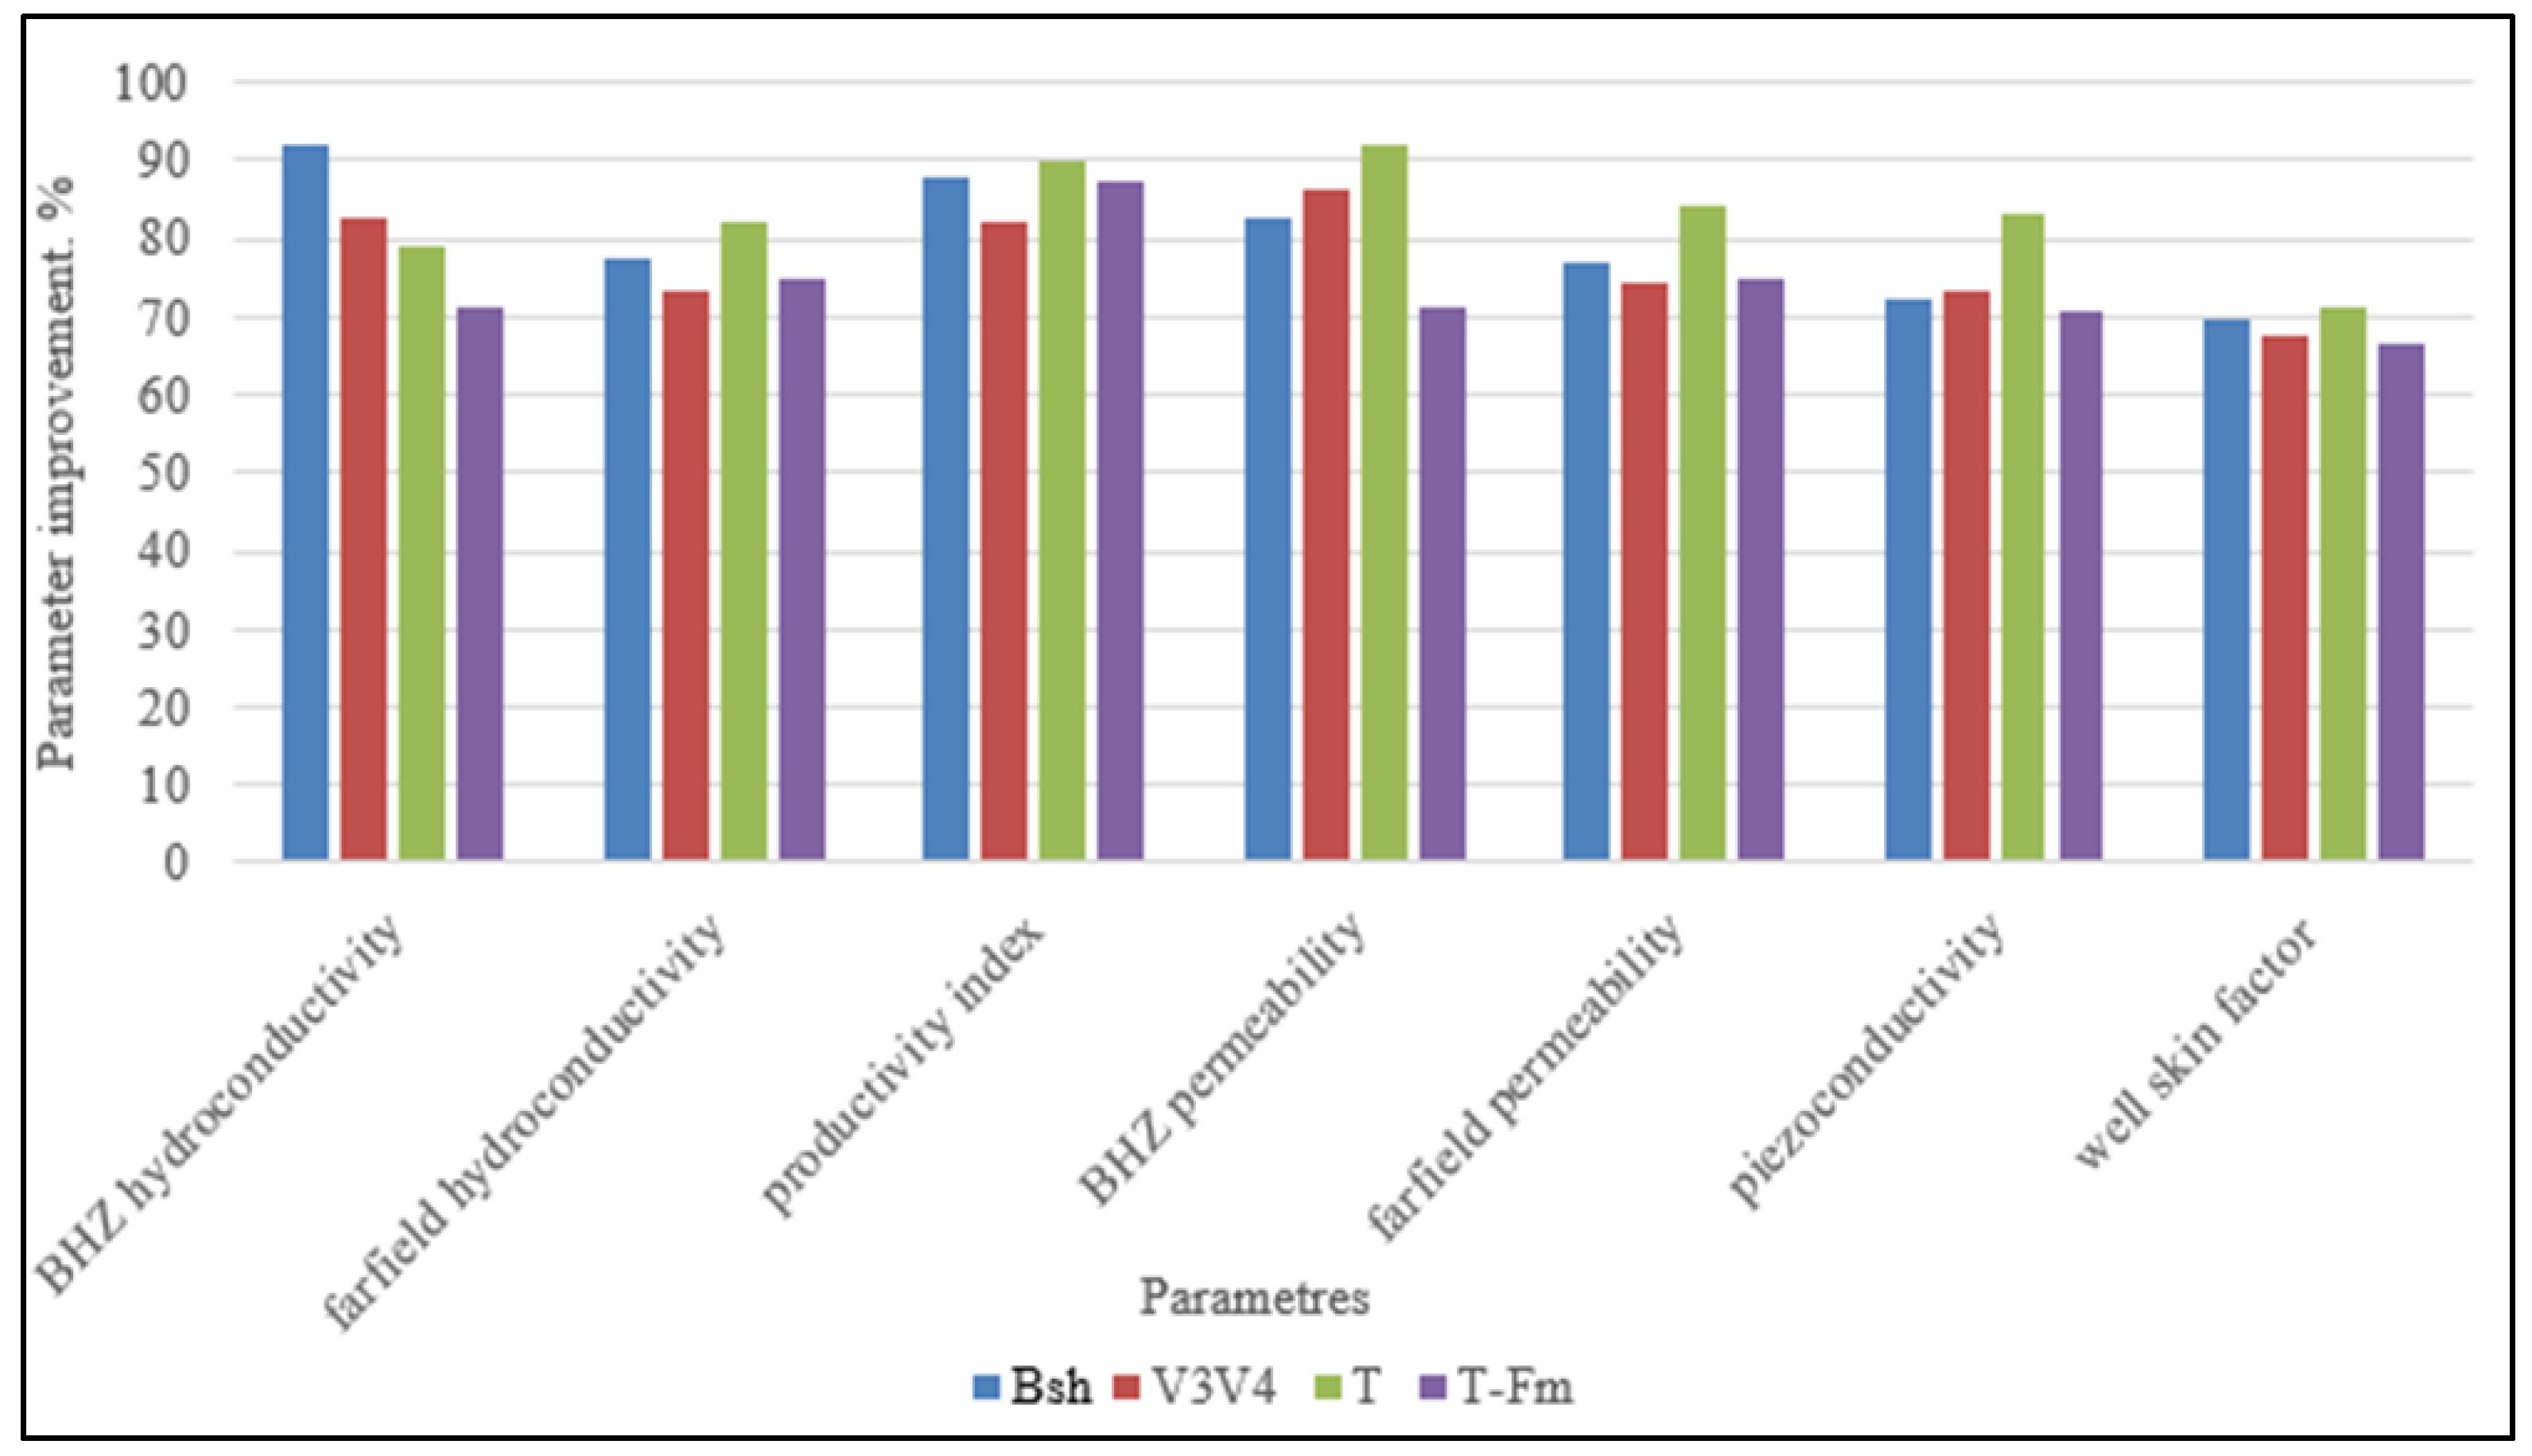
At the next stage, the results of well flow tests (WFTs) were analyzed. The WFTs were not carried out for all the wells, the study only covers the data for 417 wells before and after RJD. Figure 3 shows the success rate, i.e., the percentage of positive changes in the hydrodynamic properties of the reservoir.
The success rate of the parameter change varies from 70 to 92% (on average 80%) for all the parameters except for skin factor (success rate 67 to 71%).
In the last ten years, the RJD technology became one of the major technologies at the Perm Territory oil fields for wells with a decreasing productivity and a low production rate at the end of their service life. The technology efficiency varies depending on the geological and technological conditions, which requires a thorough approach to selecting candidate wells, in order to increase the general technological efficiency of the method.

2.2. Analysis of the Current RJD Efficiency Forecasting Methods

This paper analyzed the main existing methods used to forecast the effectiveness of well interventions: geological and industrial analysis, statistical analysis, machine learning methods, reservoir simulation (RS) [4,19,20].
In the geological and industrial analysis, the results are limited to the assessment of specific productivity coefficients, while the totality of geological and technological parameters are not taken into account. The detailed "manual" well assessment, based on geological and industrial analysis using analytical and statistical methods, is quite subjective and time-consuming [1].
The statistical analysis requires finding and analyzing “emissions”, which requires more time for data preparation. For this reason, in the last several years, forecasting based on machine learning methods has been developed, such as neural networks, decision trees, random forest algorithms, and cluster analysis. The main drawbacks of these methods are the absence of clear forecasting algorithms and physical proof, as well as low interpretability of final results.
When using RS, it is important to take into account the subjectivity of the well-intervention settings and adjustments, which can significantly affect the forecasting capacity of the model. Due to the time consumption and high cost of RS operations, they have to be used mainly for the development of high-cost well interventions (sidetracks, horizontal shafts) [19,21].
The leading research organizations are working on the development of methods for forecasting the oil and liquid production increment due to well intervention, using hydrodynamic and mathematical modeling technologies, machine learning methods, etc. The review of the previous studies revealed the need for a comprehensive assessment of geological and technological indexes and for increasing the reliability of well intervention efficiency assessment [2].

2.3. Brief Description of the Reservoirs

The objects of this study are the reservoirs of the Famenian, Turnesian, and Bashkirian age in the south-eastern territory of the Volga-Ural Province. The Famenian deposit rocks are accumulations of porous and cavernous reservoirs of the Solikamsk depression reef structures. The reservoir qualities of the Famenian deposits are mostly influenced by rock fissures. The Turnesian deposit reservoirs feature uneven geological sections and lesser thickness, therefore, lower well productivity [20,22,23]. The Bashkir reservoirs belong to the porous type; the porosity is created by intra-form and inter-form cavities. The best reservoir properties are found in biomorphic limestones with a foraminiferal structure; in certain interlayers, they acquire additional density due to secondary calcitation [22,23].

2.4. Assessing the Influence of the Geological and Physical Properties of the Reservoir on the RJD Efficiency

At the present moment, it is not clear which geological conditions provide the highest efficiency of the RJD technology. An important task is to determine the influence of geological and geophysical parameters on the RJD technology efficiency. This will allow for the selection of candidate wells based on scientific data. In order to determine the most significant factors, an integrated database was made for all the wells where RJD was performed and for the relevant parameters. The database included the parameters of the geological and physical reservoir properties (GPRP) used for calculating oil deposits; the results of HDT carried out before RJD; the results of the geophysical well survey interpretation (GWSIR). In total, 31 parameters for 590 wells in 40 oil fields were included [23,24]. Table 1 shows all parameters.
Table 2 demonstrates the results of t-test calculations for all wells. The values with a p-value under 0.05 (with the likelihood of differences in the compared data of over 95%) are highlighted in bold. It means that the studied parameter has a statistically relevant (not random) effect on the differences between the index values in the selected data sets. The values with a p-value ranging from 0.05 to 0.10 (also has some effect) are highlighted in italics. N1 and N2 mark the data selections for the first and the second group, respectively. R is the correlation coefficient between geological parameters and efficiency parameters. R was not high, but many parameters were significant at the p-level < 0.05, and for evaluating the influence of geological parameters on the efficiency parameters, in this case, we proposed the calculation of t-test between groups with different efficiencies. All the wells and the respective parameters were divided into two approximately even data sets selected by one of the efficiency indexes. Statistically irrelevant results were not included.
The t-test values were also calculated separately for different sites. During the research into the influence that these parameters have on the efficiency indexes, the following conclusions were made using the Student’s t-test [22,25,26]:
  • For the Fm site, the main influence on the efficiency is from the conductivity and permeability of the reservoir farfield, piezoconductivity, oil saturation, and oil-saturation thickness. At higher values of the said parameters, better efficiency of RJD should be expected. Moreover, if the bottom hole zone (BHZ) is deteriorated (positive skin factor value), the well intervention is more effective due to the use of the well potential during the BHZ cleaning.
  • In the wells operating the T reservoir, the greatest efficiency is achieved at the higher viscosity and density of the oil and higher energy potential of the reservoir (reservoir and bottom-hole pressure). Poor BHZ condition improves the efficiency of the technology.
  • For the Bsh site, the success of RJD was mostly due to the higher values of interval quantity, sand content and net pay reservoir thickness, the relatively contaminated BHZ (skin factor, BHZ permeability), the higher values of bottom-hole pressure, saturation pressure, piezoconductivity, BHZ, and farfield hydroconductivity, but the effect duration was longer with poorer oil viscosity and, consequently, poorer hydroconductivity.
  • For all the sites, there is the influence of the skin factor value, oil production rate before RJD, reservoir oil saturation, and reservoir energy (bottom-hole and reservoir pressures).

2.5. Development of the Integrated RJD Efficiency Forecasting Method

When doing a long-term forecast of the technological indexes, one should consider the mutual influence of the wells, the water intrusion rate, the reservoir pressure changes as well as the geological and technological operations taking place on other wells. The integrated method is designed to resolve the mentioned problems.
The method includes the following stages:
Stage 1. Forecasting the liquid production rate increment after RJD.
The technological efficiency of the RJD technology may be assessed with a number of methods: statistics, machine learning, or hydrodynamic modeling. However, only a hydrodynamic simulator allows for long-term forecasting of the technological indexes taking into account the mutual influence of the wells. There are two ways of forecasting with a hydrodynamic simulator: by setting the liquid withdrawal or the bottom hole pressure limits. In the authors’ practice, the method of setting the liquid rates is more common. For such estimation, it is necessary to know the changes of well operation mode after RJD to set the liquid production rate after RJD for the forecast period.
As a rule, it requires a geological analysis and calculation of the specific productivity factors that determine the production rate change after RJD [26]. The authors suggest forecasting the liquid production rate increment using machine learning methods and including these models into the hydrodynamic simulator.
To develop the machine learning models, it is necessary to reduce the number of variables, in other words, to select the most relevant parameters that influence the liquid production increment. To reduce the scale, linear discriminant analysis was used for finding the set of the parameters that influence particular values.
For the Bsh site, the linear discriminant function was as follows (1):
Z = 0.12 · h oil + 7.96 · N T G + 0.33 · P bh + 0.07 · μ + 0.16 · ε farfield + 0.03 · W 0.012 · S 6.08 ;   R = 0.71
The result of the linear discriminant function classification was mostly influenced by, in descending order: oil-saturated thickness, net-to-gross sand ratio, oil viscosity, farfield hydroconductivity, water cut, and skin factor.
When the linear discriminant analysis was used on the Bsh site, 31 of 33 (94%) objects with the relative liquid production increment of less than 5 times were correctly recognized, and 30 of 35 (86%) objects with the increment of more than 5 times were correctly recognized.
The reliability of the models is due to the high training dataset classification correctness rate (83 to 97%) and the high values of the canonical correlation coefficients (0.71–0.79).
For the T site, the linear discriminant function was as follows (2):
Z = 0.39 · q liq + 0.27 · P r e s 0.102 · h av + 0.26 · ϕ + 0.069 · S 6.48 ;   R = 0.79
For the T site, 28 of 33 (85%) objects with the relative liquid production increment of less than 4 times were correctly recognized and 31 of 32 (97%) objects with an increment rate of more than 4 times were correctly recognized.
For the Fm site, the linear discriminant function was as follows (3):
Z = 0.55 · q liq 0.102 · К comp + 0.65 · ϕ + 0.08 · ε farfield + 0.14 · P res 5.56 ; R = 0.78
For the Fm site, 10 of 12 (83%) objects with the relative liquid production increment of less than 6 times were correctly recognized and 11 of 12 (92%) objects with an increment rate more than 6 times were correctly recognized.
Based on the revealed parameters, the machine learning models were developed to allow for the forecasting of the liquid production rate after radial jet drilling.
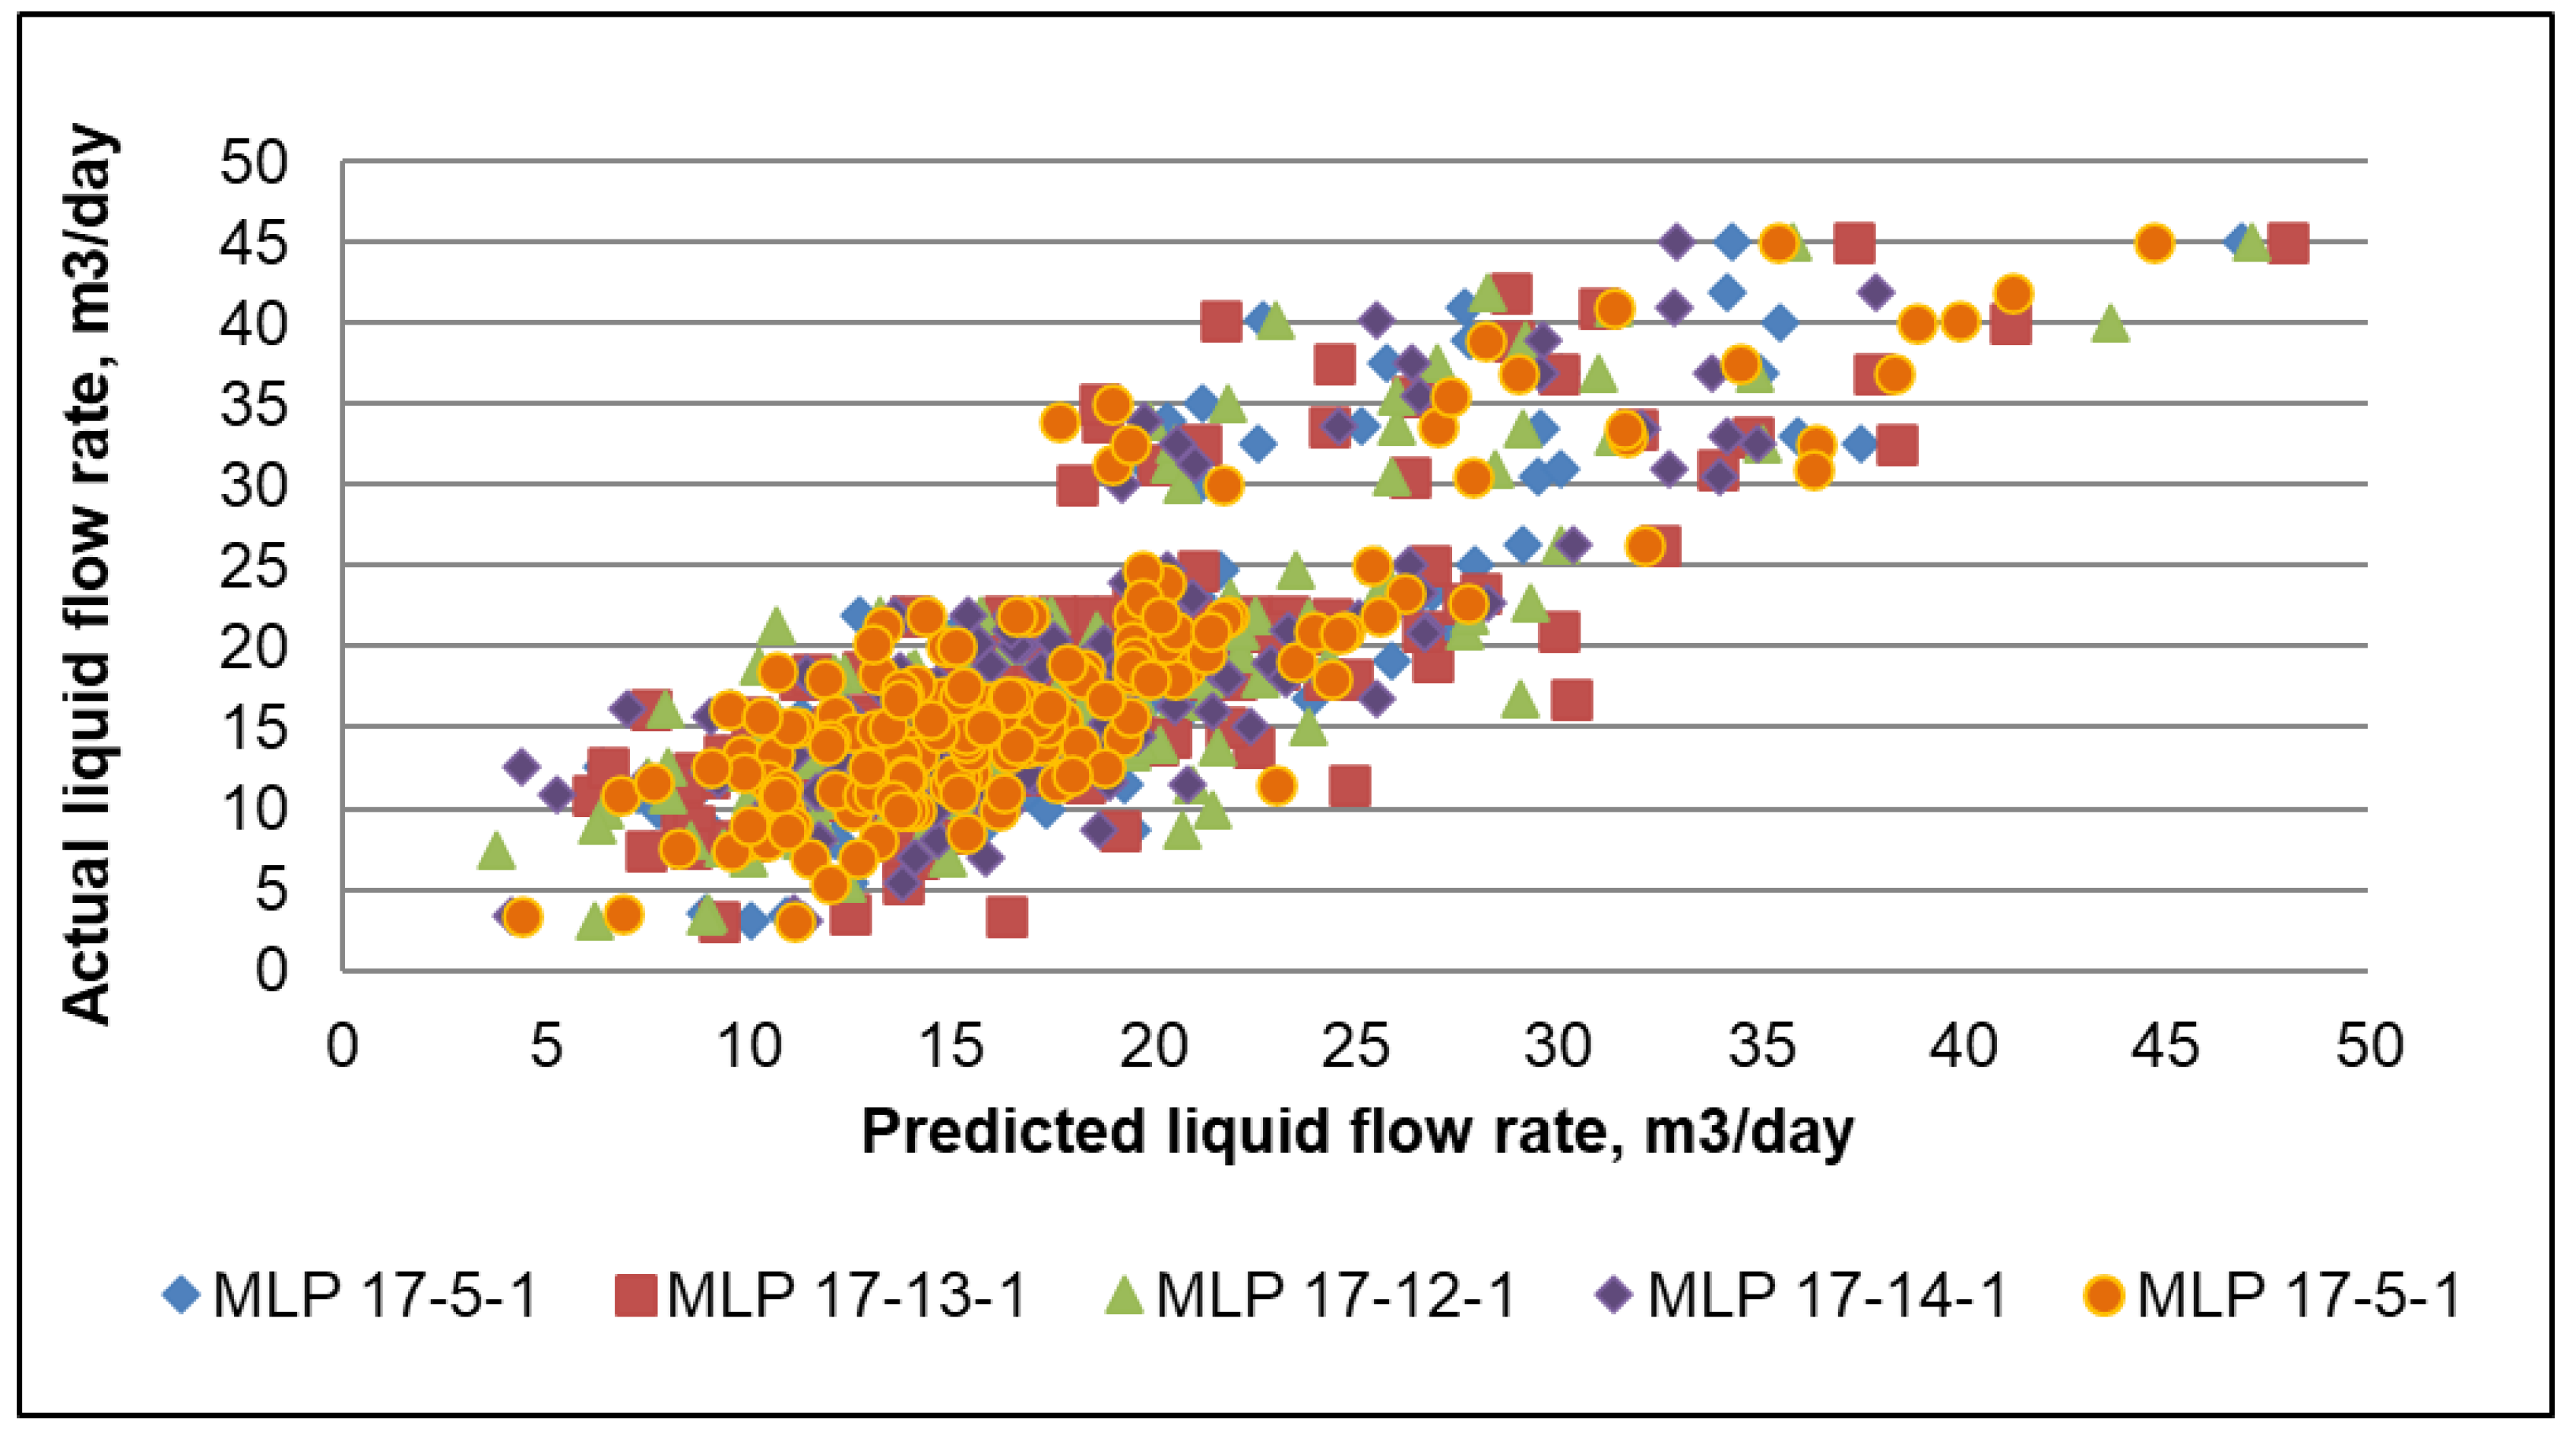
Initially, neural networks of different architecture were built, which quite reliably forecasted the liquid production rate after RJD (see Table 3).
Figure 4 shows the training results.
The second selected forecasting method was the Support Vector Machine method. However, with the modification of the parameters influencing the learning productivity, the best productivity value achieved was 0.79 for the training selection and 0.78 for the test selection with parameters—kernel type = radial basis function, gamma = 0.16, C = 5, epsilon = 0.2.
Table 4 shows the models and their corresponding statistical parameters. Where MAPE—mean absolute percentage error; STD—standard deviation; SEM—standard error mean, RMSE—root mean square error.
For further forecast, a multi-layer perceptron (MLP) was used, a neural network with a simpler architecture: 17 input layer neurons, 1 hidden layer with 5 neurons, and 1 neuron on the output layer, the neuron activation function is logistic, the error function is the sum of squares. The correlation coefficients achieved for this network were suitable for well stimulation forecasting tasks.
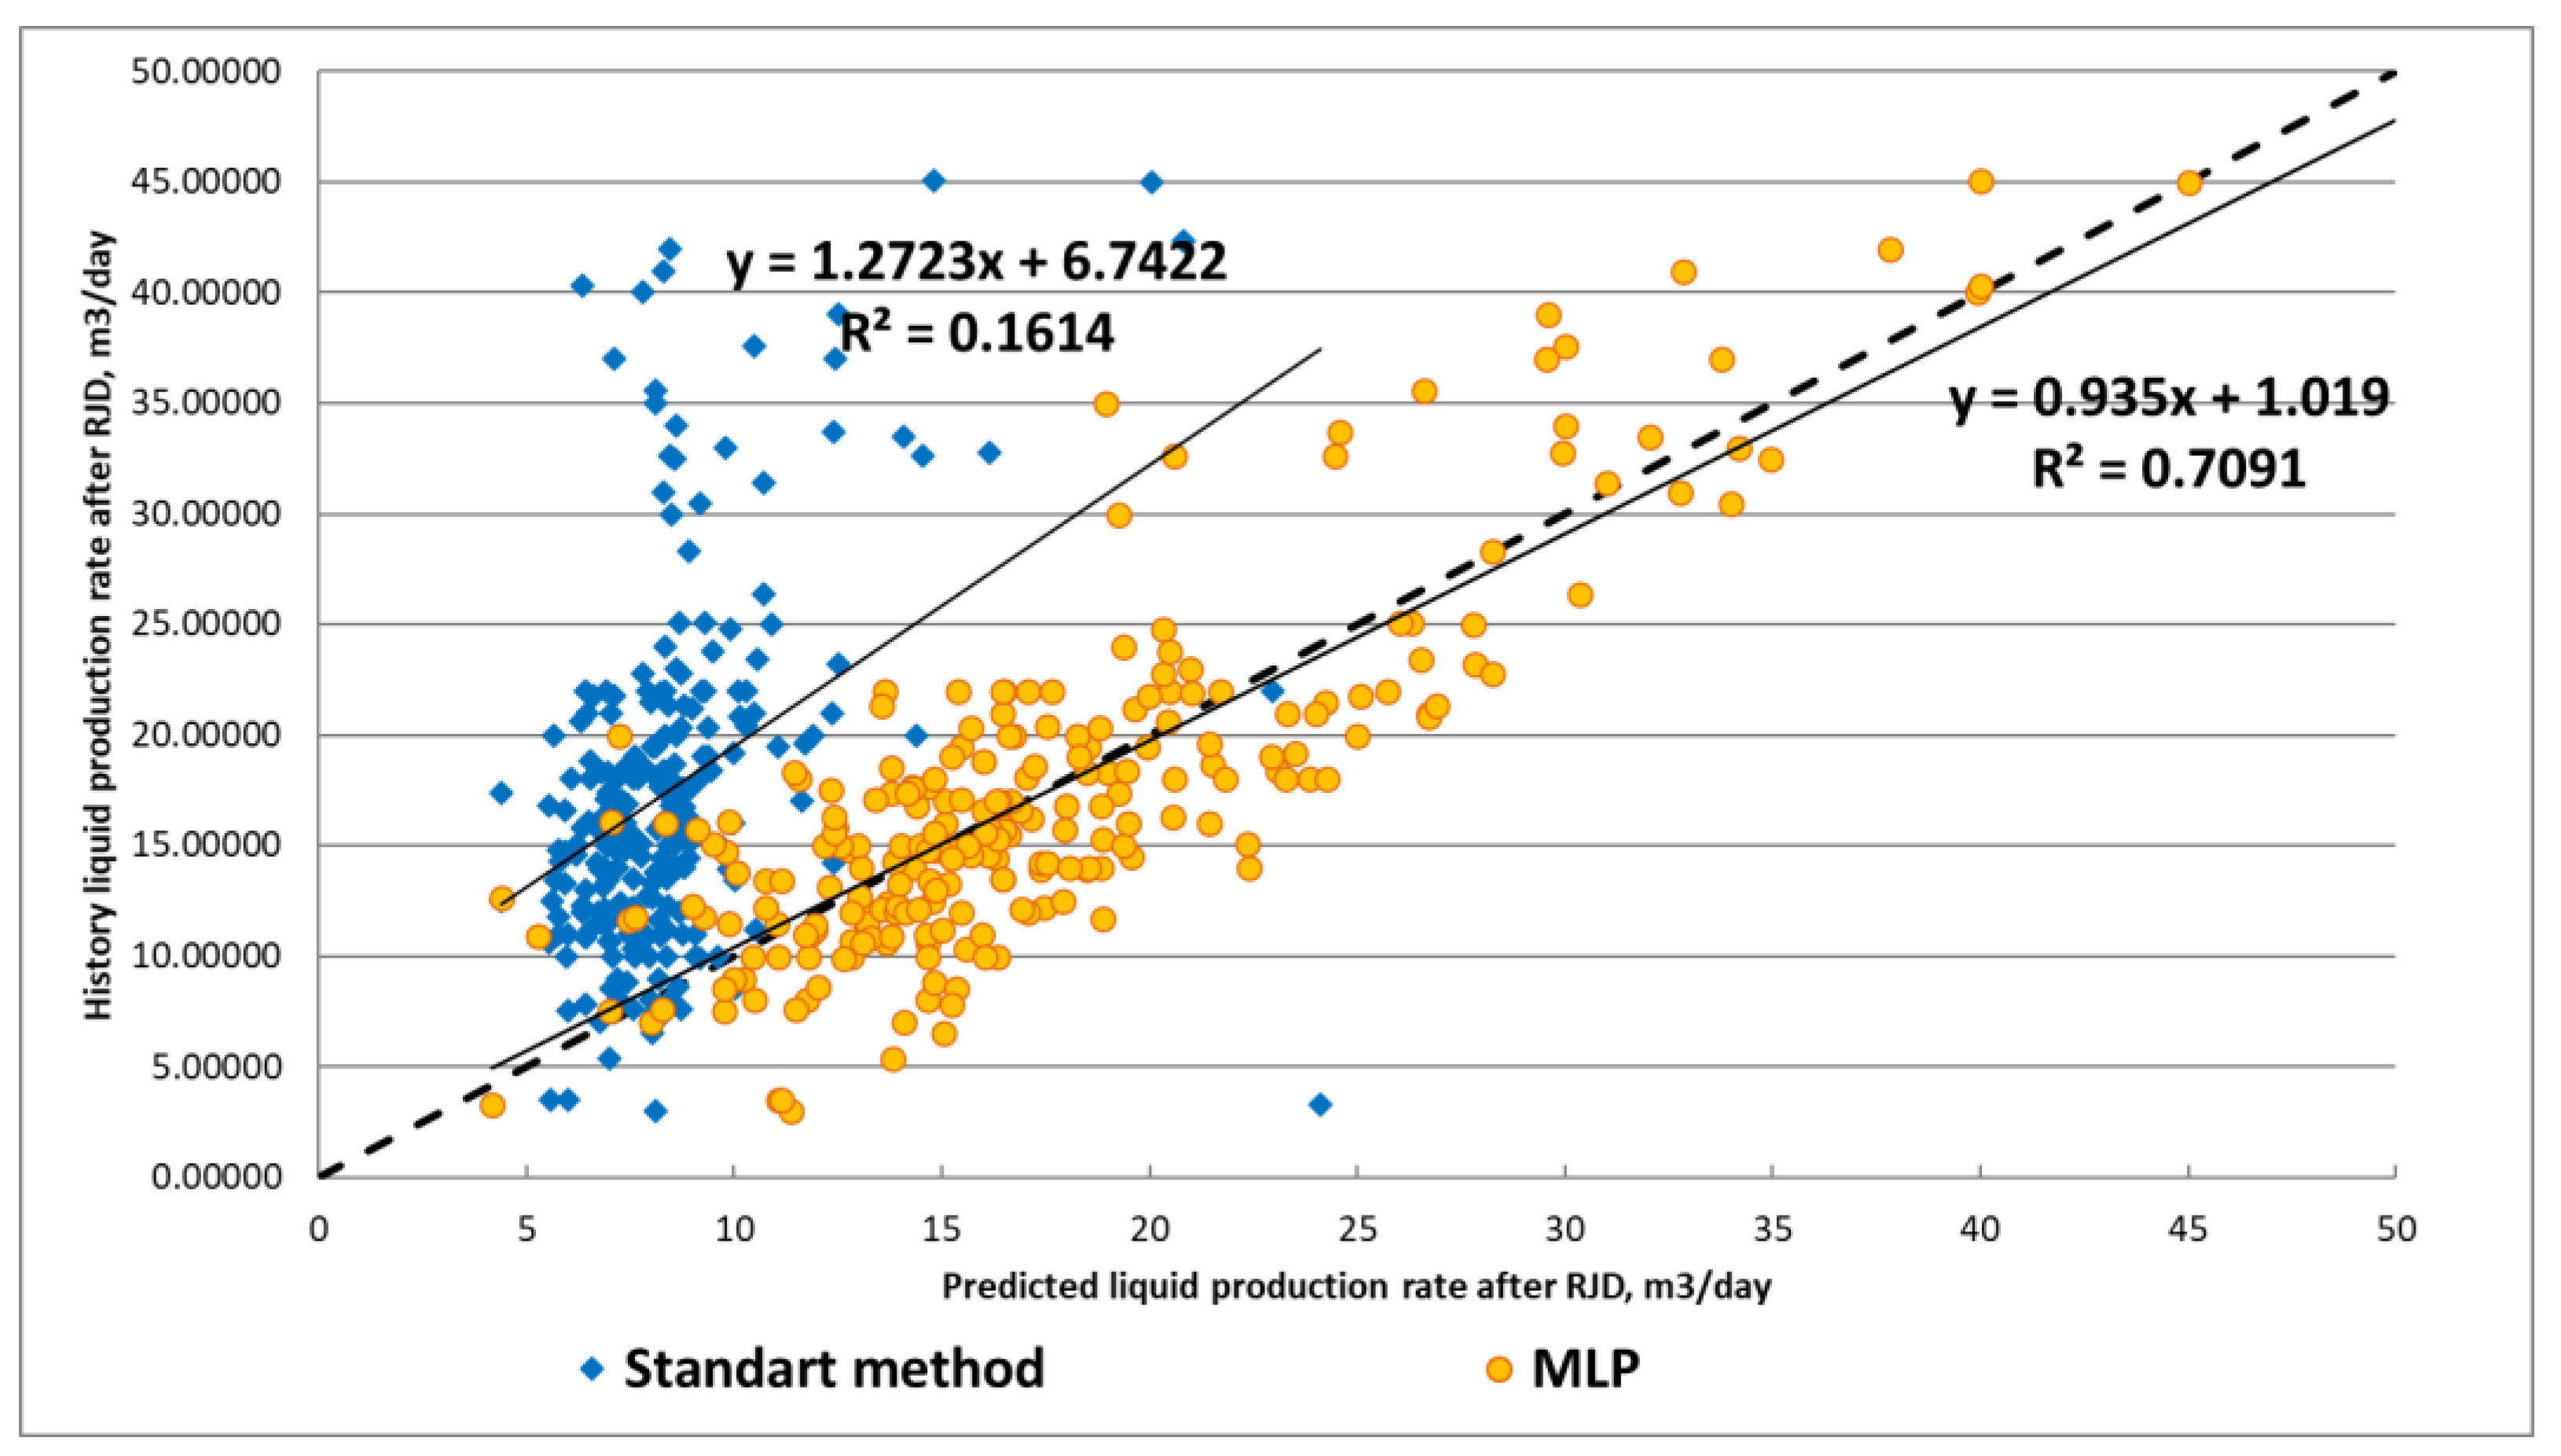
Figure 5 shows the difference between the standard statistical method for forecasting well stimulation events efficiency in Perm region and the MLP.
A significant improvement in the quality of the forecast can be noted, which makes it possible to determine the potential of wells for RJD.
Stage 2. Integrating the machine learning models with the hydrodynamic simulator.
The combination of statistical and mathematical forecasting methods significantly increases the reliability of forecasting the effects of well interventions. This approach allows for the taking into account of the geological and technological parameters entered in the machine learning model, as well as the dynamic parameters from the hydrodynamic model at the moment of forecasting.
The hydrodynamic simulator selected for the radial jet drilling modeling was Tempest More 8.6. The simulator is a universal hydrodynamic modeling pack used for oil, oil and gas, and gas condensate deposits.
The main parameter for the radial drilling efficiency assessment in the hydrodynamic modeling was the change of liquid production rate after RJD; skin factor and connectivity values are set by default (0, 1, respectively). Moreover, the line, length, and diameter of the radial canals are also entered into the simulator.
In order to integrate the hydrodynamic simulator and the machine learning models, a script in Python language was developed to collect the statistical parameters from the model (oil-saturated thickness, porosity, absolute permeability, number of intervals, etc.), as well as the dynamic parameters at the moment of radial drilling within the forecast period (reservoir pressure, current liquid production rate, water cut). Then, the neural network was used to calculate the liquid production rate after radial drilling.
This allows getting an automatic forecast of the liquid production increment due to drilling at any moment, which was used to assess the technological efficiency of drilling in both the long and short term.
Stage 3. Assessment of the oil production increment, water cut dynamics, reservoir pressure changes, as well as the incremental oil production due to drilling.
At the next stage, the hydrodynamic simulator was used to perform calculations taking into account the liquid production rate values calculated for the date of the planned RJD operation. Then, the technological development indexes were forecast, taking into account the potential liquid production increment after radial drilling, the dynamics of reservoir pressure and water cut, and the mutual influence of the wells.
The method makes it possible to predict the total production increment, oil production increment by years, the effect duration, changes to the water cut, and reservoir pressure dynamics, taking into account the mutual influence of all the wells and the cumulative effect of the geological and technological parameters.

3. Results

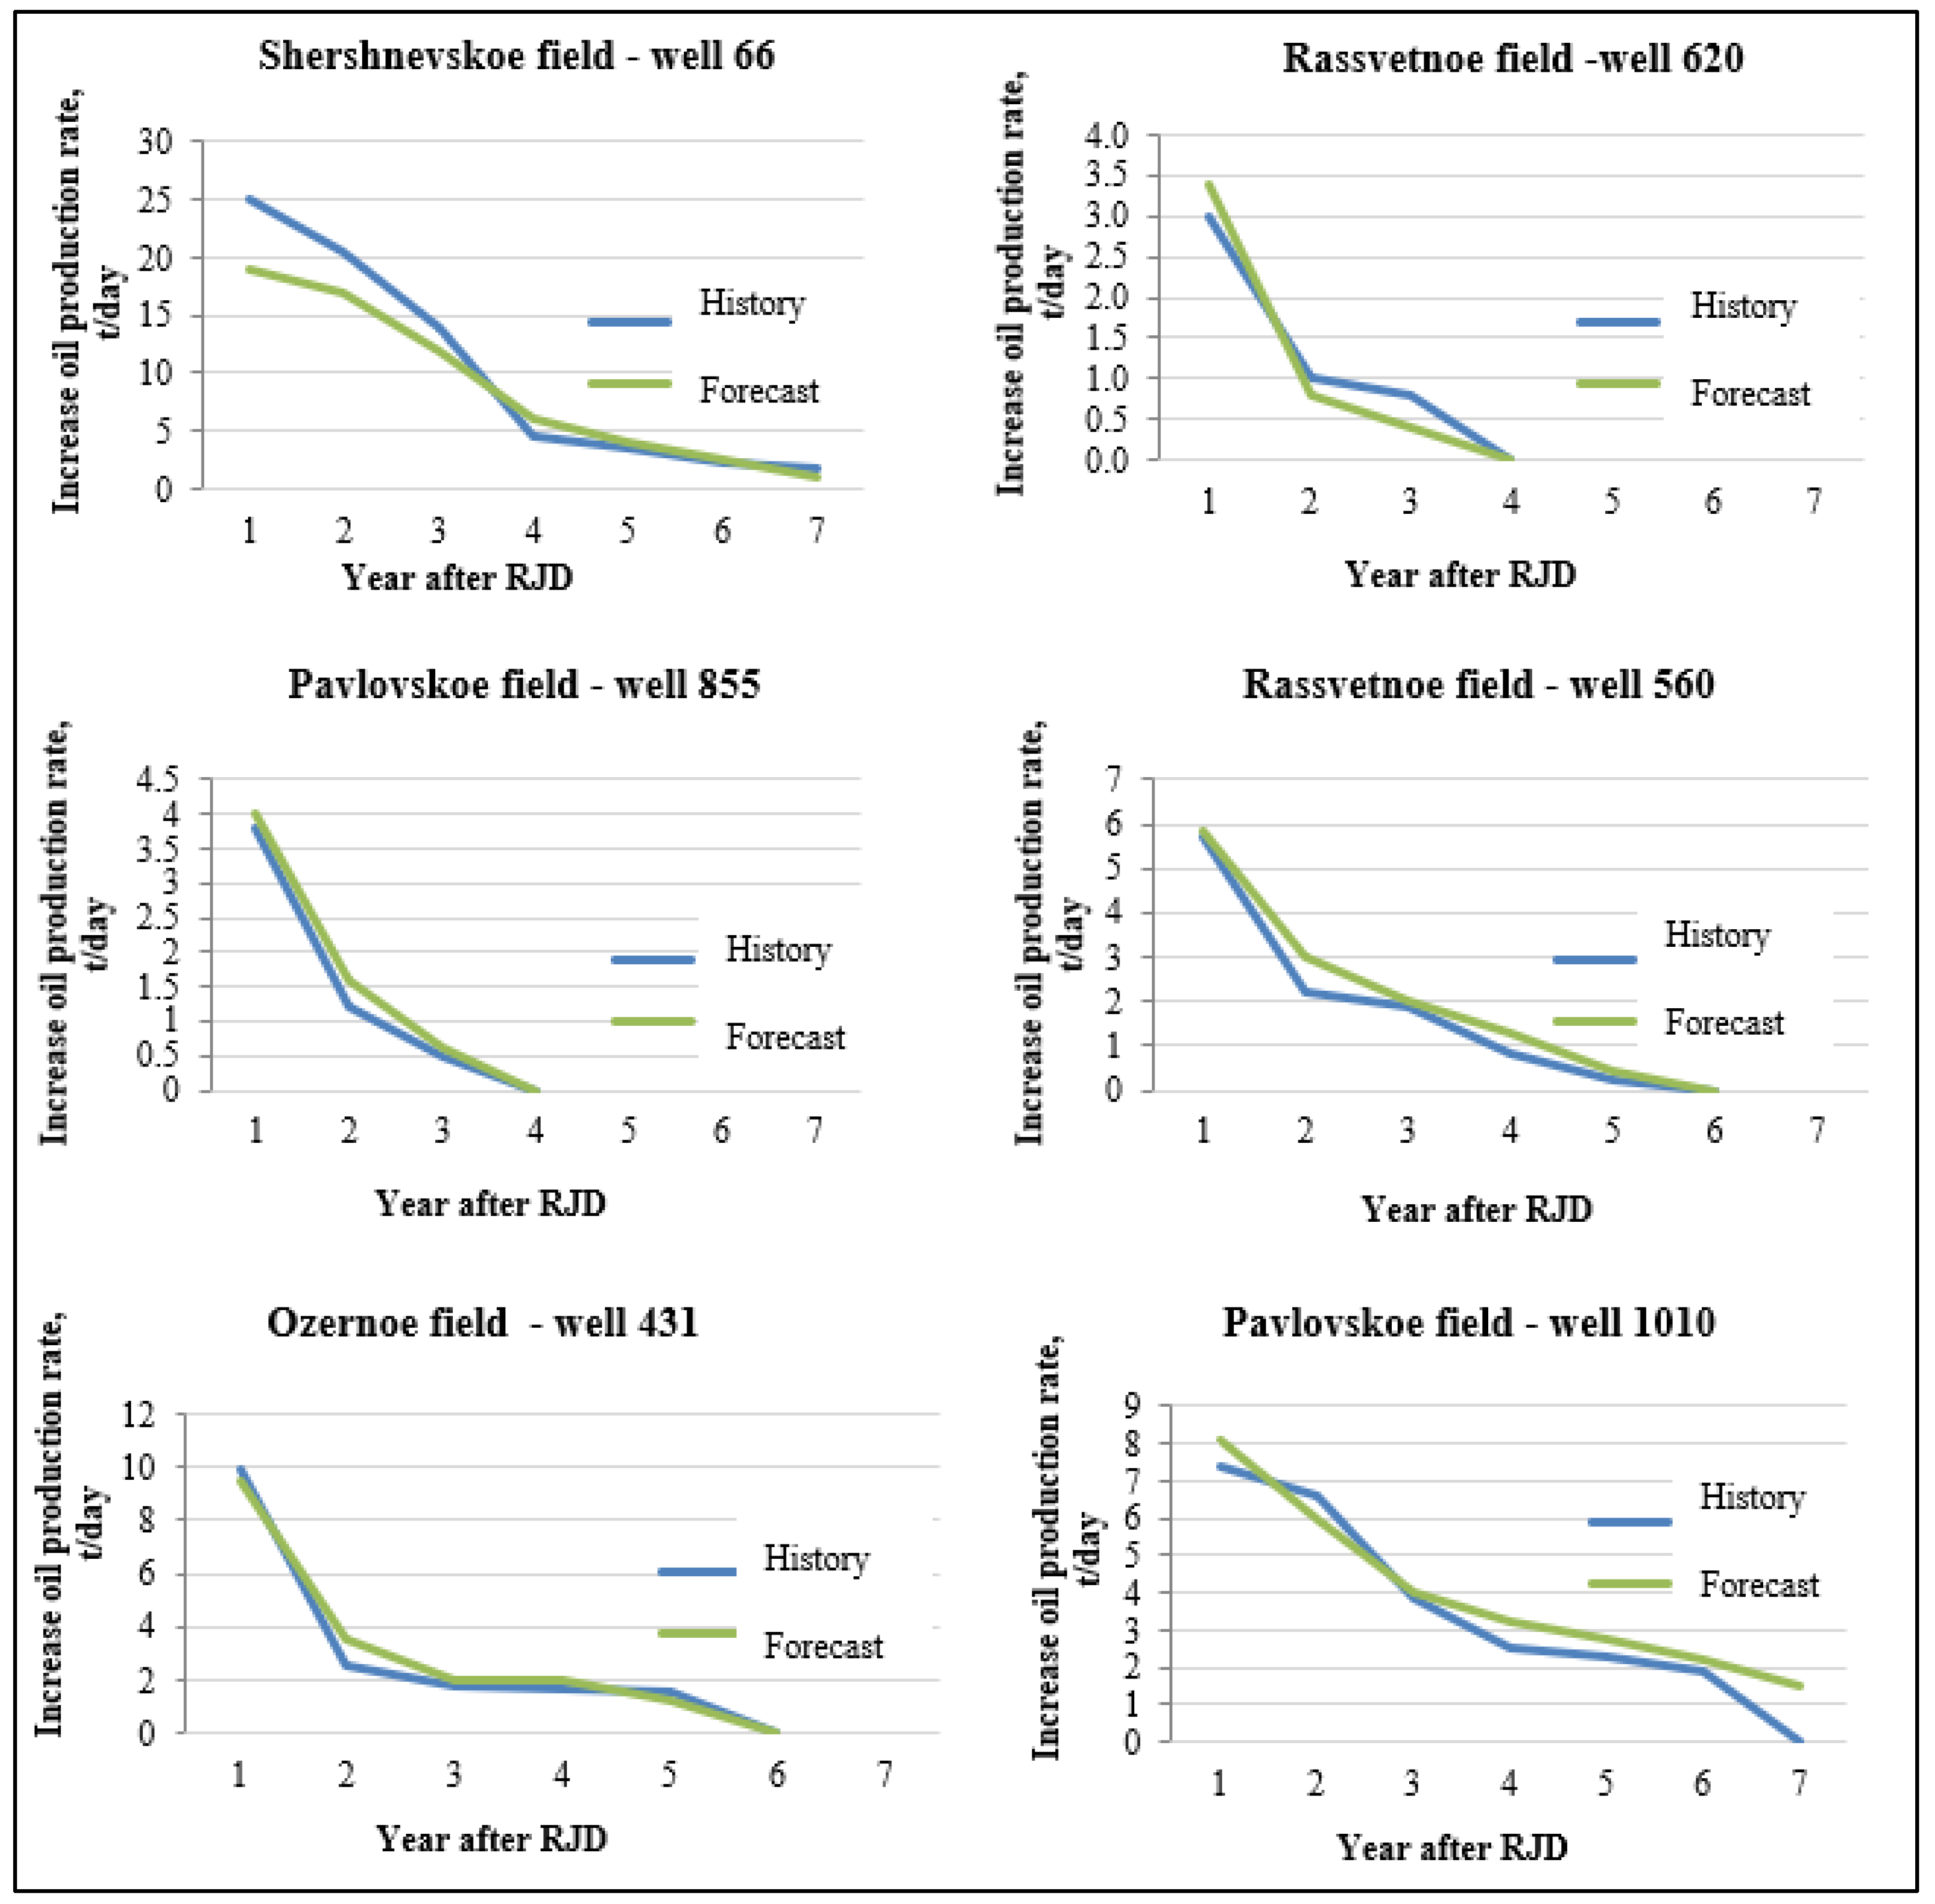
The developed integrated RJD efficiency forecasting method was applied to 15 wells located in the oil fields of the Perm Territory. Figure 5 shows a retrospective forecast of the oil production rate increment compared to the actual values for a number of wells in different oil fields. The oil production rate was compared as the basic parameter indicating the efficiency of well intervention.
Figure 6 shows that the author’s method was more accurate and closer to the actual effect of the operation, and the deviations from the incremental oil production rate did not exceed 11% (Table 5).
The developed method is universal and can be extrapolated to other improved oil recovery methods.

4. Discussion

The paper reviewed the global practice of radial drilling and well intervention efficiency modeling. It is noted that the RJD technology is a global practice, and its success depends on the geological and physical parameters of the reservoir.
The efficiency of the technology was analyzed on the oilfields of the Perm Territory, where a lot of experience in RJD use had been accumulated. It was revealed that the technology is much more efficient in carbonate reservoirs compared to terrigenous ones.
Mathematical statistics methods were used to determine the geological and technological parameters of the efficient technology use. For the sites of different geological age, it was revealed that various geological and technological parameters influence the efficiency indexes. For all the sites, there is the influence of the skin factor value, oil production rate before RJD, reservoir oil saturation, and reservoir energy (bottom-hole and reservoir pressures).
Based on the determined parameters, the machine learning models were built, allowing for the forecasting of the liquid production rate. A script was developed for integrating the hydrodynamic model with the machine learning models, in order to take into account a greater volume of statistical information along with the dynamic oil field parameters when forecasting.
When the method was tested, the deviation differences between the history and the forecast oil production total did not exceed 11%, which proves the reliability of the method. At the same time, the hydrodynamic model takes into account the mutual influence of oil wells, the dynamics of water cut, and reservoir pressure.

5. Conclusions

During the present study:
  • The efficiency of radial jet drilling in Russian and foreign oil fields was analyzed.
  • The industrial survey data on radial jet drilling in different wells were analyzed and systematized. For different carbonate sites of the Perm Territory oil fields, the geological, physical, and technological parameters, influencing the effectiveness of radial jet drilling, were determined.
  • Machine learning models have been developed to predict post-RJD fluid rates for candidate wells. It can be noted that the quality of the forecast has improved according to the standard statistical method used in the fields of the Perm Territory. The R-squared obtained for MLP is suitable for well stimulation prediction tasks.
  • The integrated method of forecasting the incremental production rate due to RJD was developed and tested. It should be noted that with an accurate forecast of the liquid production rate after RJD, the forecast of increased oil production total on the reservoir simulation model turns out to be very accurate (relative error less than 11%).
The method makes it possible to predict the total production increment, oil production increment by years, the effect duration, changes of the water cut, and reservoir pressure dynamics, taking into account the mutual influence of all the wells and the cumulative effect of the geological and technological parameters. The method allows for both short-time and long-time forecasting of the technology’s efficiency.

Author Contributions

Conceptualization, S.G. and S.K.; methodology, A.K. and N.K.; software, N.K.; validation, A.K.; formal analysis, A.K. and N.K.; investigation, A.K. and N.K.; resources, A.K. and N.K.; data curation, S.G.; writing—original draft preparation, A.K.; writing—review and editing, S.K.; visualization, P.C.; supervision, S.G.; project administration, A.K.; funding acquisition, A.K. All authors have read and agreed to the published version of the manuscript.

Funding

This research was funded by RFBR, grant number 19-35-90029.

Institutional Review Board Statement

Not applicable.

Informed Consent Statement

Not applicable.

Data Availability Statement

Not applicable.

Acknowledgments

The reported study was funded by RFBR, project number 19-35-90029.

Conflicts of Interest

The authors declare no conflict of interest.

References

  1. Zotikov, V.I.; Kochnev, A.A.; Galkin, S.V. Analysis of the influence of geological technological parameters on the effectiveness of radial drilling technology on the example of operational objects in Perm region. Bull. Tomsk Polytech. Univ. Geo Аssets Eng. 2018, 329, 20–29. [Google Scholar]
  2. Chi, H.; Li, G.; Huang, Z.; Tian, S.; Song, X. Maximum drillable length of the radial horizontal micro-hole drilled with multiple high-pressure water jets. J. Nat. Gas Sci. Eng. 2015, 26, 1042–1049. [Google Scholar] [CrossRef]
  3. Brantson, T.; Ju, B.; Yang, Y.; Chi, J. A numerical simulator developed for modeling permeability control for enhanced oil recovery. J. Pet. Sci. Eng. 2017, 159, 360–375. [Google Scholar]
  4. Ivanov, V.A. Development system of low-productivity zonal-heterogeneous oil reservoir. Oilfield Eng. 2012, 8, 5–11. [Google Scholar]
  5. Cinelli, S.D.; Ahmed, H. Kamel Novel Technique to Drill Horizontal Laterals Revitalizes Aging Field. In Proceedings of the SPE/IADC Drilling Conference, Amsterdam, The Netherlands, 5–7 March 2013. [Google Scholar] [CrossRef]
  6. Ibeh, S.; Obah, B.; Chibueze, S. Investigating the Application of Radial Drilling Technique for Improved Recovery in Mature Niger Delta Oil Fields. In Proceedings of the SPE Nigeria Annual International Conference and Exhibition, Lagos, Nigeria, 31 July–2 August 2017. SPE-189137-MS. [Google Scholar]
  7. Abdel-Ghany, M.A.; Siso, S.; Hassan, A.M.; Pierpaolo, P.; Roberto, C. New Technology Application, Radial Drilling Petrobel, First Well in Egypt. In Proceedings of the 10th Offshore Mediterranean Conference and Exhibition (OMC), Ravenna, Italy, 23–25 March 2011. [Google Scholar]
  8. Jain, D.; Maut, P.P.; Saharia, P.; Dutta, R.; Yomdo, S. Oil field radial jet drilling in mature fields of oil India limited- an experimental approach. In Proceedings of the SPE Oil and Gas India Conference and Exhibition, Mumbai, India, 4–6 April 2017. [Google Scholar]
  9. Ahmed, K. RJD: A Cost Effective Frackless Solution for Production Enhancement in Marginal Fields. In Proceedings of the SPE Eastern Regional Meeting, Canton, OH, USA, 13 September 2016; University of Texas of the Permian Basin: Odessa, TX, USA, 2016. [Google Scholar]
  10. Dickinson, W.; Dickinson, R.; Nees, J.; Dickinson, E.; Dykstra, H. Field production results with the ultrashort radius radial system in unconsolidated sandstone formations. In Proceedings of the 5th UNITAR International Conference on Heavy Crude and Tar Sands, Caracas, Venezuela, 4–9 August 1991; Volume II, pp. 307–326. [Google Scholar]
  11. Dickinson, W.; Dykstra, H.; Nordlund, R. Coiled-Tubing Radials Placed by Water-Jet Drilling: Field Results, Theory, and Practice. In Proceedings of the SPE Annual Technical Conference and Exhibition, Houston, TX, USA, 1 January 1993. [Google Scholar]
  12. Dickinson, W.; Dickinson, R. Horizontal radial drilling system. SPE 1985, 13949, 36–39. [Google Scholar]
  13. Pavelieva, O.N.; Popova, Z.S. Analysis of the effectiveness of application of advanced deep-radial channel drilling technology at the Vakhitovskoye deposit. In Geology and Oil and Gas Content of the West Siberian Megabasin (Experience, Innovations). Materials of the Tenth International Scientific and Technical Conference (Dedicated to the 60 Anniversary of the Tyumen Industrial University); Tyumen Industrial University: Tymen, Russian, 2016; pp. 112–115. [Google Scholar]
  14. Ilyushin, P.Y.; Rakhimzyanov, R.M.; Solovyov, D.Y.; Kolychev, I.Y. Analysis of geological and technical measures to increase the productivity of producing wells in the oil fields of the Perm region. Vestnik Permskogo natsional’nogo issledovatel’skogo politekhnicheskogo universiteta.Geologiya. Neftegazovoe i gornoe delo Perm. J. Pet. Min. Eng. 2015, 14, 81–89. [Google Scholar]
  15. Demyanenko, N.; Serebrennikov, A.; Povzhik, P.; Galai, M.; Tretyakov, D.; Klochkov, S. Drilling deep radial channels. Opening of productive strata of low-permeability reservoirs. Oil Gas J. 2016, 7, 52–56. [Google Scholar]
  16. Raspopov, A.V.; Novokreshchennykh, D.V. Analysis of the results of the application of intensification methods on carbonate reservoirs of Perm Krai deposits. Vestnik Permskogo natsional’nogo issledovatel’skogo politekhnicheskogo universiteta. Geol. Neftegazov. Gorn. Delo. 2014, 13, 73–82. (In Russian) [Google Scholar]
  17. Novokreshchenny, D.V.; Raspopov, A.V. Perspectives of development of technologies of radial opening of a layer on deposits of the Perm edge. Oil Ind. 2014, 3, 54–57. [Google Scholar]
  18. Gladkikh, E.A.; Galkin, V.I.; Khizhniak, G. Estimation method of oil displacement efficiency based on standard core analysis. In Proceedings of the International Conference Actual Issues of Mechanical Engineering (AIME 2017), Tomsk, Russia, 27–29 July 2017; Volume 133, pp. 240–247. [Google Scholar]
  19. Repina, V.; Galkin, V.; Galkin, S. Complex Petrophysical Correction in the Adaptation of Geological Hydrodynamic Models (on the example of visean pool of gondyrev oil field). J. Min. Inst. 2018, 231, 268–274. [Google Scholar]
  20. Lyadova, N.A.; Yu, A.; Yakovlev, A.V.; Raspopov, M. Geology and development of oil fields in the Perm region. JSC VNIIOENG 2010, 335, 8. [Google Scholar]
  21. Andronov, Y.V.; Strekalov, A.V. Choice of variables for neural network training for predicting the efficiency of formation hydraulic fracturing. Dev. Oil Gas Fields 2014, 12, 3. [Google Scholar]
  22. Galkin, V.I.; Ponomareva, I.N. Study of reservoir properties fractured-porous reservoirs of Tournasian-Famennian objects in the oil fields of Solikamskaia depression. OIJ 2016, 2016, 88–91. (In Russian) [Google Scholar]
  23. Galkin, S.V.; Efimov, A.A.; Krivoshchekov, S.N.; Savitskiy, Y.V.; Cherepanov, S.S. X-ray tomography in petrophysical studies of core samples from oil and gas fields. Russ. Geol. Geophys. 2015, 5, 782–792. [Google Scholar] [CrossRef]
  24. Kochnev, A.A.; Galkin, S.V. Modeling a hydromonitor drilling by predicting the direction of the radial channel taking into account the stress state of the rock mass. In Proceedings of the Volume 2216: 28th Russian Conference on Mathematical Modelling in Natural Sciences, Perm, Russia, 2–5 October 2019. [Google Scholar]
  25. Galkin, S.V.; Kochnev, A.A.; Zotikov, V.I. Estimate of Radial Drilling Technology Efficiency for the Bashkir Operational Oilfields Objects of Perm Krai. J. Min. Inst. 2019, 238, 410–414. [Google Scholar] [CrossRef]
  26. Koltyrin, A.N. Improving the efficiency of hydraulic fracturing technology on a carbonate reservoir. Oilfield Eng. 2016, 10, 29–32. [Google Scholar]
Figure 1. General characteristics of RJD (radial jet drilling) use.
Applsci 11 04487 g001
Figure 2. Distribution of sites by the cumulative incremental oil production due to RJD.
Applsci 11 04487 g002
Figure 3. Success of the hydrodynamic parameter change after RJD, by formations.
Applsci 11 04487 g003
Figure 4. Results of training neural networks with different architectures.
Applsci 11 04487 g004
Figure 5. Сomparison of forecasted results of the standard static method and MLP.
Applsci 11 04487 g005
Figure 6. Comparison of the forecast using the developed method to the actual average daily oil production increment data by years.
Applsci 11 04487 g006
Table 1. Investigated parameters.
Geological and Technological ParametersAbbr., Units
Average general thicknessHo, m
Average oil-saturated thicknesshoil, m
Porosity𝜙, %
Average initial oil saturationKoil, unit fractions
Permeability GPFPkgpfp, µm2
Net-to-gross sand ratioNTG, unit fractions
CompartmentalizationKcomp, units
Average oil dynamic viscosity in the formation conditionsµ, mPa·s
Oil density in the formation conditionsƍoil, g/cm3
Formation volume factor Bo, bbls/stb
Paraffin contentPC, %
Average gas-oil ratioGOR, m3/m3
Bottom hole zone (BHZ) hydroconductivity εbhz, µm2·cm/(mPa·s)
Farfield hydroconductivity εfarfield, µm2·cm/(mPa·s)
Bottom hole zone (BHZ) permeability coefficient kbhz, µm2
Farfield permeability factorkfarfield, µm2
Piezoconductivityχ, cm2·s
Reservoir pressureРres, MPa
Bottom-hole pressureРbh, MPa
Bubble pressureРb, MPa
Well skin factorS
Total reservoir thickness GWSIRHtotal, m
Average thickness of an oil-saturated interlayer GWSIRhav, m
Net pay thickness GWSIRНpay, m
Oil-saturated reservoir thickness GWSIRhsat., m
Oil saturation factor GWSIRKsat., unit fractions
Porosity GWSIR𝜙GWSIR, %
Permeability GWSIRKGWSIR, µm2
Oil production rate before the operationqoil, barrels/day
Liquid production rate before the operationqliq, m3/day
Compartmentalization for oil layersKcomp(oil), units
Efficiency Parameters
Maximum oil production rate after RJD barrels/day
Effect durationdays
Average daily oil production rate incrementbarrels/day
Incremental oil production total barrels
Table 2. Result of t-test calculation.
Incremental Oil Production Total, Barrels<16,023>16,023t-TestpN1N2R
µ, mPa·s16.620.2−2.00.04275271−0.31
G, m3/m342.236.61.90.052742710.13
εbhz, µm2·cm/(mPa·s)1.22.0−2.3<0.011711710.17
χ, cm2·s;120.5213.0−1.80.071711710.19
Рbh, MPa4.55.2−2.40.021711710.14
skin factor S−2.8−1.7−3.1<0.011711710.12
εbhz, µm2·cm/(mPa·s)1.22.0−2.3<0.011711710.11
Ksat, unit fractions69.073.8−2.250.022001970.14
Oil production rate increment, barrels/day<19.6>19.6t-testpN1N2R
Koil, unit fractions0.7410.754−2.7<0.012782560.11
Kperm, µm26.57.3−2.20.022792610.12
Рsat, MPa9.09.5−2.8<0.012792600.08
εfarfield, µm2·cm/mPa·s0.92.3−3.6<0.011771650.31
kfarfield, µm20.0270.061−1.90.061761630.15
χ, cm2·s;86.9252.4−3.2<0.011771650.29
Рres, MPa10.311.2−2.50.011771640.25
Рbh, MPa4.25.6−5.1<0.011771650.27
skin factor S−2.8−1.7−3.4<0.011771650.21
Нsat, m7.48.3−2.060.042031900.22
RJD effect duration, days<870 >870 t-testpN1N2R
𝜙, %13.714.1−2.10.032642700.11
NTG, unit fractions0.30.4−2.00.042692770.13
Bo, bbls/stb1.11.32.00.04269277−0.07
kbhz, µm20.0680.0391.80.0766730.13
Рbh, MPa10.311.1−2.00.041691720.13
skin factor S−2.6−1.8−2.20.021701720.18
Maximum oil production rate after RJD, barrels/day<72.8>72.8t-testpN1N2R
hoil, m5.87.8−4.1<0.012812610.23
Kperm, µm26.37.6−3.6<0.012832630.11
εfarfield, µm2·cm/mPa·s0.92.2−3.5<0.011611810.31
χ, cm2·s;86.3238.4−2.9<0.011611410.27
Рres, MPa10.311.1−2.00.041611810.09
Рbh, MPa4.25.4−4.5<0.011611800.3
Нpay9.010.4−2.520.011871810.18
Нsat, m7.18.5−3.19<0.011862060.22
Kcomp, units7.69.4−3.24<0.011862060.07
Kcomp(oil), units9.311.1−2.790.011862060.08
Table 3. Architectures and results of neural networks.
ArchitectureTraining ProductivityTest ProductivityLearning AlgorithmError FunctionActive Hidden Neuron FunctionActive Output Neuron Function
MLP 17-5-10.8190.814BFGS 27Sum of squaresHyperbolicIdentical
MLP 17-5-10.7720.767BFGS 17Sum of squaresExponentialIdentical
MLP 17-12-10.7980.807BFGS 25Sum of squaresHyperbolicIdentical
MLP 17-14-10.8060.787BFGS 20Sum of squaresExponentialIdentical
MLP 17-5-10.8550.800BFGS 35Sum of squaresExponentialIdentical
Table 4. Statistical measures of the proposed models.
ArchitectureTraining/TestR SquareMean Absolute Percentage Error (MAPE)STDSEMRMSE
MLP 17-5-1training0.7413%4.360.643.8
MLP 17-5-1test0.6516.2%4.160.665.8
SVMtraining0.6217.02%3.50.265.01
SVMtest0.6117.07%3.70.485.09
Table 5. Statistical measures of the proposed forecasting method.
WellsR-SquareRMSHistory Increased Oil Production Total, BarrelsForecast Increased Oil Production Total, BarrelsRelative Error,%
4310.980.53851648118,384.220,166.3−9.7
8550.990.2645751316597.17193.2−9
10100.950.75023805744,334.548,717.8−9.9
5600.980.43874821927,468.929,626.7−7.9
6200.9750.3464101626983.06517.16.7
660.983.044393755117,987.7105,545.410.5
Publisher’s Note: MDPI stays neutral with regard to jurisdictional claims in published maps and institutional affiliations.