1. Introduction
The share of renewable energies (REs) in power systems is growing continuously due to various concerns [
1]. In particular, by the use of photovoltaic (PV) panels, solar energy is one of the most popular RE and has gained increasing attention. Unlike some other sources of electricity, it is not possible to run out of solar power. Moreover, the maintenance costs for PV generation are relatively low. However, some challenges have still to be considered. For example, it is difficult to predict solar generation due to weather uncertainties [
2]. Today, many PV-based microgrids are implemented, which could be isolated from the main grid. However, microgrids suffer more important stability issues. Thus, it is essential to guarantee the maximum electricity power [
3].
For the optimum generation planning of typical grid systems or microgrids based on PV, it is essential to determine the installation site’s PV performance. The amount of power generated by a PV panel depends on the sunlight to which it is exposed to. Thus, it is crucial to maximizing the PV panel’s sunlight by orienting optimally. Various mathematical models have, in fact, been developed based on available climate data to estimate the availability of solar energy.
In PV studies, various main factors must be considered, such as weather conditions, orientation (azimuth angle), and horizontal inclination angle (related to the ground). The latter could vary depending on the year, month and day due to the sun’s position. All this to achieve optimal performance in terms of capture. The variables associated with the positioning and orientation of the panels can drastically modify the system’s performance. The mathematical models of solar trajectory relate a group of variables, which are necessary to refer to the measurements as field parameters in irradiance with those that affect directly in a normal way on the capture surface [
4]. This provide valuable information of design, such as optimal panel arrangement for the highest energy capture [
5,
6].
The transposition models could be divided into two groups: isotropic and anisotropic. Isotropic models consider that the total sky diffuse radiation is distributed isotropically over the sky dome [
7]. Anisotropic models assume isotropic components with an additional circumsolar region or the horizon-brightening components. Anisotropic models could include two or three components.
Various models have evaluated the accuracy transposition models by comparing the modeled irradiance with measured values in different climate conditions since long time ago. For example, in Reference [
8], the calculation of monthly mean solar radiation for horizontal and inclined surfaces was proposed. Gueymar et al. [
9] proposed a radiation model, titled CDRS, which can be used with different input data combinations. In Reference [
10], an assessment of tilted insolation models in Athens, Greece, was performed.
Some recent models have been proposed. For example, Housmans et al. [
11] proposed an inverse process of transposition models by converting from tilted to horizontal. In [
12], an open-loop single-axis solar tracking system that tracks the sun through optimized rotation about the tilted axis was presented. Halilovic et al. [
13] performed an analytical approach for determining the global horizontal from the global tilted irradiance. In Reference [
14], a solar gridded model was proposed using spatial and temporal data in Nordic countries. Gomez-Uceda et al. [
15] investigated the influence of terrain orientation for PV systems.
Many other works compared the performance of available transposition models in various countries, such as Thailand [
16], Algeria [
17,
18], Greece [
19], Slovenia [
20], Germany [
21], Palestine [
22], Spain [
23], and Brazil [
24].
Due to geographic location conditions, Ecuador is at a latitude in which the solar potential is particular and vital [
25,
26]. Ecuador is a developing country with increasing energy consumption and seasonality with little variation throughout the year [
27]. Consequently, there are relatively constant high levels of insolation. Furthermore, it has excellent potential for using solar energy as an alternative for the effective reduction of atmospheric pollutants and the global effects of climate change [
28,
29]. Several studies were carried out in Ecuador to obtain the optimal position of a solar panel. For example, the authors of Reference [
30] suggest an orientation of 35° concerning the north and an inclination of 15° concerning the horizontal, for the city of Cuenca. In cities where there are significant changes in weather conditions across cities due to geographic conditions, it is not representative for the entire country to estimate a single average optimum tilt angle. Thus, this work proposes the development of an computer application to obtain the optimal orientation and inclination of a flat surface, based on data acquired from meteorological stations in the city of Cuenca and Typical Meteorological Years (TMY) files within the different cities of Ecuador.
The main contributions of this article are listed as follows:
Five irradiance transposition models are used to calculate the capture of solar insolation
Various cities in Ecuador are studied to assess the impact of the location in the capture of solar insolation
The performance of each model is evaluated in the selected cities
The rest of the paper is organized as follows:
Section 2 presents the methodology.
Section 3 discusses the main results. Finally,
Section 4 is devoted to conclusions.
2. Materials and Methods
The methodology of this work is based on the application of five well-known mathematical models. These models estimate the amount of solar irradiance that can be captured on a flat surface for different orientations and tilt angles. The models’ input data are the beam, diffuse, and global irradiance on a horizontal surface, the orientation, and tilt angles of the capturing flat surface. Then, each model obtains as output the amount of solar irradiance captured for different positions. In this way, it is possible to know the optimal position of a flat surface to capture solar energy at a given location.
To determine the optimal position of flat surfaces, various parameters should be taken into account, which are listed as follows:
Solar insolation: The amount of solar radiation received from the Sun and expressed in Wh/m2.
Solar irradiance: The instantaneous power per unit area received from the Sun on the Earth’s surface and expressed in W/m2. The irradiance is measured in the wavelength range of the measuring instrument.
Ground reflectance (albedo): The portion of solar insolation incident on the ground that is reflected.
Sky clarity index: The ratio of measured insolation relative to insolation outside the atmosphere calculated in the given location.
The analyzed data in Cuenca was collected from a meteorological station located in the Salesian Polytechnic University. The weather data were obtained using VAISALA weather station, Datalogger QML201C, and the VAISALA HydroMetTM Automatic Weather Station Client Software (AWS Client). The AWS Client includes outlier detection as a tool of Quality Control. The data collected is from a VAISALA weather station with a data logger QML201C. The weather station is exposed directly to the environment. The meteorological data are transmitted to a PC station with VAISALA HydroMetTM Automatic Weather Station Client Software (AWS Client), a graphical and end-user software. The time interval of the data is 15 min. The solar radiation is measured with a Hukseflux thermal sensor SR11, HFS Shadow-Ring.
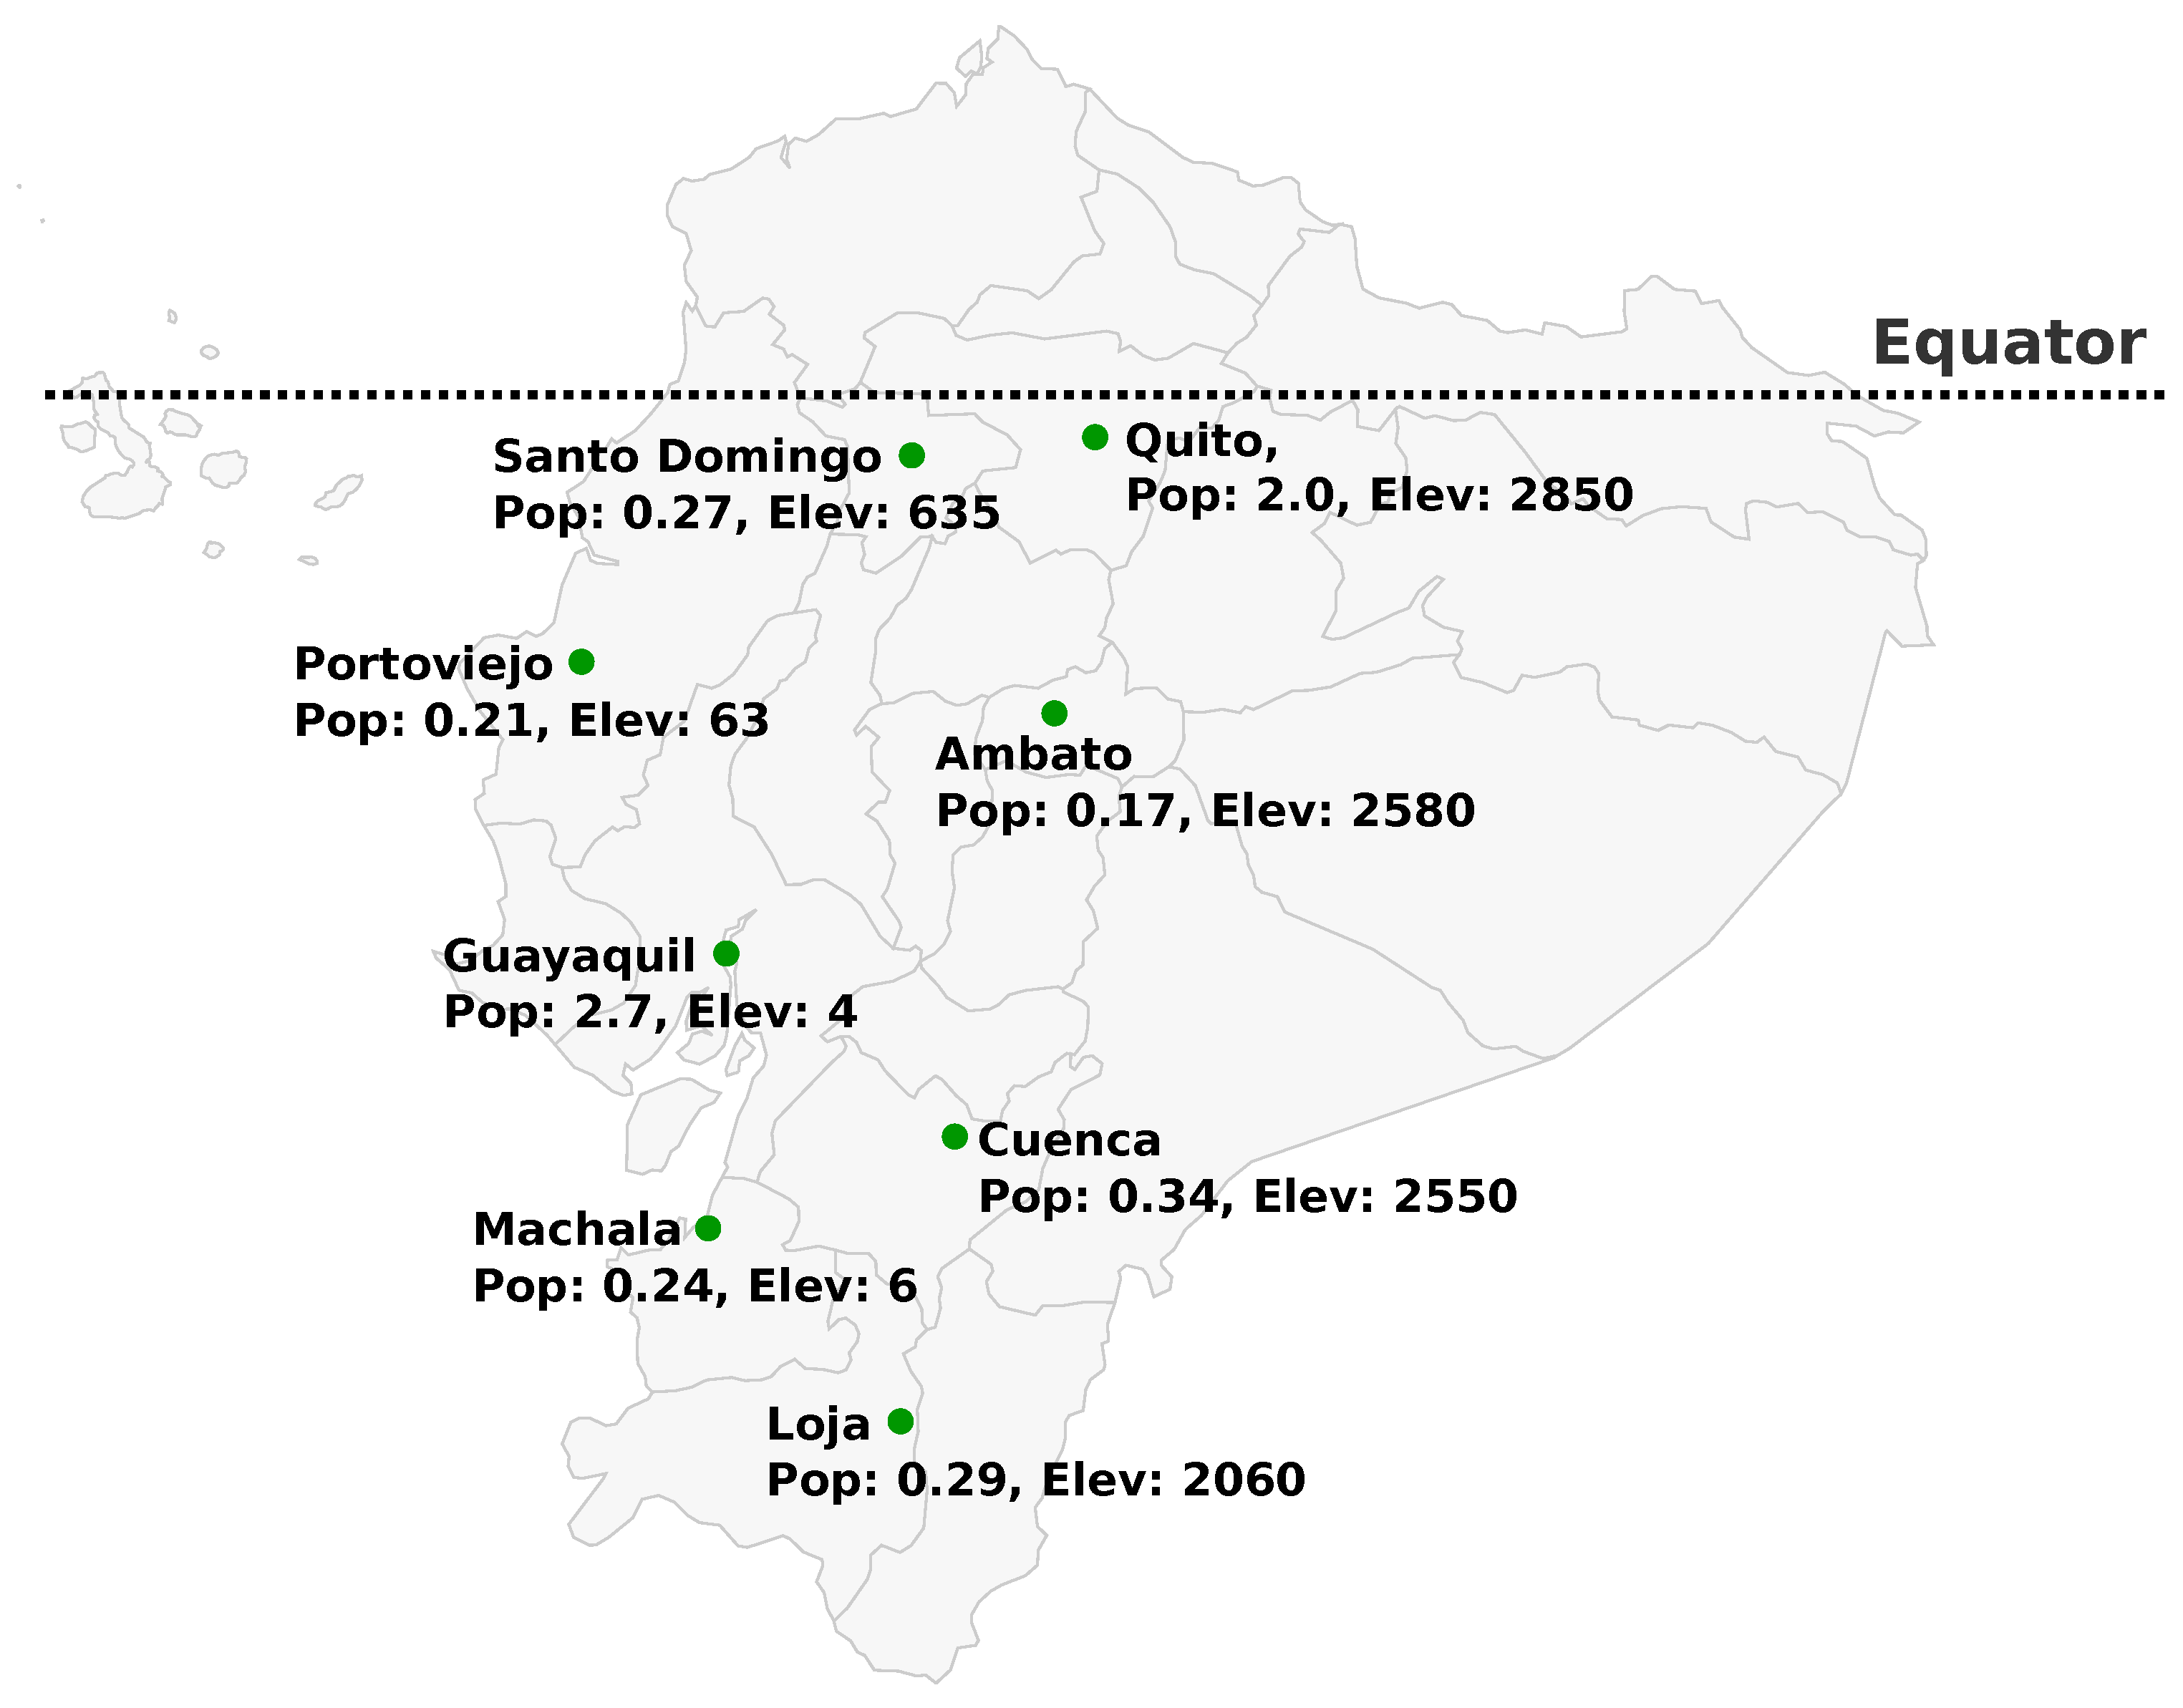
The authors have selected Ecuador’s case study since, firstly, we had the available information of the most populated cities in the country that are distributed in different regions. Moreover, this is a particularly interesting case study since the equatorial line crosses the country, so the influence of the local climate and the geographical position can influence the optimal orientation and inclination of the solar insolation capturing surfaces. The characteristics of the selected cities are summarized in
Table 1 and the corresponding map is depicted in
Figure 1.
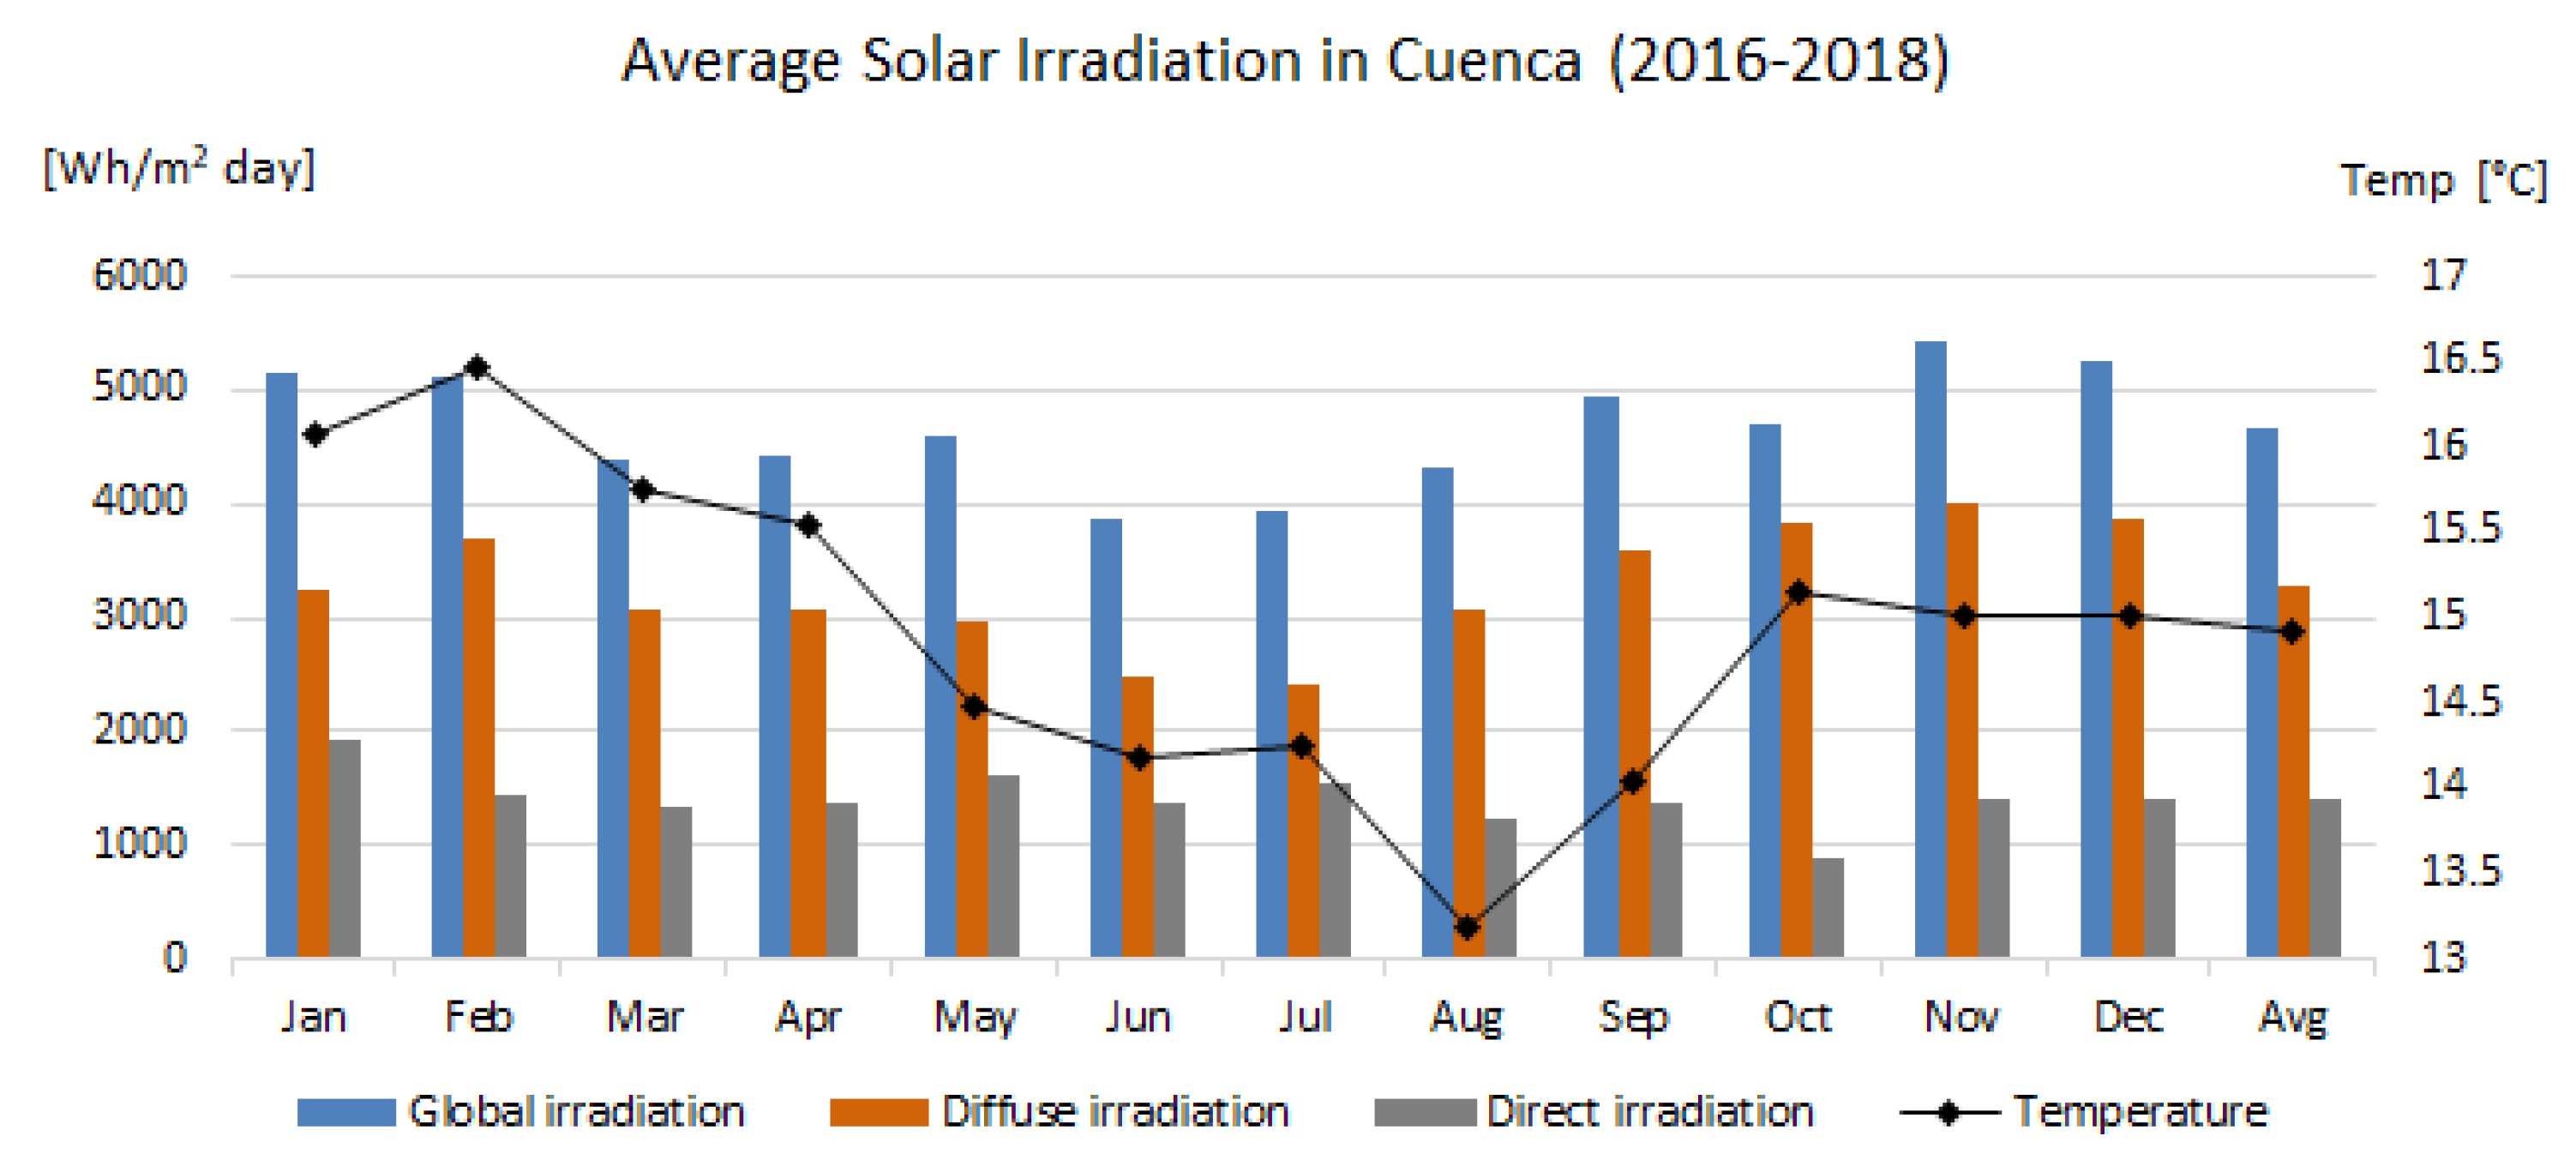
The collected data from the meteorological station of the Salesian Polytechnic University in the city of Cuenca have been tabulated in a statistical and mathematical analysis computer tool for its estimation and analysis as a function of time. In this analysis, each variable’s hourly and daily average has been carried out. This was performed with the data collected from 3 years spent in the meteorological station: 2016, 2017, and 2018. The following statistical analysis will be based on the variables of Global Radiation as Diffuse Radiation.
Table 2 summarizes the daily averages of each variable in the three years analyzed in the city of Cuenca, where it was found that, in 2016, the highest daily radiation was obtained with 4464.62 Wh/m
2. The year with the highest temperature is 2018 with a value of 15.28°.
Figure 2 summarizes the daily-monthly average of the studied variables, considering three years of data. It is noted that the month where there is the most significant amount of radiation is November with 5416.11 Wh/m
2. The highest temperature was 16.47°, in February.
For this analysis, TMY data were generated by the Geological and Energy Research Institute of Ecuador [
31]. These data come from the most populated cities in Ecuador, such as Quito, Guayaquil, Cuenca, Loja, Machala, Santo Domingo, Portoviejo, and Ambato. These cities are distributed in different regions of the country.
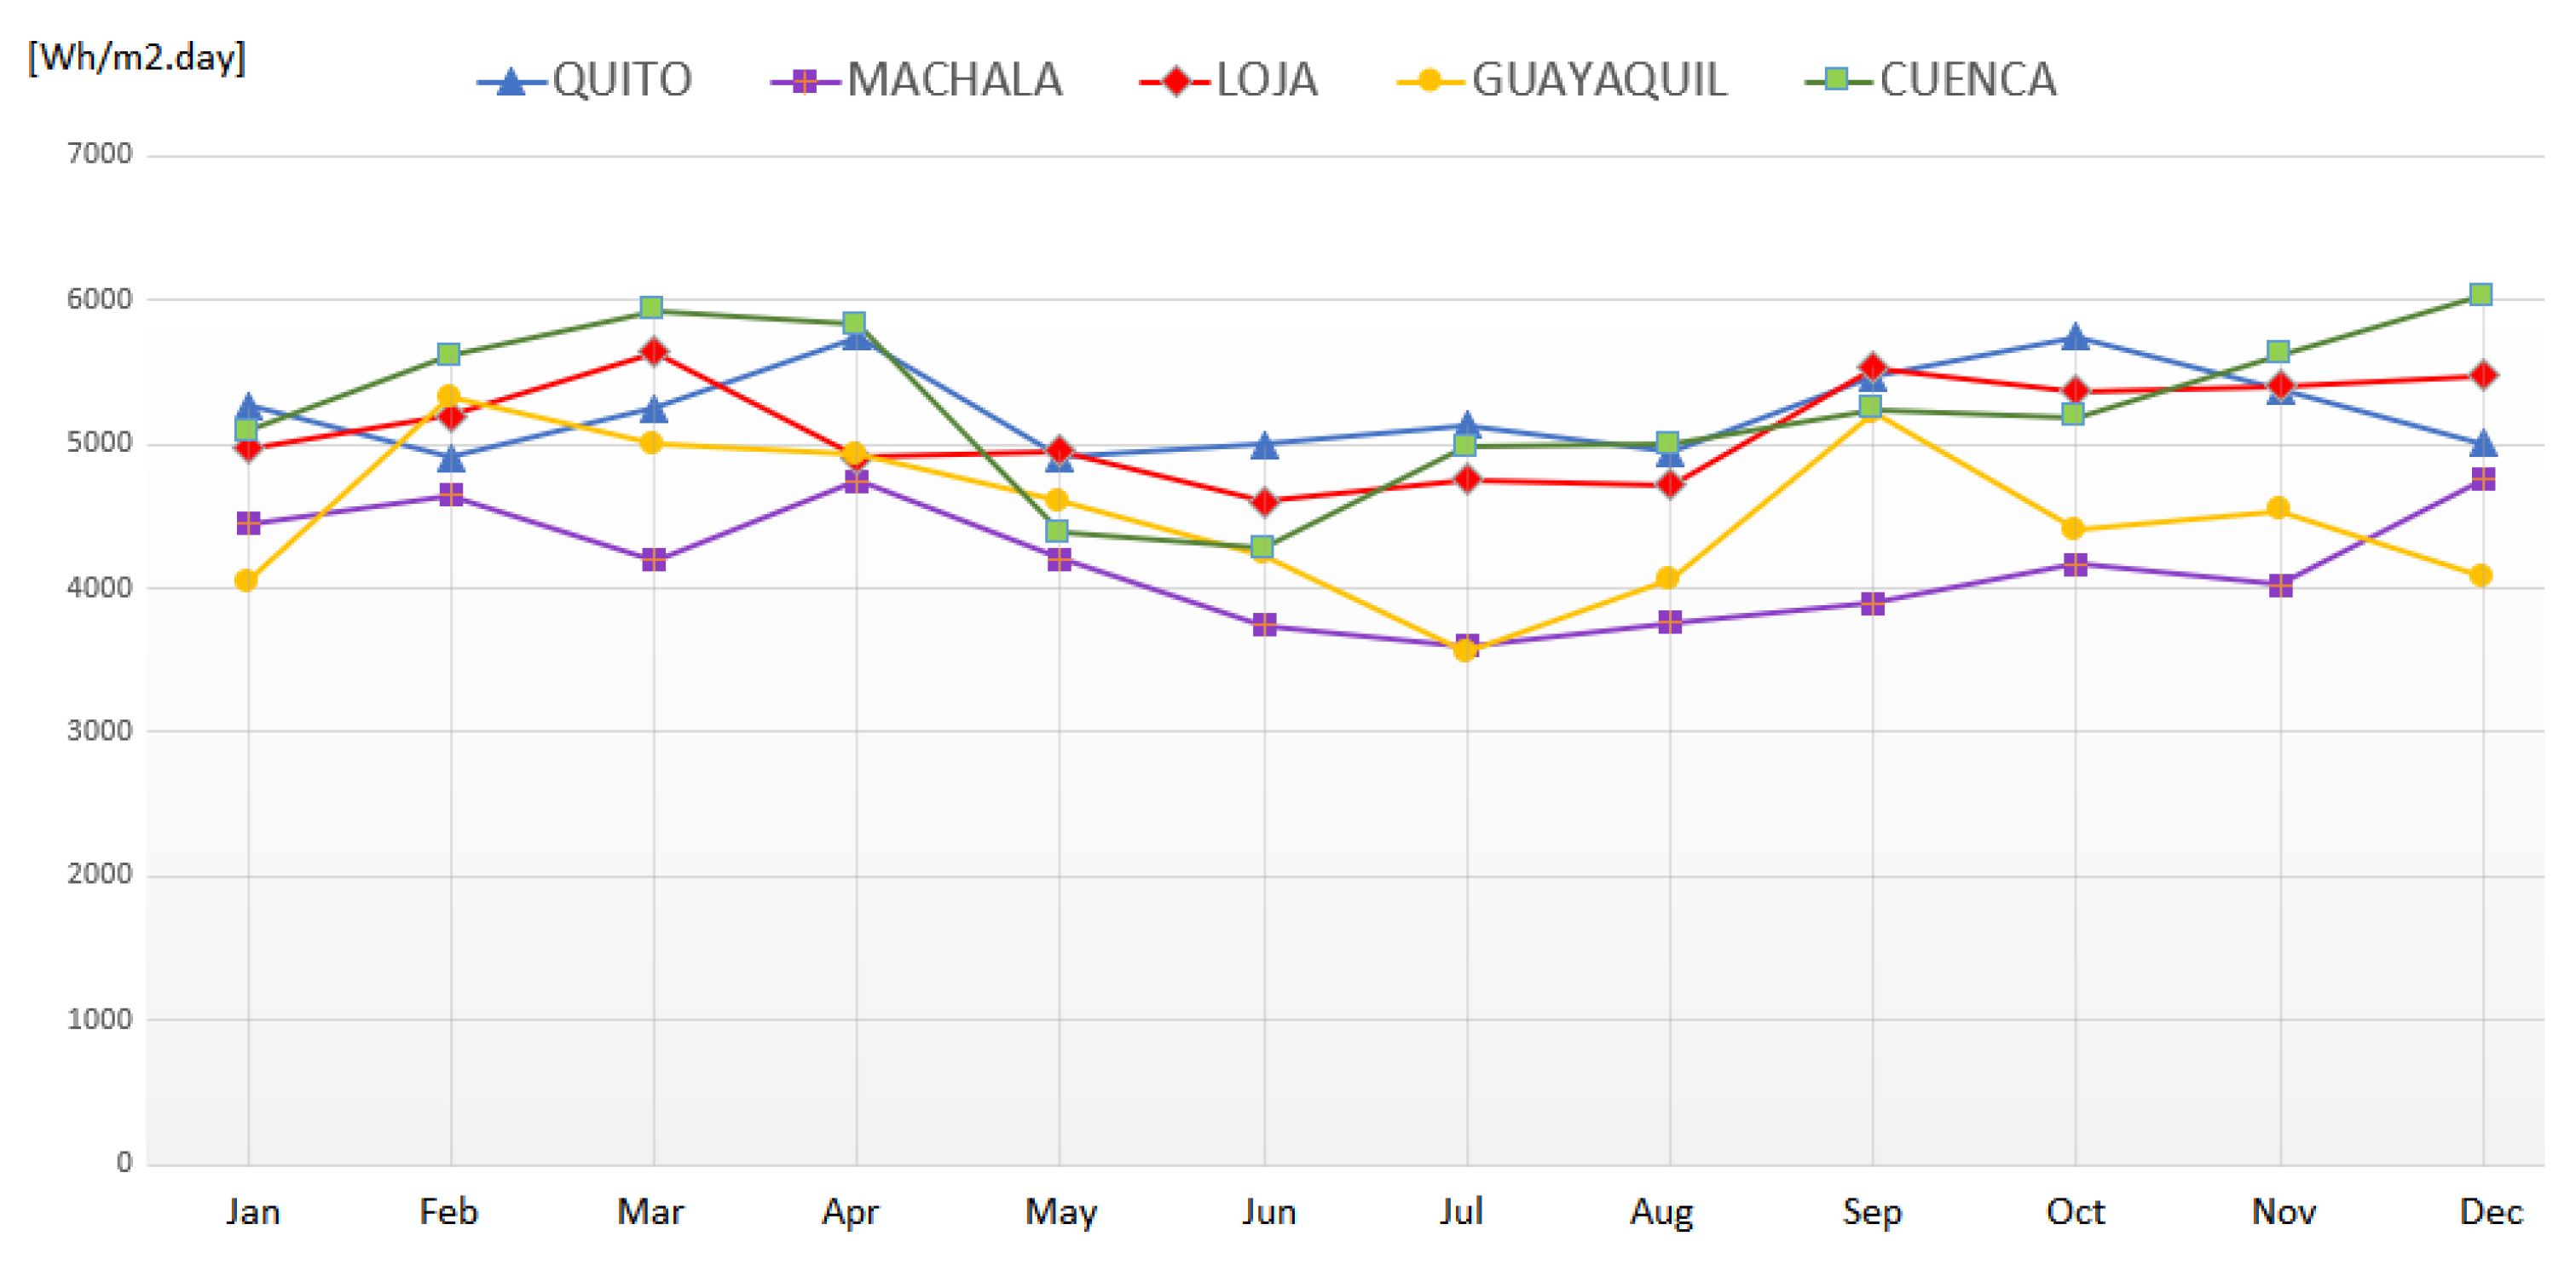
In
Figure 3, it is observed that, in the cities closest to the equator, climatic variables’ influence is not significant. The rainy season coincides with solar radiation coming from the north. MATLAB software uses different models to calculate the total insolation captured for a flat surface, giving as outputs the optimal tilt and orientation angles depending on the available climatic variables.
2.1. Isotropic Diffuse Model
The total solar irradiance is defined:
where
,
,
I are the components of beam, diffuse, and global insolation on a horizontal surface respectively,
is the ground reflectance and
,
, and
are their conversion factors. In this study, a constant ground reflectance (
) of 0.2 was considered.
For this work, four models were selected to determine solar insolation on flat surfaces. The selected models are Liu and Jordan, Temps and Coulsen, Klucher, and Pérez. They were selected considering that they are widely used in solar estimation works. Moreover, these models include three common model types: isotropic, anisotropic with two components, and anisotropic with three components [
21]. The description of the selected models is explained below.
2.2. Liu and Jordan Model
This is a basic model that considers that all-sky diffuse sky radiation is uniform over the skydome and that reflection on the ground is diffuse. With an isotropic diffuse sky condition, the total solar irradiance
is obtained [
7]:
where
is the angle of inclination.
2.3. Temps and Coulson Model
This model considers an isotropic diffuse sky but modifies the isotropic diffuse model by the sun’s path. The total solar irradiance
is defined [
32]:
where
is the angle of incidence of the sun, and its variation throughout the day is given by the following equation and defined as per:
where
is the angle of solar declination,
is the place latitude,
is the orientation angle, and
the angle of solar hour.
is the cenital angle and is defined as per:
2.4. Klucher Model
This model modifies the Temps and Coulson model, to be able to correct estimates of conditions in cloudy skies. The total solar irradiance is calculated [
33]:
where
F is the modulate function to correct the Temps and Coulson model.
2.5. Pérez Model
Pérez’s model divides diffuse insolation into three components: horizon zone, circumsolar zone and isotropic background. The diffuse irradiance is calculated [
34]:
where
is the circumsolar brightness coefficient, and
is the horizon brightness coefficient. These variables can be calculated as per:
where
is the sky clarity index and
is the brightness index.
The
f coefficients are summarized in
Table 3.
Then, in order to find the total irradiance, the following equation is considered:
The MATLAB software was used to develop an application that provides all the necessary tools to thoroughly analyze the data for the development of the application. Usually, a large amount of data is needed to obtain a higher value of exact maximum insolation on a flat surface. Moreover, the tool meshgrid, pol2cart, and contourf of MATLAB were used to produce the solar geometry ancillary data for different models.
3. Results and Discussion
3.1. Optimal Tilt and Orientation Angles
The developed application obtains a flat surface’s optimal position to capture solar energy in a given location. The results are based on the climate data introduced for each city (8760 h each year).
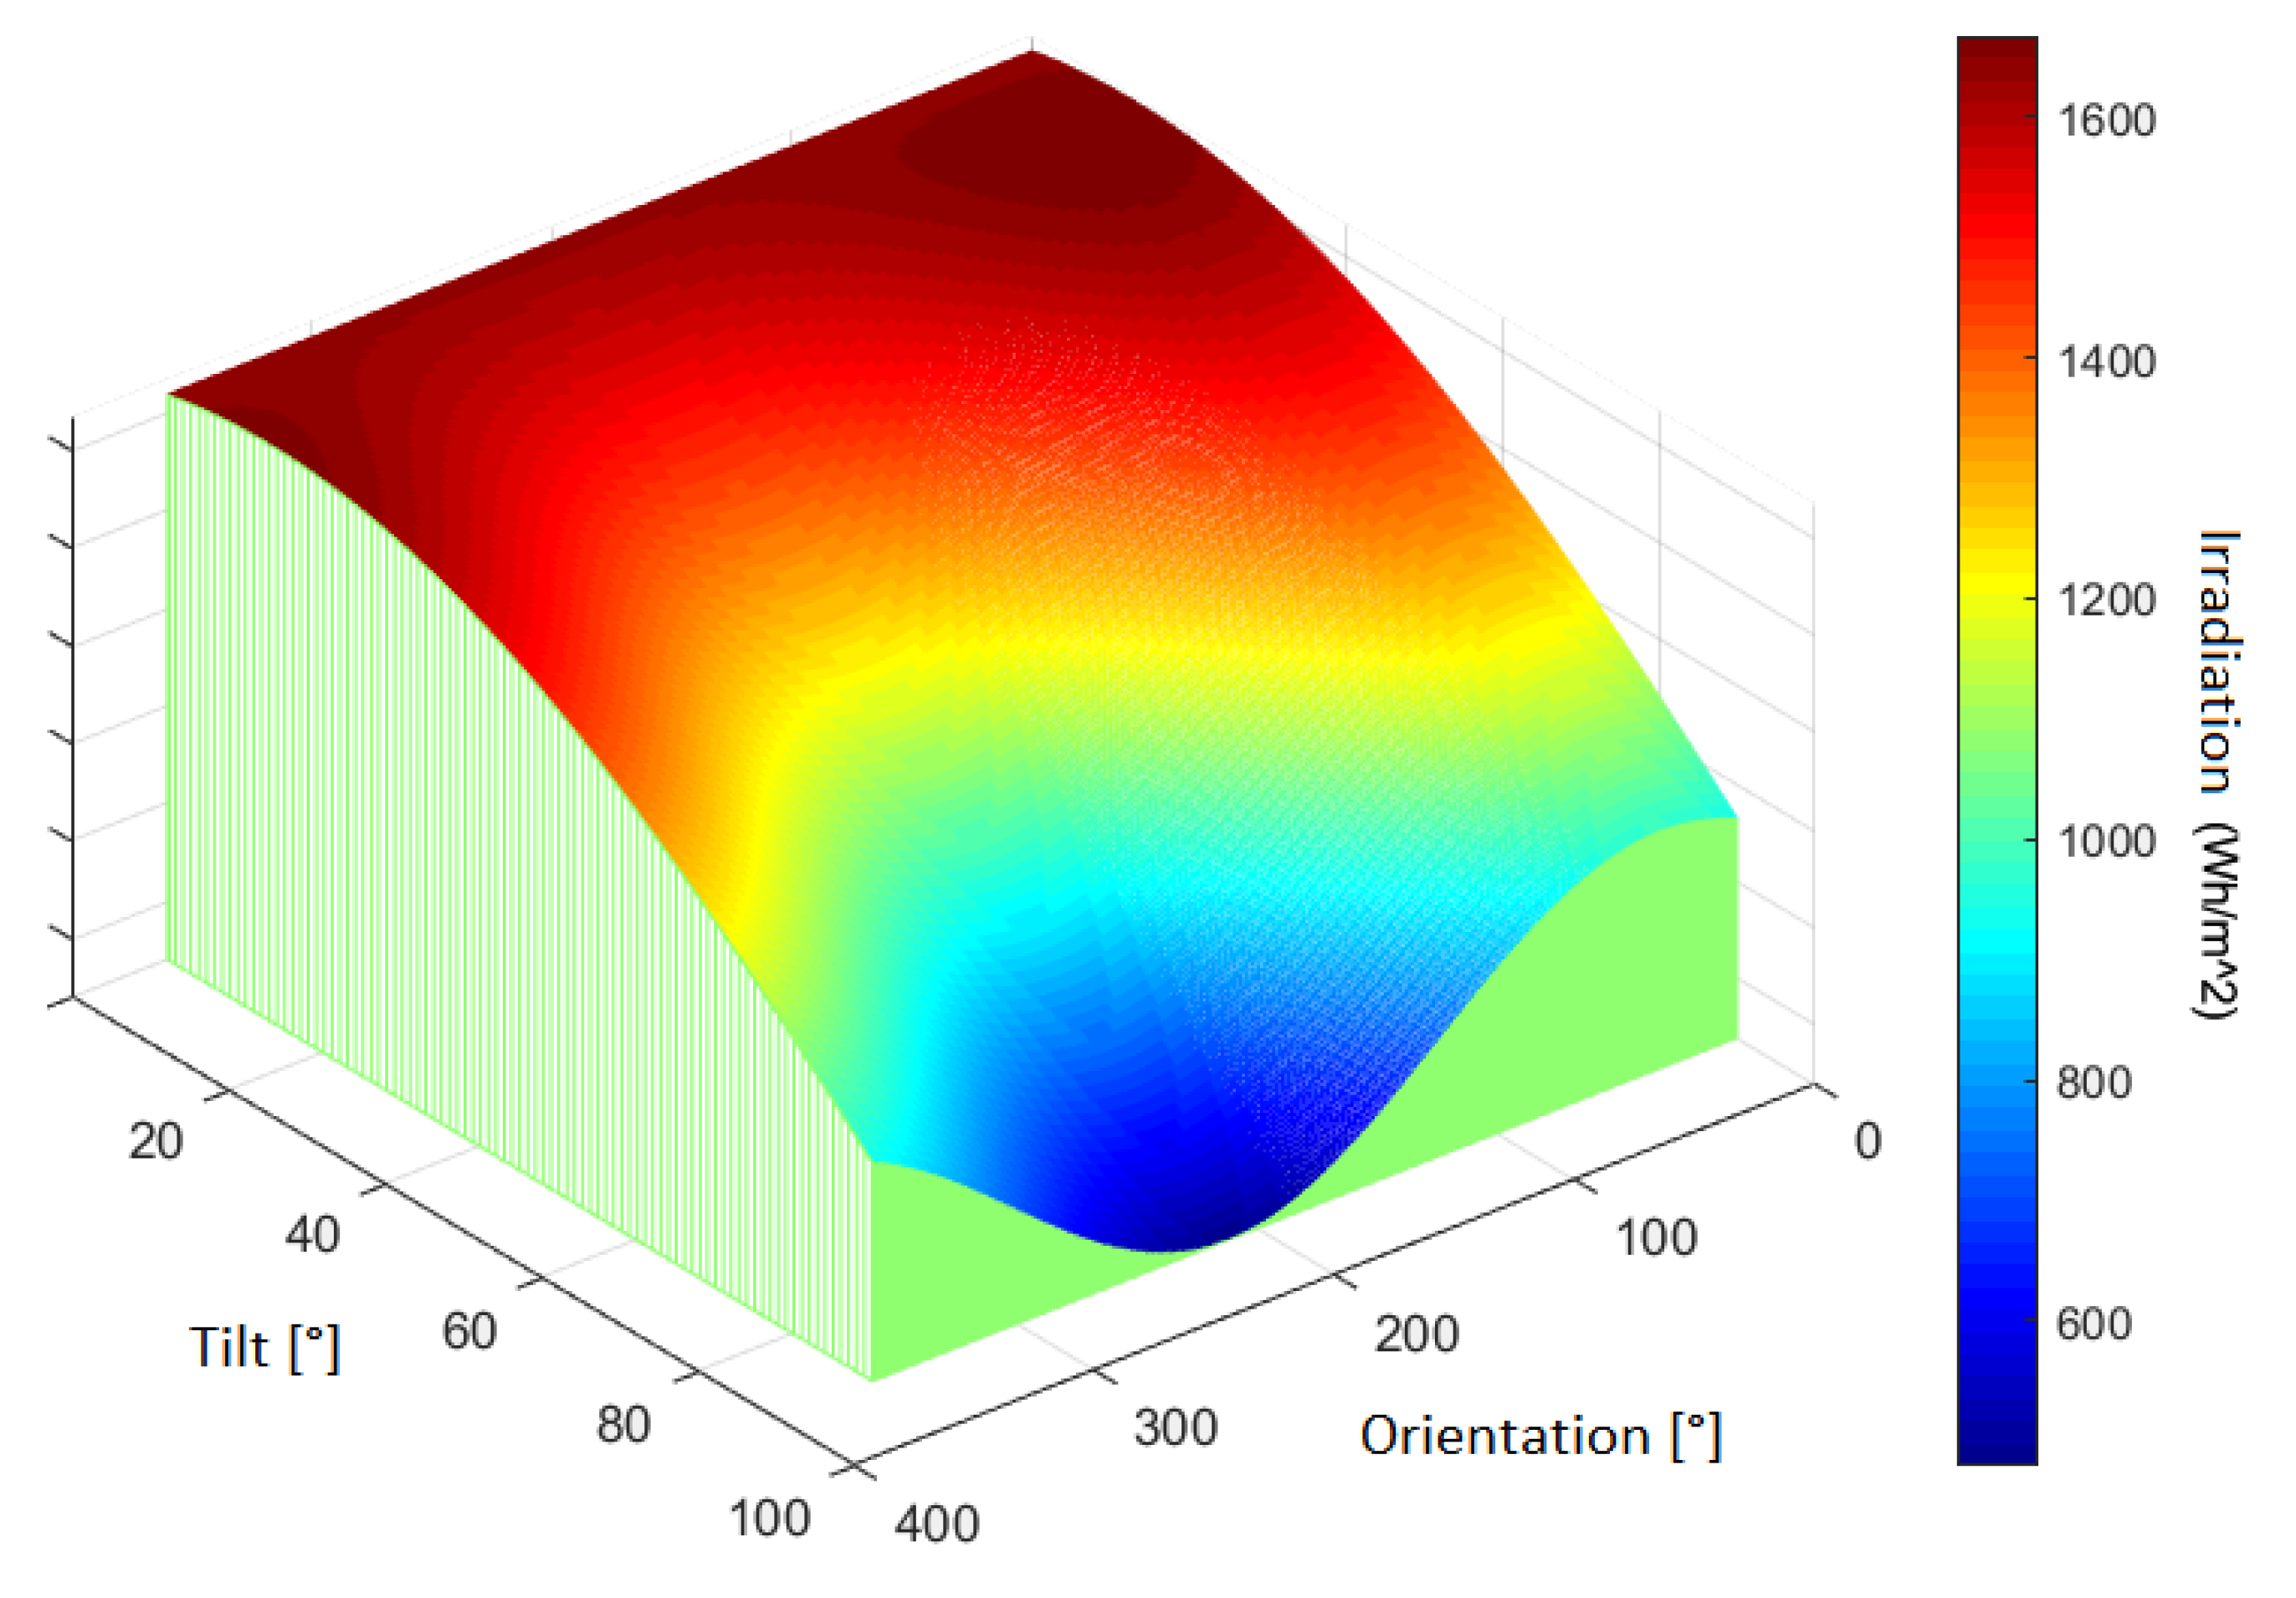
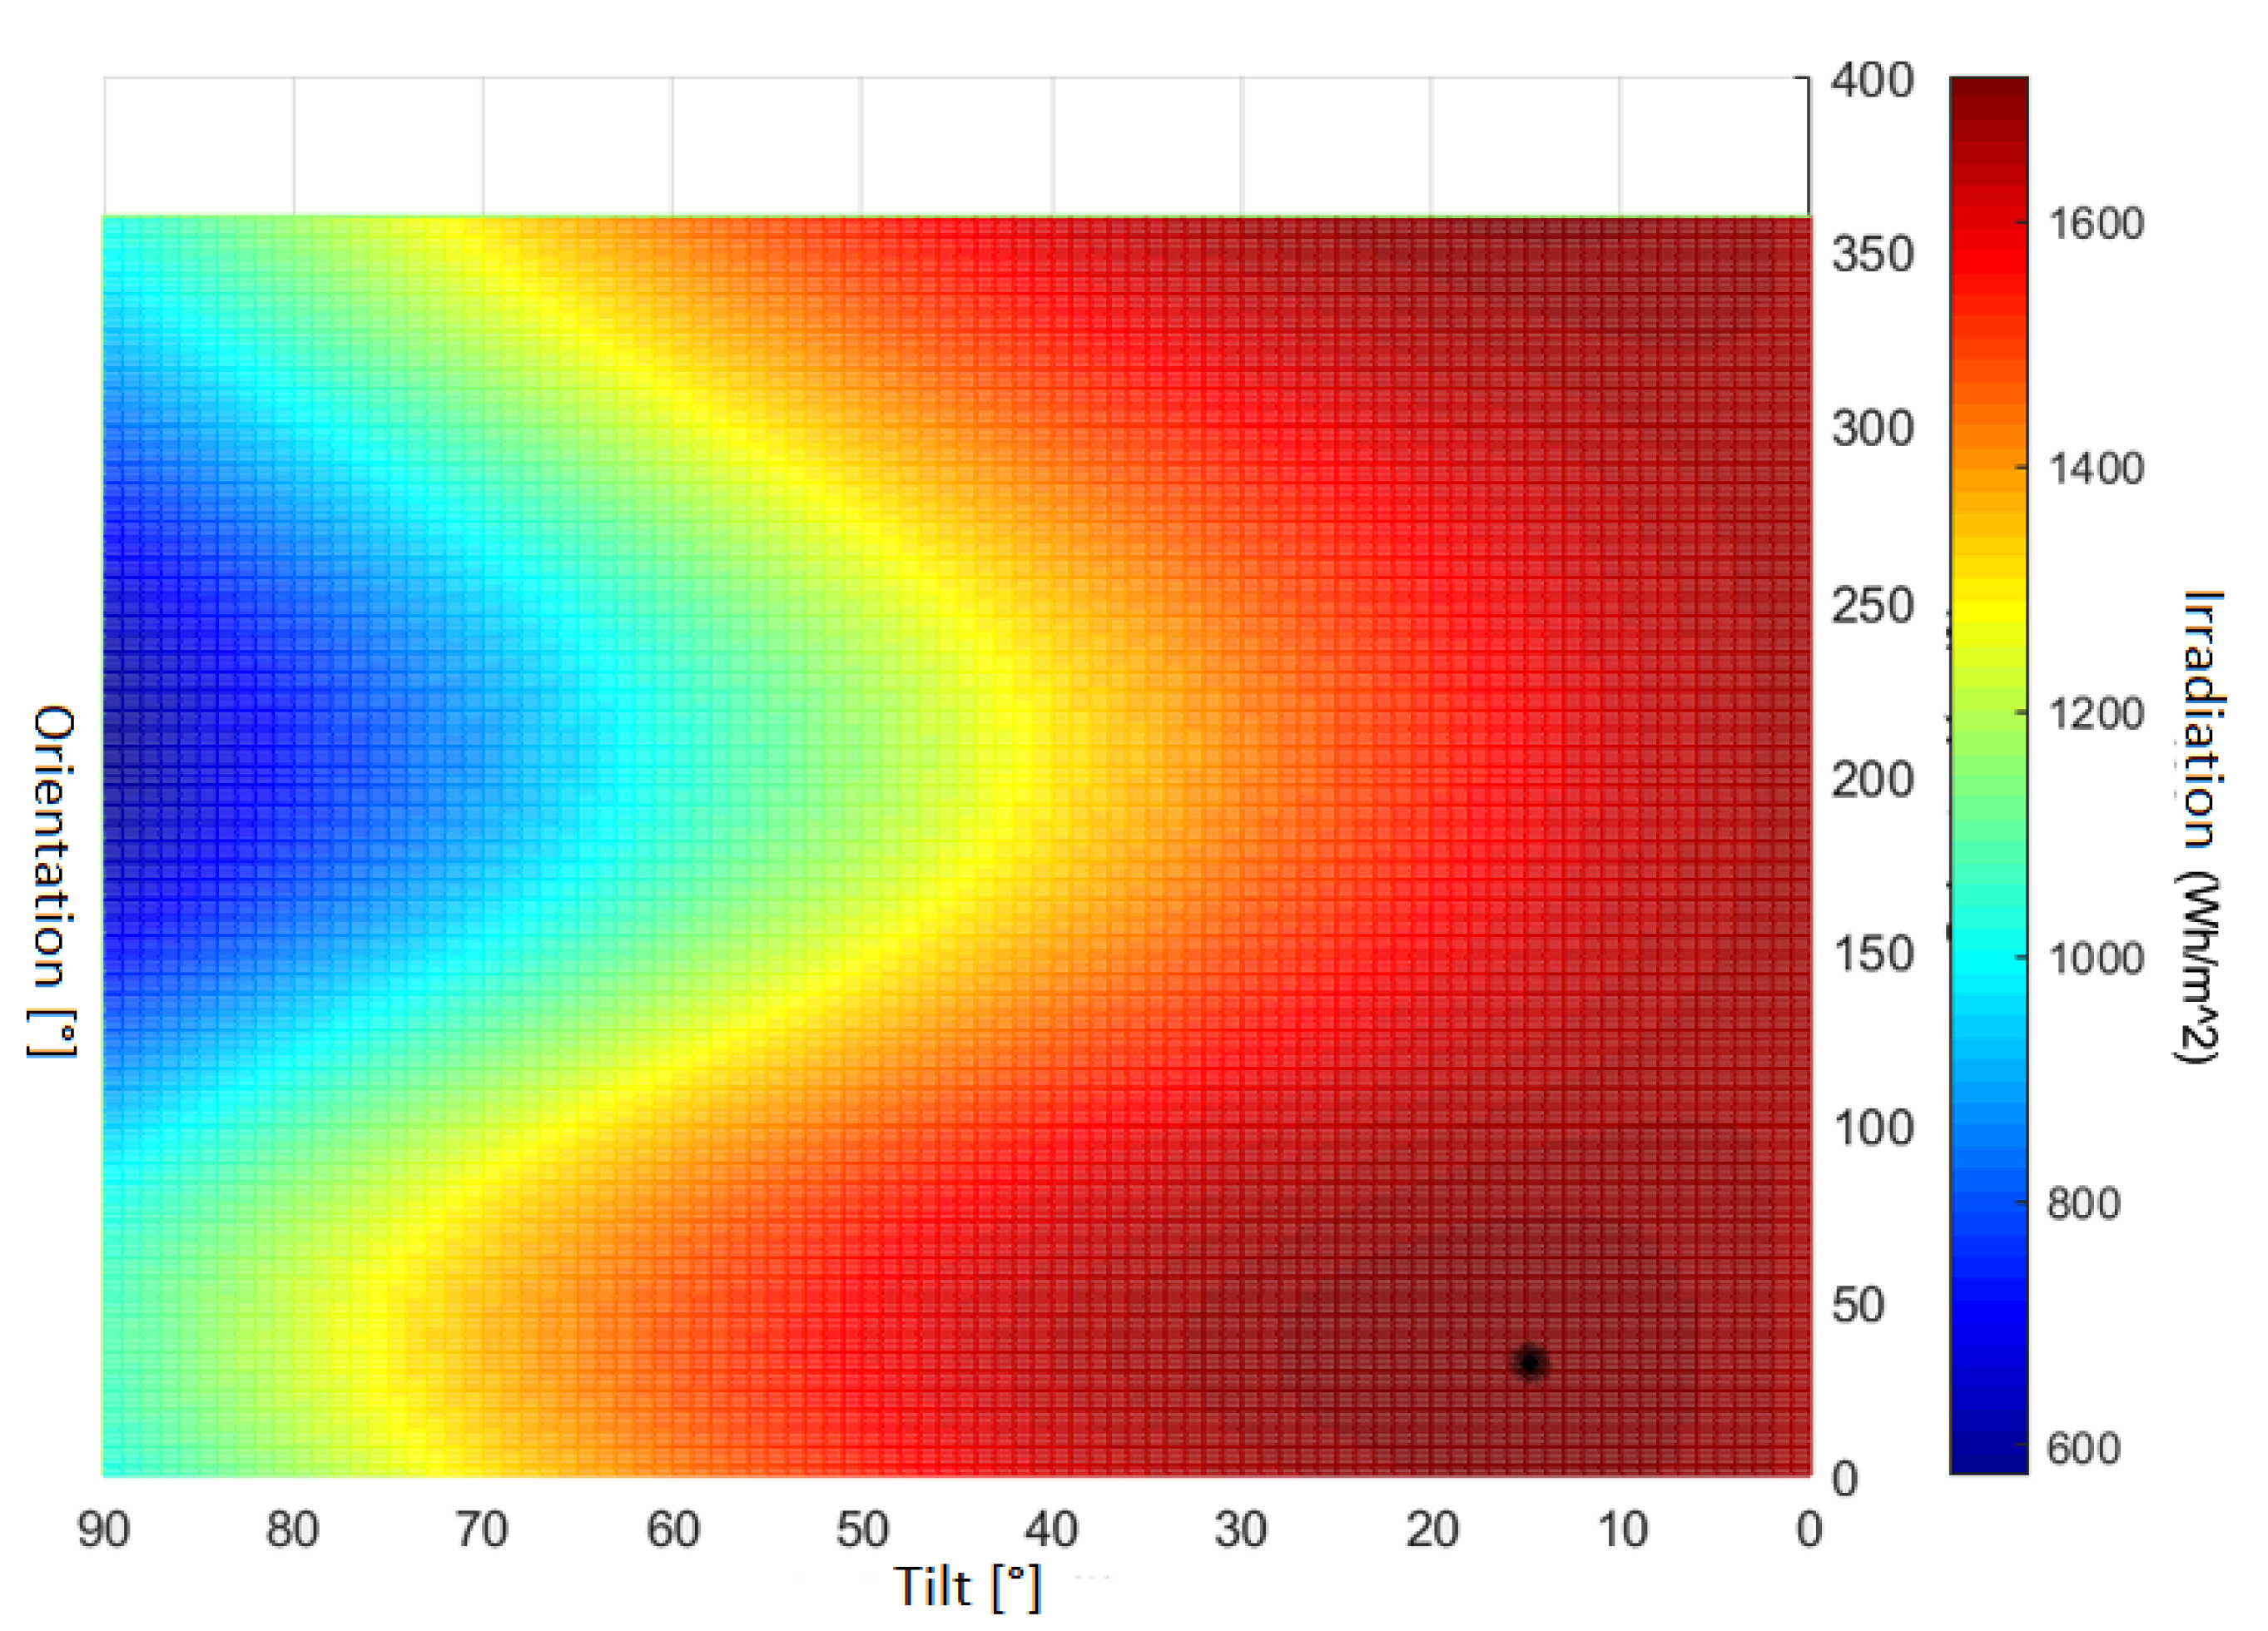
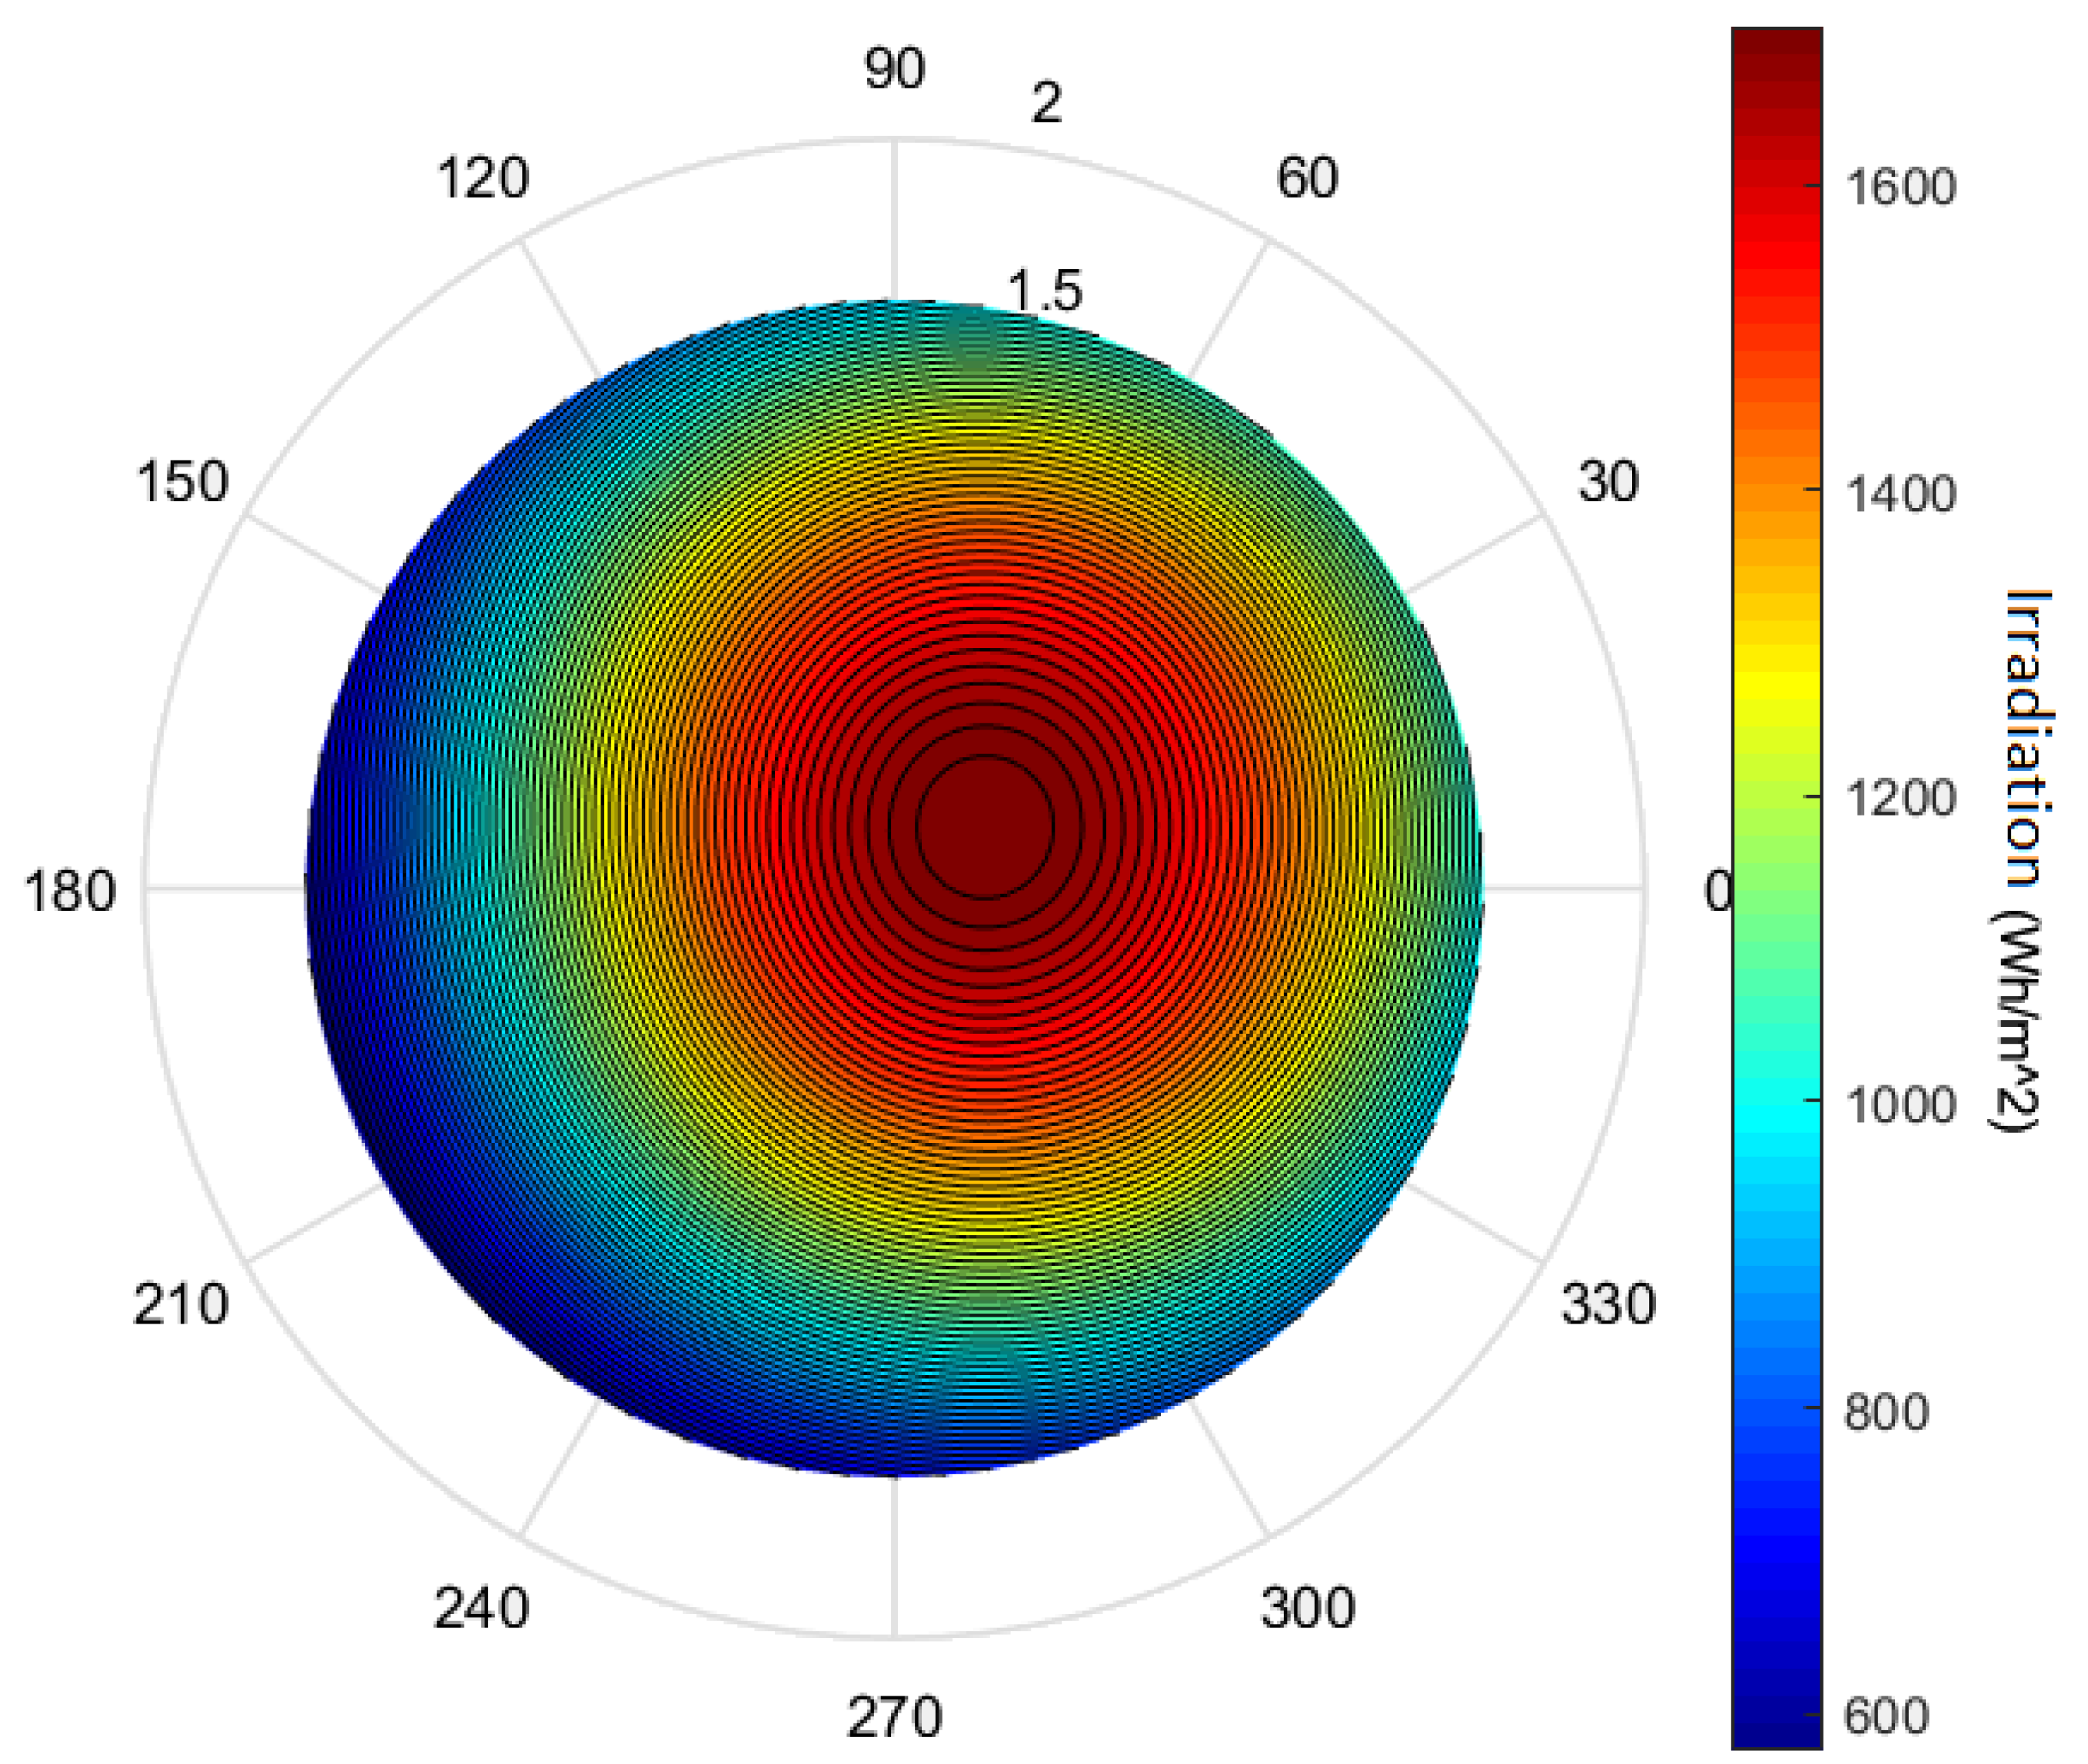
Figure 4 and
Figure 5 illustrate the captured irradiance on a flat surface in Cuenca-Ecuador according to the Klucher model.
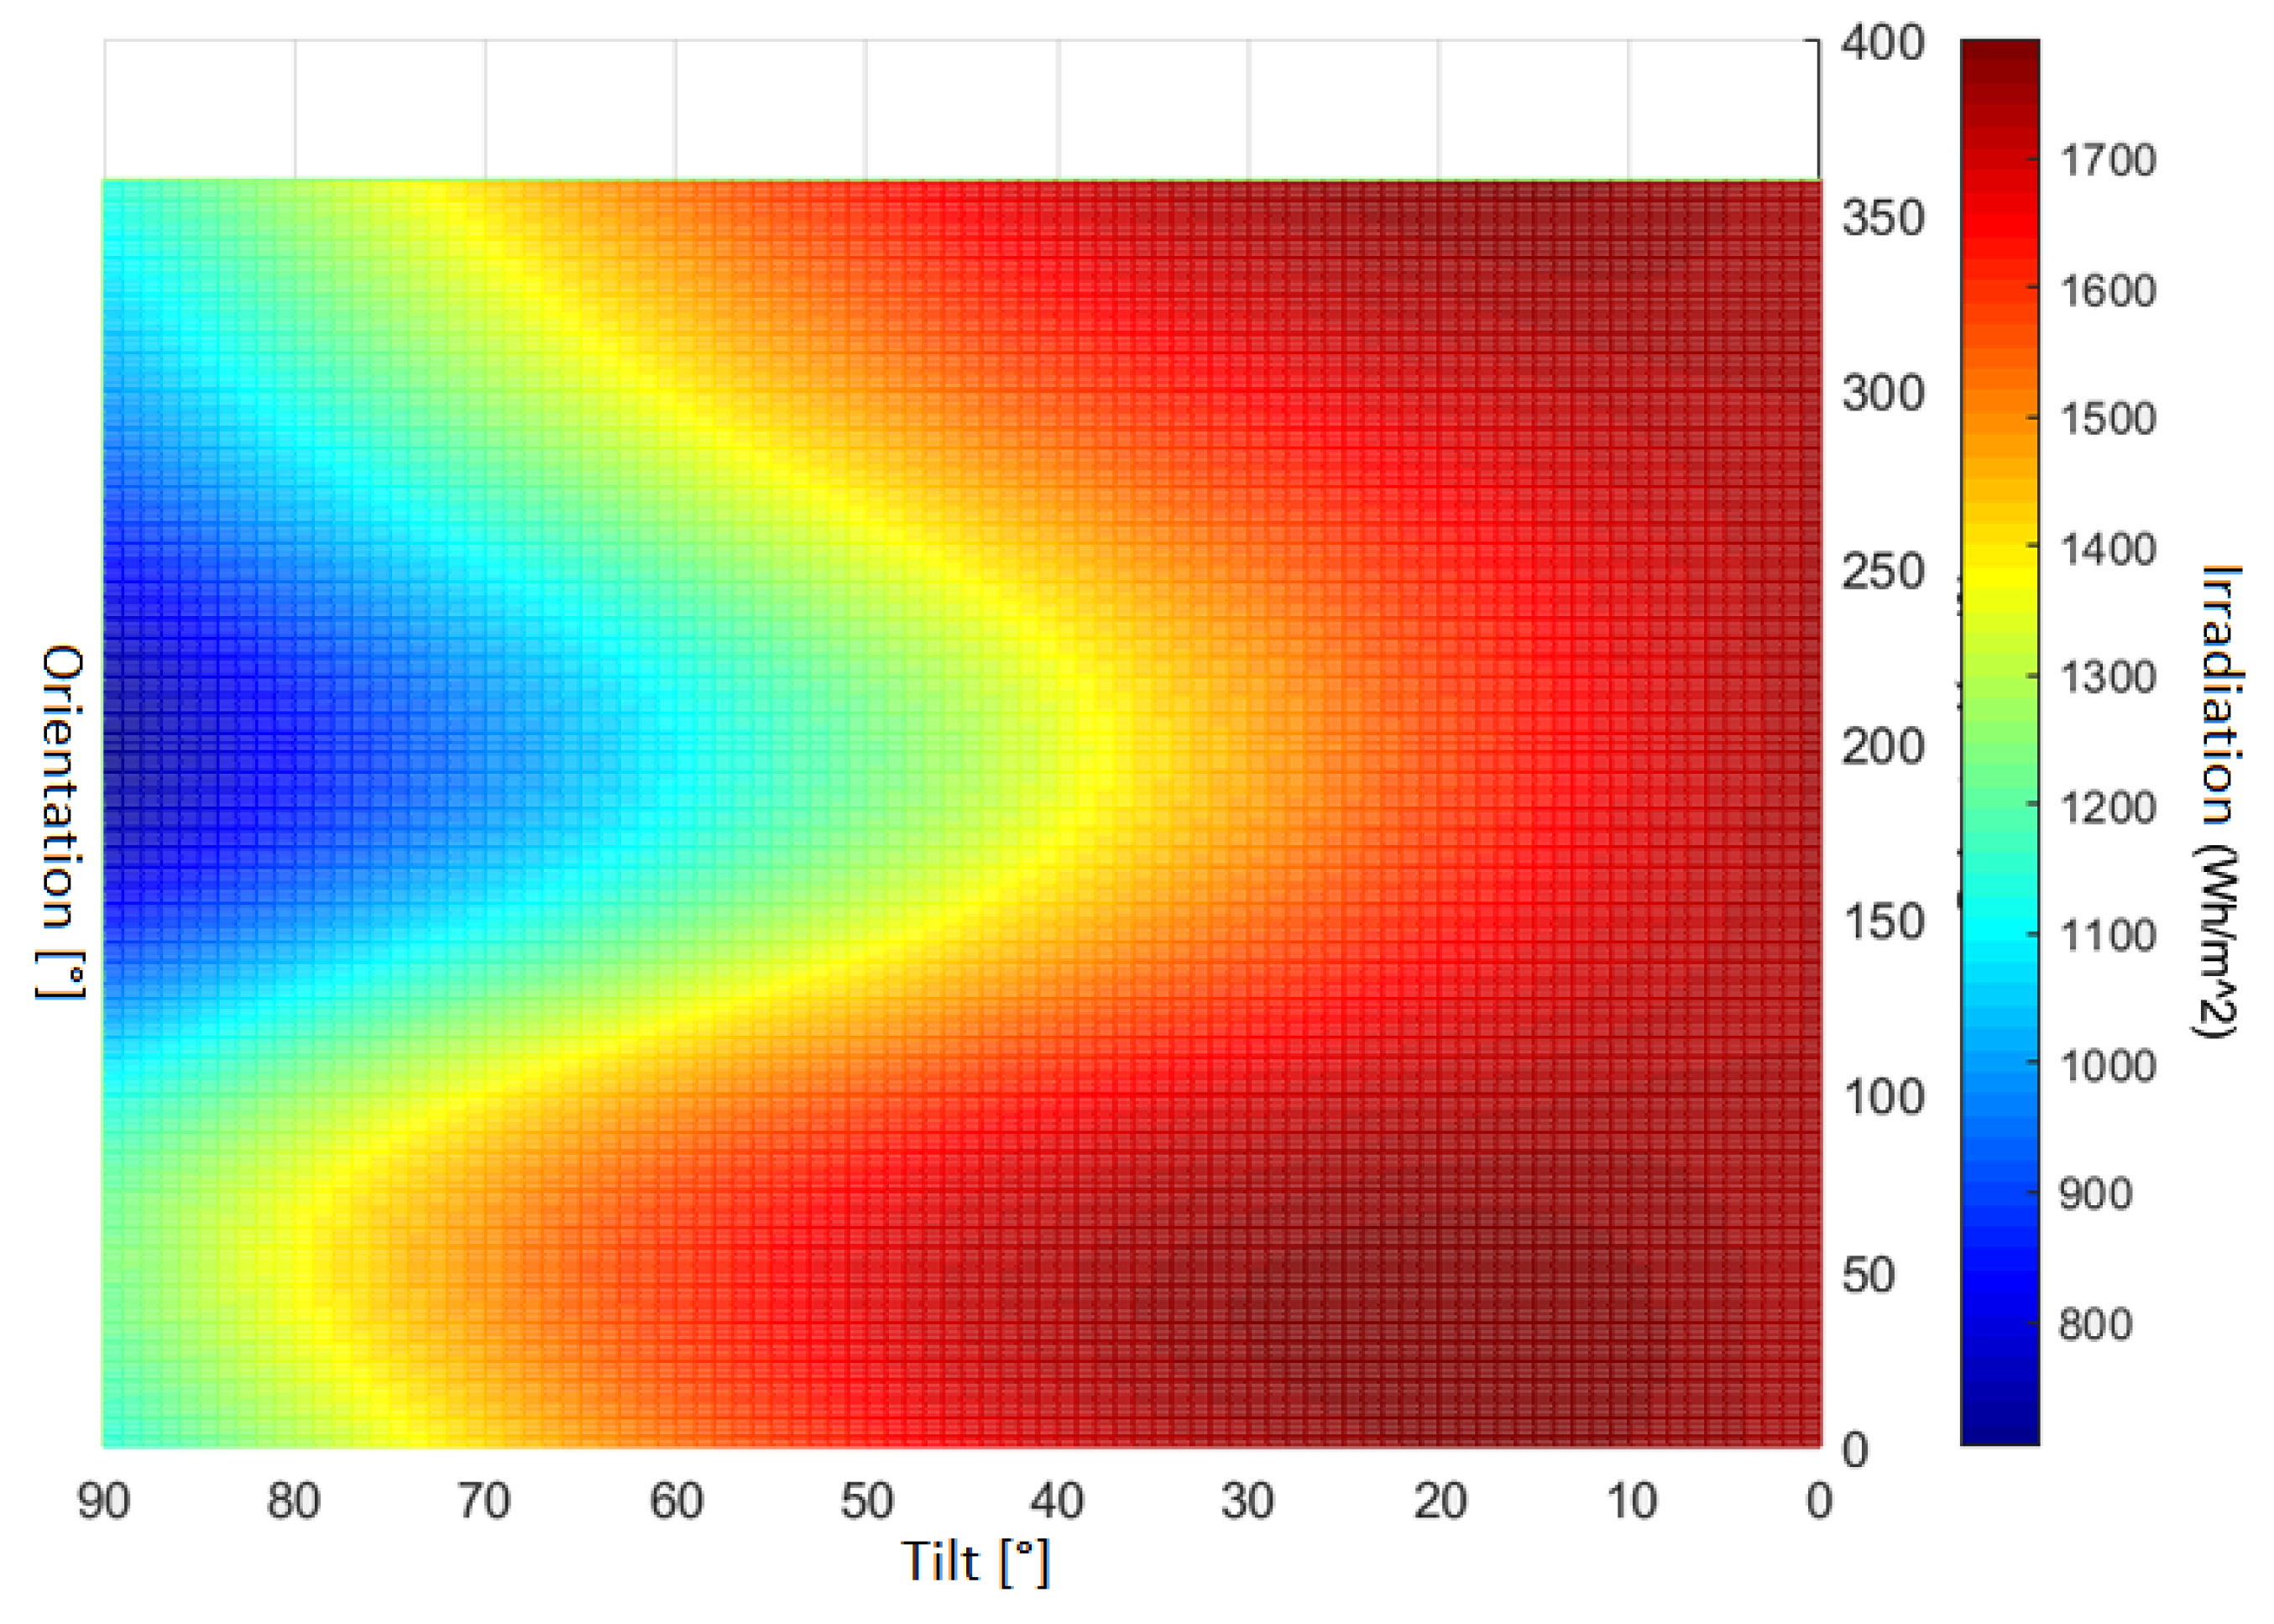
Figure 6 depicts the captured irradiance on a flat surface in Cuenca-Ecuador according to the Liu and Jordan model, and
Figure 7 depicts the captured irradiance on a flat surface in Cuenca-Ecuador according to the Temps model. With the mathematical models that have been analyzed through the application, similar results were obtained for the city of Cuenca with the measured data. Note that, for this locality, the more significant capture of solar insolation on a flat surface has an orientation of 34° concerning the north and an inclination angle of 16°.
The five mathematical models obtain the optimal inclinations and orientations to capture solar irradiation. However, it is essential to consider that the Klucher and Pérez models are the most complex and, at the same time, the ones that best adjust to real conditions since they improve the previously existing models. In the case of the Klucher model, it has been selected since it is based on the excellent prediction for clear sky conditions of Temps and Coulson model but with the addition of a “modulating function” to correct it under conditions cloudy sky and thus have greater precision in values of this climatic condition. On the other hand, Pérez’s model is based on a detailed statistical analysis of the diffuse sky, dividing it into three components: horizon zone, circumsolar zone, and isotropic bottom.
On the other hand, with the TMY data, different results were obtained for Ecuador’s cities, as shown in
Table 4 and
Table 5.
From the mathematical models, each city’s variation in Ecuador is clearly shown, taking into account the typical year files’ error. Note that these values are taken with a −1% margin of the maximum insolation value to obtain tilt and orientation range results closer to the measured data values.
3.2. Assessment of the Selected Models
The study used data obtained in 3 years from the city of Cuenca through the Salesian Polytechnic University’s meteorological station (real-data were taken every hour for three years). To minimize the errors, data from the city of Cuenca were used in a TMY file. Its source is an estimate based on data collected by satellite of previous years.
A comparison and post evaluation of this type of file is carried out together with the data or values measured locally by Ecuador’s meteorological stations. It will be essential to know what percentages of effectiveness have this type of file and present a comparison based on the models proposed for various Ecuador cities.
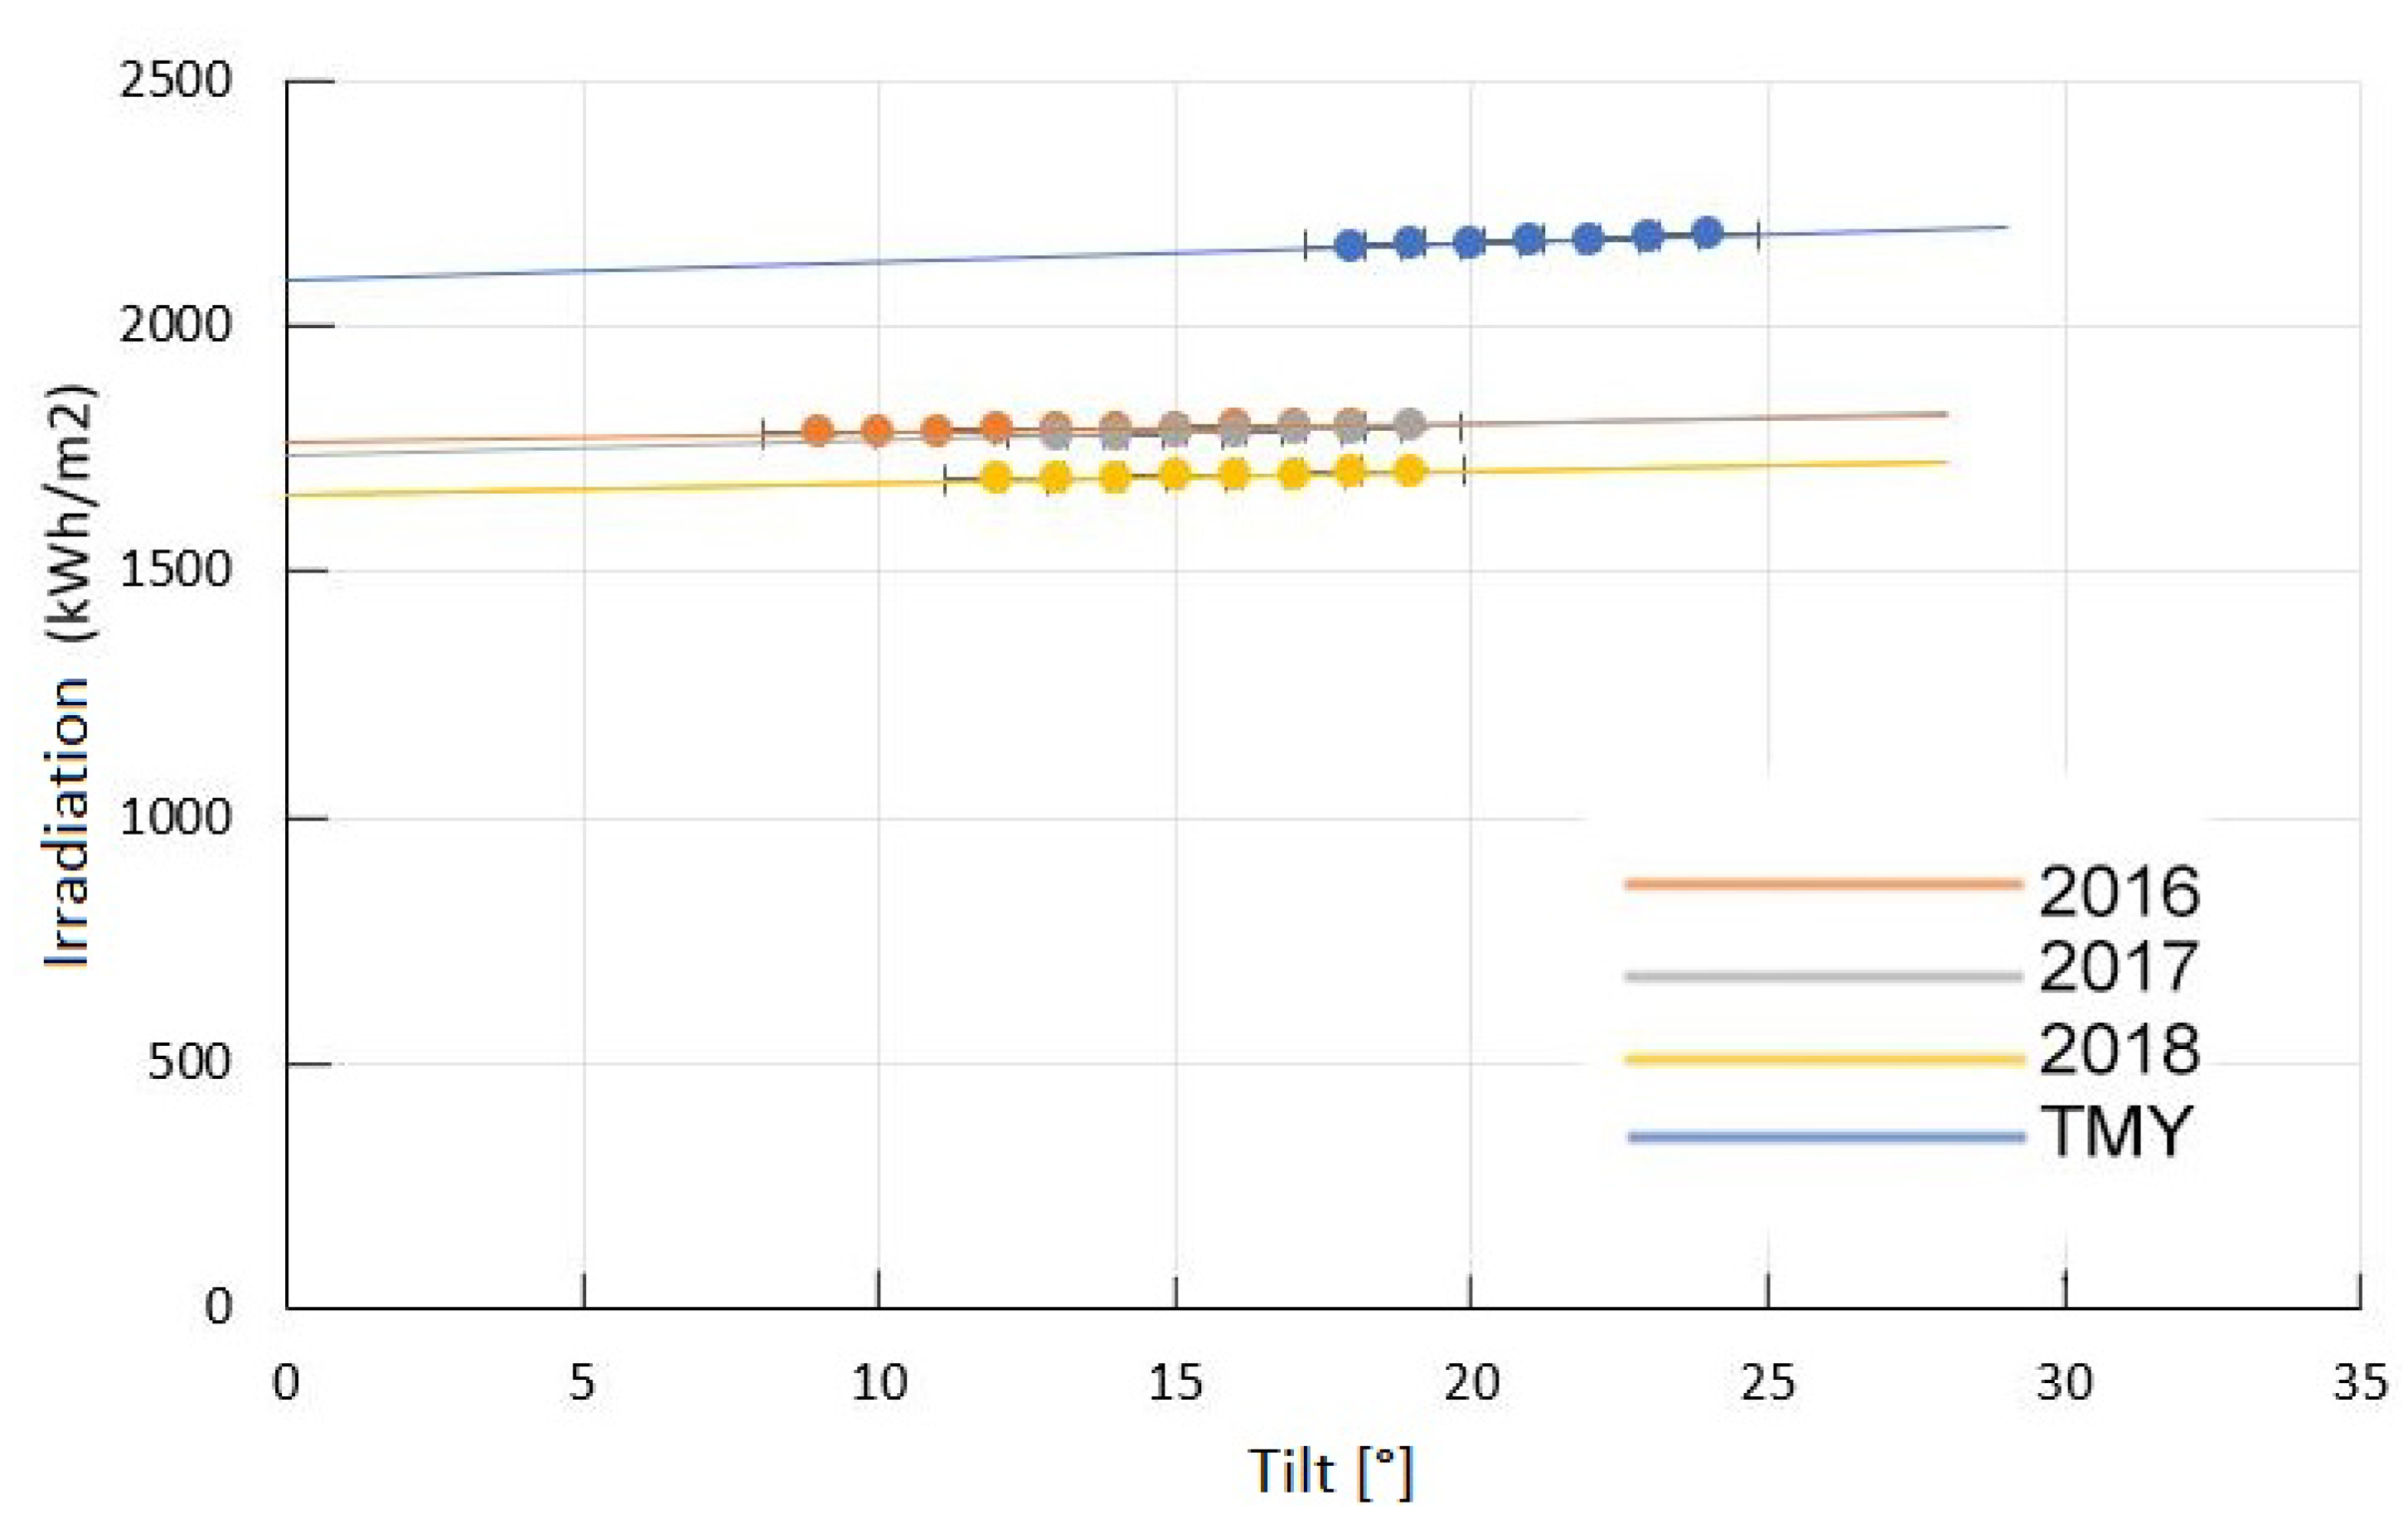
Figure 8 shows the difference in insolation and inclination between the measured data and a TMY, with a margin of error in the insolation of 19.11% and in the inclination of 22.2%. These values are obtained from the error percentage formula, with a −1% margin of the maximum insolation value in each case. These results are in concordance with Reference [
35], where it is indicated that the difference between measured data and TMY data is between 8.89% and 23.75%.
3.3. Recommendations for the Optimal Orientation in Ecuador
The available literature indicates that countries located in the northern hemisphere should orient their solar panels or modules towards the southern hemisphere, and vice versa for the countries located in the southern hemisphere. This is not the case for countries situated in the equator, where some works, such as Reference [
36], suggest that the inclination should be 0°. However, other works suggests that the inclination angle should not be less than 5° to avoid dirtiness on the PV panels. Moreover, other works demonstrated that, in Quitoand Latacunga, an angle higher than 30° will result in significant losses [
37,
38].
Similarly, the authors of Reference [
39] analyzed various inclination angles in Cuenca (from 0° to 30°) and evidenced that the losses become significant close to 30°.
The authors of Reference [
40] establish that the PV system site has a higher annual generation as it faces east with a slope close to the horizontal, but without significant differences with respect to the rest of the orientations with similar slopes. This indicates that, in equatorial latitudes, the inclination and orientation is not an important limitation in the production of energy based on solar systems, as it happens in higher latitudes, such as those of Europe, the United States, Argentina, or Australia.
Thus, each author has it own criteria to select the optimal orientation and inclination angles. In this work, the optimal angles of the most populated cities were obtained based on the presented models.
3.4. Discussion
Since existing real-data from solar irradiance was used in these existing mathematical models, one can assume adequate results. The uncertainty derived from the input data on the model should then be assessed before the model output is assessed.
Particular technical challenges need to be considered to implement the optimal tilt and orientation angles while installing PVs, such as physical space availability and ideal installation conditions with shadow-free.
Although the presented models and others could present accurate results for tilt and orientation angles in fixed flat surfaces, it is crucial to note that some input parameters could have a strong influence on the irradiance data. For example, other parameters, such as relative humidity, cloud coverage, and cloud base, could impact irradiance data, which could be taken into account in future works.
Observe also that anisotropic methods could be unable to mimic the anisotropy of real skies, especially partly cloudy skies or those observed under elevated turbidity conditions. Thus, various accurate solutions exist to model spectral/broadband irradiance on sloped surfaces, such as the Unisky Simulator [
41]. This tool provides the maps of zenith-normalized spectral sky radiances and can model random distributions, as well as statistical averaging over random distributions [
42].
Optimum tilt angle strongly depends on momentary cloudiness and turbidity conditions. Aerosols can change the angular distribution of scattered electromagnetic radiation significantly. For instance, a forward-lobed scattering is typical for large particles, while the ratio of side-to-forward scattering increases as the particles become smaller in size. Therefore, knowledge of particle size distribution (or at least PM1.0) may be crucial to understanding diffuse light distribution dynamics.
For a country, such as Ecuador, where there are significant changes in weather conditions across cities due to geographic conditions, it is not representative for the entire country to estimate a single average optimum tilt angle.
Overall, the results obtained indicate that, in Ecuador, the optimum inclination of a flat surface should be between 12° and 19° concerning the horizontal and the orientation between 20° and 60° concerning the North. However, although the results are congruent, the results would be more reliable with data measured in all cities since the TMY data could generate inaccuracies in the results. Additionally, in this work, the authors do not model hypothetically idealized skies.
4. Conclusions
This paper presents a computer application that determines the optimal tilt and orientation angles of flat surfaces to maximize solar insolation capture based on existing mathematical models. The most populated cities of Ecuador were selected for this study, since there are significant changes in weather conditions across cities due to geographic conditions, and it is not representative for the entire country to estimate a single average optimum tilt angle. The data was obtained through meteorological stations. The city of Cuenca was selected as a reference, and its data measured during three years from the local meteorological stations, comparing them with the TMY files of the same. Significant variations were observed in the various selected cities in all the variables studied. It should be noted that the typical year files are a database without updating and that their content will significantly affect the simulations and calculations carried out. Note that the most common and studied climate scenario currently predicts an increase between 1% and 3.49% in annual mean global temperatures.
The error in TMY files (which ranges between 22.2% in inclination and 19.11% in insolation values) must be taken into account while modeling. It is observed that the cities of the Sierra region—Quito, Cuenca, Loja, and Ambato—have a higher insolation index than the cities of the Costa region: Guayaquil, Santo Domingo, Machala, and Portoviejo. In this study, the inclination and orientation values together with those of maximum irradiance analyzed with data measured from meteorological stations have primarily coincided with other studies carried out mainly in the city of Cuenca, where the optimal inclination of a flat surface for maximizing insolation pickup is between 9° and 16°, and orientation between 20° and 60°.
In a future work, it could be helpful to analyze the effects of orientation and irradiance on DC power.


 ,
, 


