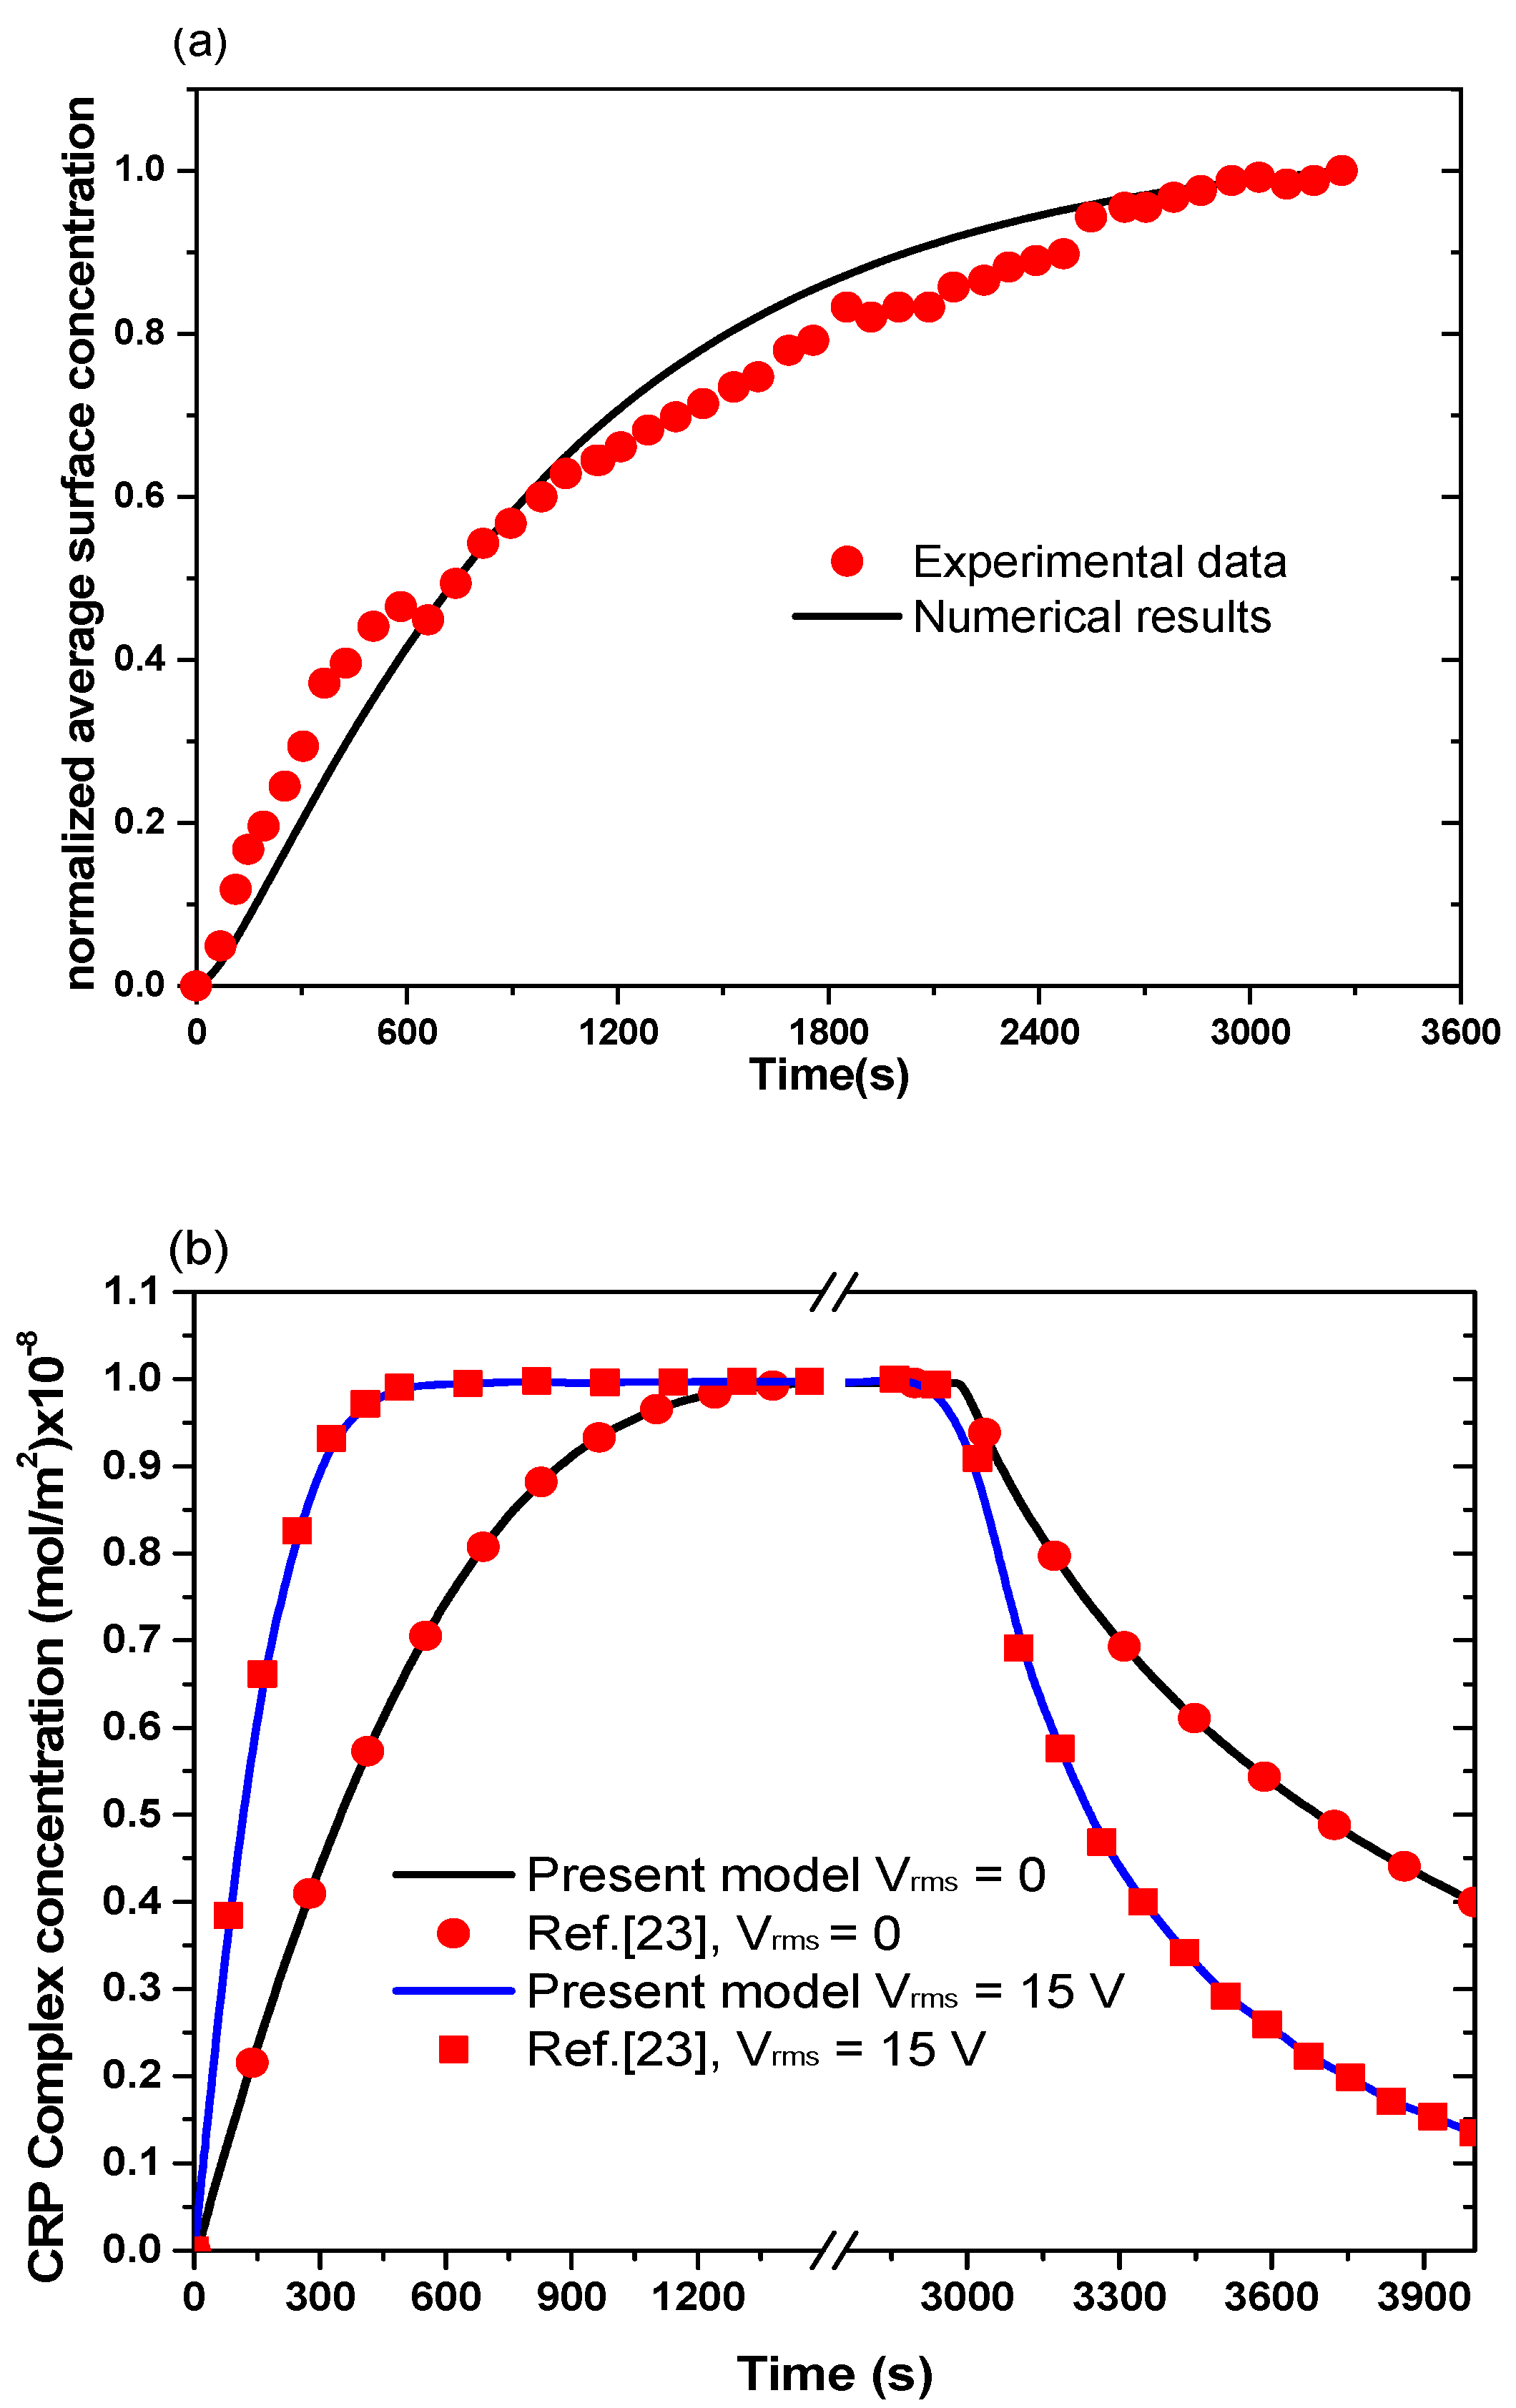
3.1. Model Validation
The chemical binding kinetics of the analyte (Anti-rabbit IgG) with the ligand (Rabbit IgG) at the reaction surface has been validated with experimental results of Hofmann et al. [
13] without confinement flow and for the case of no AC electric field.
Figure 2a presents the transient evolution of the normalized concentration of the complex. We notice good agreement between the simulation results with the experimental data of Hofmann et al. [
13].
Figure 2b compares the results obtained by the present studies with those obtained by Huang et al. [
23] in the cases without and with the electrothermal force. A good agreement has been observed. It should be noted that several components of the computation code has also been validated in our previous papers [
18,
19,
20,
21,
22].
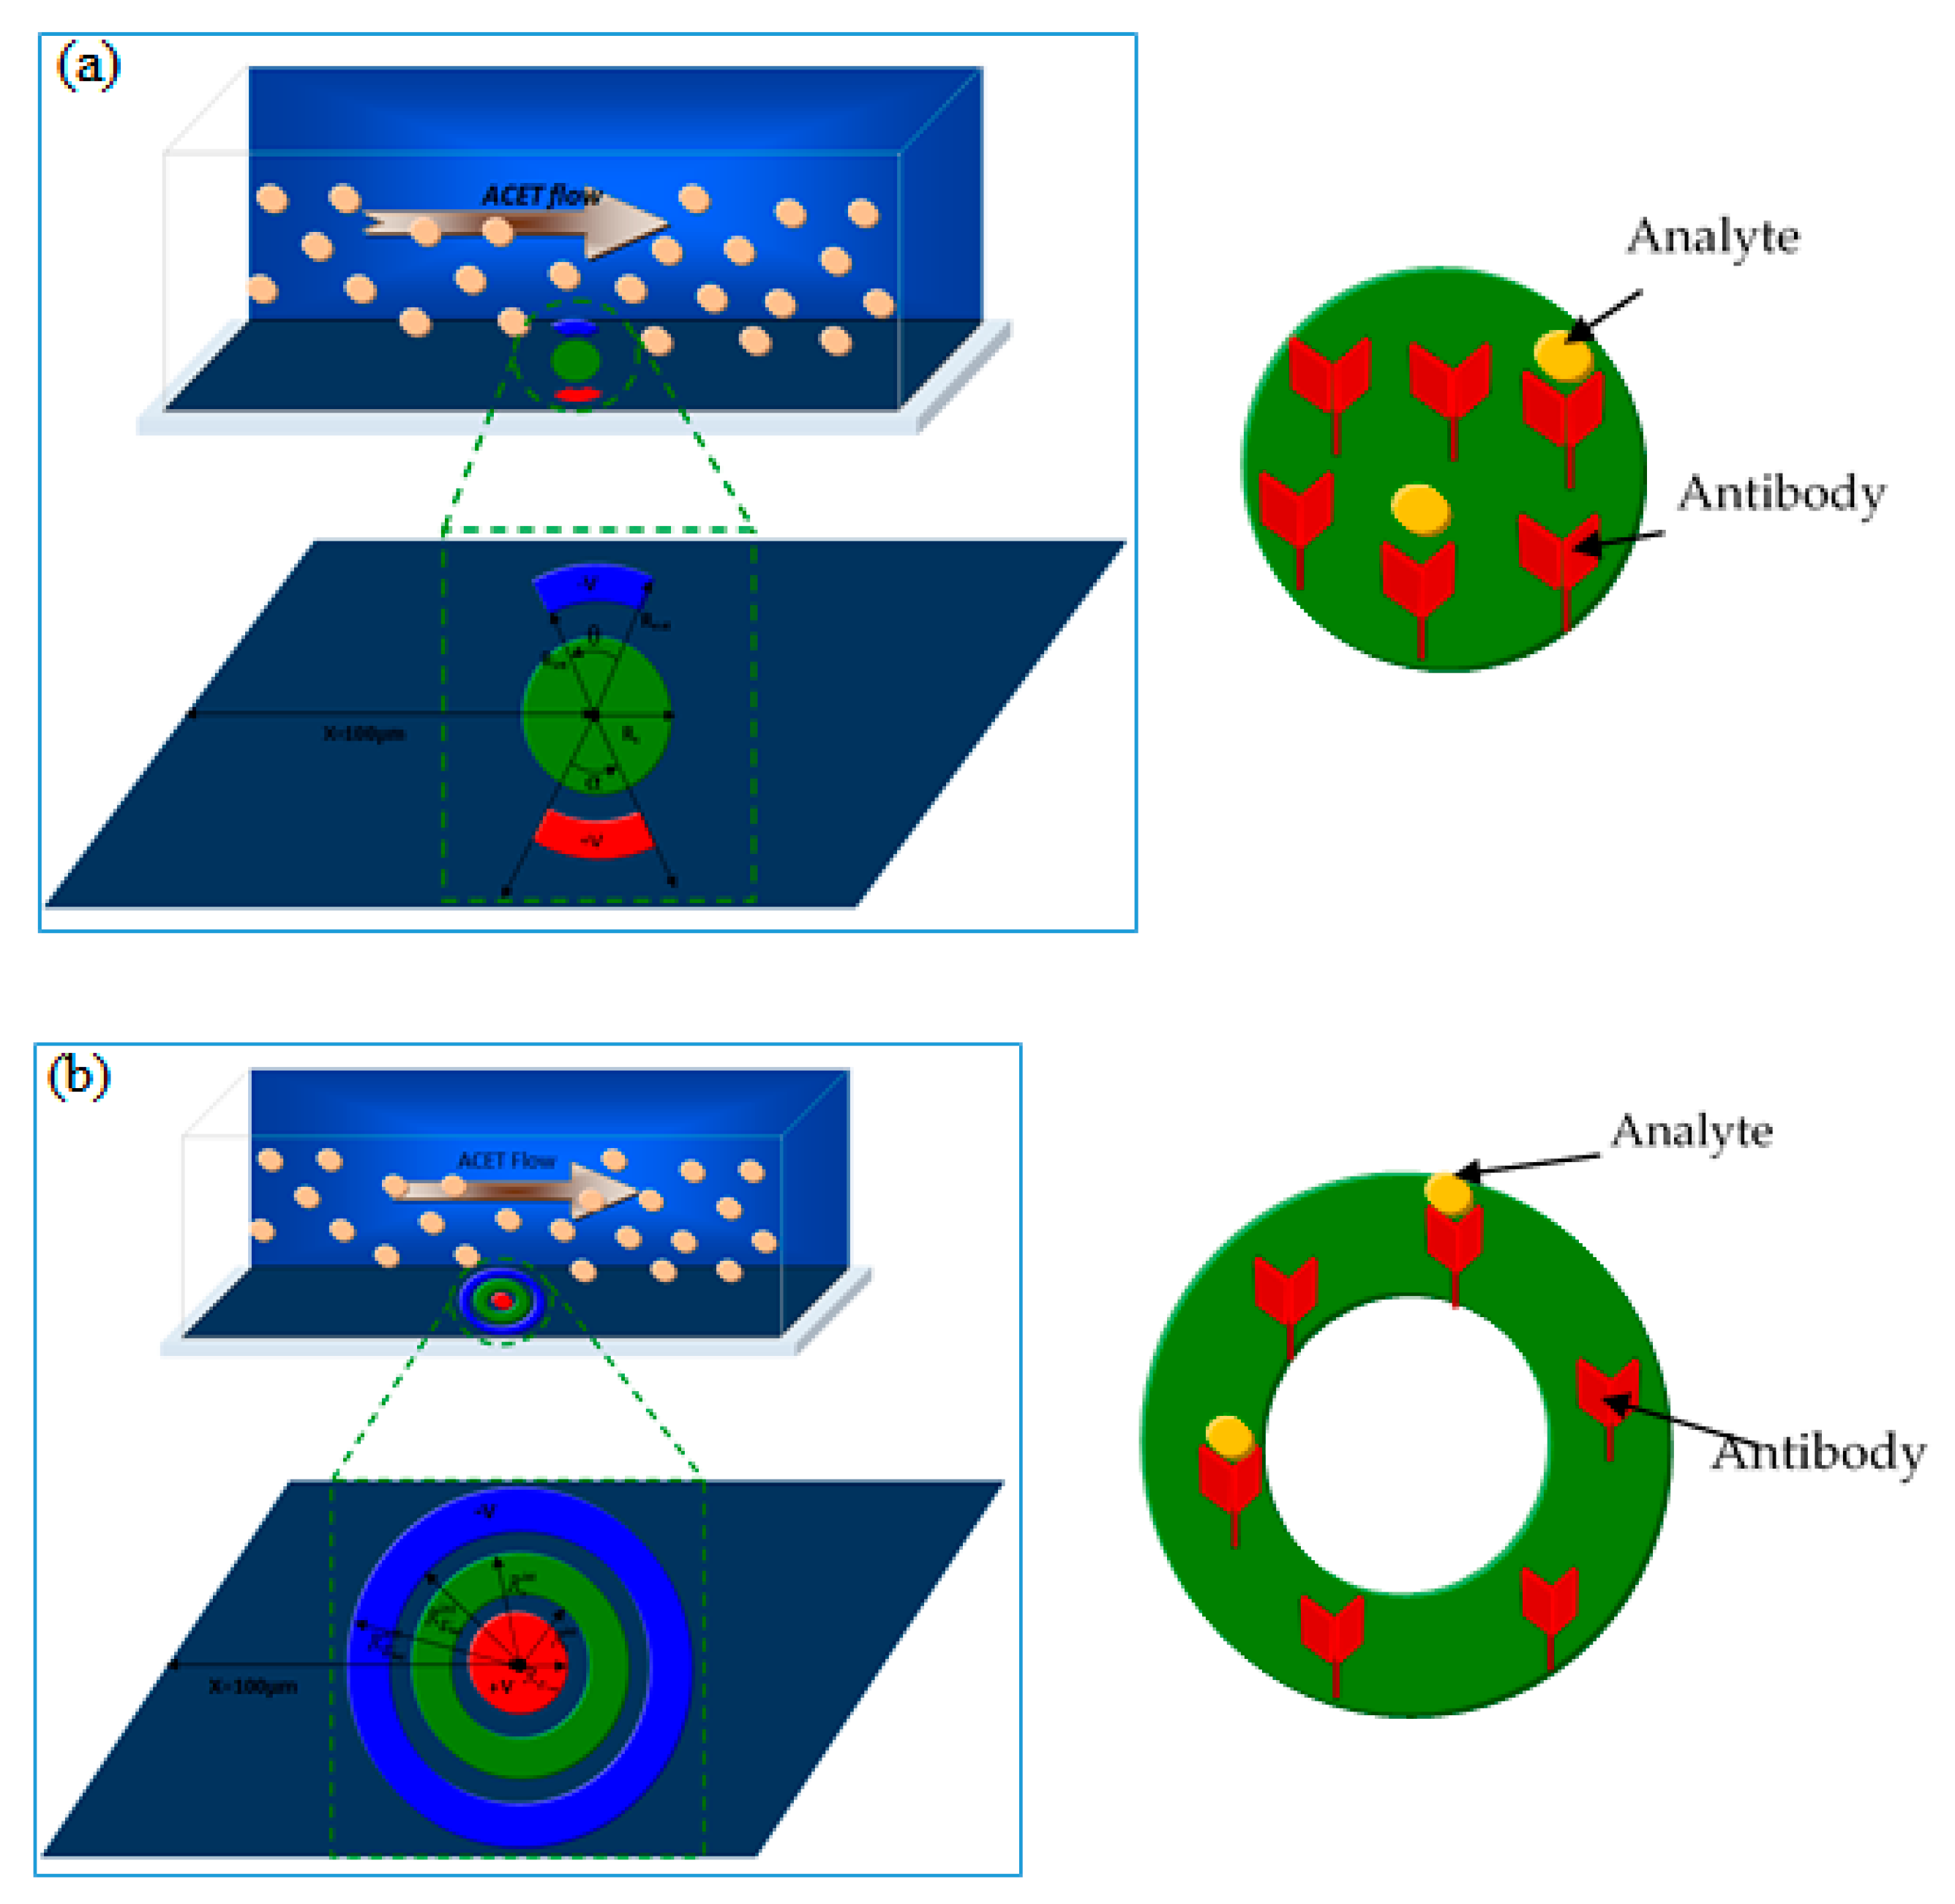
In order to optimize microfluidic biosensor performance, several parameters were tested in this work. Two biosensor geometries with two forms of reaction surface were studied.
3.2. Effect of Surface Reaction Shape
Figure 1 exhibits the geometry of the two biosensors having different shapes of reaction surface and electrode arrangement.
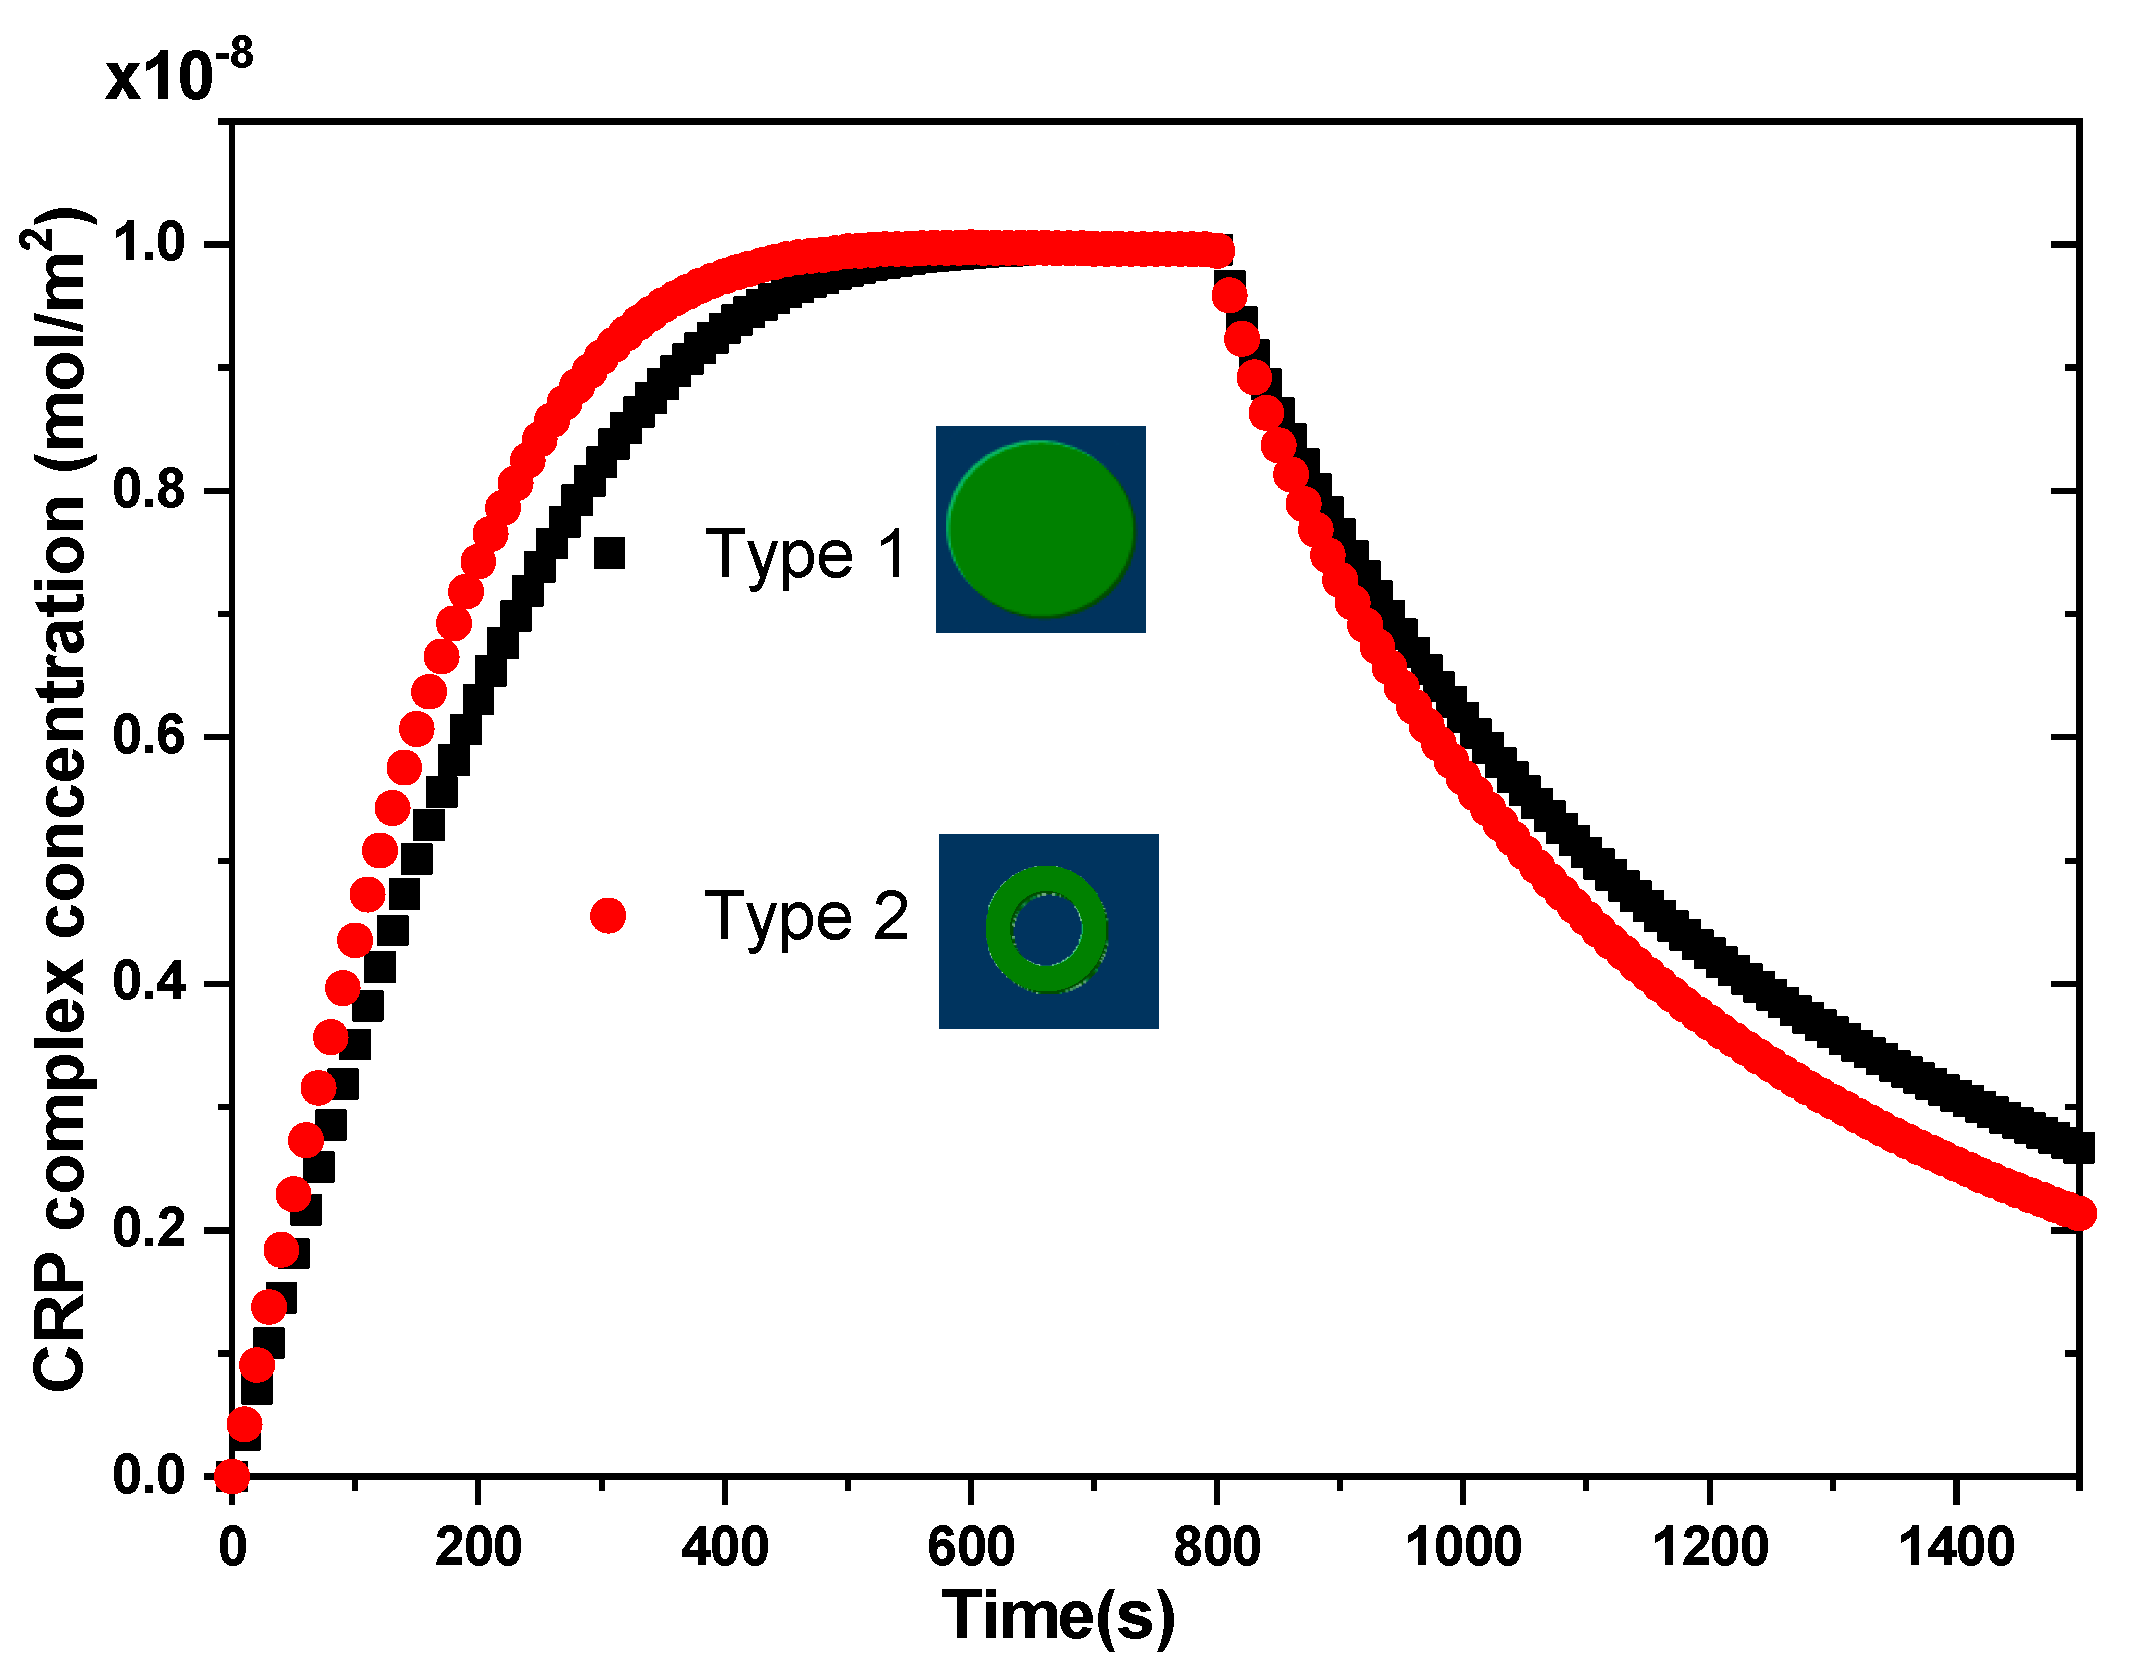
Figure 3 and
Figure 4 show the transient evolution of the CRP complex of these two biosensors for u
ave = 100 µm/s without applied voltage (V
rms = 0 V) and with applied voltage (V
rms = 15 V), respectively. The geometric parameters of the two biosensor models are given in
Table 1 and
Table 2.
For the first model of the biosensor, the reaction surface was a disk of radius Rs = 15.96 μm while for the second model it was a circular ring of outer and inner radius = 25 µm and = 20 µm, respectively. In both models of biosensors, the area of the reaction surface was taken equal to S = 800 µm2. The electrodes angle θ and α for the first biosensor model were equal to 40°.
Figure 3 and
Figure 4 present the evolution of the normalized complex concentration C
s during the association and dissociation phases. During the first phase (association), the complex concentration increases almost linearly until reaching saturation. At this stage (saturation), all the ligands are occupied by the analytes injected at the inlet of channel. After a given time (
= 800 s), the injection of analyte is stopped and therefore the kinetic bond dissociation will take place.
In the case of V
rms = 0 V (
Figure 3), the binding reaction rate related to the circular reacting surface without the application of the electrothermal force was smaller than that related to the reaction surface having the form of a circular ring.
In the case of V
rms = 15 V (
Figure 4), a significant improvement in the binding reaction was observed for the second model compared to the first model. The electrothermal force induced by the electrodes for the second model contributed effectively to the increase of the reaction rate. The shape of the reaction surface and the electrode arrangement have an important role in improving the biosensor response.
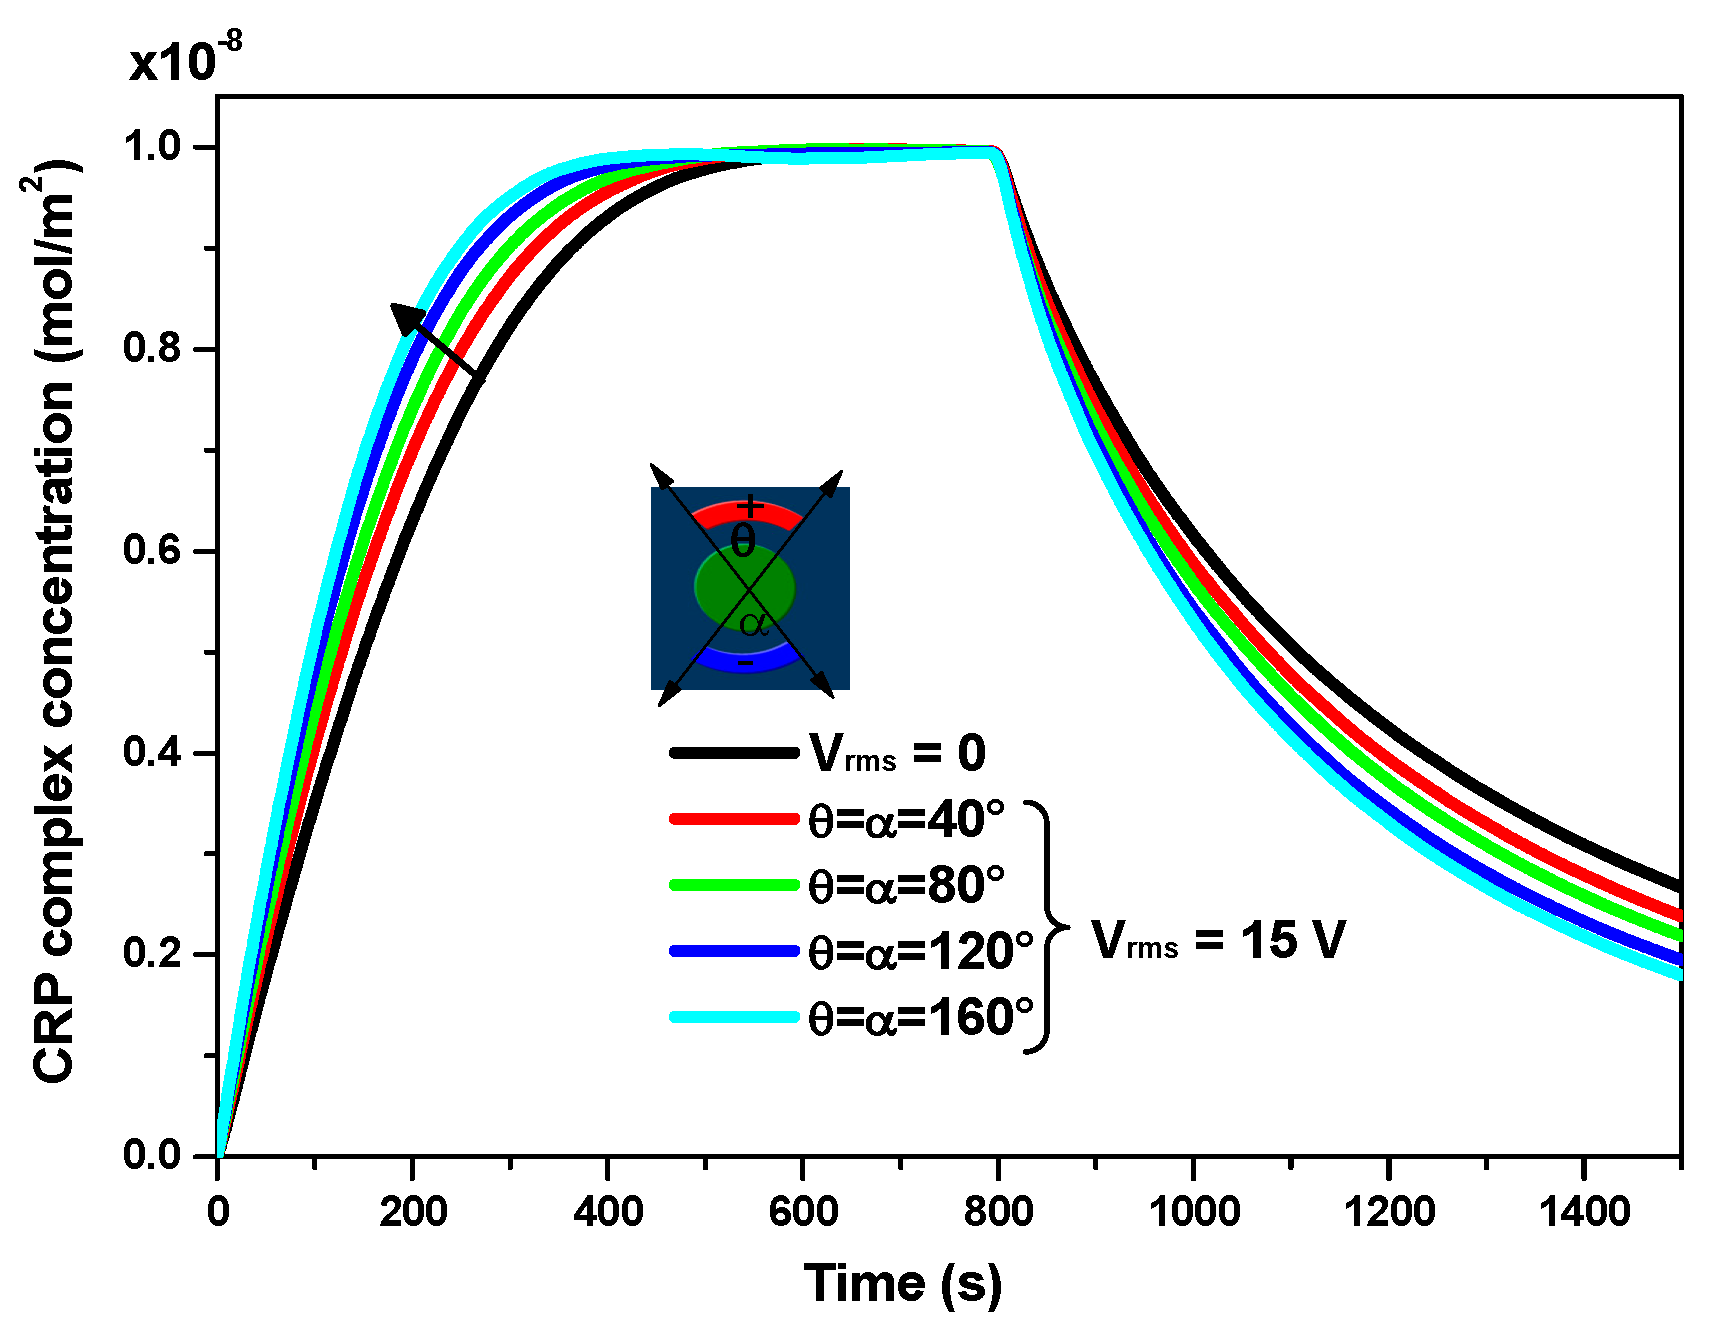
3.3. Effect of the Applied Voltage
Figure 5 illustrates the effect of electrodes angles (θ, α) on the transient evolution of CRP complex concentration for V
rms = 15 V and u
ave = 100 µm/s. Four values of the angle θ = α (namely, 40, 80, 120, and 160°) were considered in order to study the effect of these angles on the biosensor response. The results are also compared to those obtained in the case without the electrothermal effect (V
rms = 0 V). As expected, this figure reveals that when the electrodes angle increases, the electrothermal effect becomes more important and subsequently there is an improvement of the reaction rate.
Table 5 illustrates the initial slopes for association and dissociation binding reaction corresponding to four values of the electrode aperture angles θ and α. The initial slope was calculated by choosing few points near the initial time of each phase (i.e., near
= 0 s for the association phase and near
= 800 s for the dissociation phase). Then, a linear interpolation based on the least square method was used to compute the slope. The slope of the curves gives the binding rate and is related to the response time of the biosensor.
The enhancement factors of these initial slopes are also presented. It is clear that the improvement of the binding reaction is significant during both the association phase and the dissociation phase. The most significant enhancement factor for the adsorption and desorption of CRP protein pair under 15 V was obtained for α = θ = 160°.
The initial slopes depend not only on the electrode aperture angles but also on the applied voltage.
Figure 6 presents the three-dimensional surface plot of the slope at the origin of time related to the association and dissociation stages versus the applied voltage and the electrode aperture angle for a fixed value of the average inlet velocity u
ave = 100 µm/s. The large value of the initial slope was achieved for the largest applied voltage and for the largest electrode aperture angle.
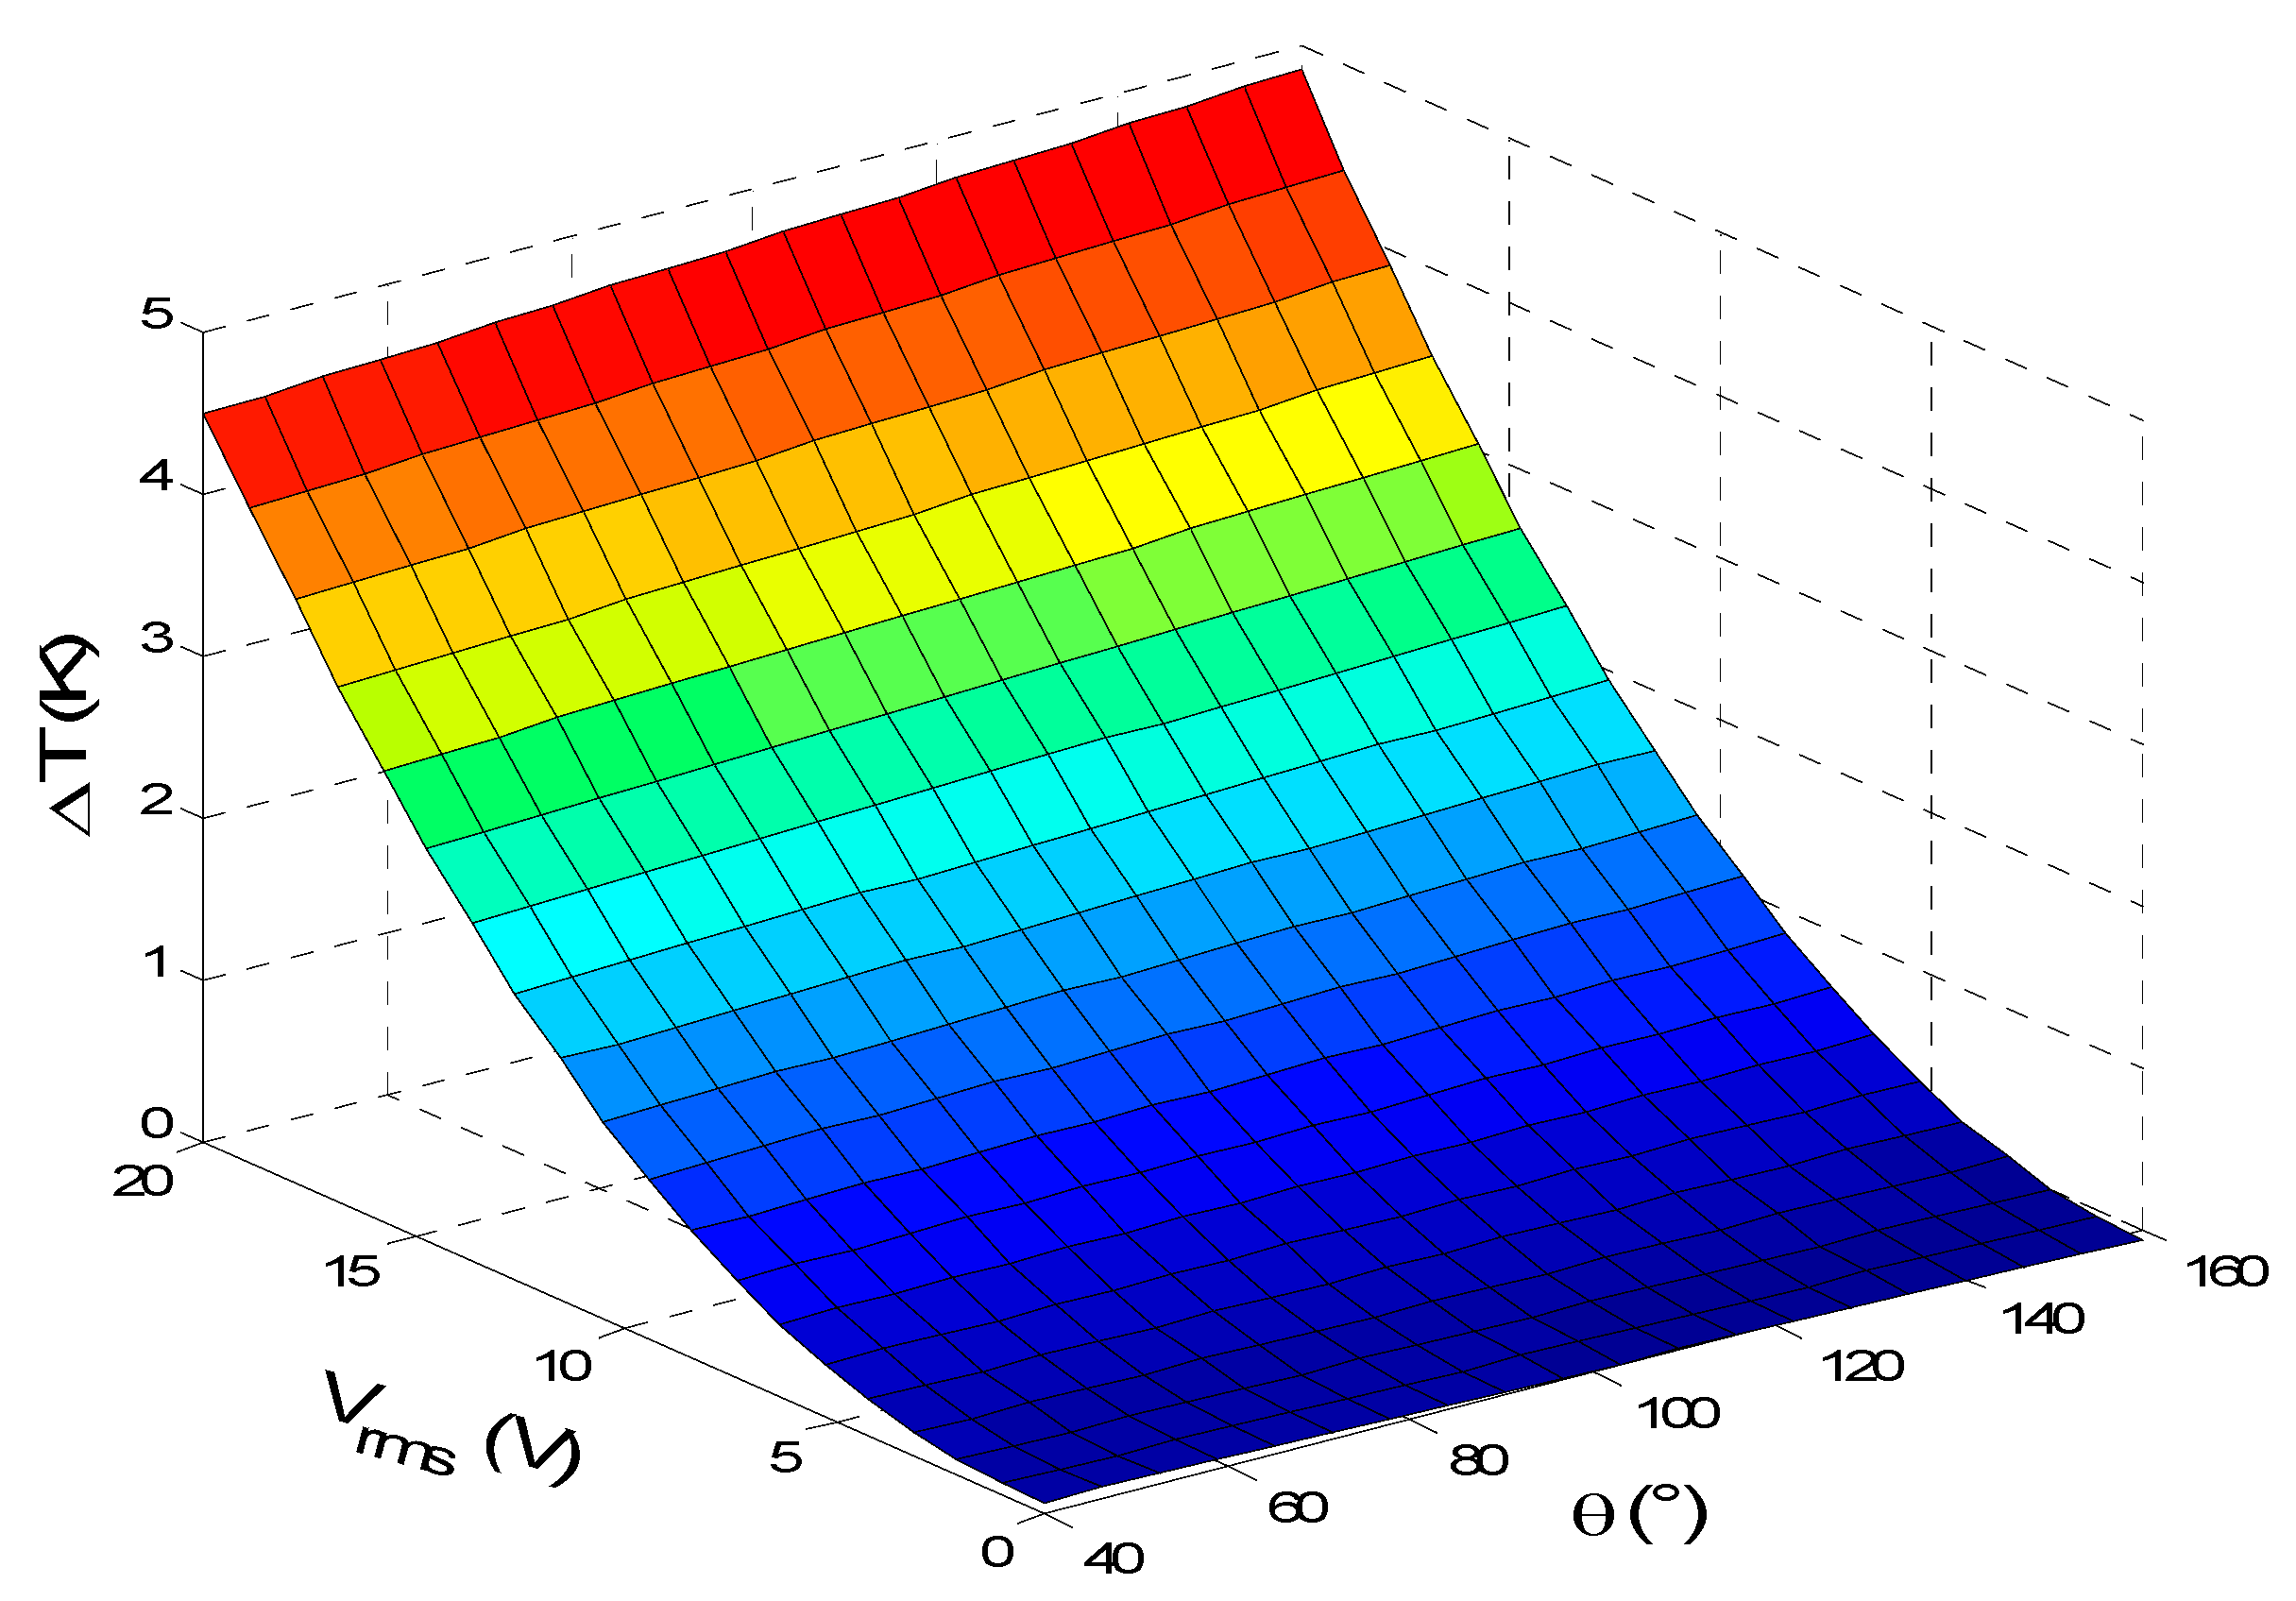
Figure 7 illustrates the temperature rise versus the applied voltage and electrode aperture angle for u
ave = 100 µm/s. From this figure, it is noted that the temperature rise is strongly influenced by the applied voltage. However, the electrode aperture angle has a small and linear effect on the temperature rise.
Furthermore, it clearly appears that the temperature rise due to the Joule heating has a quadratic variation versus the applied voltage. This result is expected due to the source term in the heat equation. By increasing the angle θ, the electrode surface increases causing an increase in the electric field and subsequently the temperature. For example, the electrical field for Vrms = 15 V increases from 4 MV/m for θ = α = 40° to 6.2 MV/m for θ = α = 160°. Thus, there is an increase in Joule heating.
For microfluidic biosensors under AC electric field, the Joule heating could provoke an important temperature rise. The exceeding of the safe limit temperature can damage the thermally labile biological samples (say about 3 K) [
23]. For this reason, it is necessary to work with a voltage lower than 15 V.
To avoid exceeding the limit temperature of the biological samples, we work at Vrms = 15 V. For this type of biosensor, the optimum efficiency is achieved for a larger electrode angle and high applied voltage.
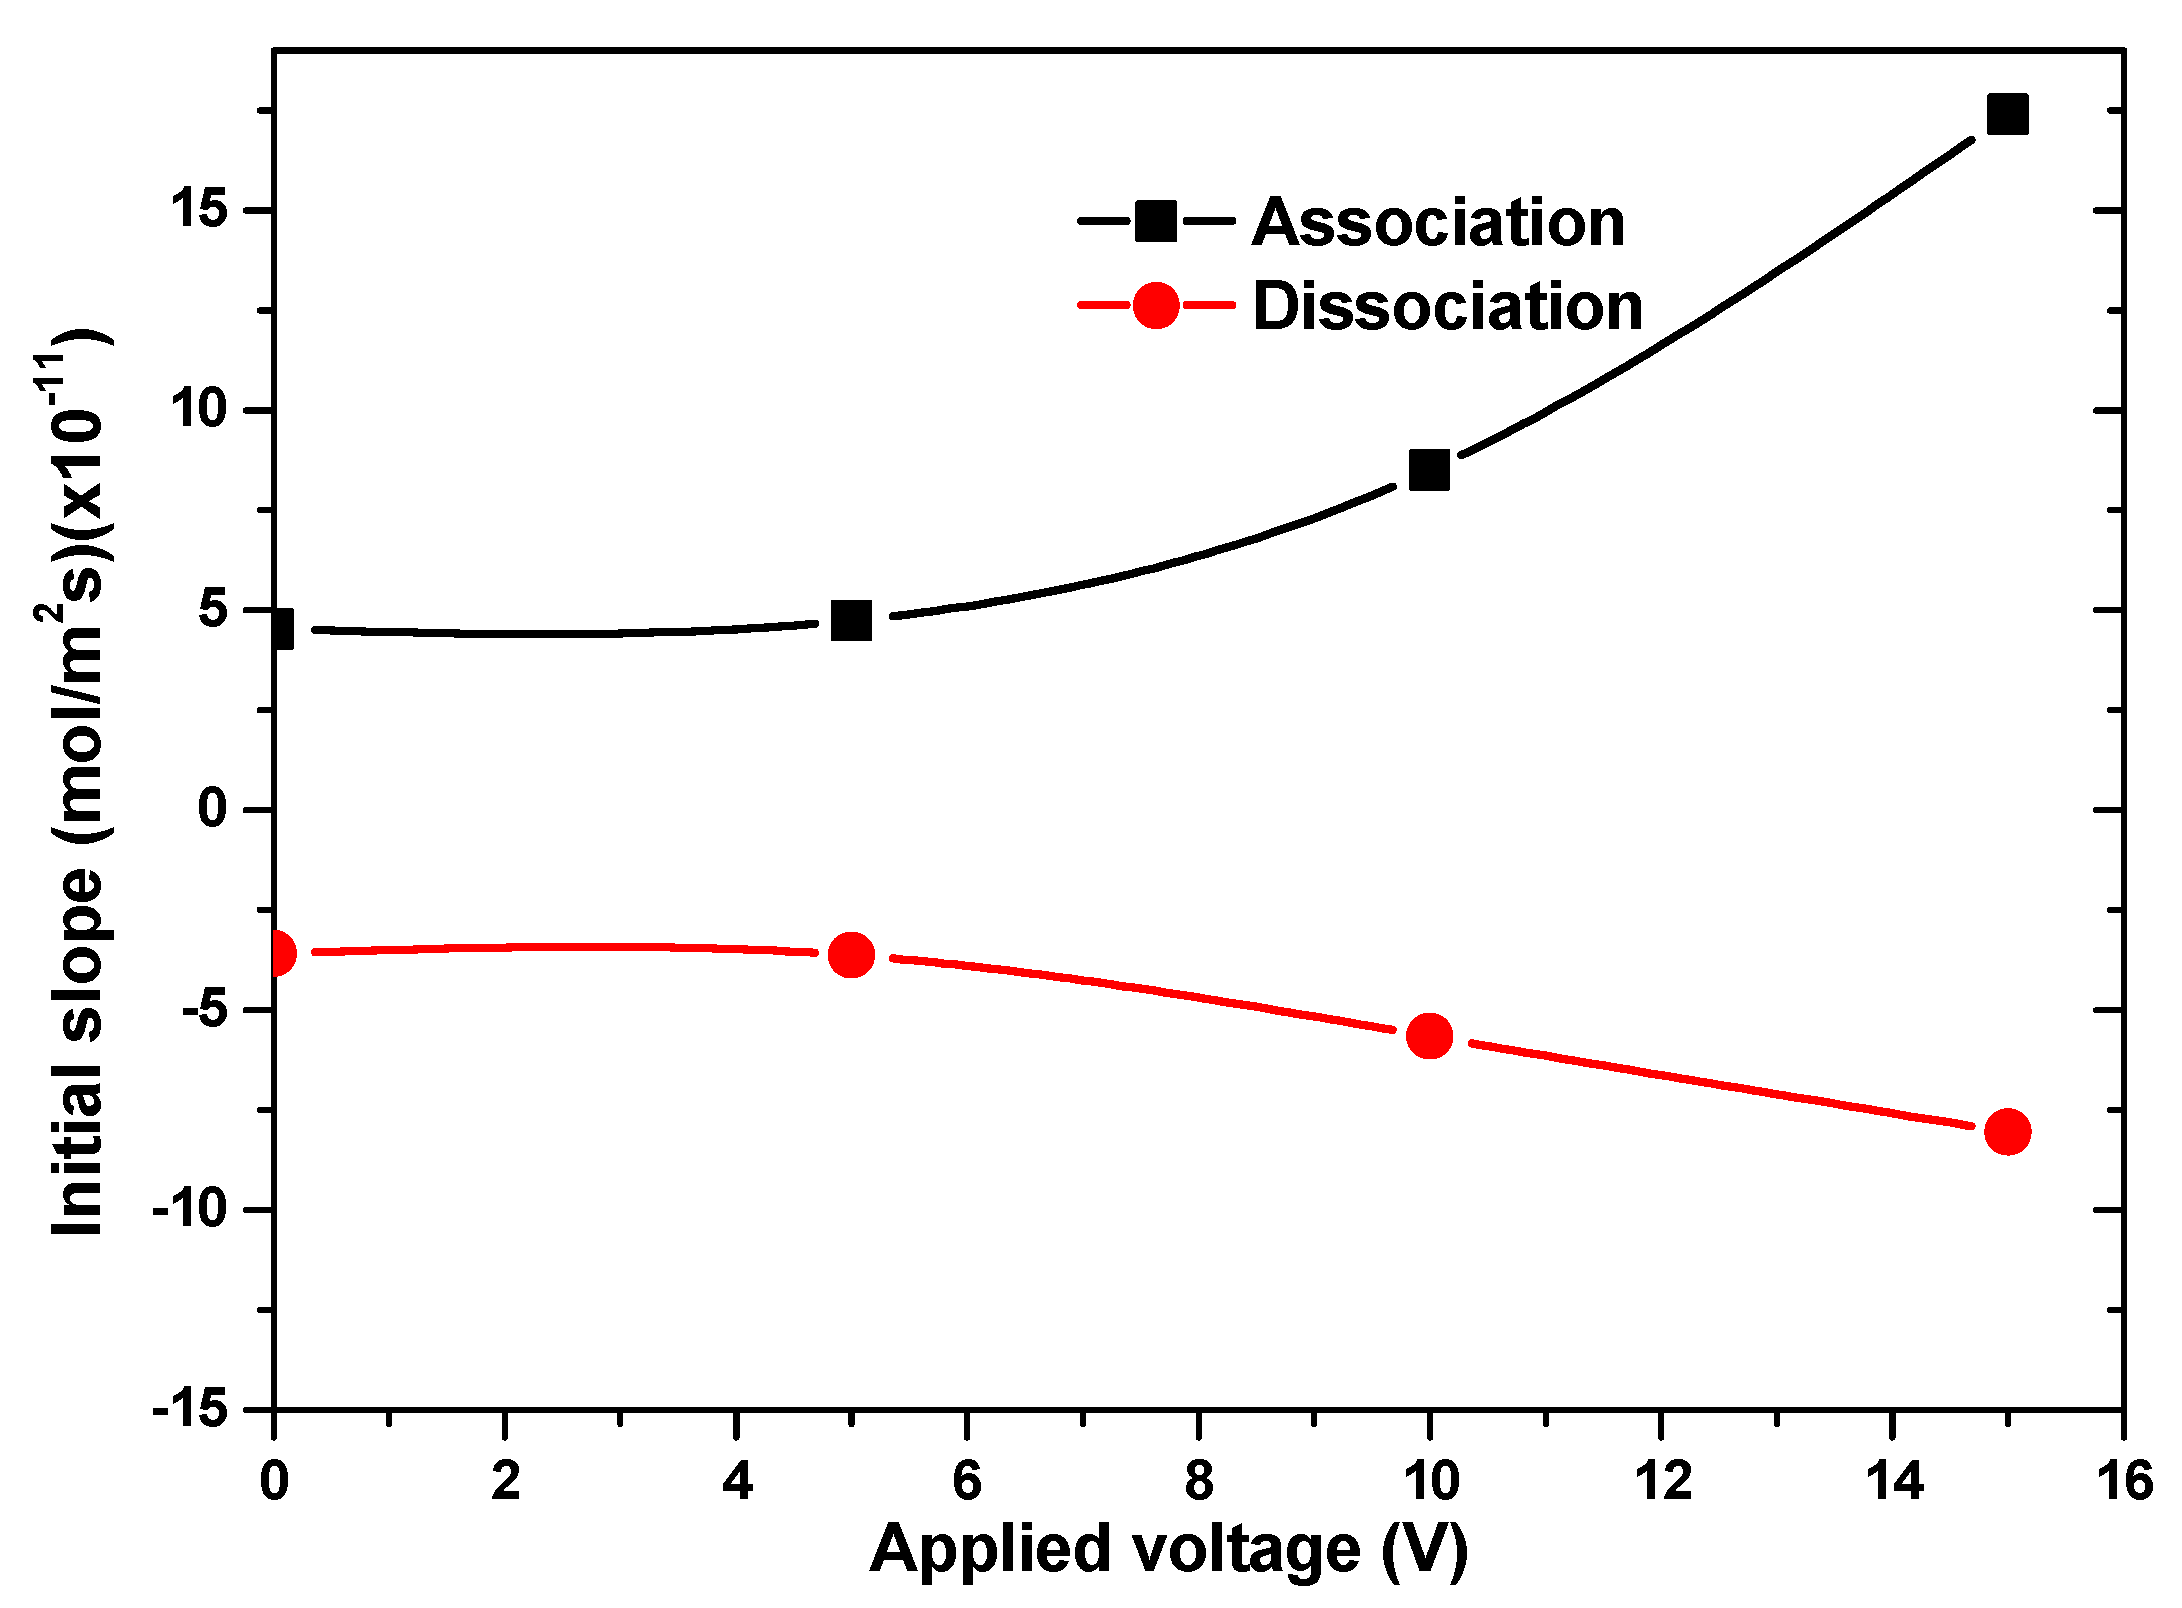
Figure 8 depicts the temporal evolution of average surface CRP complex concentration without and with electrothermal effect for u
ave = 100 µm/s. Three different AC voltages, 5, 10, and 15 V, were tested in this study. We noticed a significant improvement in reaction rate, especially for the larger applied voltage. For example, the increase rate of initial slope for the association phase was about 5% when the voltage V
rms increased from 0 to 5 V and 105% when the voltage V
rms increased from 10 to 15 V (
Figure 9).
In
Table 6, we calculated the temperature rise for different applied voltages. For V
rms = 15 V, ΔT = 3.0 K represents the limit value of the biological samples. Indeed, the maximum temperature rise obtained for the first model of the biosensor for α = θ = 160° is ΔT = 2.7 K under the same conditions of applied voltage and inlet velocity.
3.4. Effect of Inlet Velocity
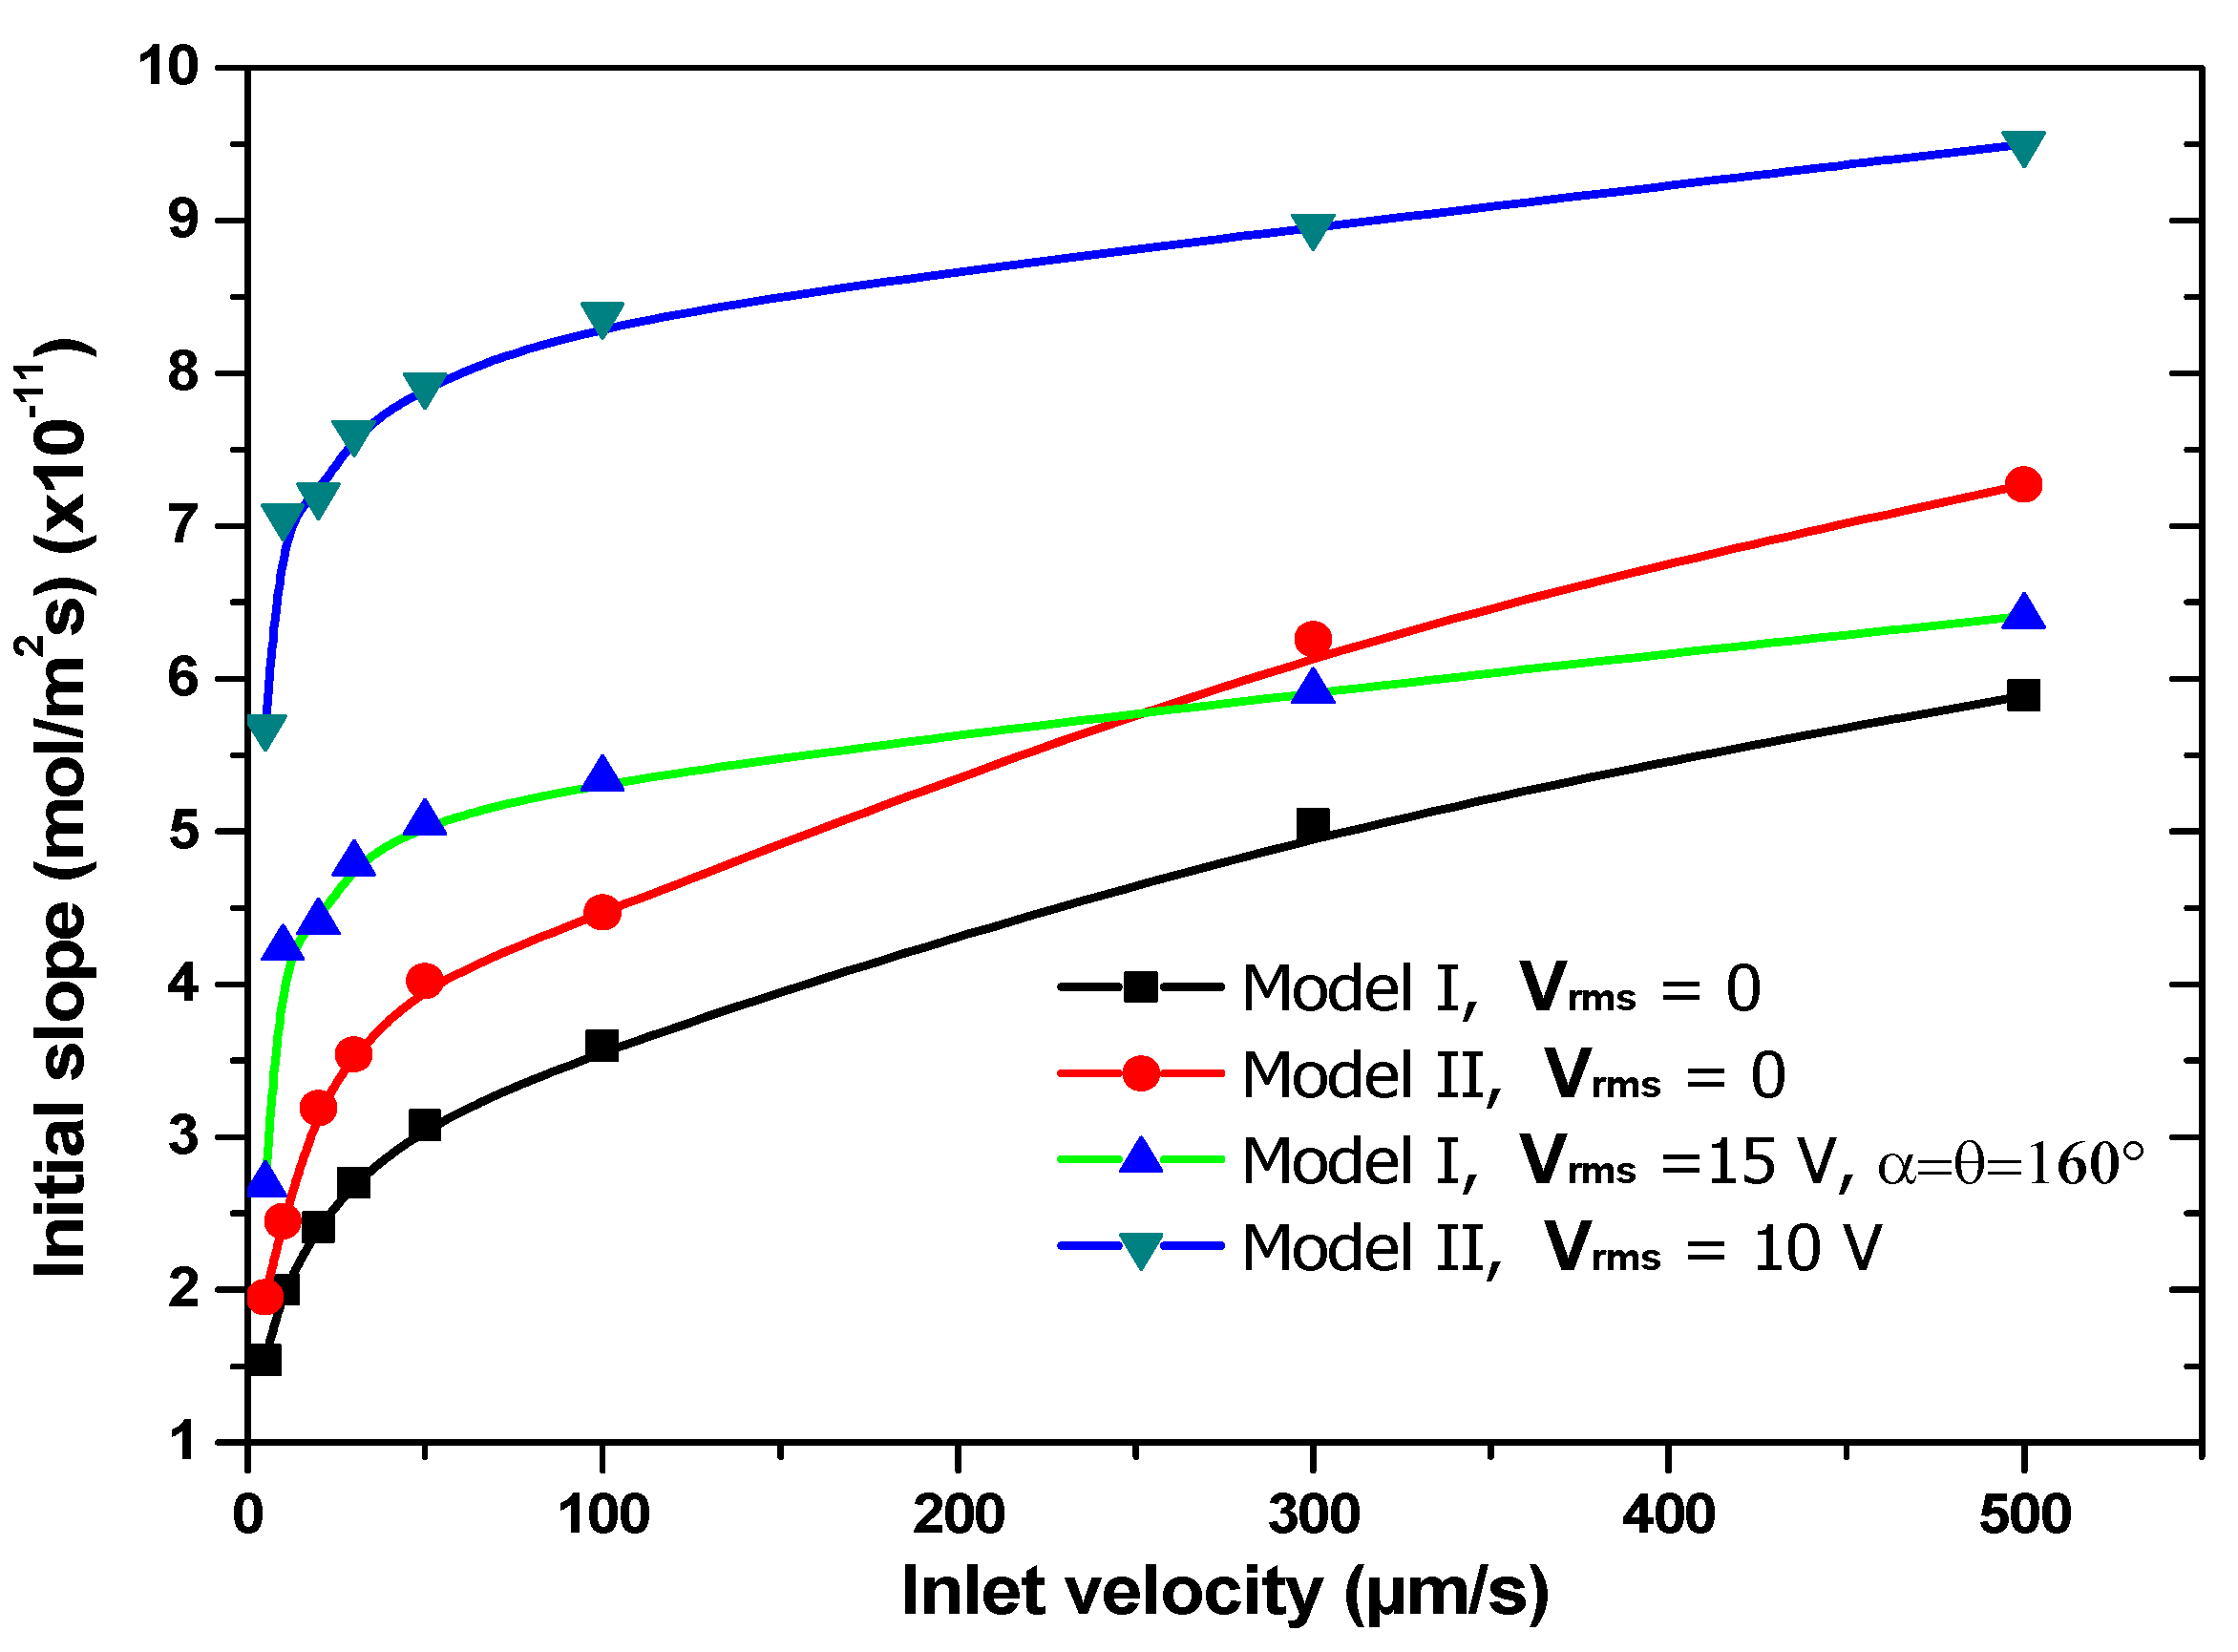
To study the impact of the average inlet velocity on the response of both biosensor models,
Figure 10 shows the evolution of the slope at the origin of time related to the association phase versus the average inlet velocity with and without electrothermal field. In absence of the electrothermal effect (i.e., V
rms = 0 V), increasing the flow velocity improves the convective mass transport of the analyte towards the sensitive surface and subsequently enhances the reaction rate. In
Figure 10, the initial slope related to the association stage with electrothermal effect (V
rms = 15 V) for the first model of the biosensor is presented for α = θ = 160°.
This figure exhibits two regions: a linear region for low inlet velocities and an almost saturation region for larger inlet velocities. In the first region, the reaction rate is greatly accelerated for any value of the applied voltage because the analyte in the bulk has time to diffuse to the reaction surface. In the second region, the enhancement factor of the binding reaction decreases because the amount of analyte carried by the flow is large [
23]. We can conclude that the electrothermal effect is dominant for low inlet velocities and will be negligible for the large flow rates.
For comparison, the initial slope of the association phase for both biosensor models without and with electrothermal field versus the average inlet velocity reveals that the second model of biosensor is more efficient than the first one without and with an applied voltage.


