1. Introduction
In the province of Quebec, hydraulic turbines produce the vast majority of the electrical power [
1]. Multi-pass flux-cored arc welding (FCAW), used for turbine runner joints, naturally generates certain discontinuities such as slag inclusions, lack of penetration, macro shrinkage, and thermal stress cracking. Welding discontinuities and dynamic stress concentration result in a higher failure probability in Francis turbine runners [
2,
3]. In the runner, the maximum stresses are located along the welds near the trailing edge of the blades. The critical weld region extends to approximately 300 mm from the trailing edge for both blade-to-crown and blade-to-web welds.
The Hydro-Quebec Research Institute (IREQ) has developed a life estimation model based on the distribution and size of structural discontinuities in turbines to ensure equipment reliability and control production costs. In this model, the probability of a cracking event at any given point in time depends on the joint probability of stress and defect being above the limit defined by the material properties [
4]. Indeed, if discontinuities remain undetected, they might initiate fatigue cracks under dynamic, in-service stresses, leading to unplanned failure, which itself results in high repair costs and long downtime. It is desirable to supply the life estimation model with accurate data regarding the distribution and size of discontinuities present in the turbine to reduce the unplanned outage costs. This type of data is typically determined using NDT methods to detect, locate, and size flaws [
2].
NDT is the development and application of technical methods to examine materials or components such that the pieces are not destroyed and their future usefulness and serviceability remain [
5]. There is a wide range of NDT methods based on the physical principles of electromagnetic radiation, sound, and other inherent properties of the materials. The techniques selected should consider safety, economic, efficiency, and time factors [
6]. Ultrasonic testing (UT) is a suitable method for detecting and sizing flaws embedded within or growing from inaccessible surfaces. Ultrasonic waves can propagate through thick solid parts [
7]. Therefore, UT is suitable for flaws far beneath the inspection surface, unlike methods that can only detect defects on, or very close to, the inspection surface, e.g., Eddy current testing or methods that detect flaws connected to the inspection surface, such as visual methods and penetrant testing [
8]. When defect assessment calculations require a value for how deep the defect has grown, ultrasonic testing is the primary desired method. It is used to detect various types of flaws, such as cracks and inclusions in a wide range of materials, compared to magnetic particle testing methods, which require the component to be ferromagnetic. Ultrasonic waves are inherently safe compared to radiography methods, which use ionizing radiation and thus require multiple protection types [
9,
10].
The basic NDT methods, such as visual testing (VT), ultrasonic testing (UT), penetrant testing (PT), and radiography (RT), are usually used to inspect hydraulic turbine runners. However, there are difficulties involved in detecting internal flaws in complex geometries, such as the runner’s weld joints. Thus, hydraulic turbine runners are generally inspected using different ultrasonic inspection methods [
2,
3,
11,
12,
13,
14]. Few studies have been performed on the inspection of hydraulic turbine runners with ultrasonic phased array. However, the published studies did not focus on the high-stress area, used artificial flaws embedded in a weld mockup, and did not consider the material’s properties [
11,
12,
13]. Boukani et al. [
3,
15] worked on the capability of different NDT methods and the effect of microstructure on the acoustic properties of steel grades widely used for the manufacturing of hydroelectric turbine runners. These studies concluded that phased array is a very effective technique.
The current study goes further by including the total focusing method (TFM), and compares conventional, phased array and TFM techniques in order to assess their performance in detecting flaws in the trailing edge of a runner blade. The work focuses on ultrasonic inspection techniques applied directly to the blade because they conform to current fabrication and in-service inspection methods. Simulations and experiments are used to identify the best practices to reliably inspect the blade high-stress regions.
This research, as part of a large project, focuses on the detection and characterization of flaws in the welded joints of hydroelectric turbine runners, as they are located in the most critical zones in terms of fatigue failure. Loading conditions and fatigue-related material properties have been previously studied in detail as two inputs of life estimation models [
4,
16], while flaw characteristics are still fed into the developed models as assumptive third input values. The current research aims at providing IREQ with a flaw data reliability index (both measured and simulated) for the life estimation model.
2. Experimental Procedure
2.1. Manufacturing Process Description
Inspection of turbine runner welds is an essential aspect of electric-generator units’ in-service reliability [
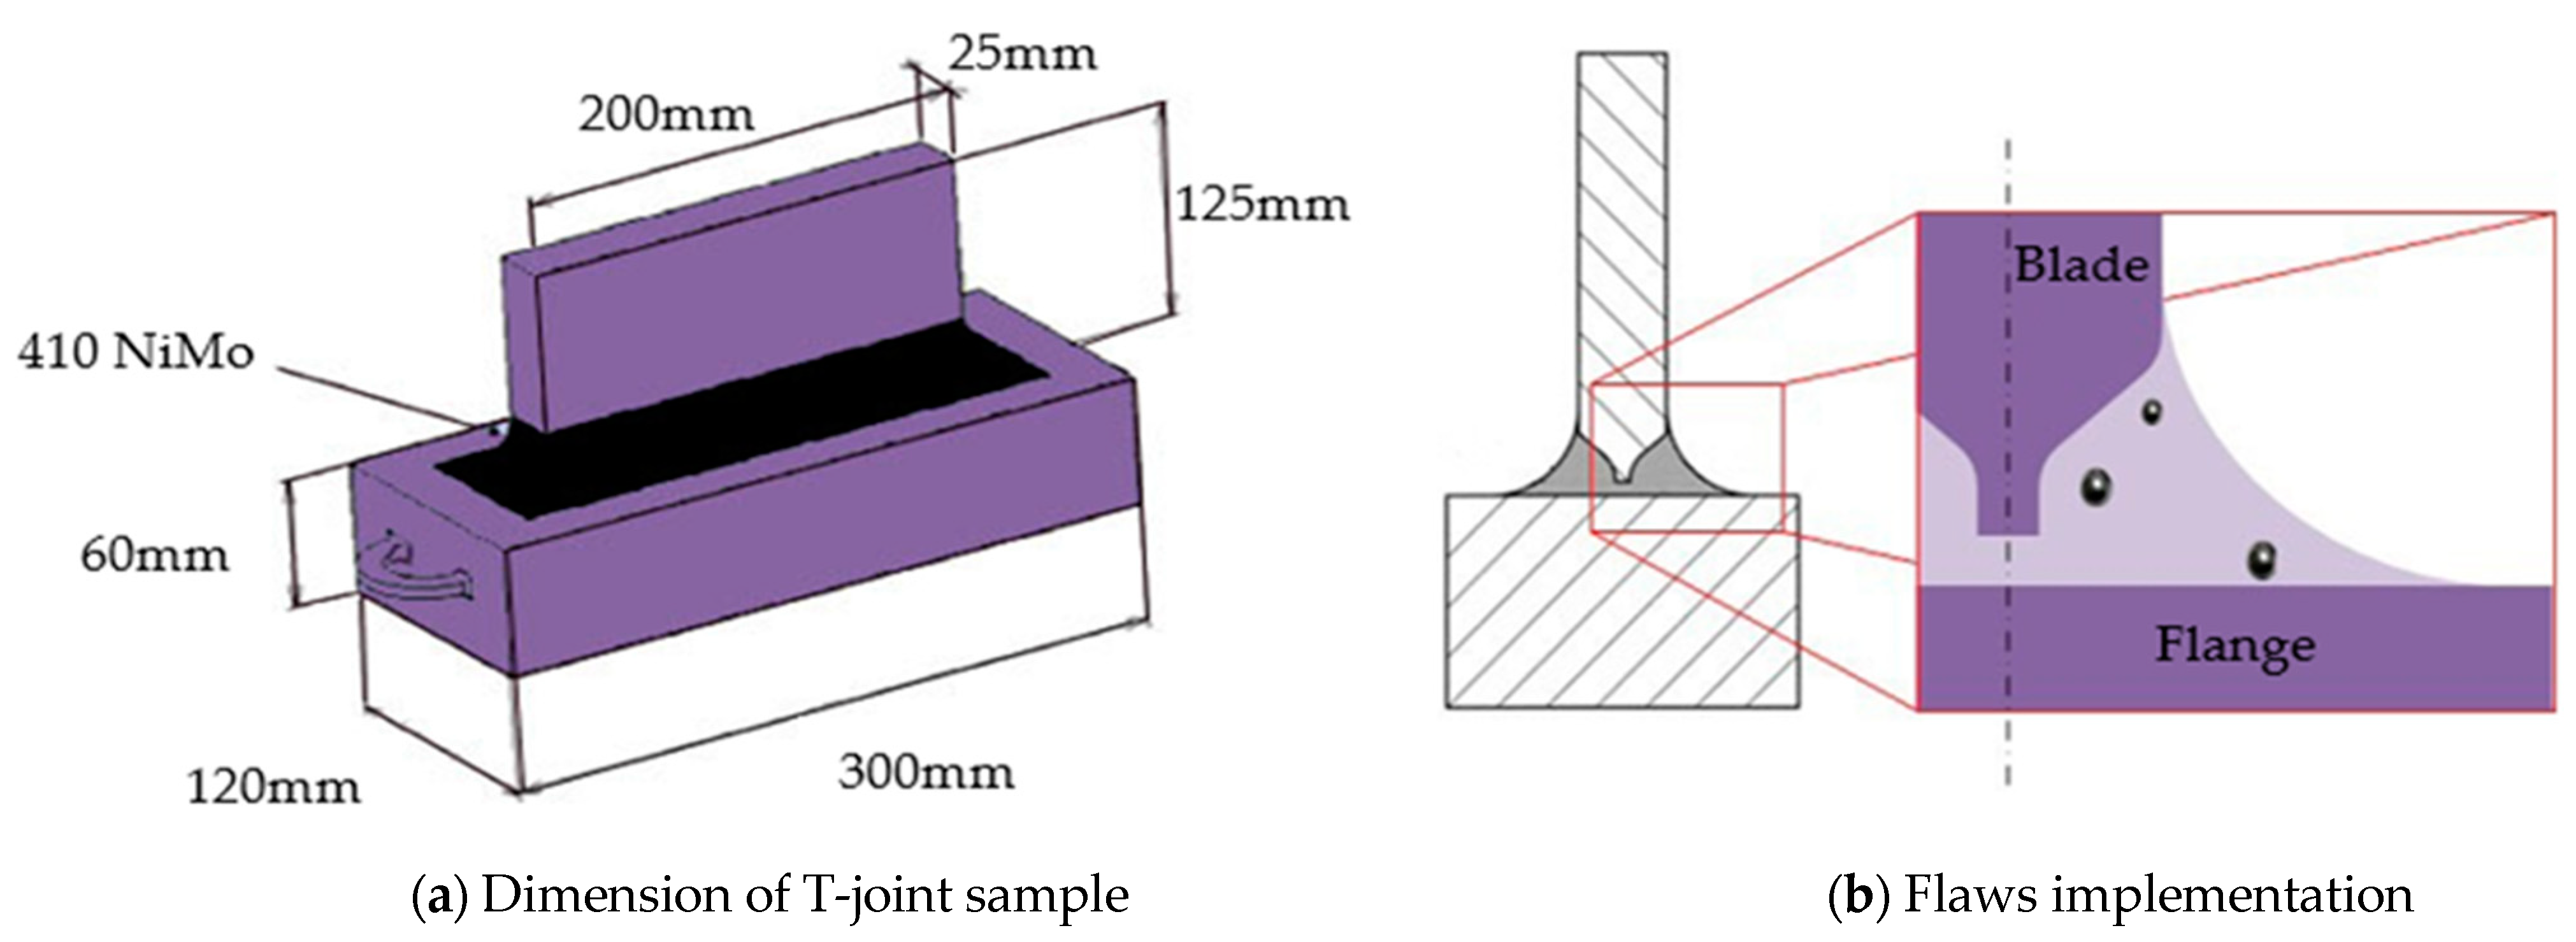
4]. In-service inspection data from installed runners show that fabrication flaws are found in the weld joint near the blade’s trailing edge. Flaws were discovered by applying a phased array ultrasonic technique using a small wedge to provide suitable contact on a curved surface and good volumetric coverage with an azimuthal focal law type. Typically, flaws are within 30 mm of the trailing edge and in the weld reinforcement that smooths the stresses at the blade’s end. Some flaws were found isolated, but clusters of up to 7 indications were also observed. The presence of flaws at the edge of the blade in the area of high service stress is considered in the current investigation. This area is where the start and stop of welding occurs, and thus it is not surprising to observe in-situ point-like reflectors in the weld reinforcement. A T-joint sample was manufactured in martensitic stainless steel (UNS S41500) in accordance with the manufacturing requirements of turbine runners. The T-joint geometry often mimics a turbine runner’s trailing edge, with both edges being 25 mm in thickness. The base plate is 60 mm thick and provides the same ultrasonic path for an inspection performed from the turbine web. The weld cap and blade ends are ground to obtain a smooth finish with a curved radius of 25 mm. The preparation is a J-shape grove with a 3 mm gap between the web and blade. Welding was carried out using a multi-pass FCAW process and EC410NiMo electrodes (same ultrasonic properties as UNS S41500). The study selected the dimensions of the joint to match a typical turbine runner assembly.Typically, 34 passes are required to fill the joint.
2.2. Flaw Size and Distribution
For technical manufacturing constraints imposed by the small size of the flaws examined by the current study (e.g., size of flaws between 1 mm and 5 mm), the scope is limited to inclusion flaws. Inclusions designate the incorporation, in the weld bead, of a foreign compound. Besides, the case of metal inclusions is studied to control the size of the flaws and the repeatability that are defined by the imprisonment of a foreign particle in the metal’s mass. These flaws were relatively present in welded joints in laboratory samples that made inclusion a representative flaw for the current study. Spherical beads of a specific size are integrated into the weld fusion to simulate an inclusion. The choice of spherical shape is justified by limiting the external error factors that are linked to the defects’ positioning and orientation.
To conduct the study, the requirement for precision on the defects’ size, the obligation to respect an acceptable level of repeatability, and the flaws spherical shape guided in choosing ball bearings as the defect to be included. The extreme thermal conditions and the electric arc passage, during welding, close to the balls, forced the researchers to choose ceramic balls that were more resistant to extreme temperatures. This is because they interfered less with the heat-welding arc because of their non-conductive electrical properties.
The study considered three types of ceramic balls; alumina oxide balls (Al
2O
3), zirconia balls (ZrO
2), and silicon nitride balls (Si
3N
4). In this regard, all three types of balls were tried to determine the best ones for the study. After a series of tests, the study found that the alumina oxide (Al
2O
3) balls were to be avoided. This is because, despite the fact they offer a higher operating temperature compared to silicon nitride (Si
3N
4), they did not resist the electric arc passage and exploded [
17]. Therefore, the study chose the silicon nitride balls because they were stronger and kept their original shape.
During welding, holes have been drilled in the weld pass to implement artificial flaws at known locations, as shown in
Figure 1. Ceramic beads are inserted into these holes, and the holes are filled by welding. Thirty ceramic beads are distributed in the weld of the T-joint sample. They were of either 1, 2, 3, 4, or 5 mm in diameter (6 beads of each size). This range of discontinuity sizes reflects the critical range to initiate a fatigue crack. A three-millimeter diameter flaw has the critical size to develop a fatigue crack under cyclic loading from stress calculation. Beads are located within 75 mm from the edges of the sample in order to mimic the situation observed on in-service runners.
2.3. Conventional Ultrasonic Testing (UT)
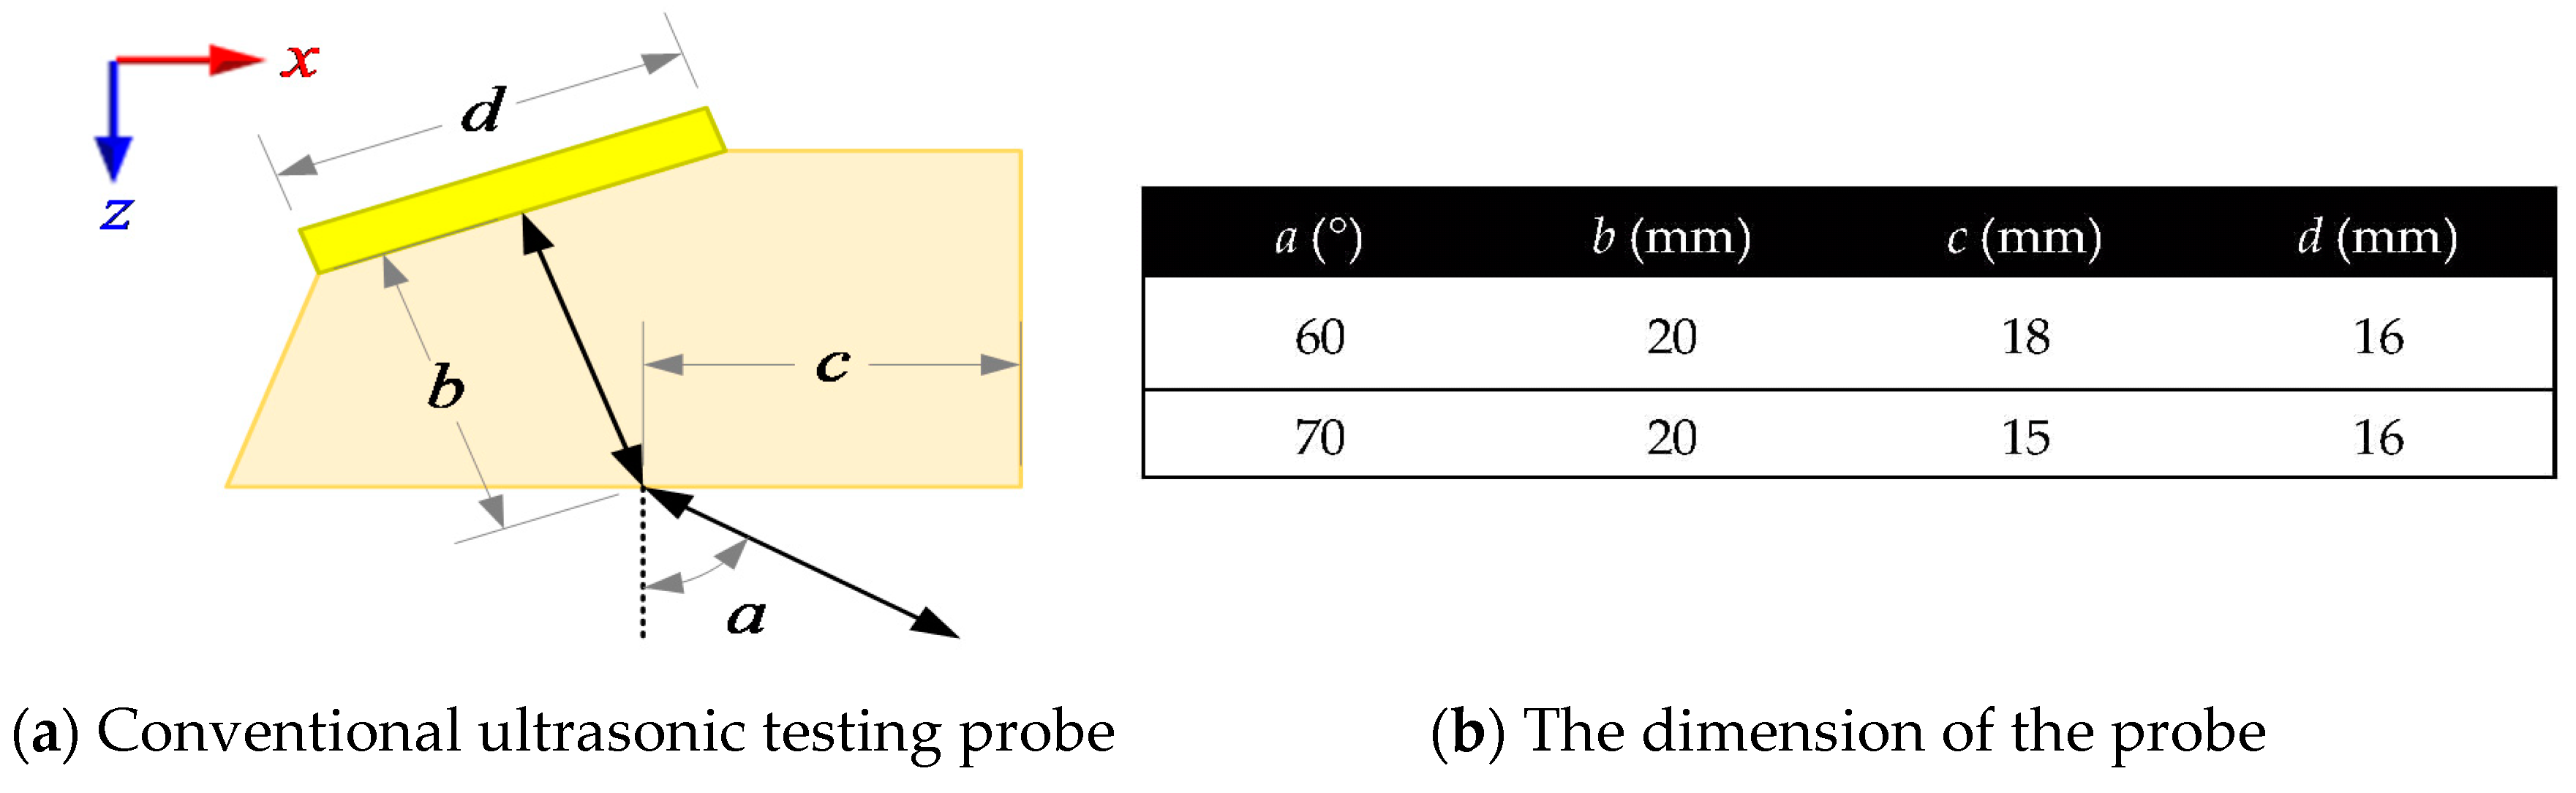
Four experienced UT practitioners with CGSB (Canadian General Standards Board) level 2 or 3 certification in Ultrasonic Testing did inspect the T-joint sample. The study performed inspections as per the Canadian Standards Association (CSA) W59, Welded steel construction [
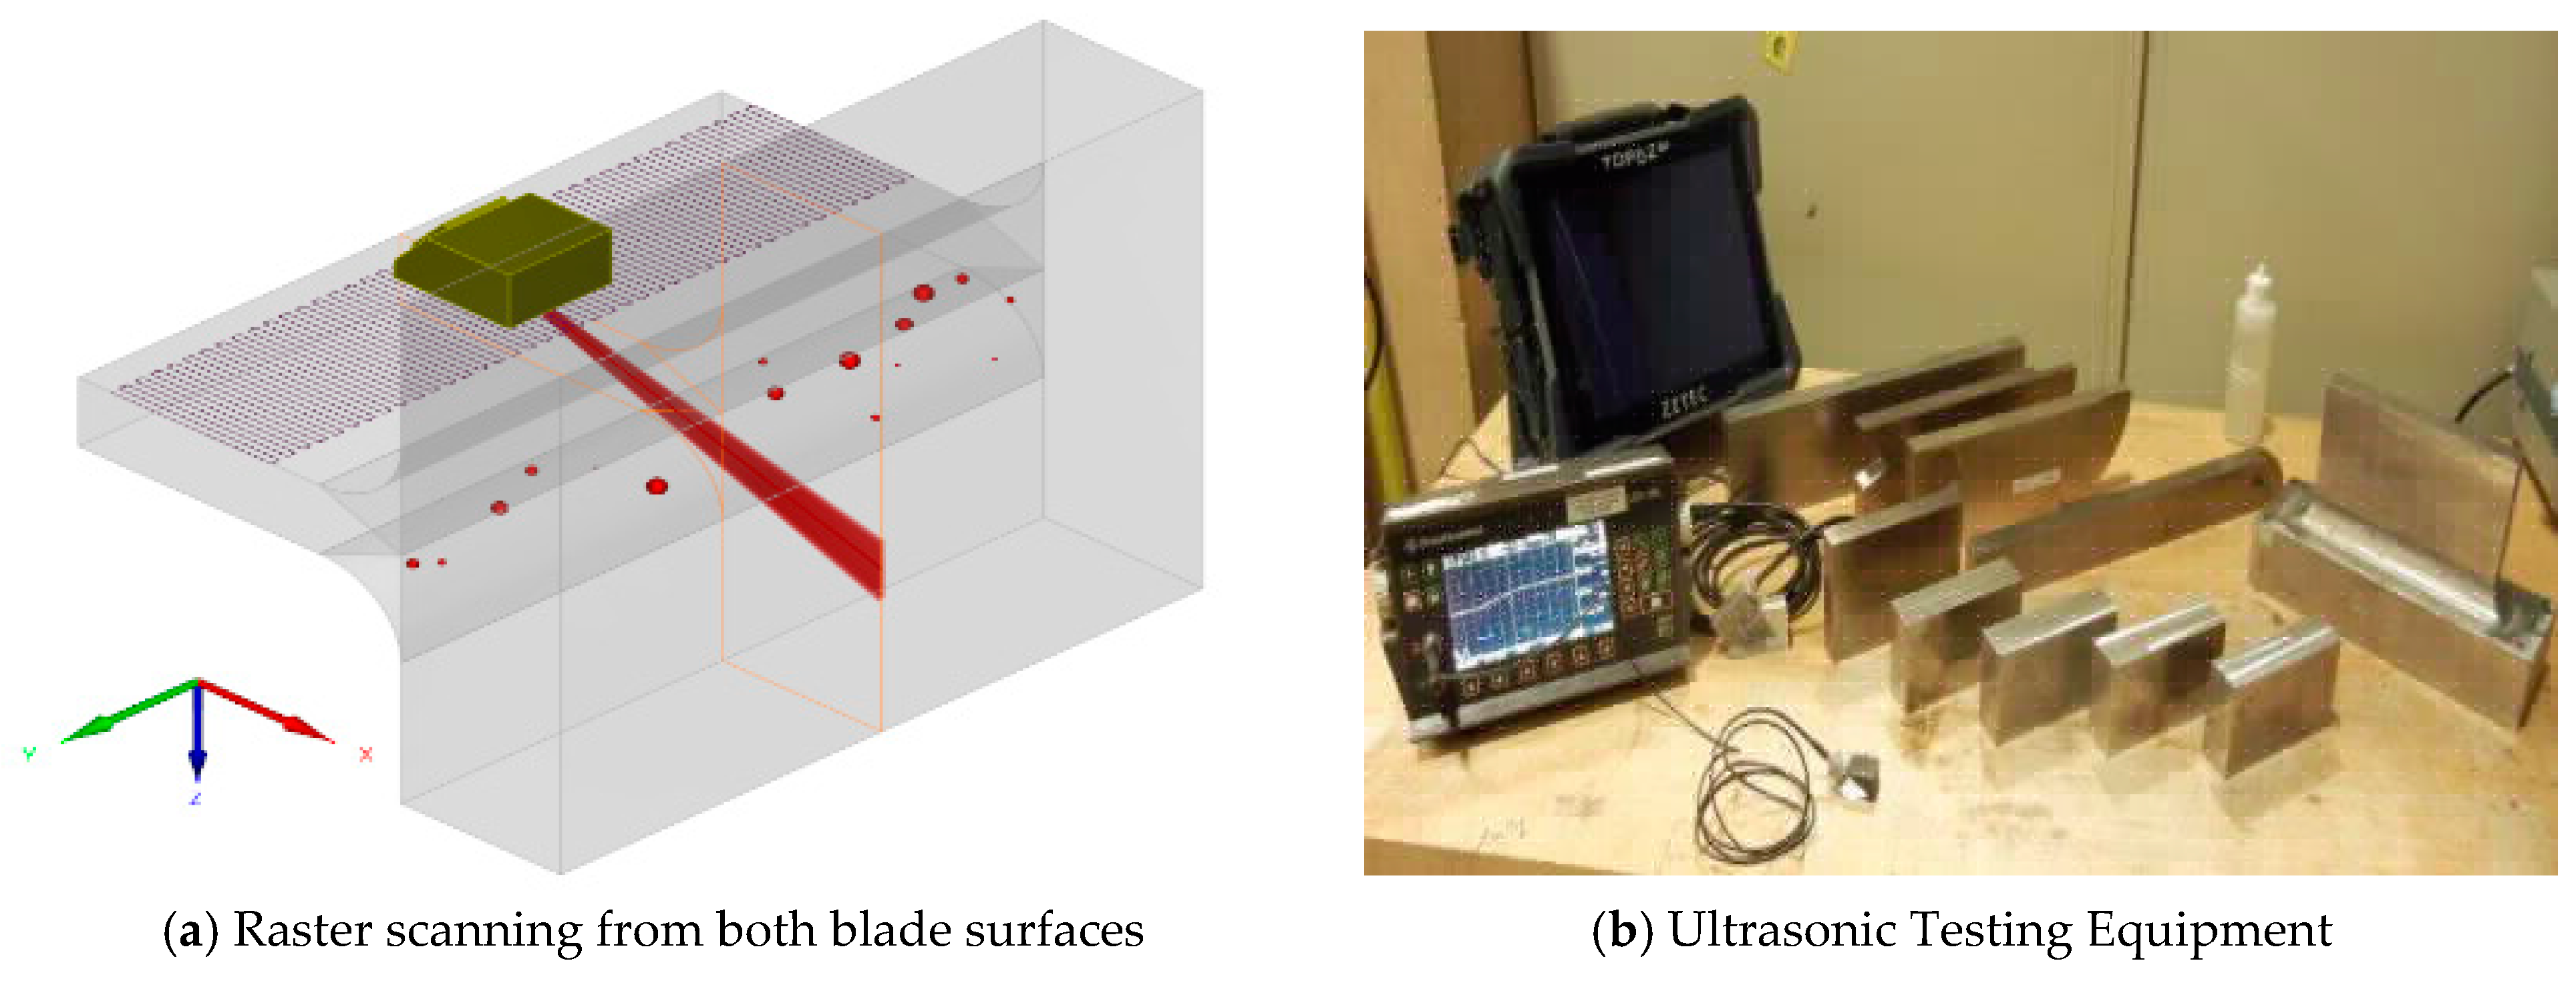
18]. The study used a flat, 2.25 MHz 1/2in round transducer mounted on a refracting wedge to produce a refracted shear wave beam at either 60° or 70° from normal. The conventional ultrasonic testing inspection was carried out using Olympus Epoch 600 and Krautkramer USN 58L Ultrasonic Flaw Detectors, as shown in
Figure 2. All indications, rejectable or not, were to be reported.
2.4. Phased Array Ultrasonic Testing (PAUT)
The scan plans prepared to inspect the regions of interest were devised according to standards. These scan plans indicate the required refracted beam angle and the probe standoff positions to ensure appropriate volume coverage. Wherever possible, welds shall be inspected from both sides of the blade [
19,
20,
21]. The ultrasonic system was calibrated using standard blocks to ensure the repeatability and reliability of experimental data [
18,
21].
Phased Array (PA) transducers can be referred to as multiple small conventional transducers (elements) that are housed within a single unit [
22]. Each transducer can be pulsed individually; by varying the delay between elements, the individual waves’ constructive interference will occur at the desired angle, which enables the focus to be achieved. The phased array technique is a beamforming method that relies on emission delay to shape the beam in terms of refracted angle and position of the near field. A set of delays required to create a specific beam angle and focus point is called a focal law [
23,
24,
25,
26]. By electronically changing the delays rapidly, the focal law group can produce an azimuthal scan with a starting angle, a final angle, and an angle step. For example, a focus group can use the following set of angles: starting at 40°, an increment of 1°, and stop at 70°. A phased array probe has limits for beam formation; hence, both wave physics and array limitation must be taken into account. In the experiment, the wedge nominal refracted angle is 55 shear wave and the array of 5 MHz, with 0.6 mm element spacing, produces an acceptable beam profile in the range of 40° to 70° shear wave [
27,
28,
29]. The PAUT inspection was carried out using TOPAZ 64, as shown in
Figure 2. The transducers were all linear Phased Array Ultrasonic probes operating at a center frequency of 5 MHz. The three models used in these inspections differ mainly in terms of the number of elements in the array, namely 12, 16, and 64 (
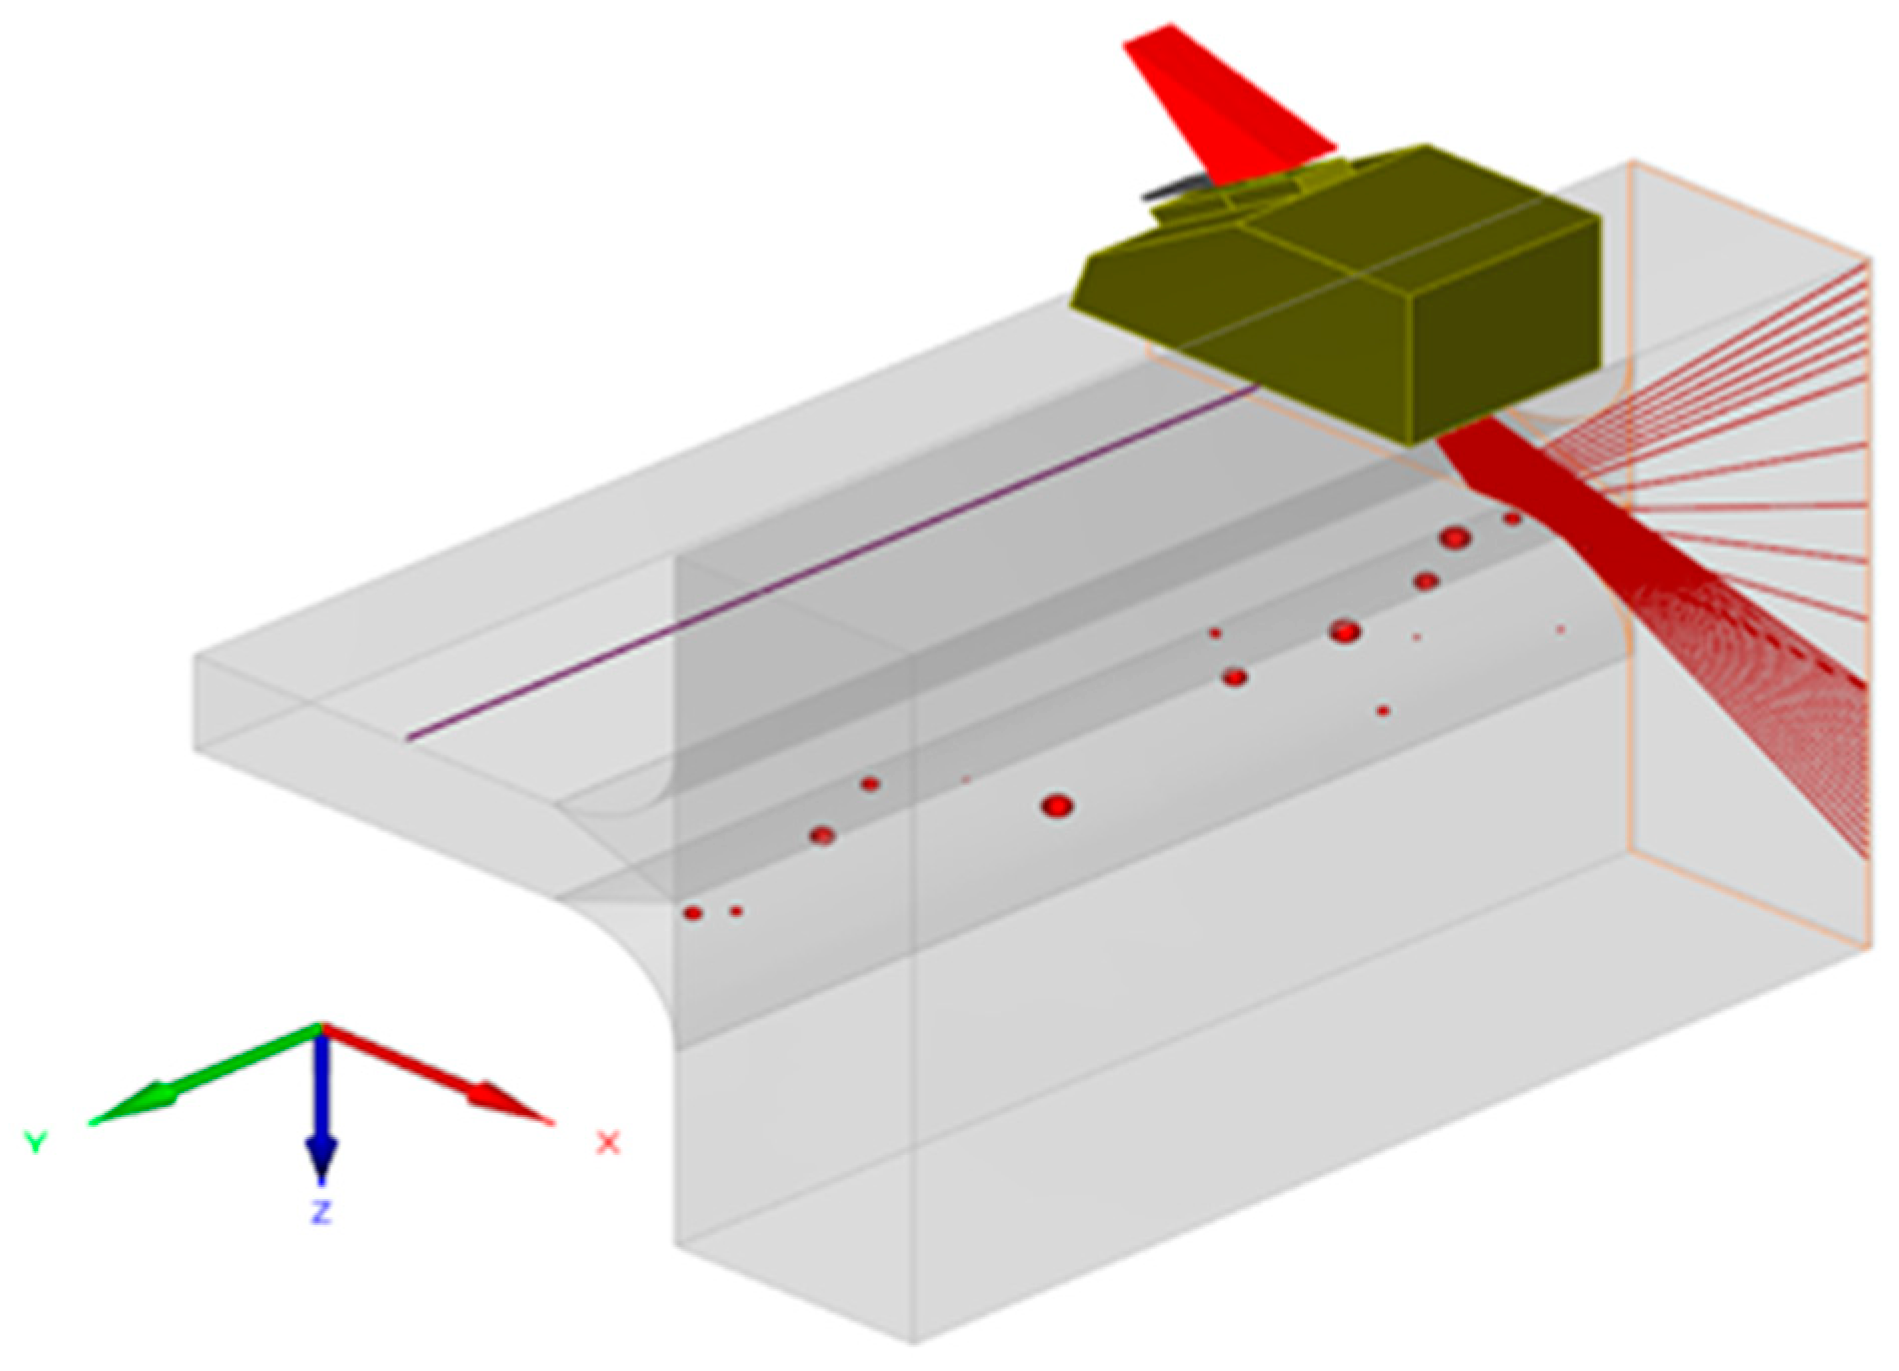
Table 1). They were all used to perform manual or linear-encoded sectorial (Azimuthal) scans ranging from 40° to 70° from normal incidence, as shown in
Figure 3. Data acquired along two different scan indexes (probe standoff positions) were combined to cover the whole volume of interest in a single file to analyze.
The study developed an inspection configuration in accordance with the number of transducer elements and the focal group’s capability to insonify the whole weld volume on the opposite face. The inspection strategy involves inspecting the direct skip to prevent beam spread and avoid ghost echoes caused by reflection from the weld cap’s curved radius. With a direct skip inspection, the ultrasonic configuration is simpler by mainly focusing the beam for a metal path range of 10 to 50 mm. These permit the use of 16 elements per focal law and use small footprint wedges or a 64-element transducer’s front elements to minimize the standoff distance. With these configurations, the focal group’s high angle can hit the T-joint center where it meets with the web, and the lower angles can probe most of the weld cap radius. Only a small hidden area exists and cannot be covered with angle beam inspection from the blade. The only inspection technique that can provide 100% coverage of the weldment is from the web using a normal incidence wedge. Inspection from the web was not attempted because this surface is not accessible during an in-service inspection.
The following conclusions can be drawn from the results obtained;
- (1)
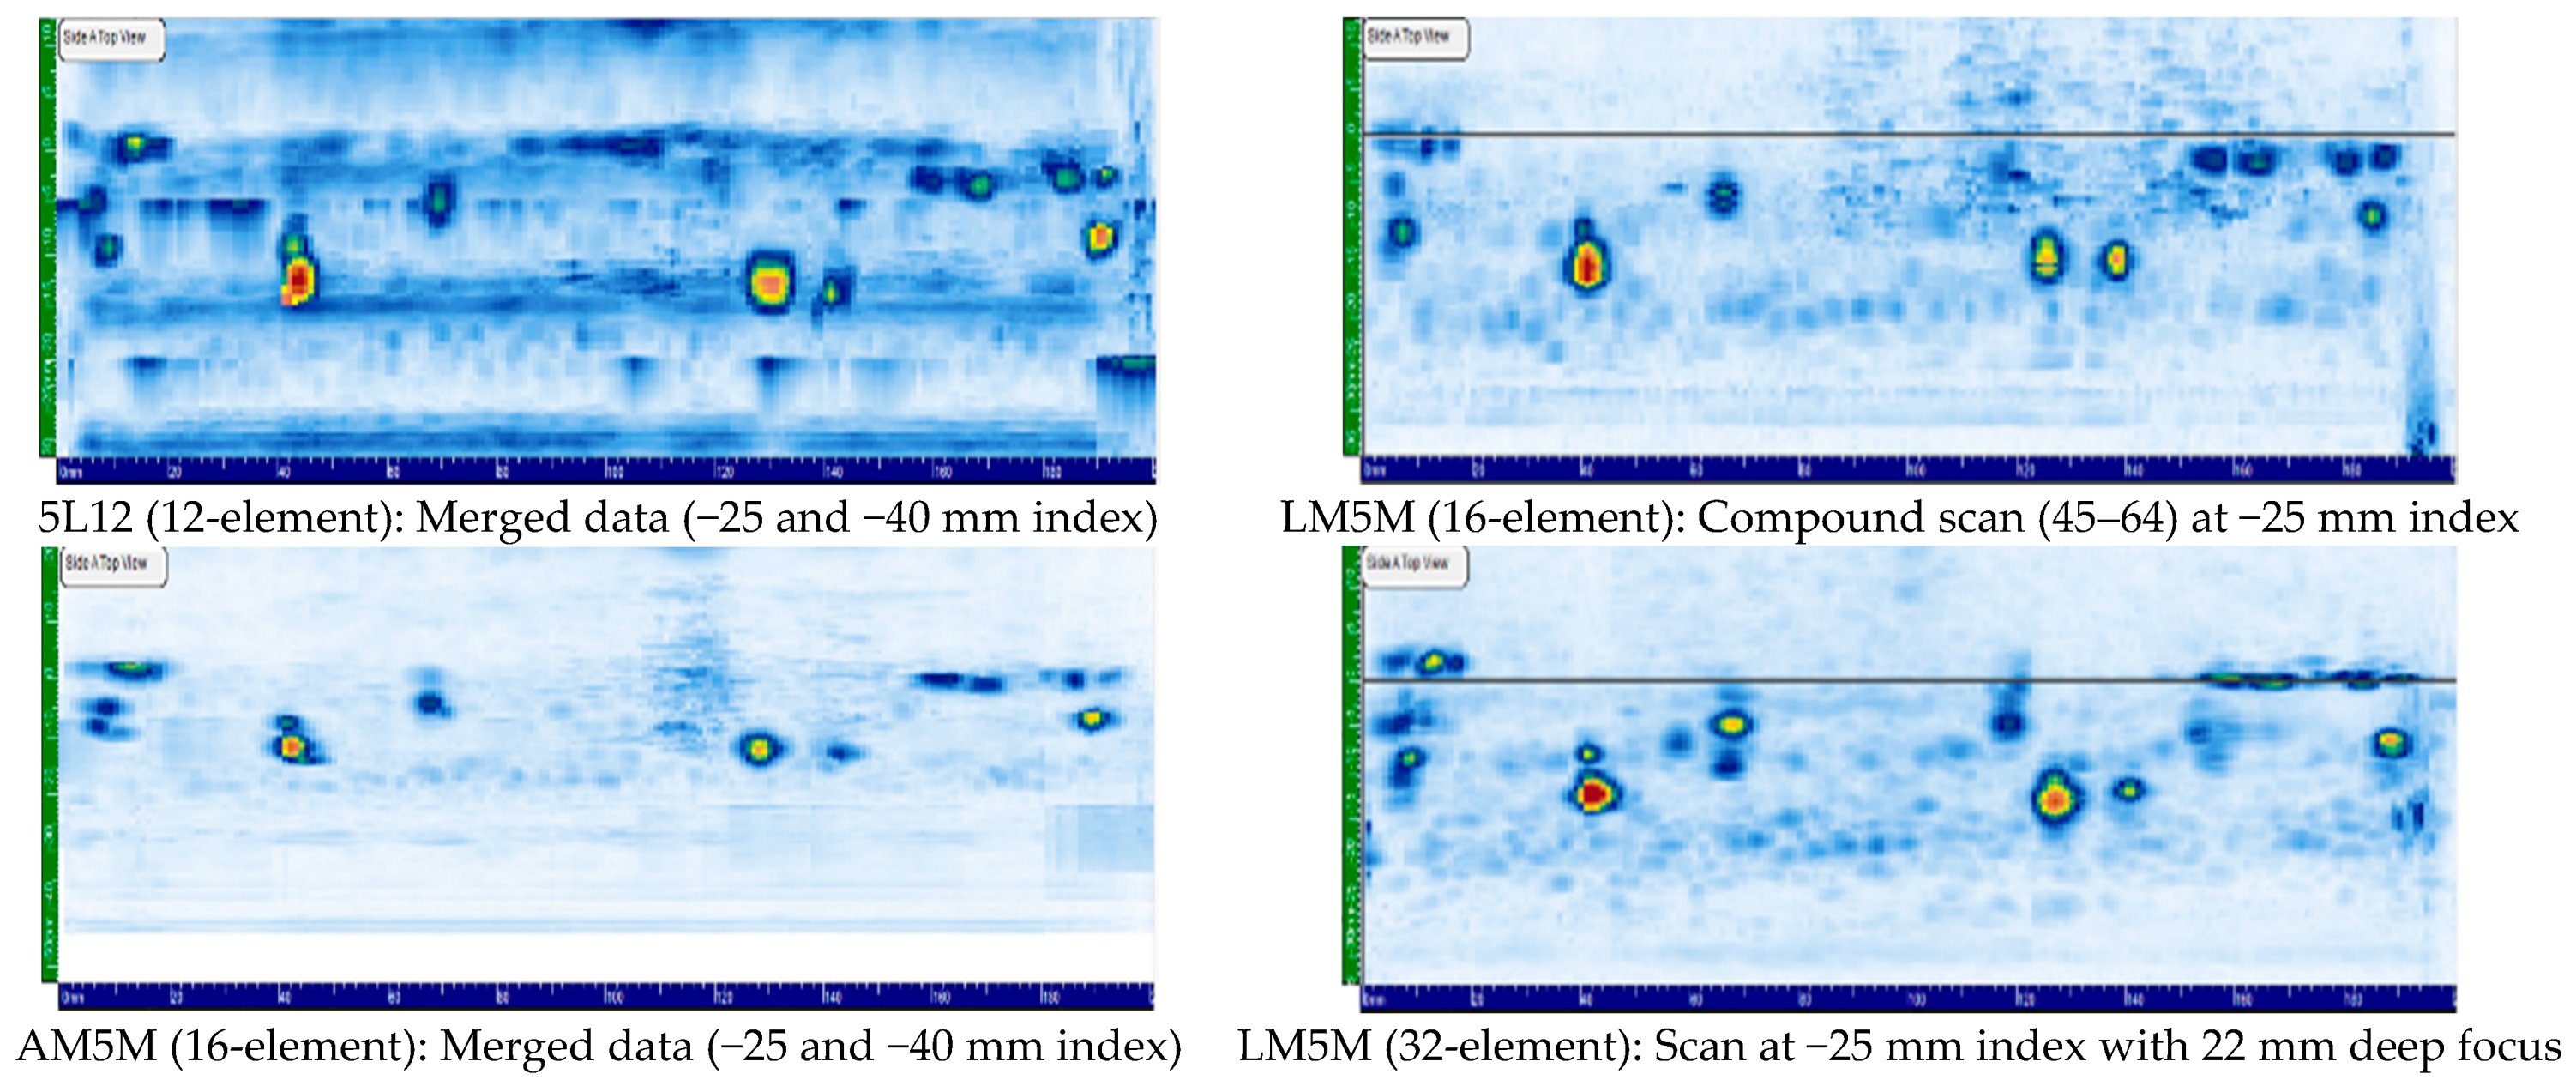
Flaw resolution increases with the number of active elements used in the array.
- (2)
However, the use of 32-element does not improve inspection performance. This finding could be attributed to the impact of a larger active aperture on the generated ultrasonic beam’s characteristics. Indeed, the beam’s exit point is further away from the weld’s edge in this case. Besides, the beam is larger, and its power is spread over a larger cross-section, thus reducing the echo reflected by a given flaw. Therefore, focusing has been added to this configuration to narrow down the beam size in the range of interest.
- (3)
Linear-encoded PAUT scans can distinguish two closely spaced flaws more easily than manual inspection. You can see example of PAUT results in
Figure 4.
2.5. Total Focusing Method (TFM)
Total Focusing Method (TFM) is still part of the Ultrasonic Testing (UT). This is because it uses the same basic principles as PAUT as well as the conventional UT [
29,
30]. In this study, the new phased-array technique called the TFM is included in the test matrix. Unlike the sectorial scan described previously, this technique is not a beamforming method. The TFM is an imaging technique that processes elementary A-scan data to extract the amplitude for a determined path from a firing to a receiving element [
31]. After multiplexing all elements as emitter and receiver and delaying and summing all the required amplitude, a data point in the region of interest is assigned an amplitude. The algorithm is simple, but the memory and processing burden increases geometrically with the increase in the number of elements of an array and the size of the area of interest. As a result, it is simple to achieve the configuration of TFM because once the transducer, the wedge, and the mode are defined, the user creates a rectangular area of interest, which is subdivided into a grid. In this regard, the grid spacing is the critical variable, which is normally smaller than one-fifth of the wavelength. However, if the spacing is above this value, the measured amplitude fails to be within 2 dB of the true amplitude, hence, producing unreliable results. All experiments respected the wavelength criteria and opted for values that had a spacing of at most one-tenth of the wavelength [
28,
29,
32].
The TOPAZ 64 includes a beam simulation amplitude map function that helps to optimize all the parameters. Therefore, with the use of TFM, the region of interest covered the whole weld on the opposite side of the entry surface [
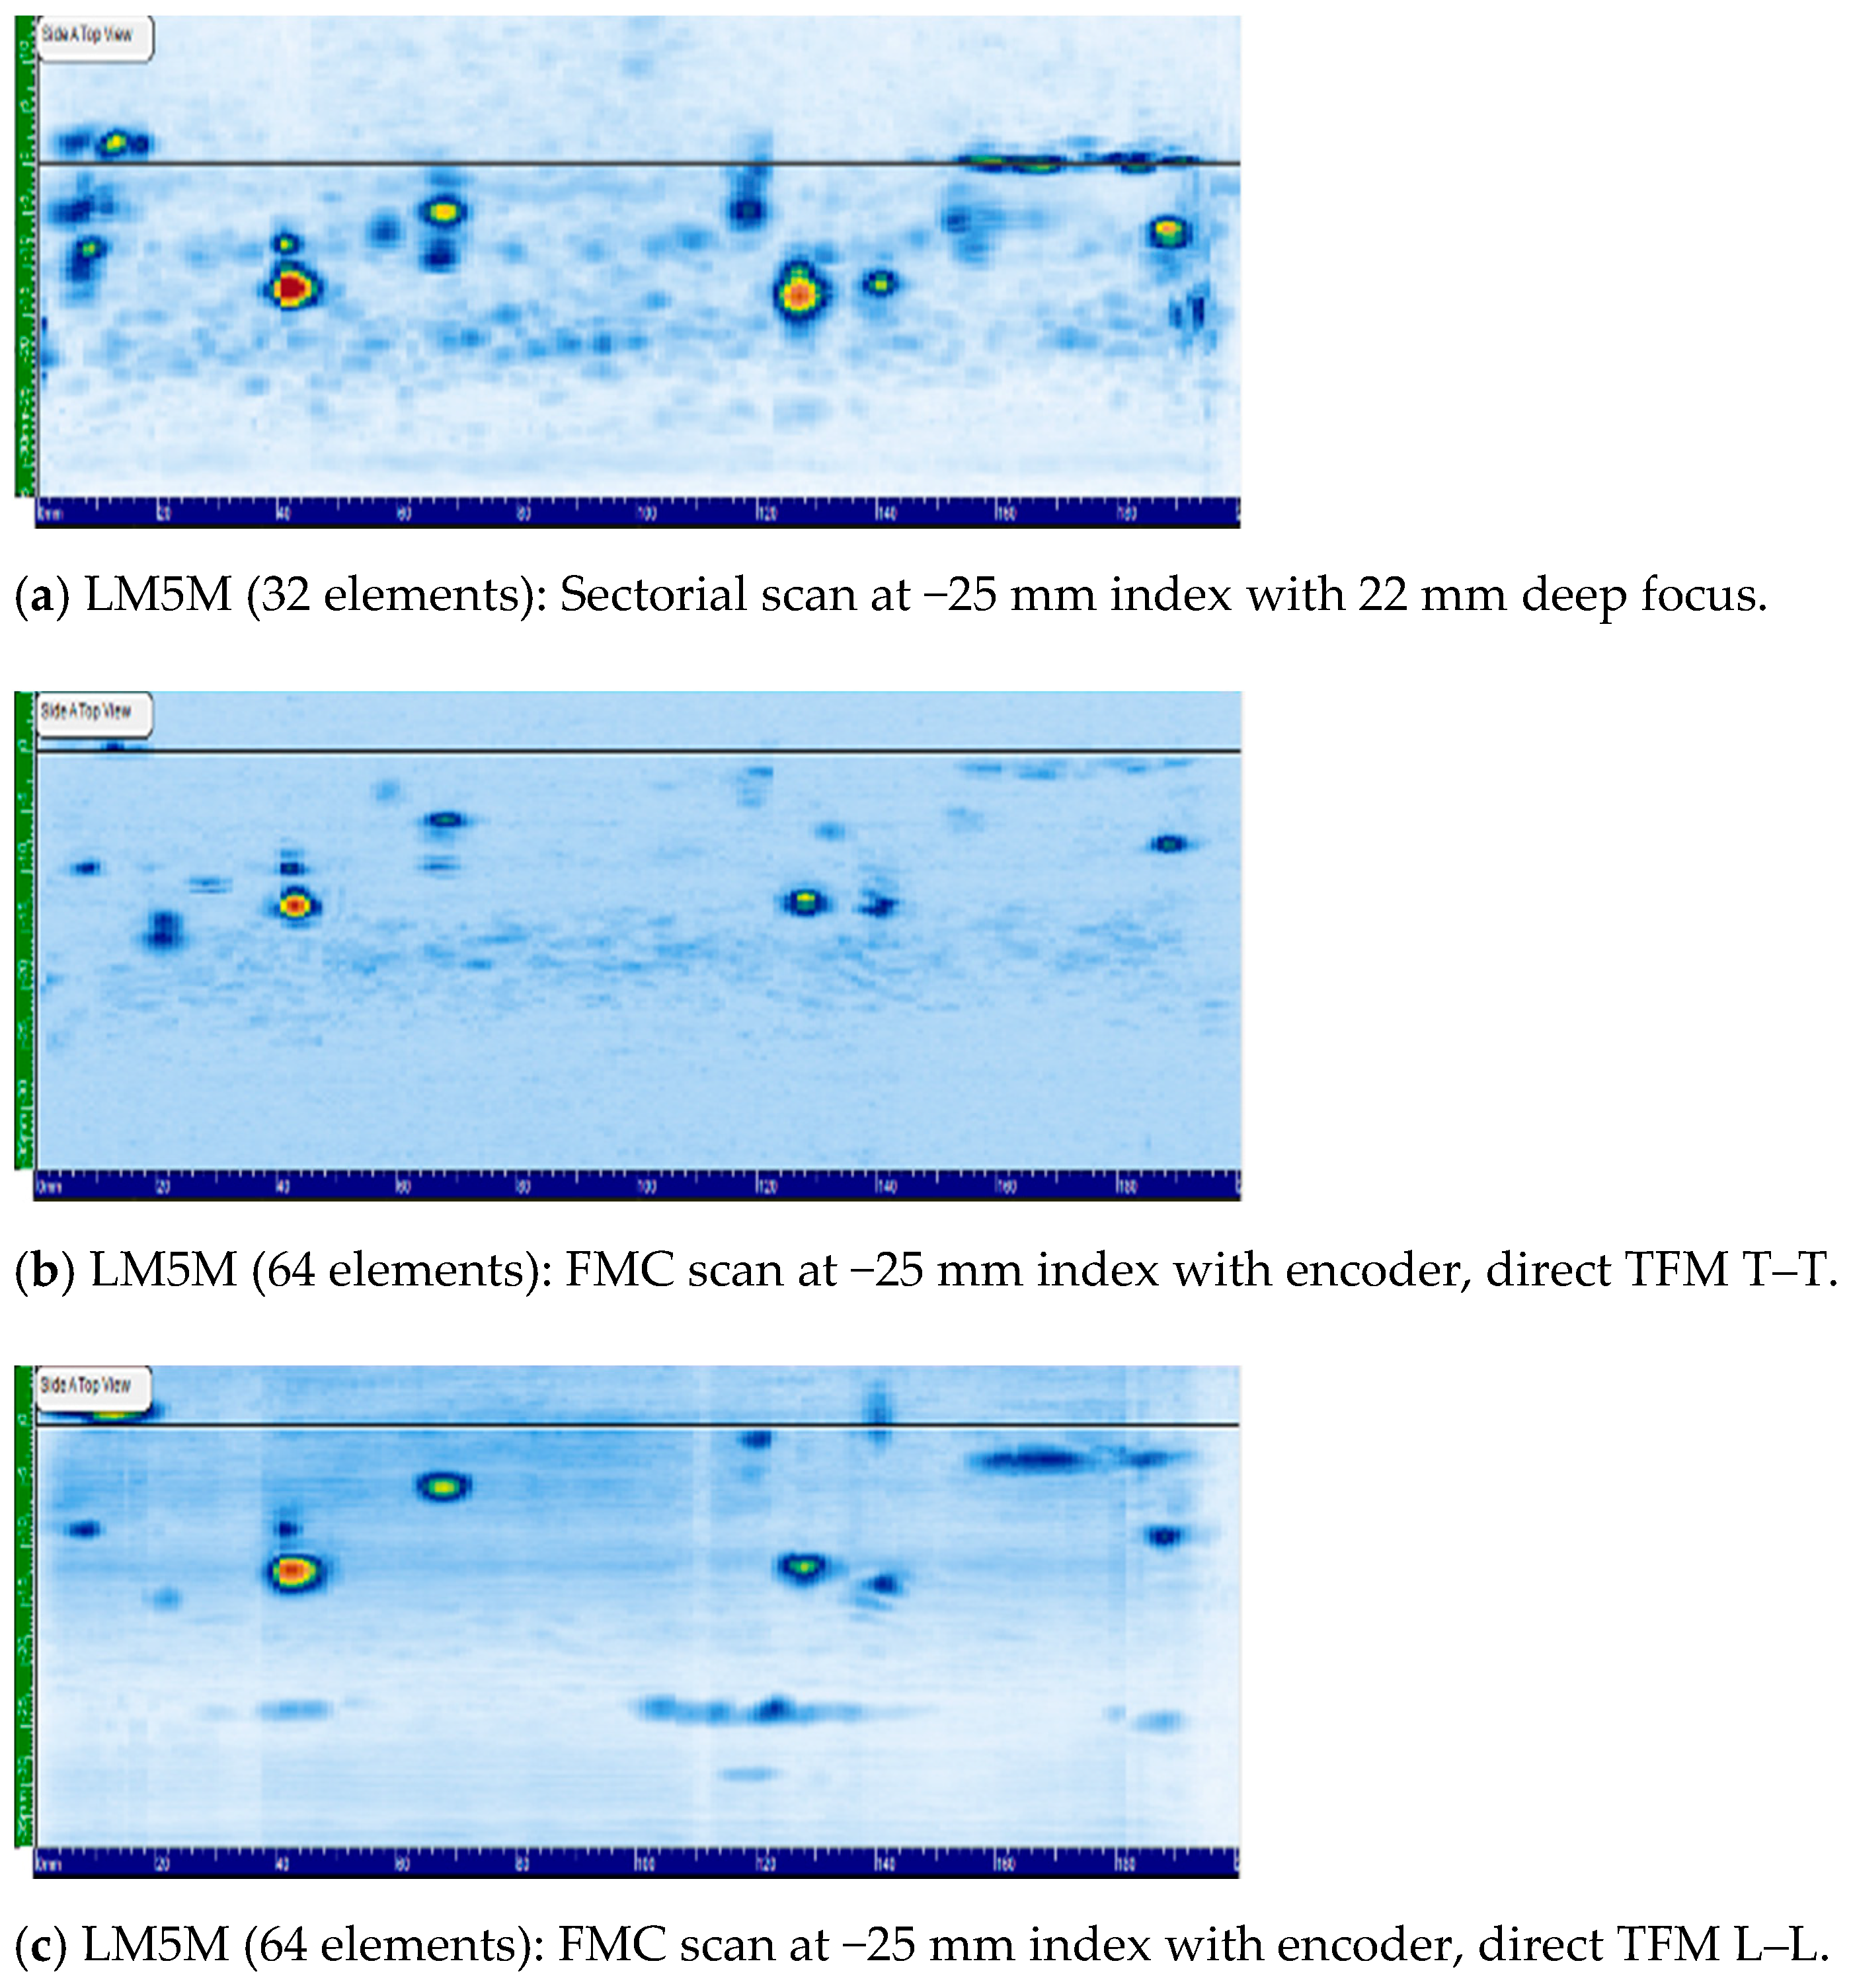
29]. In this regard, the sample was to be tested from both sides of the blade in order to fully cover the weldment. The experimental work used a 64-element linear array probe at a nominal frequency of 5 MHz. The study used two wedges, one for generating shear wave and one for generating compression wave and performed both manual and encoded scans. The linear encoder scan is done with the wedge’s front abutting the weld cap, which produces a scan index of −25 mm. For manually delivered inspection, the technician has the freedom to make transversal, lateral, and skewing movements to locate discontinuities and peak them. The T-joint was examined using T-T and L-L direct modes with linear encoded scans and manual inspection. The T-T and L-L modes were used in the experiments because they produce a good amplitude response from a volumetric discontinuity. In this study, before starting the sample’s inspection, the 3 mm SDH was used on the martensitic sample (same material properties) for TFM model calibration. From these results, we obtained the following conclusions;
TFM results appear clearer, with fewer spurious indications and better-defined flaw geometries.
The Longitudinal-Longitudinal reconstruction mode seems to give slightly better results than the Transverse-Transverse mode.
We obtained a slightly better detection rate with manual TFM as compared to the encoded one. We suspect that this is due to the operator’s ability to minutely adjust the probe’s position to improve the signal to noise ratio on the testing unit display. An example of TFM results (with two different reconstruction modes) compare with 32-element PAUT result is observed in
Figure 5.
2.6. Experimental Detection Rate
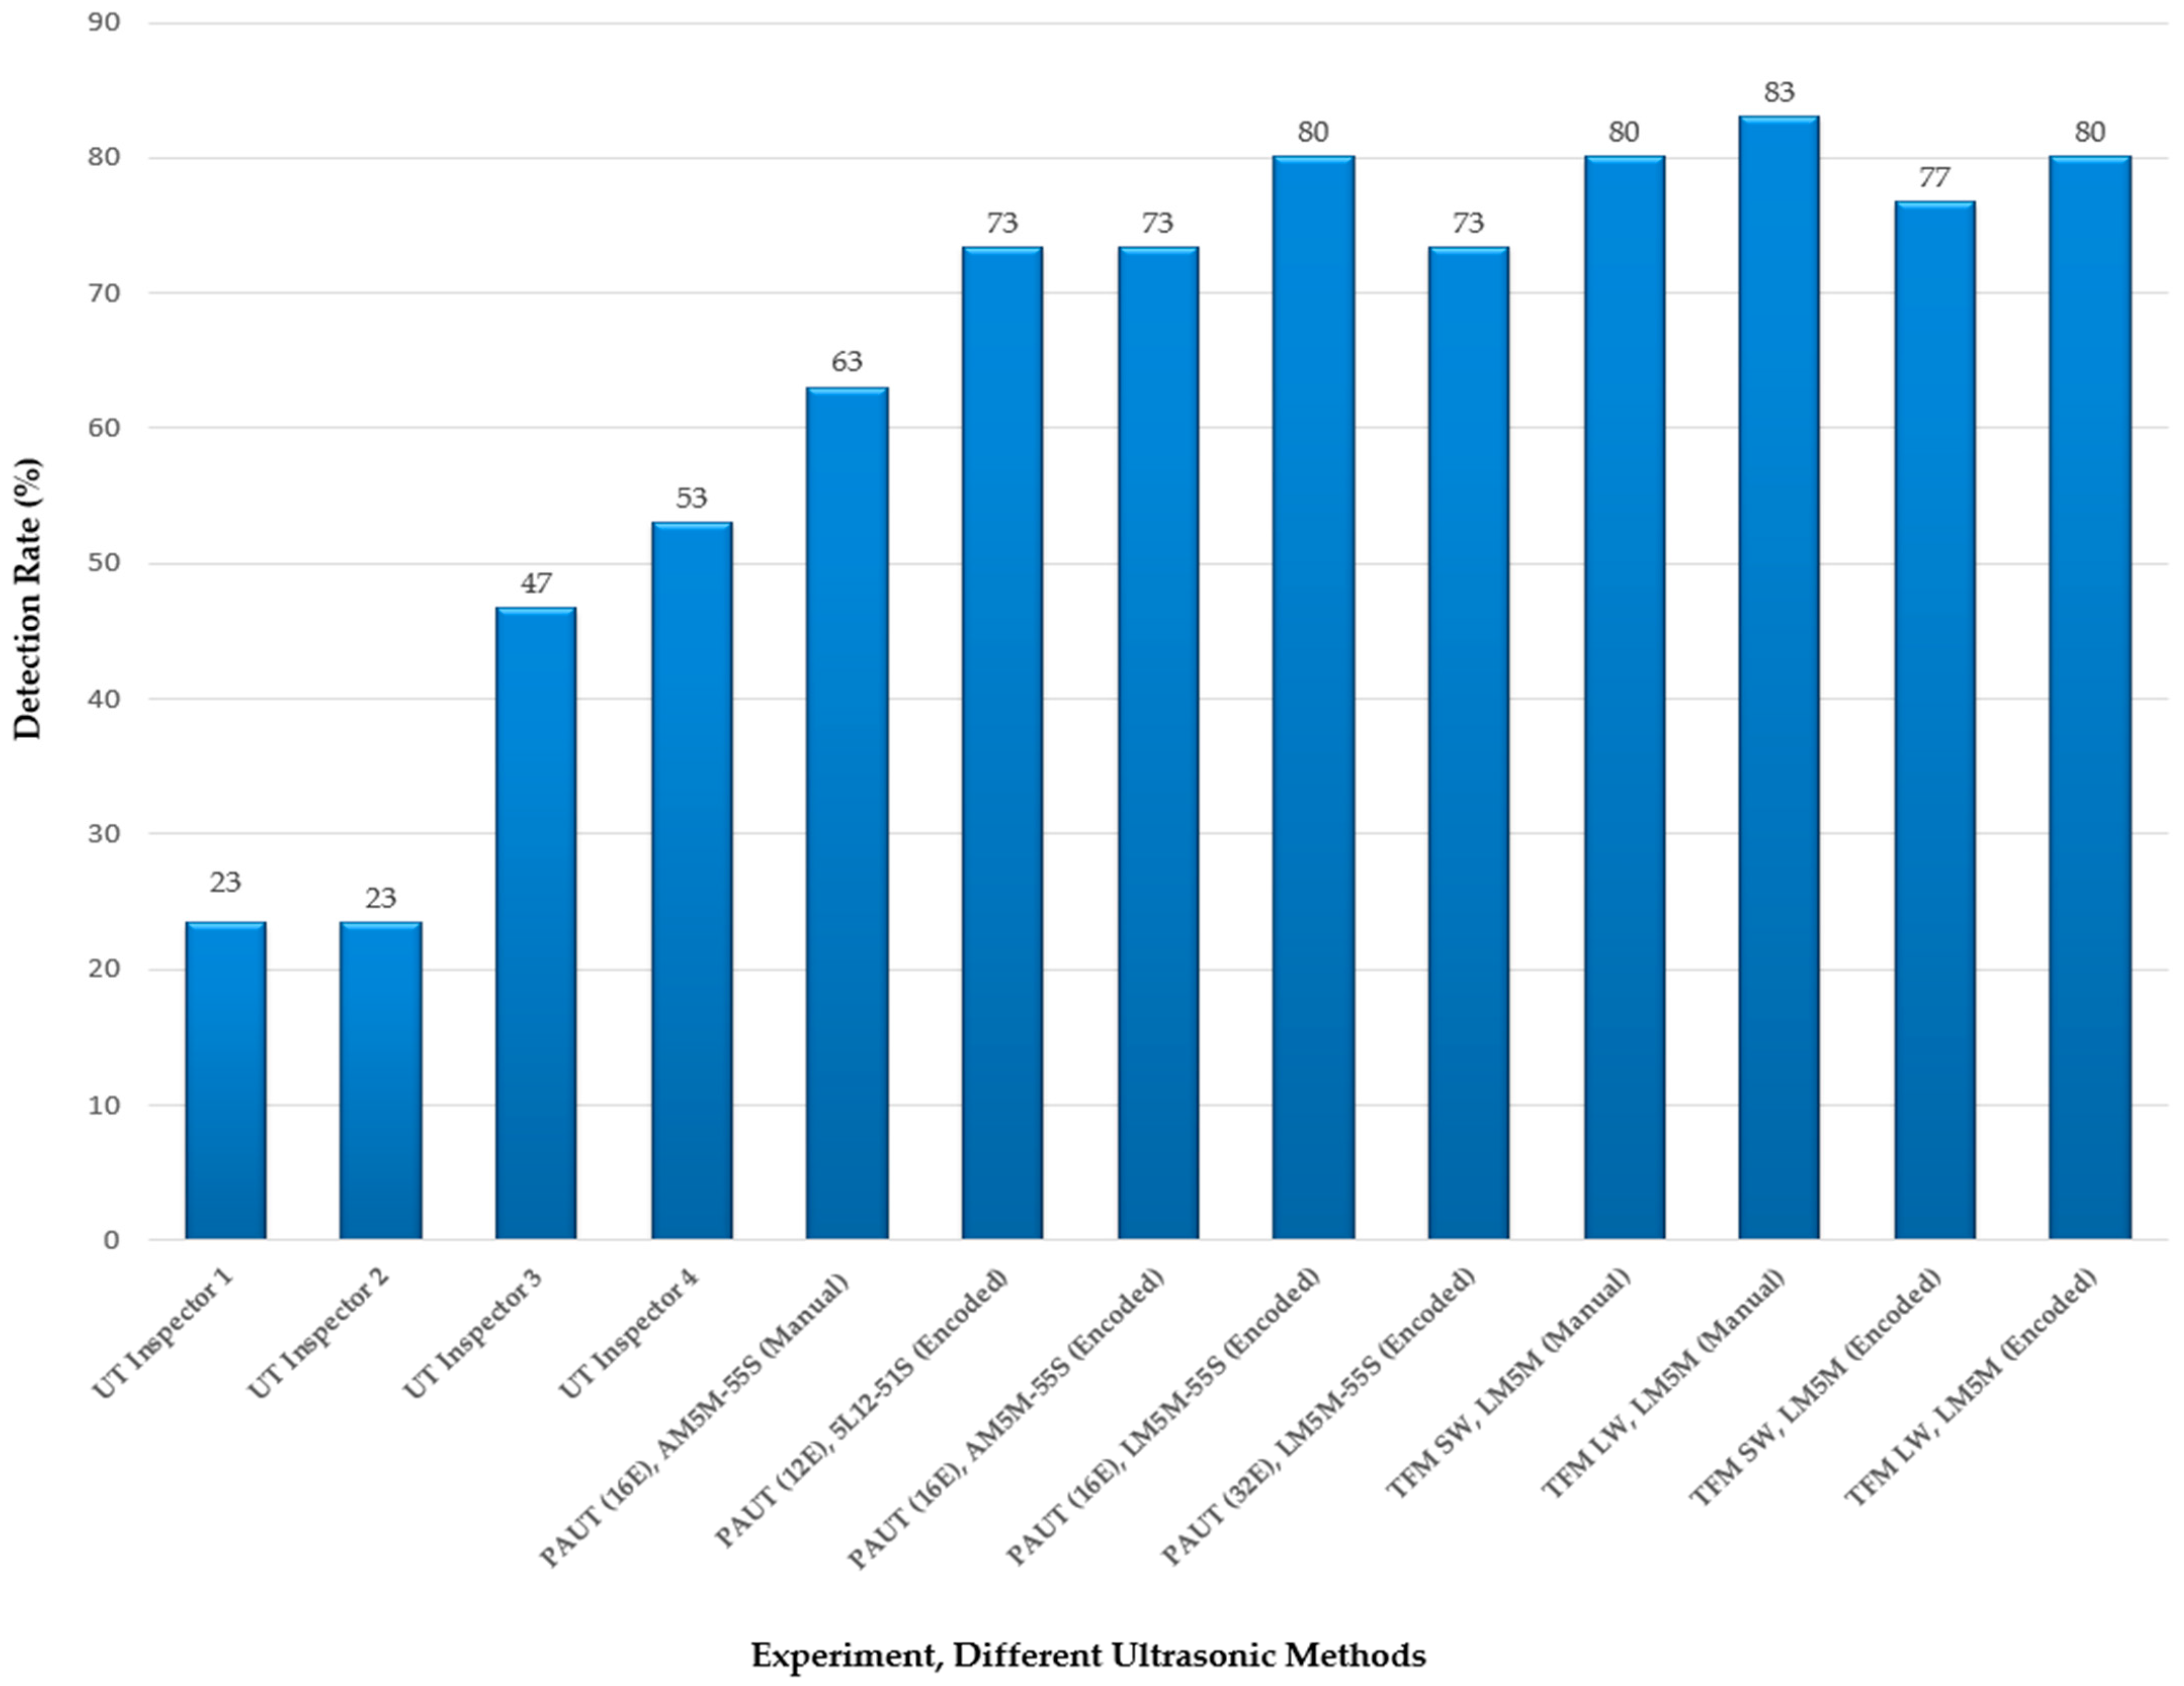
The performance of the different ultrasonic inspection techniques tested are compared in
Figure 6. Obviously, among all these techniques, conventional UT results have the lowest detection rate. This could be because the fixed-angle beam can miss a flaw more easily than with ultrasounds impinging the flaw from different angles. Although the inspection is carried out to a well-defined standard, the detection rate is highly dependent on the operator. The certified practitioners reported between 7 to 16 flaws out of the 30 embedded in the weld, with an average reporting of 11 flaws.
Several difficulties were observed with manual testing; (a) Challenging to report a flaw nearby a larger reflector with all the attention on the large reflector, (b) Manual reporting of flaw position is cumbersome and leads to errors, (c) Low amplitude signal just above the rejection threshold is easily discarded, (d) the report’s quality is directly related to the inspector’s diligence in taking clear and precise notes. If the report is written several days after the test, the notes’ quality is of paramount importance [
33].
Manual phased array inspection suffers some of the limitations observed with a fixed-angle beam probe. The detection is done on the fly, and the flaw’s information is written during the inspection. If the sample has several flaws, the technician can get confused when measuring and reporting flaws. However, one of the advantages of manual PAUT inspection is the freedom the operator has to explore a suspected flaw by executing various probe motion; pivoting the transducer or orbital movement to reveal the target’s volumetric features. The manual phased-array inspection provided the highest maximum amplitude measured and revealed flaws hidden in the trailing edge weld reinforcement. However, even if the manual phased-array found flaws hidden in the geometry, on average, it detected fewer flaws than the linear-encoded phased array.
The linear encoded inspection provides repeatable scans, and flaws with low amplitude are detected more readily by comparing the local base noise to check for any localized increase that would reveal a flaw. Close flaws may be separated, and when using the projection views, their location and separation can be measured. Generally, the aperture of 12 and 16 elements produced a reasonably good detection rate, and the small footprint of the 12-element transducer allows it to cover the center of the weld. As the aperture increases, the stand-of distance increases, and the weld’s center is no longer covered. This explains why the 32-element tests did not perform better than the 12 or 16 element tests despite having a smaller beam diameter and a more extended working range covering the whole weld path.
The TFM method produced a higher detection rate, slightly better than a sectorial scan. One advantage noticed during the test is the operator can readily size the diameter of the flaw. This helped identify small beads from noise since the shape was maintained while probing the area. The TFM could also probe nearer to the surface and provided good coverage of the whole weldment. There is no dead zone compared to a 32 element sectorial scan. In our sample, the material has a low noise level suitable for a TFM inspection, which explains the high detection rate obtained with the study sample. Another advantage of the TFM is flaws could be categorized in apparent size or apparent reflective features. Small ceramic bead produces a specific round-shaped signal area proportional to their size, while larger beads showed either oriented facets or multiple facets surrounding the bead. TFM provided details about the reflective surface’s nature, while a sectorial scan did not provide any hints about the flaw’s small features. A multi-element probe is, therefore, a better candidate in terms of detection rate. Although the difference is not huge, TFM seems to perform slightly better than standard PAUT sectorial scanning.
The optimum inspection strategy in order to reveal the most implanted flaws is to perform the inspection in two steps:
Step 1: linear encoded sectorial scan with an aperture of 16 elements or linear encoded TFM scan.
Step 2: manual inspection of the trailing edge and weld reinforcement using either a sectoral scan with an aperture of 16 elements or a 64-element TFM scan. In practice, because a real runner’s trailing edge is not a flat surface, a small PAUT probe with a 12 or 16- element aperture is the only practical method for that region.
3. CIVA Modelling and Analysis
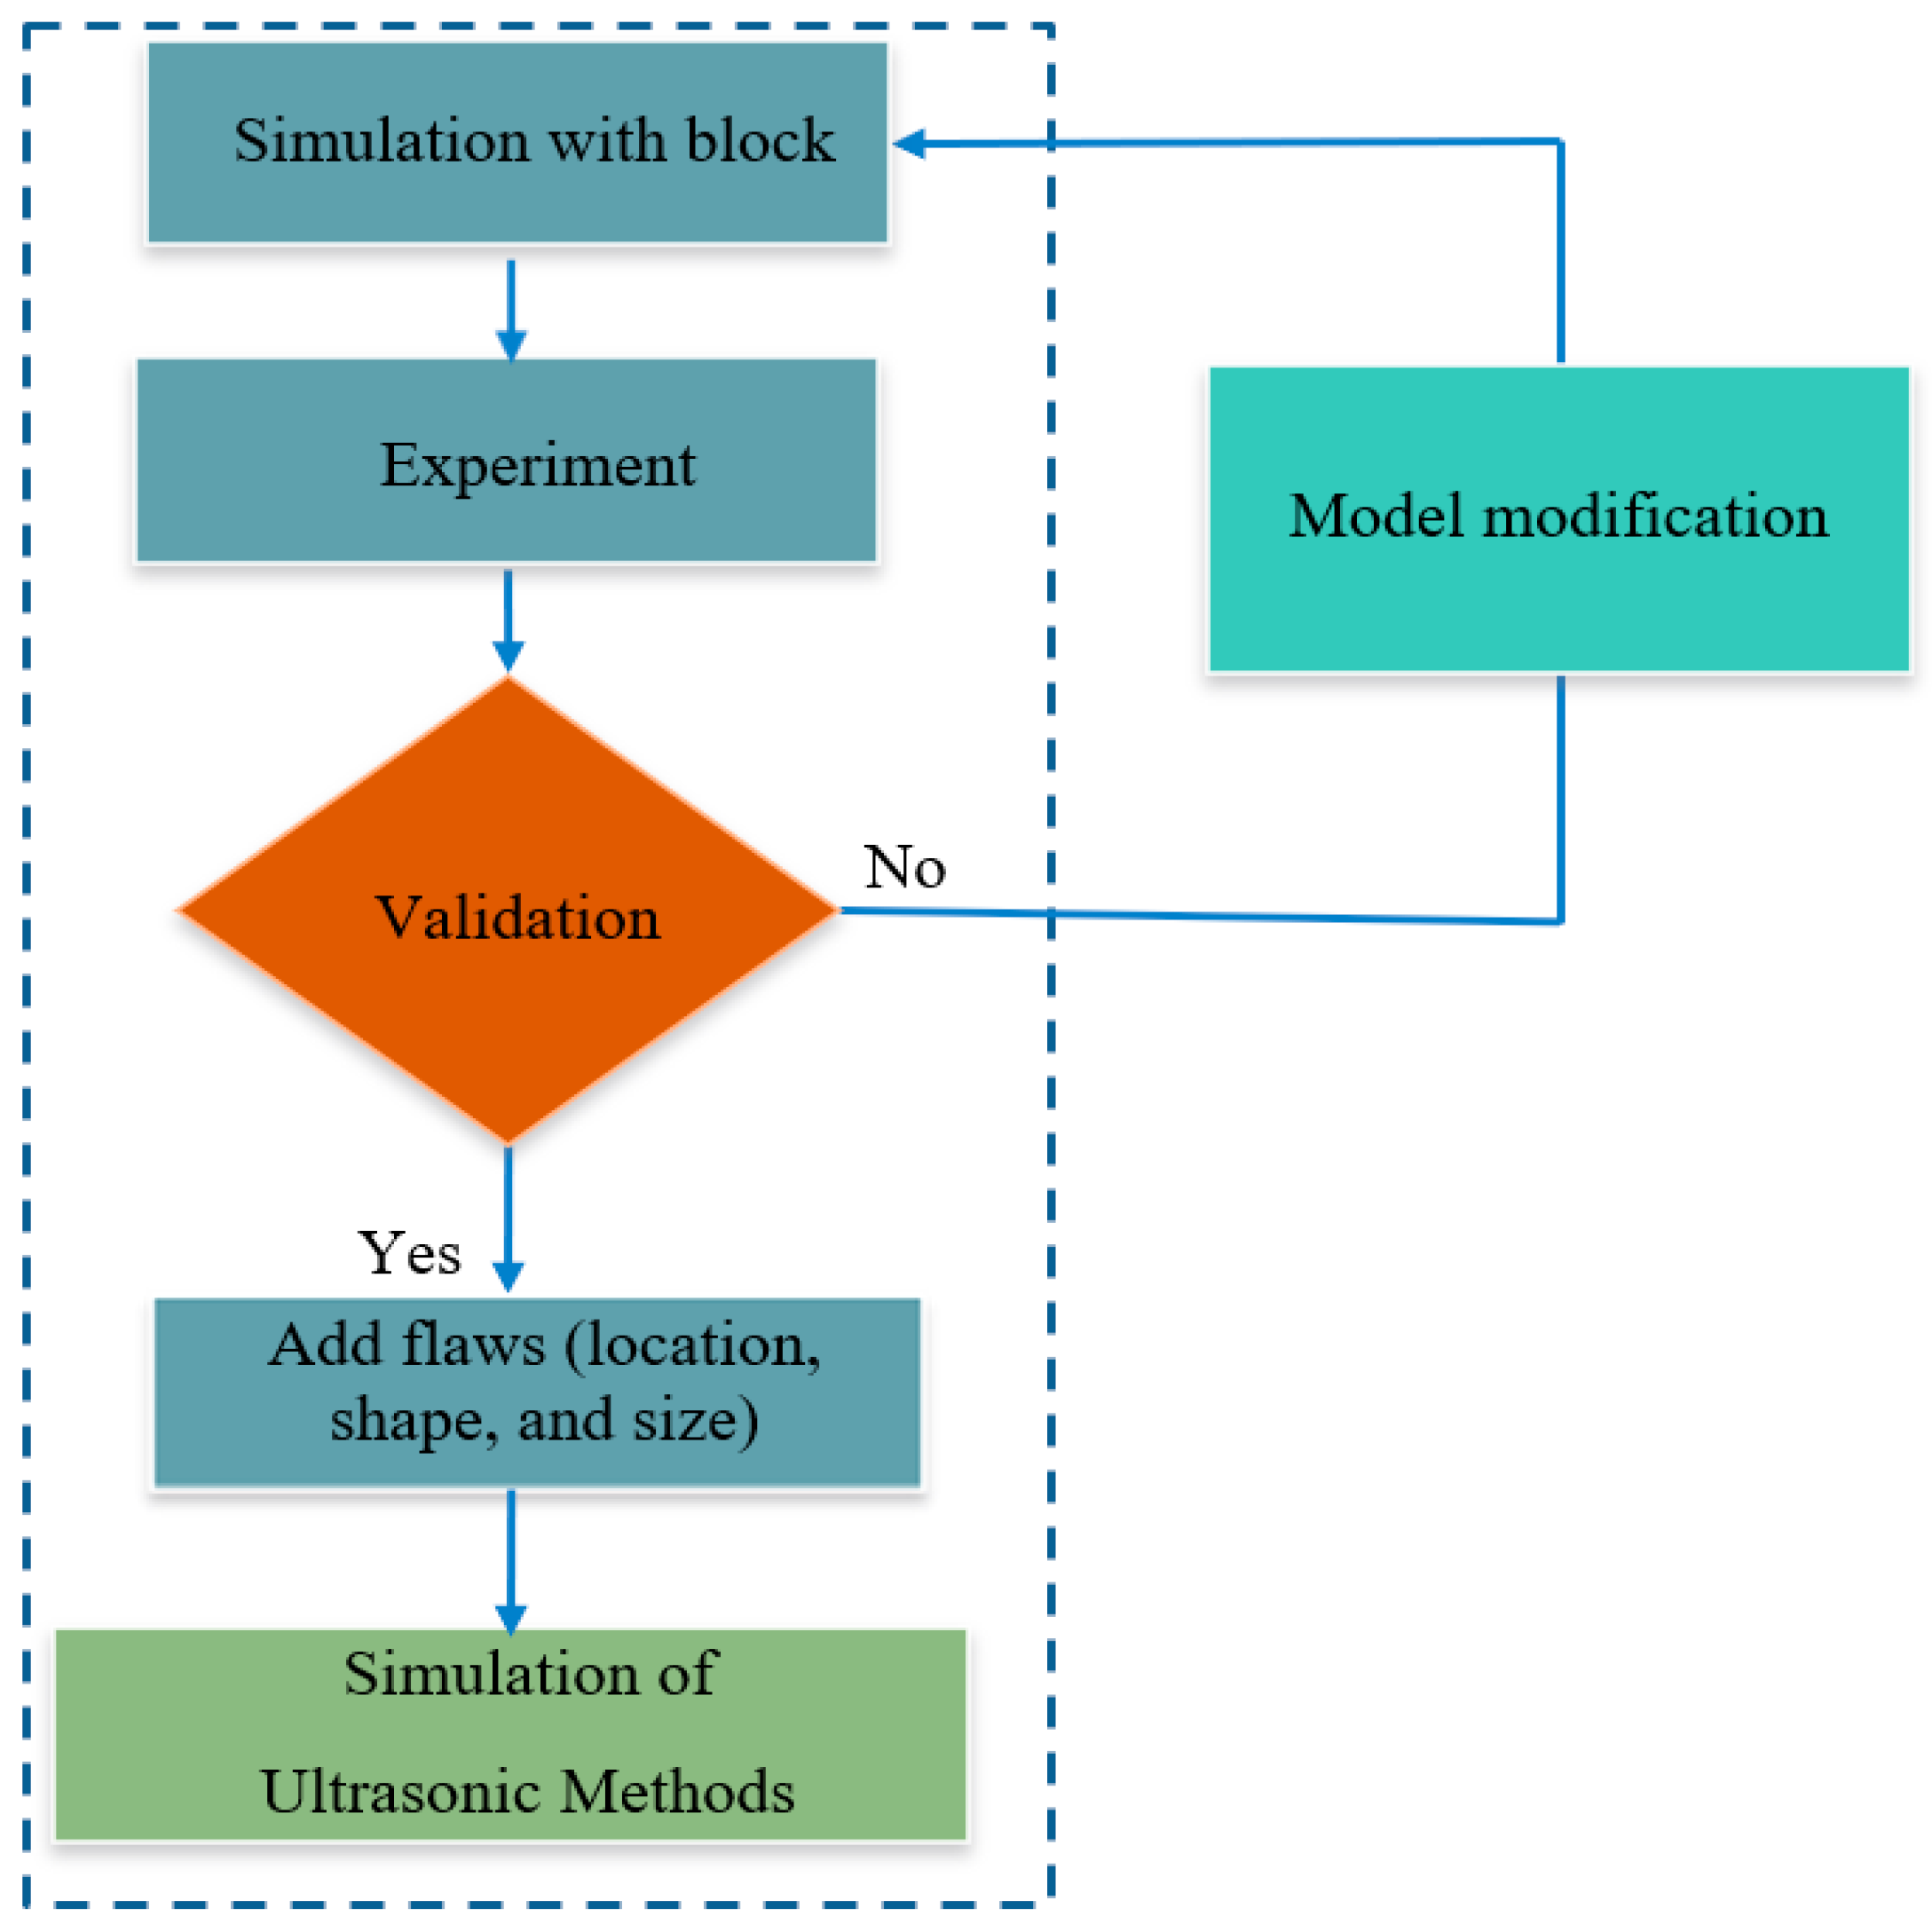
The current study used the ultrasonic module of CIVA to simulate the welded T-joint sample inspection considered previously. Models for the sample and the inspection system have been defined as accurately as possible. There is a wide range of input parameters available to the model (
Figure 7) [
34]; only to give a few of the different parameters that need to be entered, we can mention:
a CAD model describing the dimension of the sample.
ultrasonic properties of the steel used to manufacture the sample.
the location, the size, and the nature of the flaws distributed in the welded joints of the sample.
ultrasonic probe geometry including a description of the array settings required for PAUT.
the firing sequence of the elements as well as a description of the exciting impulse.
However, before embarking on a campaign of numerical simulations, it is necessary to validate the various parameters entered through measurements on real samples. This step was performed with a standard calibration block manufactured from the same steel alloy. The study carried out all the steps under the International Institute of Welding [
35,
36,
37].
3.1. Simulation of Conventional Ultrasonic Testing (UT)
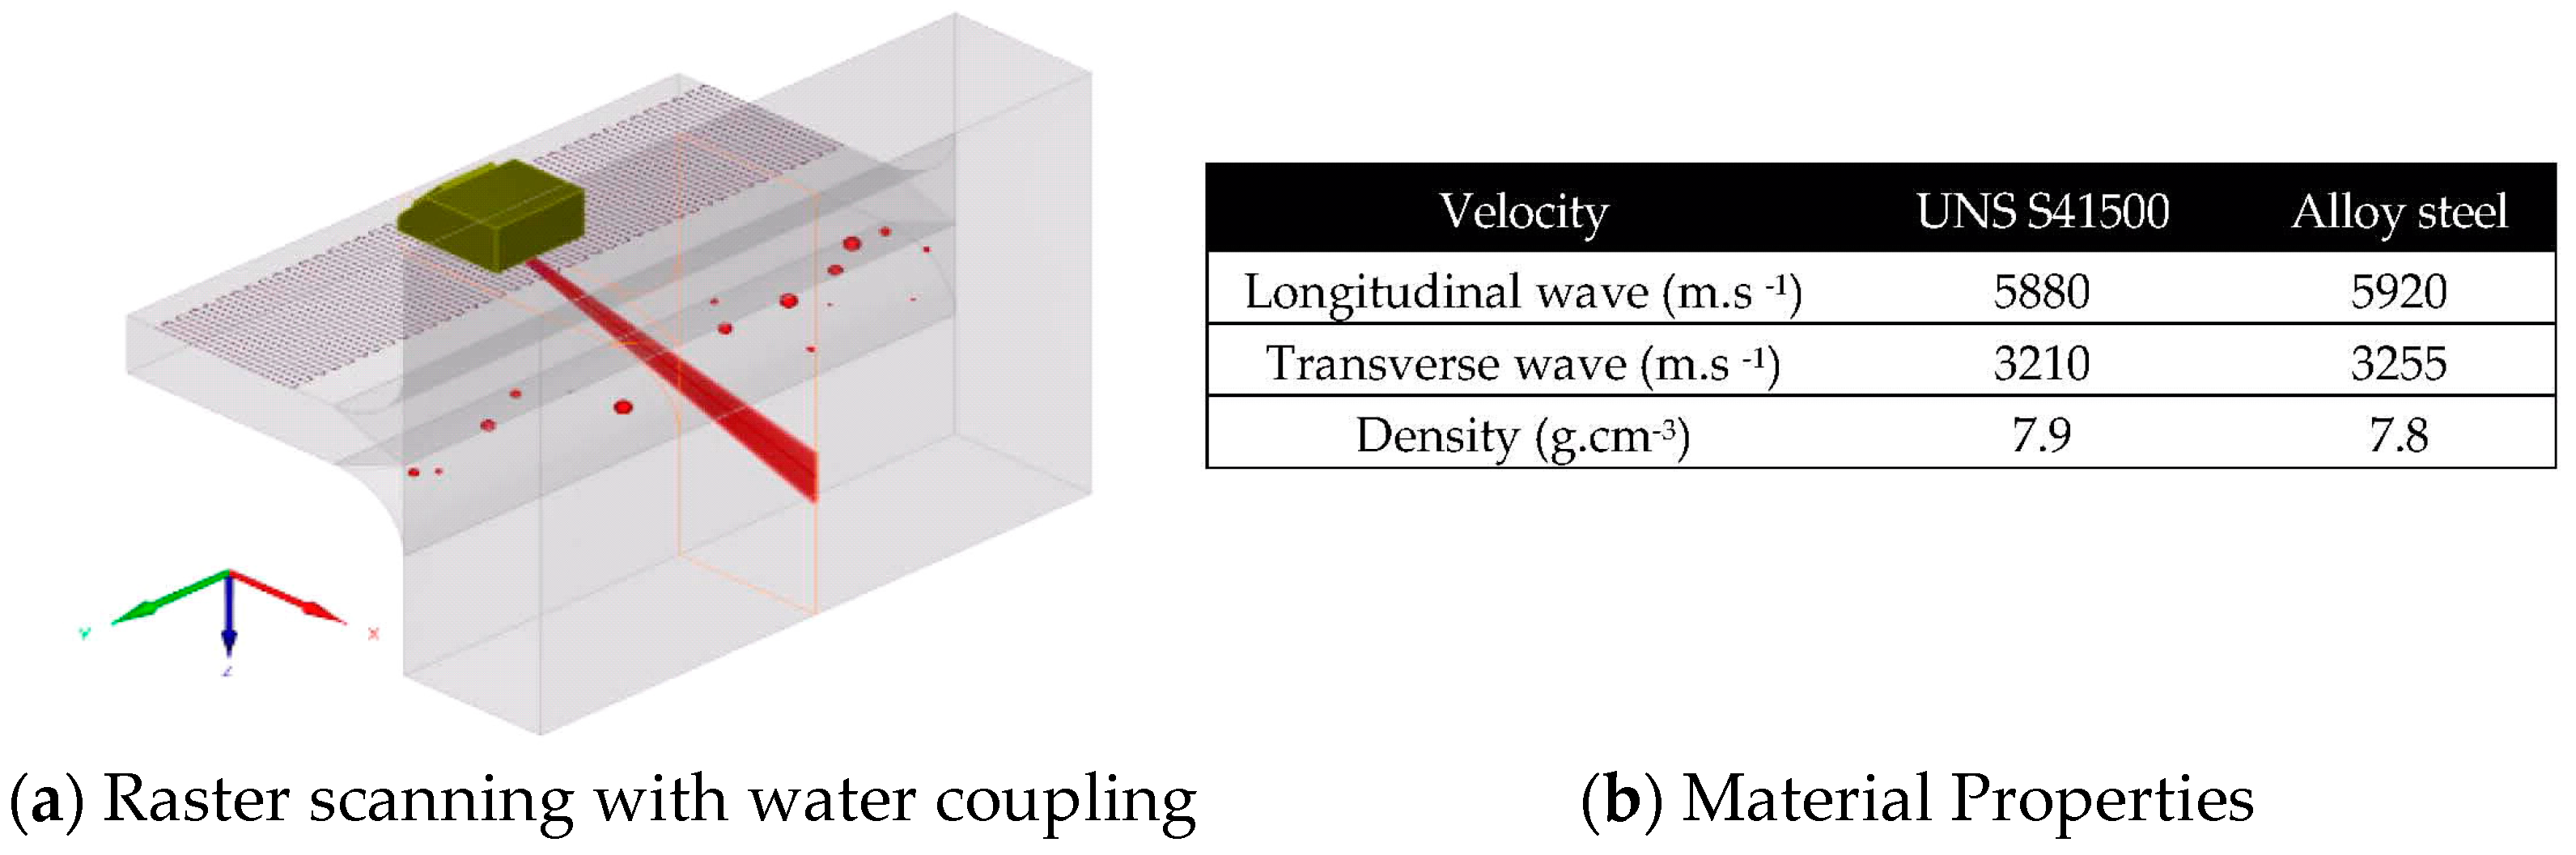
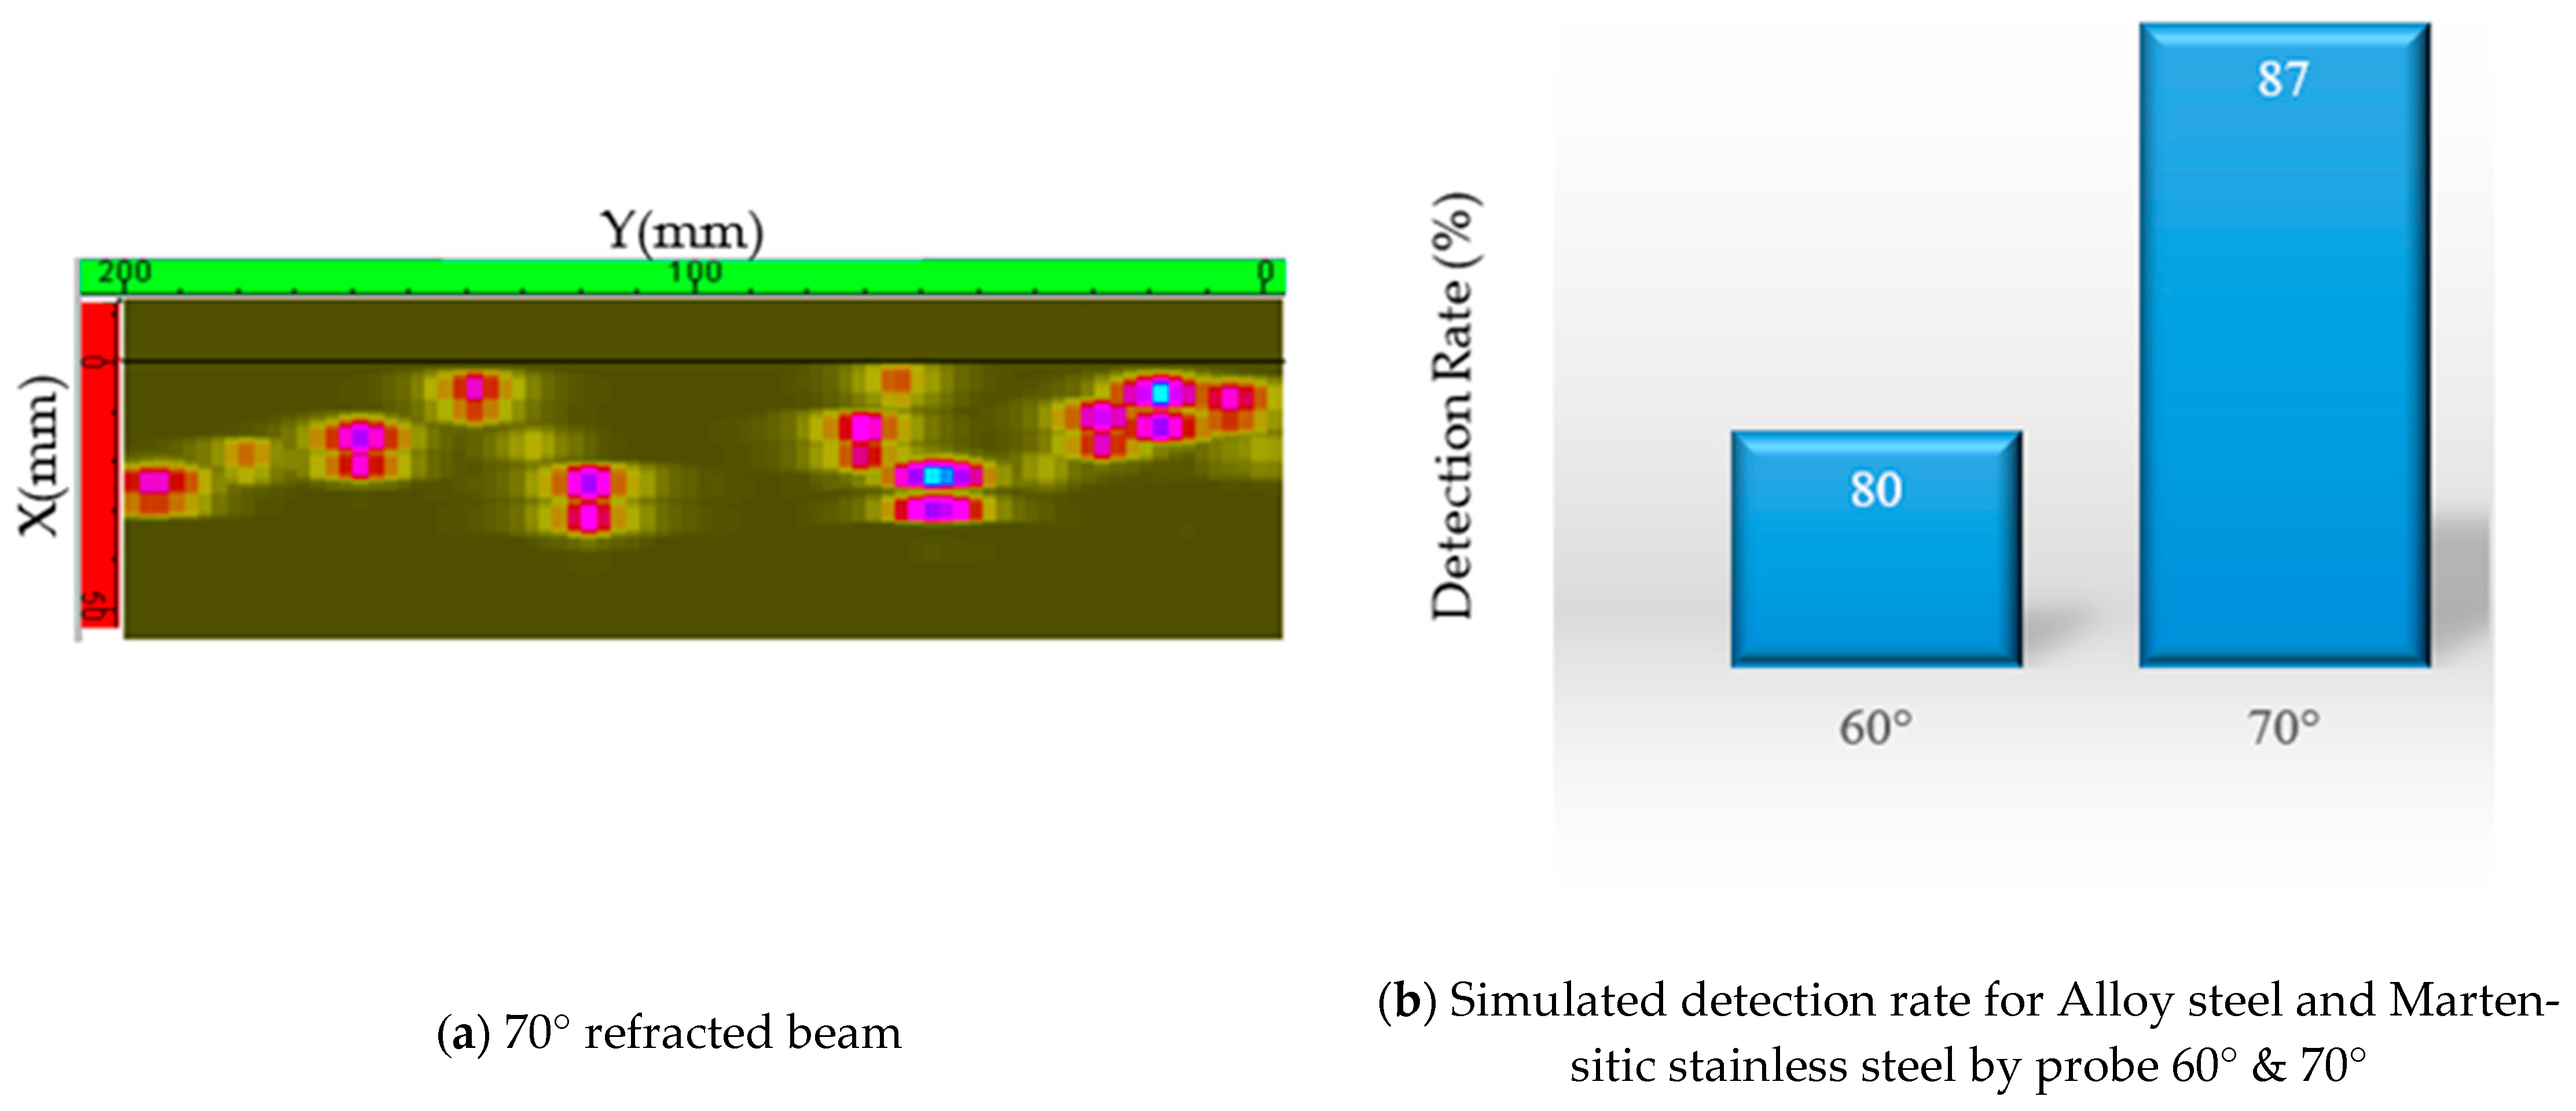
A rectangular single element crystal assembled to simulate conventional ultrasonic testing to a flat refracting wedge was selected as the probe. Both beams refracting at 60° and 70° were tested, as shown in
Figure 8. Two steel alloys with slightly different ultrasonic properties have been used for the T-joint sample model. Spherical voids, whose distribution and size mirror the manufactured T-joint sample, have been inserted into the model, as shown in
Figure 9. In the real sample, the flaws were produced by silicon nitride balls whose ultrasonic impedance is very similar to that of steel. However, experimentally, we have noticed that ultrasonic reflection does not come from an impedance mismatch at the steel/ceramic interface but from a lack of wetting between the two. Therefore, for simulation purposes, we prefer to use voids. According to Hydro-Quebec’s procedure, the numerical system’s sensitivity was calibrated, namely, a side-drilled-hole with a diameter of 1.5 mm at a depth of 20 mm.
The following conclusions were obtained from the simulation results: Sample alloys appear to have little to no impact on the system’s detection rate and could probably be attributed to the similarity between the two alloys’ ultrasonic properties. Further work will consider the impact of steel microstructure on the ultrasonic beam’s scattering, increasing its attenuation and producing a higher background noise level. Beam refracted at 70° gave a better detection rate than beam refracted at 60°. This result agrees with our experimental measurements and tends to prove our hypothesis; namely, this performance is due to the beam’s larger divergence. However, we observe a significant difference between the simulated detection rate (
Figure 10) compared to that obtained experimentally (
Figure 6). The reasons for this difference are that the ceramic beads do not behave exactly like a void, and the simulation does not capture the operator’s judgment.
3.2. Simulation of Phased Array Ultrasonic Testing (PAUT)
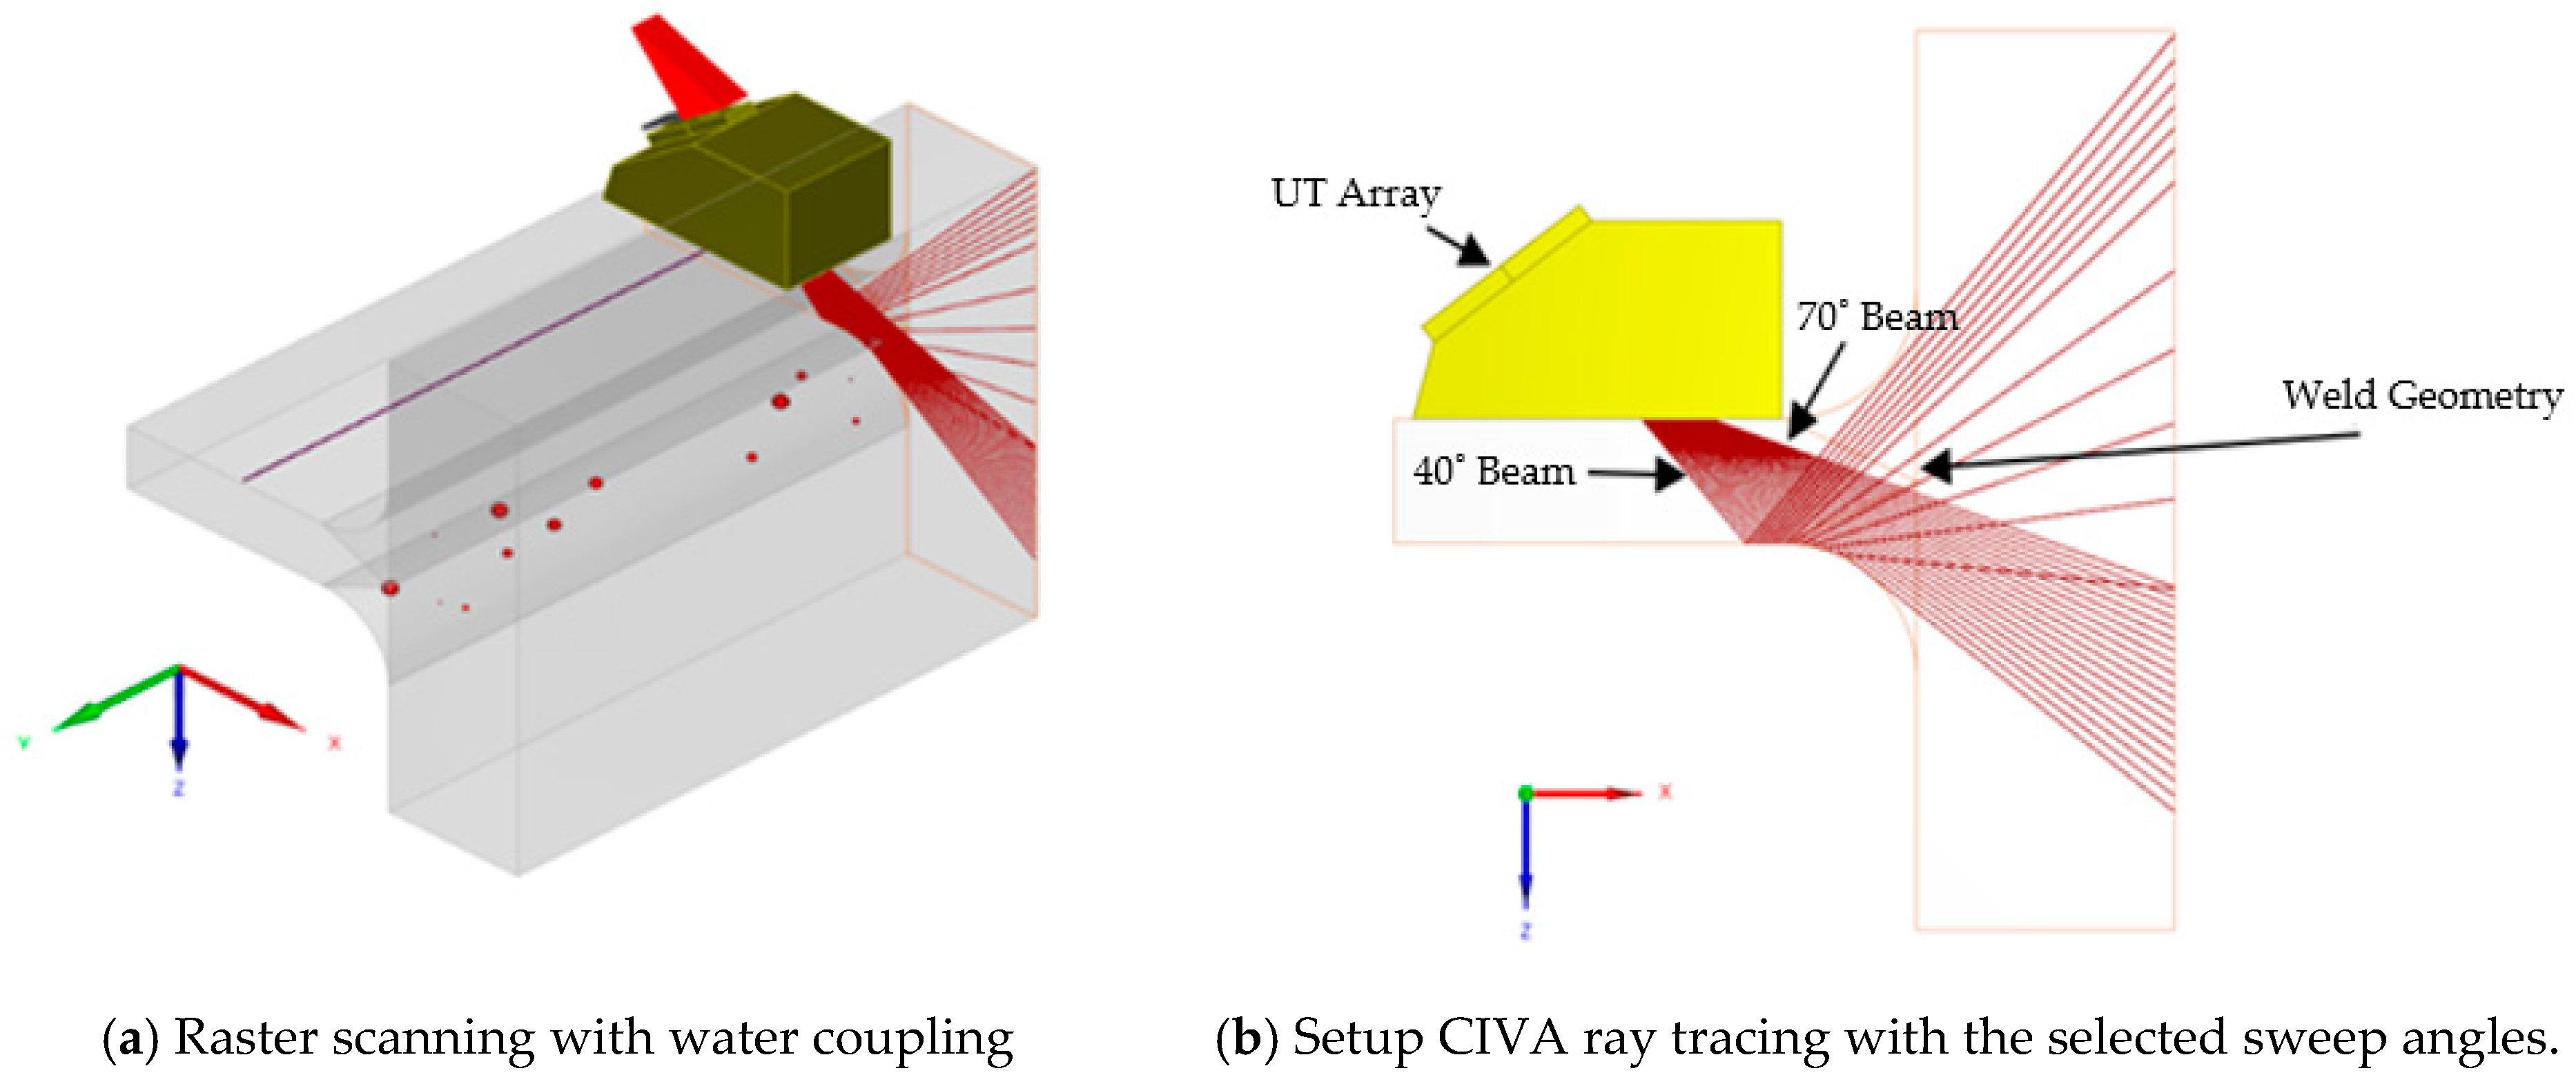
A linear array of 64 elements assembled to a flat refracting wedge was selected as the probe to simulate phased array ultrasonic testing. In all cases, this probe was used to sectorial scan the sample at angles ranging from 40° to 70°(with & without focusing) as shown in
Figure 11. If there was focusing, the focal depth was either 22 or 50 mm. The electronic focusing enables optimizing the beam shape at the expected defect location and further optimizes the detection probability. Also, focusing at multiple depths improves the ability to size critical flaws for volumetric inspections.
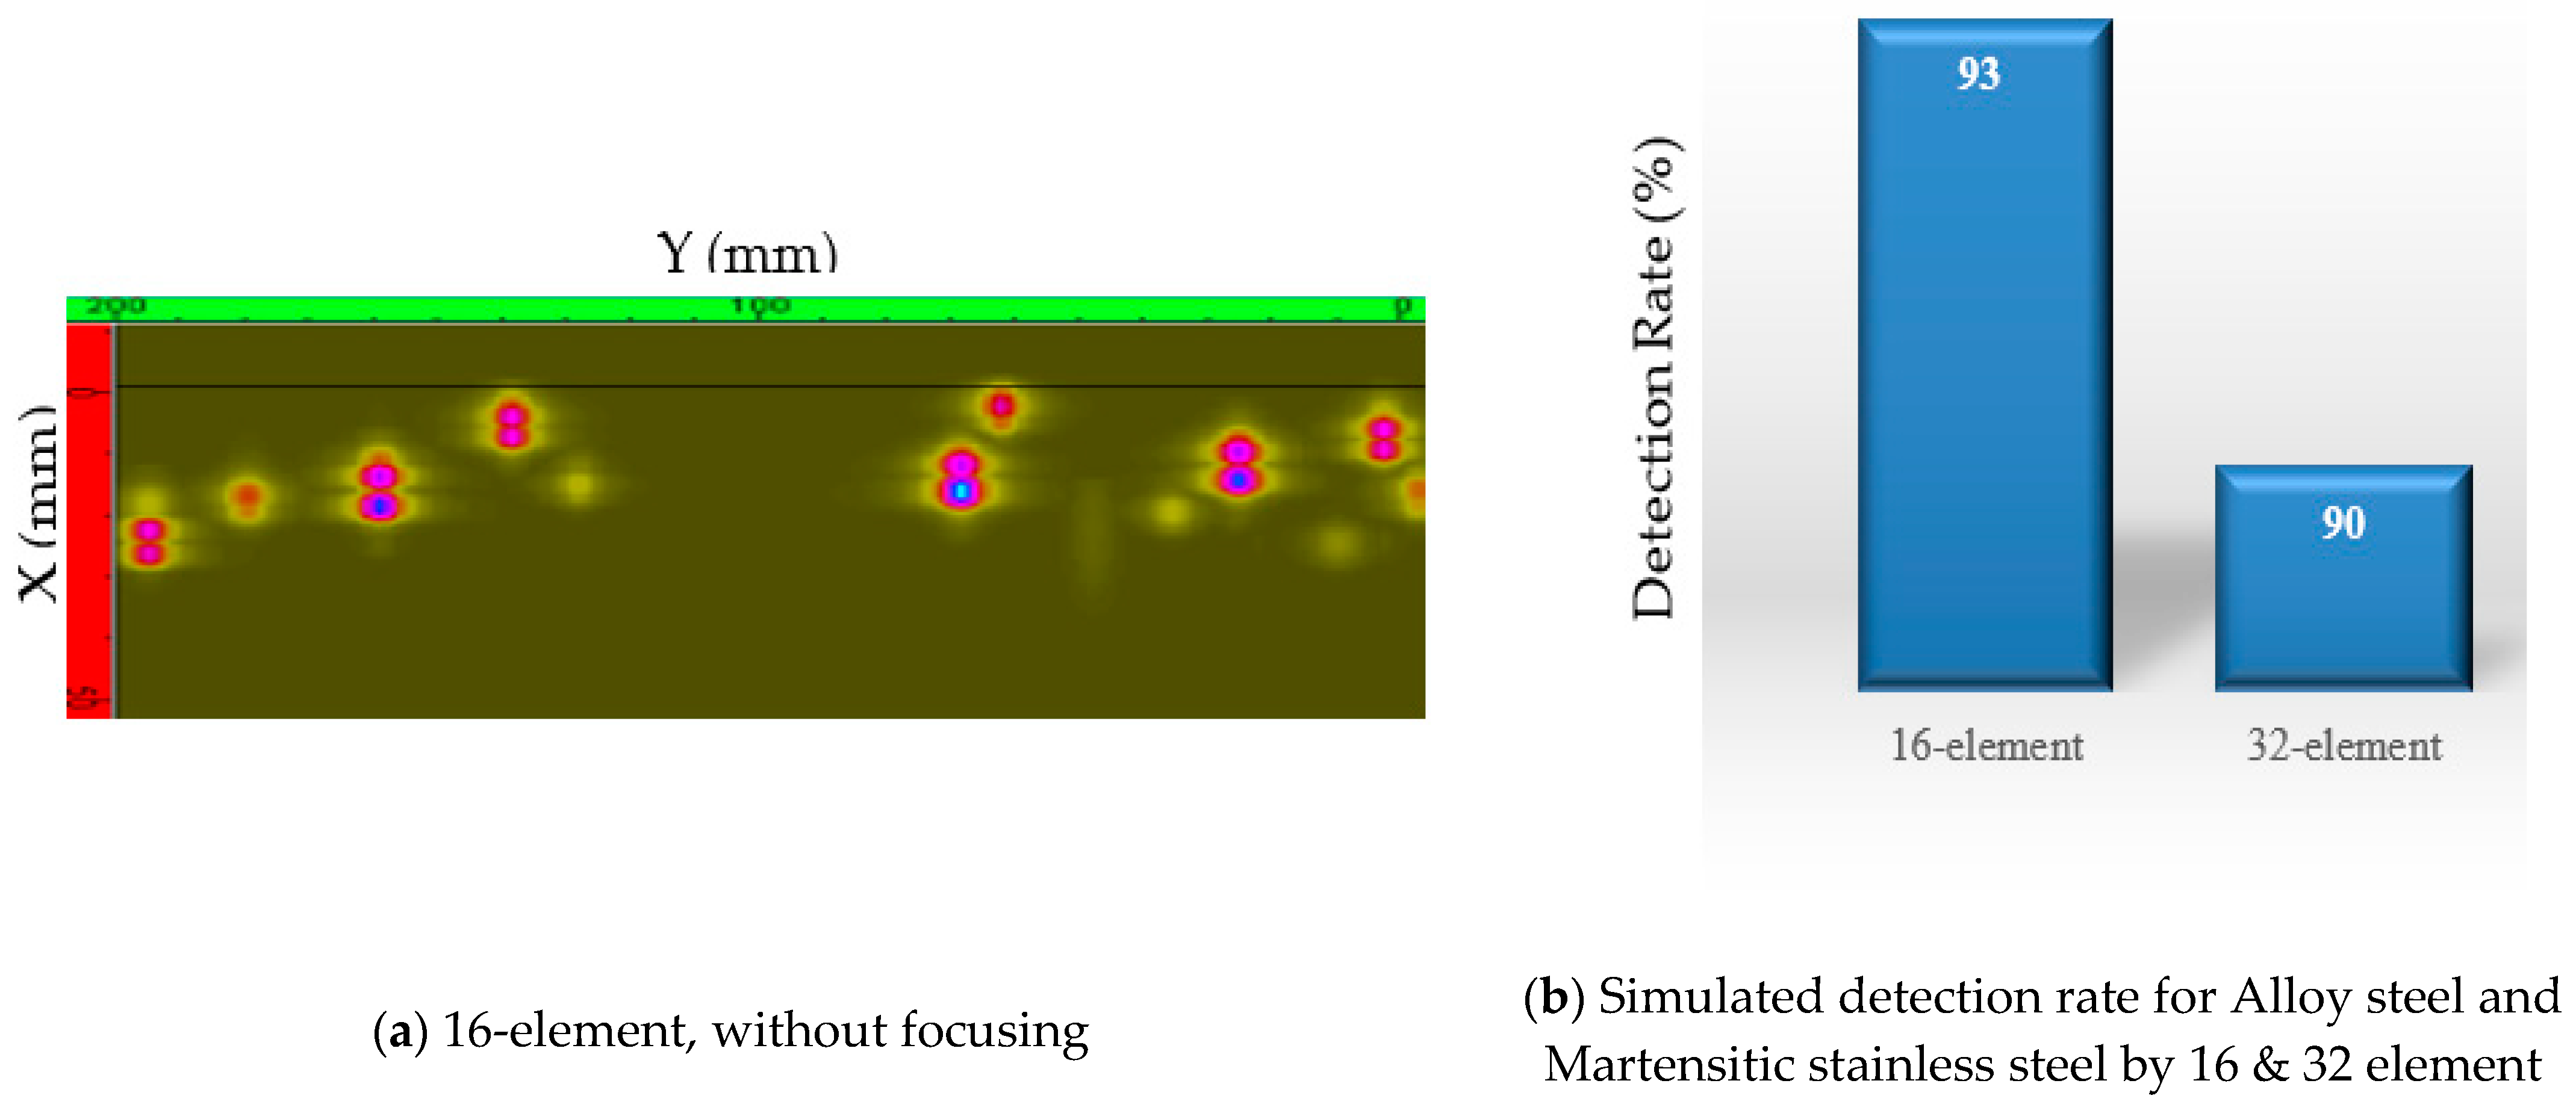
The T-joint sample model was the same as the one used for conventional UT simulation; same material options, same flaws nature, size, and distribution. According to Hydro-Quebec’s procedure, the numerical system’s sensitivity was calibrated, namely three side-drilled-holes with a diameter of 1.5 mm at depths of 15, 30, and 45 mm, respectively. The study used the computed time corrected gain (TCG) in this calibration process.
The following conclusions were obtained from the simulation results: Sample alloys appear to have little to no impact on the detection rate of the system; A 16-element configuration has a better detection rate than a 32-element one (
Figure 12). The result agrees with the experimental measurements and tends to prove our hypothesis, namely, the impact of the beam exit point and the width of the refracted beam on the sensitivity of these techniques; by phased-array sectorial scanning, we are sweeping the volume with a variety of angles. Even if the targets are not exactly aligned with the center ray as indicated by CIVA, there will be components of the wavefront that might hit the targets with a preferred reflection coefficient and directivity. Of course, the S-scan’s fixed standoff is a limiting factor that could cause flaws at the extremes of the sectorial sweep to have a weaker response. This will be a factor in the way we set up the 16 element and 32 element apertures; for the same refracted angle, the 32 element aperture has an exit point farther back from the weld. So we are approaching the targets from slightly different angles (and distances).
PAUT simulated detection rate is significantly better than the conventional UT one. As mentioned previously, this could be because the fixed-angle beam can miss a flaw more easily than with ultrasounds impinging the flaw from different directions, as is the case with sectorial scans. Also, with a fixed angle and using a raster scan, detection will be a variable that can be a function of the wedge size (limiting the probe’s access to the weld) and the beam divergence.
4. Finding and Discussion
Our tests showed that conventional Ultrasonic results in the lowest detection rate among the different ultrasonic testing methods evaluated. Although the inspection is carried out to a well-defined standard, the detection rate is highly dependent on the operator. Fixed angle conventional ultrasonic testing (UT) provides less information for accurate assessment of actual flaw conditions. Detection capability increases with the divergence of the beam of a single element probe. Because a beam refracted at 70° is more likely to show greater divergence than one refracted at 60°, the former has a better detection rate. PAUT allows one to use more angles and increases the probability of detection compared to conventional UT. PAUT sectorial scan is also well adapted to the T-joint sample’s geometry. Low angles will be tangent to the weld cap radius, while the high angles will probe the center of the blade to the web region.
The 16-element PAUT probe proves to be a good compromise for detection: Better resolution than the 12-element probe; Compared to the 32-element, a smaller wedge can be used, and for the same refracted angle, the beam exit point is closer to the edge of the weld; The size of the beam is adapted to the range of interest. With 32-element, focusing is needed to narrow down the beam emitted from a larger active aperture but did not lead to a better detection rate. Linear-encoded PAUT scans can distinguish two closely spaced flaws more easily than manual inspection.
Among the different ultrasonic testing methods evaluated, manual TFM resulted in the highest detection rate. It is slightly better than encoded TFM due to the operator’s ability to adjust the probe’s position to improve the signal to noise ratio on display. TFM L-L reconstruction mode seems to give slightly better results than the T-T reconstruction mode. The reason for such a result is still under investigation. TFM by nature has better coverage than beam-forming PAUT, and that could explain the slightly higher detection rate. TFM has the advantage of a clear display with appropriate information on the actual distribution and geometry of the flaws (faceted, multi-faceted, sphere-like). However, using the T-T mode did provide more details of the ceramic bead interface and better estimate of the diameter because of the shorter wavelength. TFM requires a transducer with a large number of elements. Thus, a large contact area and good coupling for all the ray paths are needed to produce consistent and repeatable results.
The best inspection strategy to inspect the trailing edge of a runner blade is to perform the inspection in two steps:
Step1: Linear encoded scan with either PAUT sectorial scanning or TFM direct mode. PAUT shall use shear wave with the refracted angle from 40° to 70°. TFM could use either L-L or T-T direct mode.
Step 2: Manual sectorial scanning with a 12 or 16-element aperture and a small wedge footprint to inspect the trailing edge and the weld reinforcement. The small footprint wedge is essential on a real turbine because of the trailing edge’s curvature to maintain good contact while scanning.
5. Conclusions
The preliminary technical approach developed in phase I of this research was tested on a T-weld specimen. When developing the scan plans and the preliminary data analysis, the ray path analysis indicated the need to carry out a minimum of two scans at different index points to enable complete volume coverage of the weld, particularly for thick weld specimens. This study aimed to collect initial data on a simplified mock-up and then compare the experimental ultrasonic data with the results of simulations performed by CIVA. Experimental studies in a laboratory setup showed that, among the different ultrasonic testing methods evaluated, TFM appears to be the best ultrasonic inspection technique to provide reliable flaw data to the IREQ’s life estimation model. In addition to this technique’s ability to detect flaw distribution, the algorithm allows a better definition of flaw geometry and highlights its different facets. CIVA model could be used to simulate ultrasonic inspection of a weld. However, to obtain reliable data, the sample and the inspection system’s models must be defined with a high accuracy level. To do this, we need to adjust model parameters through validation loops based on precise measurements on real calibration samples. While defining accurate numerical models seems like a tedious task, it ultimately drastically reduces the costs of developing a reliable inspection strategy.
Our future work uses such models to estimate the probability of detection (POD) of certain ultrasonic techniques applied to hydroelectric turbine runners’ inspection.


