Article

Detection of Ischemic Episodes Based on Two Consecutive Declines in the JT/ST Algebraic Relationship

by
Vaiva Šiaučiūnaitė
1,*,
Alfonsas Vainoras
2,
Zenonas Navickas
1 and
Minvydas Ragulskis
1,*
1
Department of Mathematical Modelling, Kaunas University of Technology, 51368 Kaunas, Lithuania
2
Cardiology Institute, Lithuanian University of Health Sciences, 50009 Kaunas, Lithuania
*
Authors to whom correspondence should be addressed.
Appl. Sci. 2021, 11(11), 4805; https://doi.org/10.3390/app11114805
Submission received: 11 April 2021 / Revised: 17 May 2021 / Accepted: 21 May 2021 / Published: 24 May 2021

Abstract

:
The main objective of this paper is to explore if the JT/ST algebraic relationship could be helpful for the identification of ischemic changes in the human cardiovascular system. The suggested visualization technique highlights the specifics of complex dynamical processes in the self-organization of the heart system during the load and recovery processes. It is demonstrated that the nonlinear algebraic relationship between the duration of the JT interval and the ST amplitude can be beneficial for a deeper interpretation of dynamical processes in the human cardiovascular system. The JT/ST relationship is used for the identification of the ischemic changes and for the characterization of individual performance of the person during the load and recovery processes.

1. Introduction

Electrocardiography (ECG) analysis is the basic and the most studied noninvasive technique used for the contemporary investigation of the functionality of the cardiovascular system. Cardiac time intervals are sensitive markers of cardiac dysfunction.
Interrelations between ECG parameters are still an active area of research (e.g., functional relations among RR, JT, and ST intervals). A fixed model of relationships between ECG parameters cannot always hold even for a particular person. The alteration between ECG parameters occurs due to various physiological and pathological reasons. Therefore, it is probably not reasonable to seek a unified deterministic model that could describe the relationships between ECG parameters. It makes sense to investigate the dynamical processes of interconnections that could lead to complex and chaotic behavior in the human organism.
Changes in the patterns of interconnection (connectivity) and patterns of variation over time (variability) contain useful information about the state of the entire system [1], as the spatial and temporal organization of a complex system defines its very nature. Estimating the absolute value of a clinical parameter such as heart rate provides highly significant, clinically useful information. However, evaluating interconnections of ECG characteristics provides additional useful clinical information, which, in fact, is more valuable than heart rate alone, particularly when heart rate is within normal limits [2].
A good blood supply to the heart is an important performance indicator of its work. The blood supply to an organ can be characterized by the intensity of its metabolic rate. In its turn, metabolic changes in the heart are associated with changes in repolarization. Therefore, the JT interval is a good indicator of cardiac metabolic changes. The JT interval represents the repolarization part of the cardiac electric systole, and the changes of the interval are associated with the variation of the myocardial metabolism [3]. A shorter JT interval indicates that myocardium metabolic processes are faster. A longer JT interval indicates slower repolarization and slower metabolic processes. Normally, the duration of the JT interval varies between 160 ms and 360 ms. It is well known that the prolonged QT interval predicts cardiac mortality [4,5]. However, the JT interval is proposed as a more appropriate measure of the duration of the ventricular repolarization than the QT interval because the value of the QT interval is limited when increased QRS duration contributes to QT prolongation [6]. The duration of the JT interval is defined as the time interval from the ECG junction point J to the end of the T wave (Figure 1).
There is a well-known parabolic relationship between the HR (heart rate) and JT interval—when HR rises, JT interval shortens [3,7,8,9]. Shortening of JT interval reflects heart metabolism acceleration and vice versa. T wave and ST segment (Figure 1) show the repolarization of the heart ventricle. Cardiac activity is more essential than the activity of other organs, even in rest conditions, and myocardial need for oxygen must be met given any level of metabolism [10]. If coronary blood vessels supply an inadequate amount of blood, it changes the metabolic balance and action potentials in the myocytes, while in the electrocardiogram, the changes in ST-segment amplitude are registered. ST-segment amplitude deviation from the norm, both at rest and during physical activity, shall be considered as an indication of typical heart failure and possible functional ischemia. Therefore, the changes of ST interval amplitude could be, and is, taken as an indicator of hemodynamic effectiveness in the heart in clinical cardiology [11].
The objective of this research is to propose a visualization technique of the relationship between the duration of the JT interval and the ST amplitude, which could reveal the evolution of complex dynamical processes in the self-organization of the heart system during the load. Two algebraic relationships (RR/JT, RR/QRS) have already been investigated in [12,13]. As mentioned previously, the main objective of this paper is to explore if the JT/ST algebraic relationship could be helpful for the identification of ischemic changes in the human cardiovascular system.

2. Materials and Methods

2.1. The Description of the Experimental Setup

The presented research met all standards for the ethics of experimentation. The permit to perform biomedical investigation was granted by Kaunas Regional Ethics Committee for Biomedical Investigations, No. BE-2-51, 23.12.2015. ECG stress test on a cycle ergometer was used to record cardiac intervals and their parameters. The “Kaunas–Load” system [14,15] developed at the Institute of Cardiology (Lithuanian University of Health Sciences) was used to perform synchronous registration of 12 leads and different standard parameters of the ECG (including the duration of JT and the amplitude of ST intervals for each cardiac cycle). The second ECG lead is used for the signal processing task.
The registration of the ECG is started at the beginning of the bicycle ergometry exercise with the load set to 50 W. The load is kept constant for two minutes and then increased by 50 W. The person is asked to maintain a constant cycle ergometer spinning rate at 60 revolutions per minute during the whole bicycle ergometry exercise. The stress test is terminated when the person fails to maintain the spinning rate, or first clinical indications for load limitation are observed according to the American Heart Association (AHA).
The cohort comprised 10 physically active men but not professional sportsmen. The mean and standard deviation of the age was 41.9 ± 12.1 years old; height 1.80 ± 0.098 m; weight 80.29 ± 20.34 kg; body mass index 24.54 ± 4.31 kg/m2. Three subjects experienced clinical indications for load limitations, and therefore, the load was kept constant for one minute and then increased by 50 W.

2.2. Corrected versus Noncorrected Cardiac Intervals

The present study utilizes the JT interval but not the JTc (the corrected JT) interval. JTc is calculated as the difference between QTc (the corrected QT interval) and QRS duration. The reasons why corrected cardiac intervals are not used in this study are explained in this subsection.
QTc is the QT interval corrected for the heart rate (the RR interval). The relationship between QT and RR intervals was first proposed by [16]. The average statistical nonlinear dependence between the QT interval and the heart rate is defined by this relationship (and provides tolerance intervals for the QT interval). However, despite the fact that this relationship has been around for 100 years, debates about its legitimacy continue. The development of new analytical functions and confidence intervals for the corrected intervals and interparameter relationships continues. Unfortunately, many of these corrections either work well when adapted only to a specific cohort or cannot be validated by other researchers.
An alternative approach based on algebraic relationships between noncorrected cardiac intervals is presented in [12,13]. It appears that relationships between noncorrected cardiac intervals enable the visualization of effects such as the collapse of complexity [12], transit through the anaerobic threshold, self-organization, and competition between different attractors [13], which would not be observable otherwise. Unlike the aforementioned papers, in this study, we observed two double consecutive declines that could indicate the ischemic episodes of the heart.

2.3. The Algorithm for the JT/ST Algebraic Relationship

The duration of the JT interval and the ST amplitude is continuously and synchronously recorded throughout the experiment and denoted as vectors x = ( x 1 , x 2 , , x n ) and y = ( y 1 , y 2 , , y n ) accordingly; where n is the total number of heartbeats recorded during the whole experiment. The algebraic relationship between time series x and y is reconstructed using the algorithm presented in [12]. This algorithm comprises three basic parts.
Step #1. Six elements x k δ , x k , x k + δ , y k δ , y k , y k + δ are mapped into a two-dimensional perfect matrix of Lagrange differences (the concept of perfect matrices of Lagrange differences is introduced in [12], where δ is the time lag; k = ( 1 + δ ) , ( 2 + δ ) , , ( n δ ) . Altogether, 18 different perfect matrices of Lagrange differences exist [8]. For example, the first perfect matrix of Lagrange differences L δ , k ( 1 ) = [ x k x k + δ y k + δ x k δ y k δ y k ] is used in [13]. In general, one could choose one of the 18 different matrices in accordance with the optimal architecture of the matrix (the optimality of the matrix architecture is defined in the further steps of the algorithm).
Step #2. The sequence of matrices L δ , k ( β ) is transformed into a scalar sequence using a mapping : 2 × 2 1 , where β { 1 , 2 , , 18 } . The mapping is defined as the maximal modulus of the two eigenvalues of L δ , k ( β ) in [12] and [13]. We generalize the mapping by setting = L δ , k ( β ) in this paper. The norm of the matrix A = s u p z 2 ( A z 2 z 2 ) = s u p z , z 2 = 1 ( A z 2 ) m a x ( | λ 1 | , | λ 2 | ) where λ 1 and λ 2 are two eigenvalues of A , and 2-norm is the Euclidian norm [17]. Note that the inequality becomes equality when matrix A is symmetric. Therefore, we increase the sensitivity of the method by replacing the maximal modulus of the eigenvalues with the norm in the definition of the mapping.
Step #3. Finally, internal and external smoothing is applied for the scalar sequence L δ , k ( β ) . If the radius of the internal smoothing is denoted by R i and the radius of the external smoothing is denoted by R e , then the smoothed sequence depicting the algebraic relationship between time series x and y reads as follows:
s k ( R i , R e , β ) = 1 R i ( 2 R e + 1 ) j = k R e k + R e δ = 1 R i L δ , j ( β )
where k = ( 1 + R i + R e ) , ( 2 + R i + R e ) , , ( n R i R e ) . A well-posed optimization problem in respect of the smoothing parameters is formulated in [8] for the whole cohort of persons resulting into R i = 3 , R e = 4 and β = 1 . These values of the parameters are kept fixed in this paper as well. All further numerical computations are based on s k ( 3 , 4 , 1 ) .

2.4. Qualitative Evaluation of Two Consecutive Declines in the JT/ST Algebraic Relationship

We raise a hypothesis that two consecutive declines in algebraic relationships between the duration of the JT interval and the ST amplitude during the bicycle ergometry exercise can be used for the early detection of episodes of ischemic heart disease.
The following algorithm is proposed in order to quantitively describe two consecutive declines.
Step #1
Determine the average value of the algebraic relationship between the duration of the JT interval and the ST amplitude in the observation window centered around the termination of the ergometry exercise moment. The averaging is required to minimize local effects induced by the inevitable additive noise. Our recommendation is to use observation windows with an averaging radius of three time steps around the termination moment.
S ¯ = 1 7 [ S T ( 3 , 4 , 1 ) + j = 1 3 ( S T j ( 3 , 4 , 1 ) + S T + 1 ( 3 , 4 , 1 ) ) ]
Step #2
Fix the upper boundary at S ¯ and mark the areas below S ¯ and the JT/ST algebraic relationship separately for the load and recovery processes in different colors.

3. Results

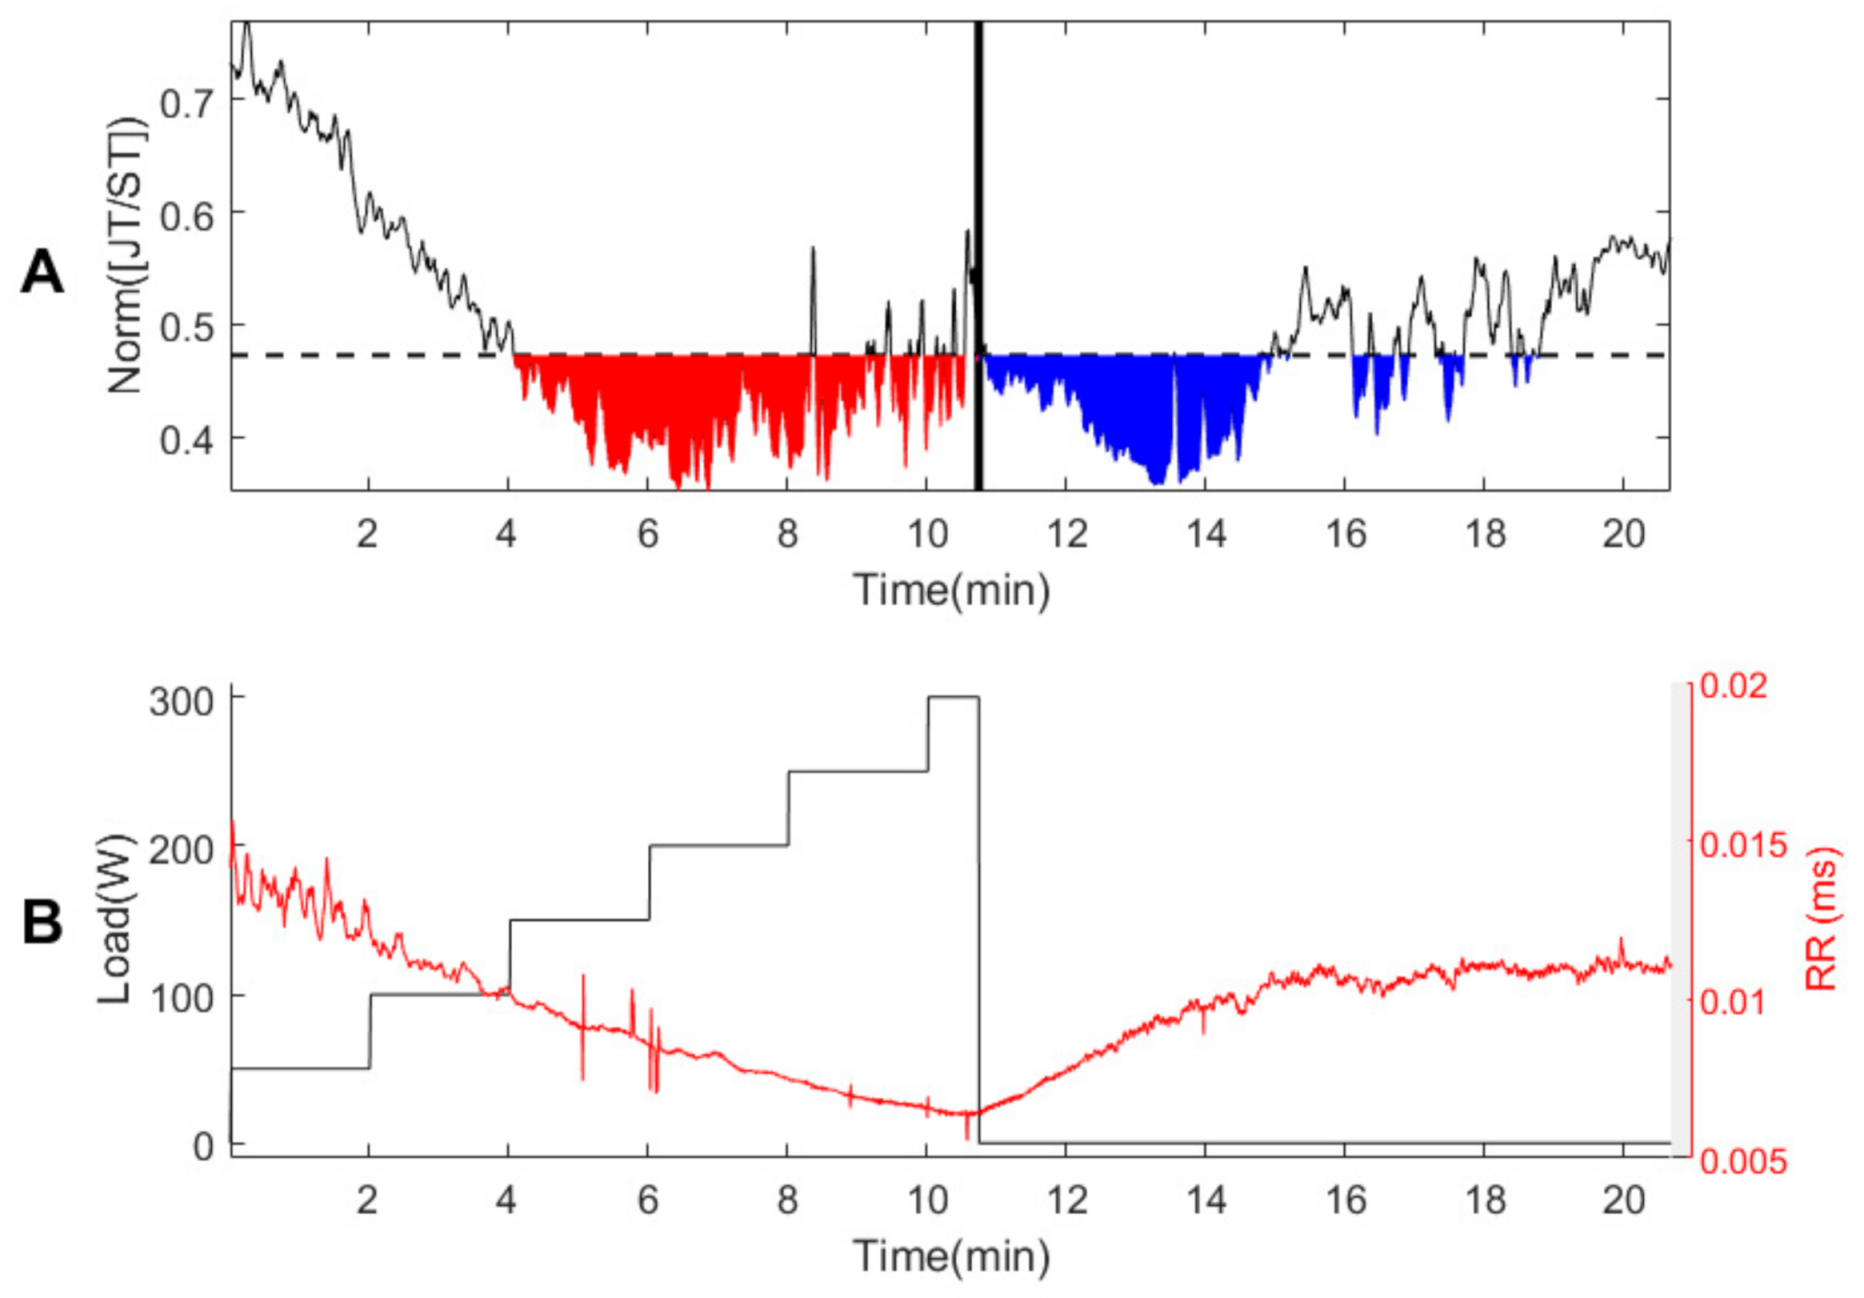
The dynamics of the JT/ST relationship during the load and the recovery processes are illustrated and discussed for seven healthy persons (persons #1–#7) and three persons with the suspected ischemic heart disease (persons #8–#10).

3.1. Person #1

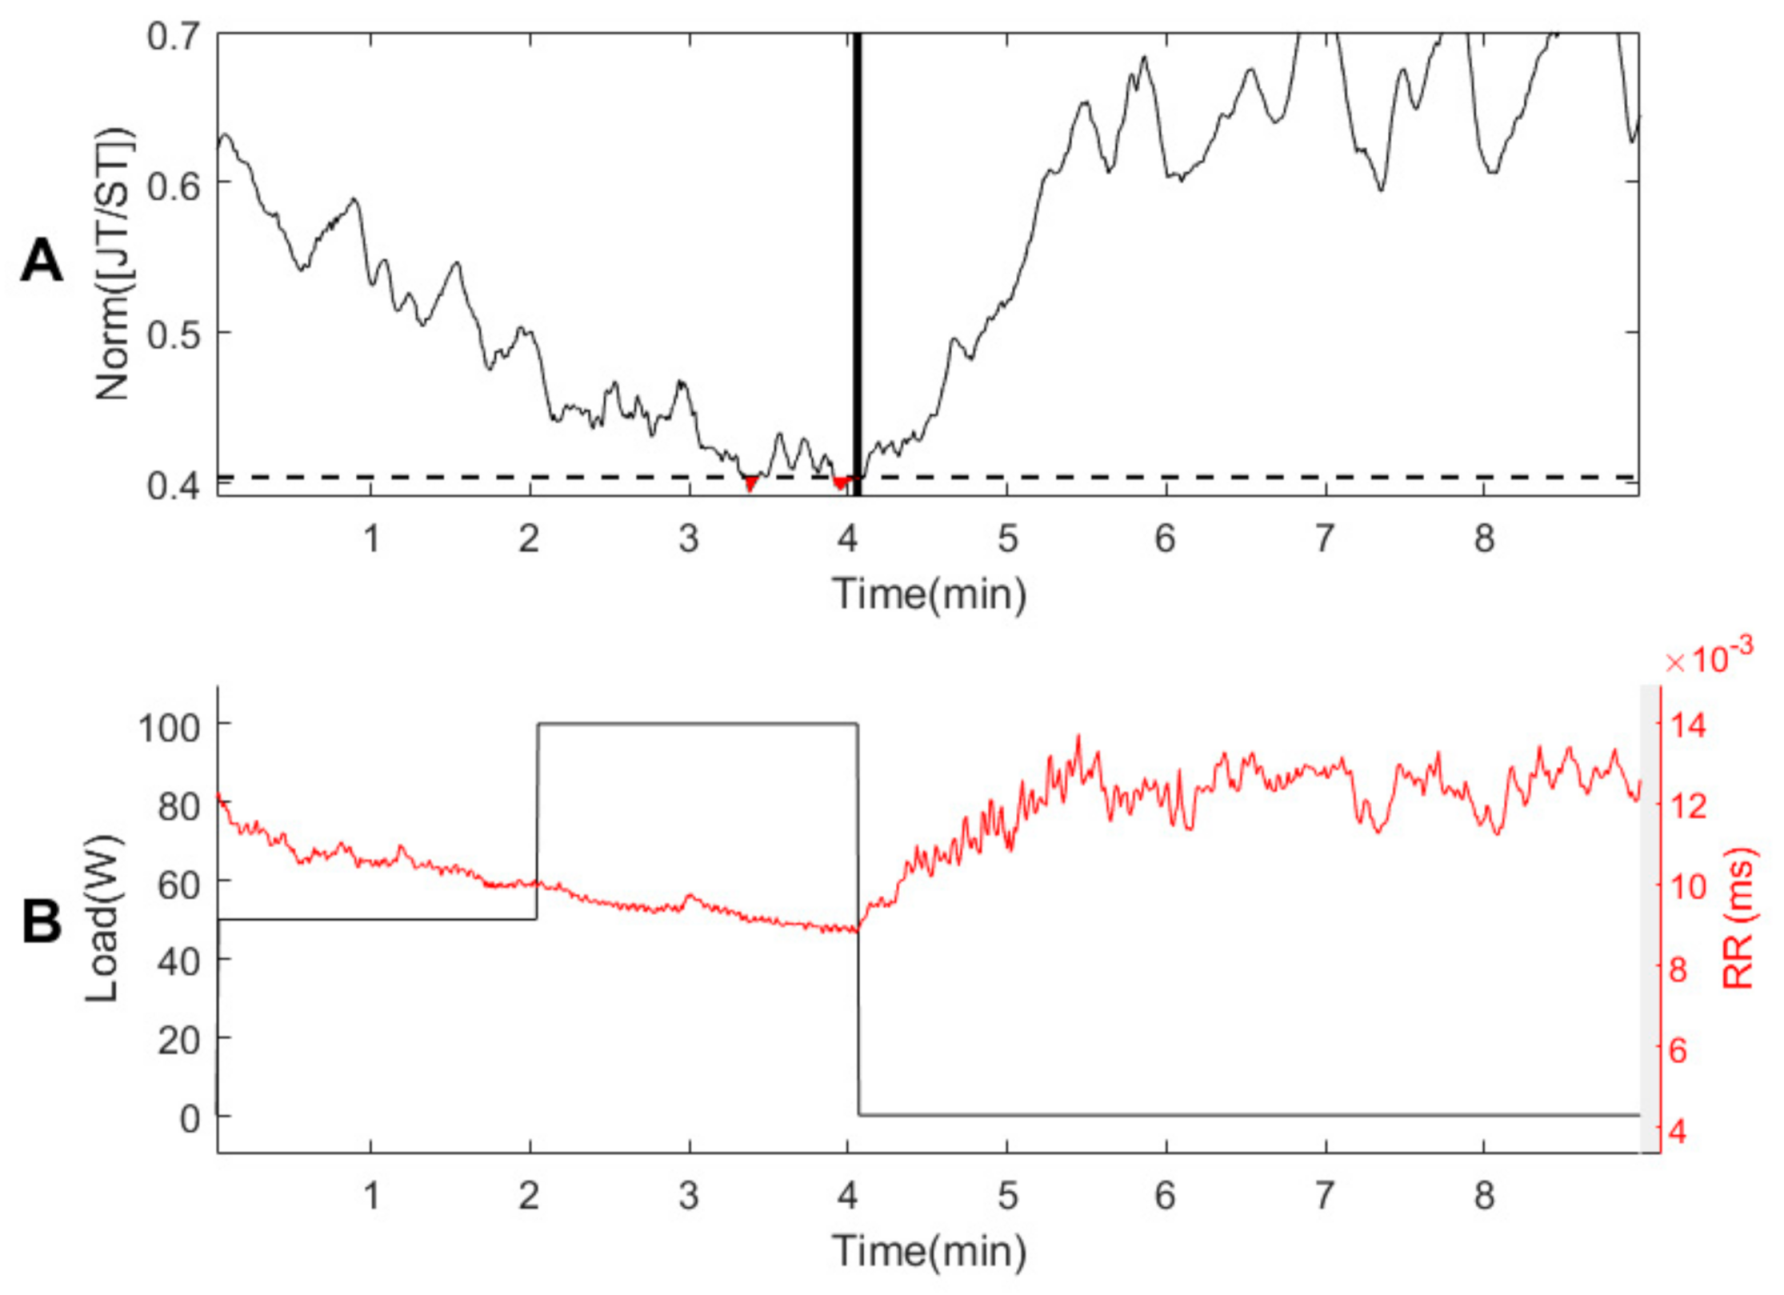
The total area of the algebraic relationship function under S ¯ during the load is marked in red in Figure 2A. The total area of the algebraic relationship function under S ¯ during the recovery process is marked in blue in Figure 2A. Note that the thick black vertical line represents the end of the load (and the start of the recovery process), and the thin black dashed horizontal line represents the numerical value of S ¯ in Figure 2A.
The algebraic JT/ST relationship reveals interesting dynamic behavior during the load and recovery processes (Figure 2). It has been shown in [12] that the collapse of complexity occurs in the algebraic relationship between RR/JT intervals at the end of the load process. However, the situation is completely different now. The JT/ST relationship drops down and reaches the first minimum much earlier than the end of the load process (Figure 2A). After reaching the first minimum, the JT/ST relationship starts rising until the end of the load process. The JT/ST relationships start decreasing again, reach the second minimum, and continue to grow during the recovery process (Figure 2A).
It can be observed that the variability of the JT/ST relationship grows before the termination of the load. Similar growth of low-frequency fluctuations before the end of the exercise is observed in RR/QRS relationship [13] and in a quasi-isometric arm-curl exercise [18]. However, the behavior of the JT/ST relationship is completely different if compared to the RR/JT or RR/QRS relationships. The JT/ST relationship becomes more fluctuated and grows to a local maximum at the moment of the termination of the exercise and thus forms the first pit during the load process (marked in red in Figure 2A).
The second pit is formed during the recovery process (marked in blue in Figure 2A). Such a different behavior of the JT/ST relationship, compared to other relationships, can be explained by the fact that the JT and ST intervals represent completely different aspects of the self-organization of the cardiovascular system. These aspects and possible interpretations will be considered in more detail in the Discussion Section.

3.2. Healthy Persons #2–#7

A number of bicycle ergometry experiments with other persons are performed in order to observe and compare the transient behavior of the cardiovascular system and its self-organization during the load and recovery processes of the bicycle ergometry exercise.
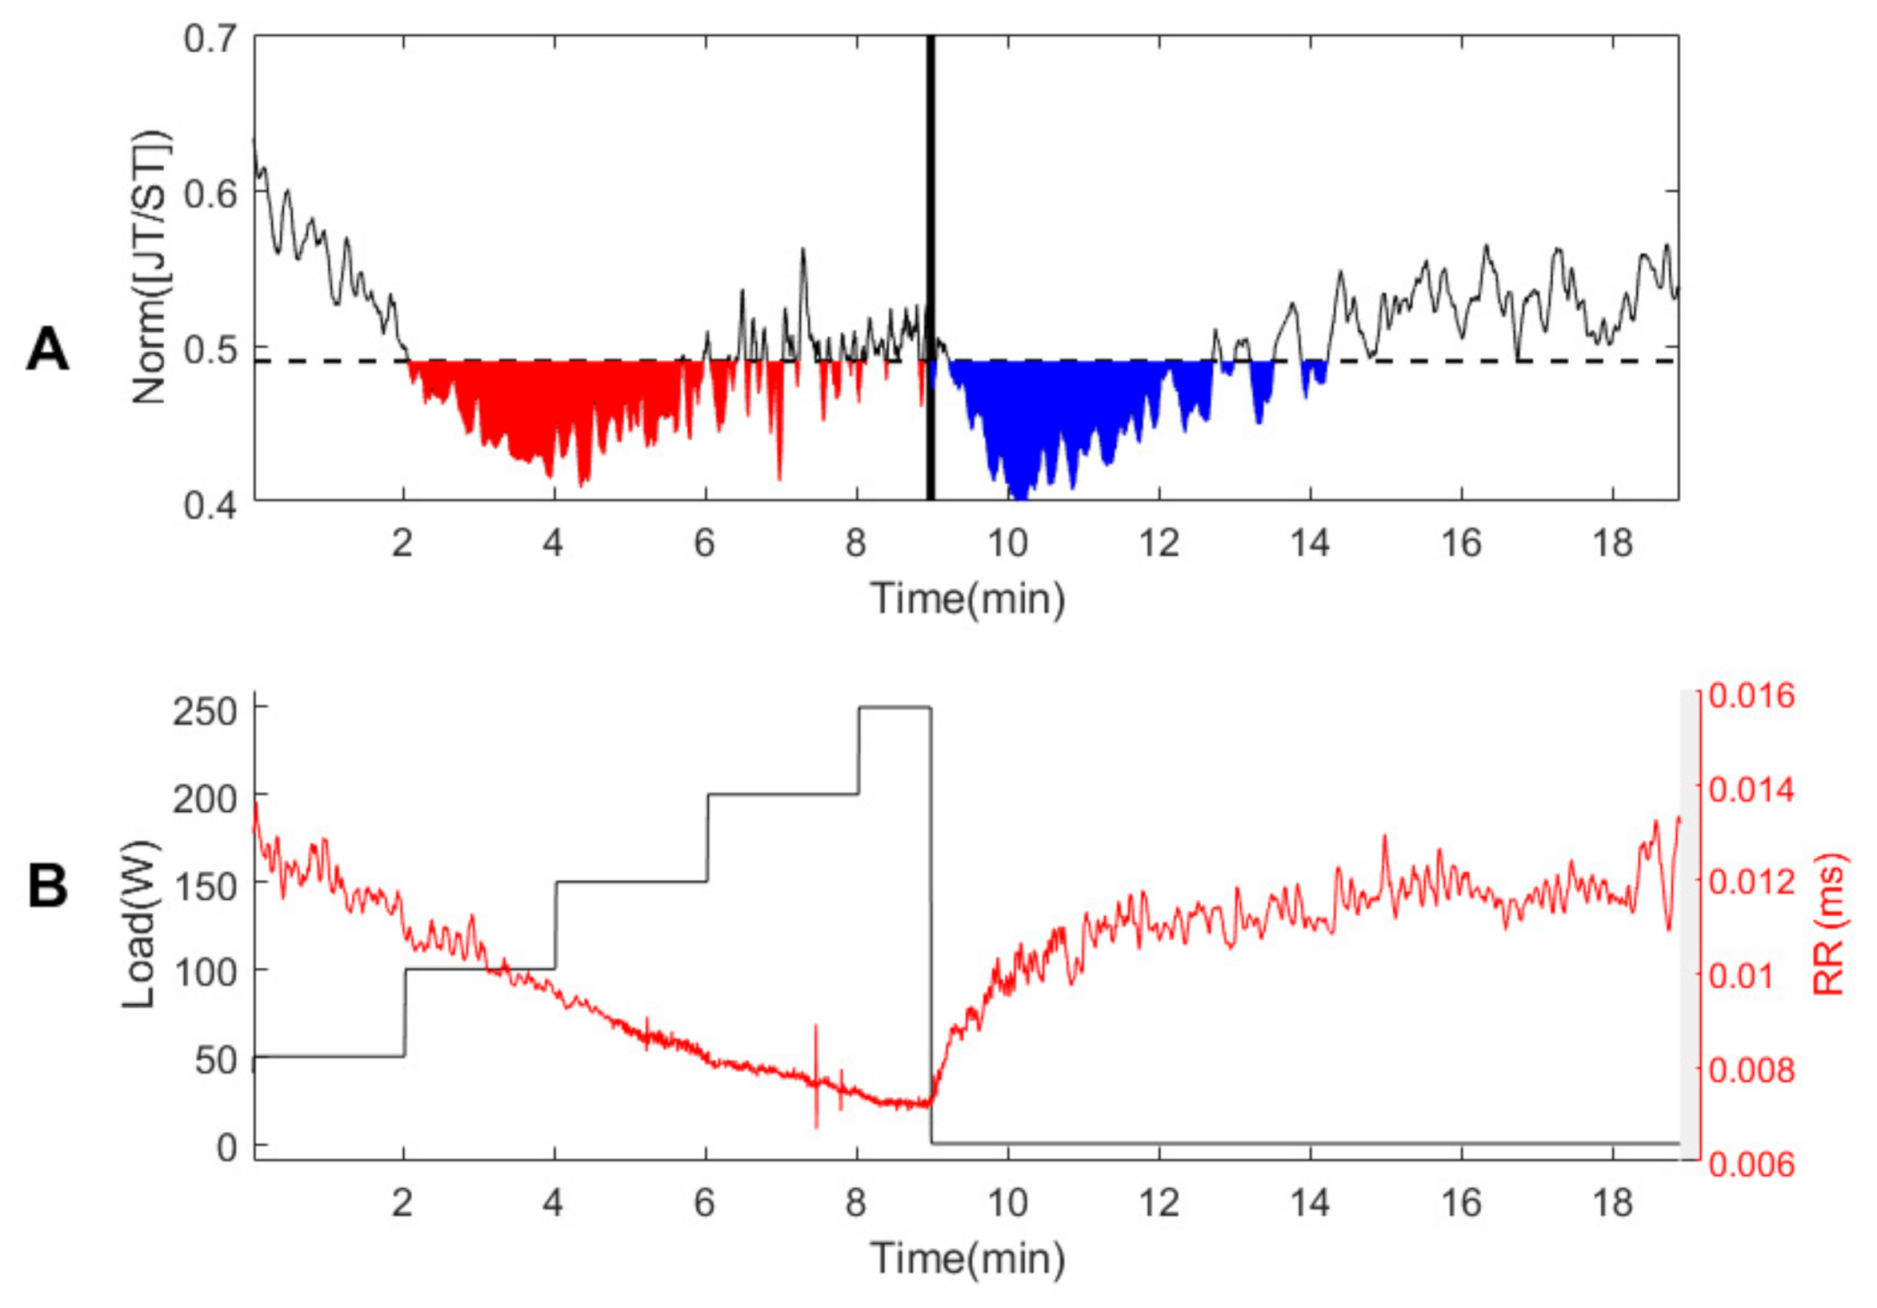
The dynamics of the JT/ST relationship during the load and recovery processes for person #2 are depicted in Figure 3. It can be observed that the global minimum in the first pit is reached a little later for person #2, compared to person #1. However, the fluctuations before the termination of the load are also higher for person #2 (Figure 3A). The recovery process can be also characterized by much more violent fluctuations (Figure 3A). We speculate that the self-organization of the cardiovascular system of person #2 is much more complex if compared to person #1. This complexity can be characterized by higher fluctuations and a less stable recovery process. Yet, the red and the blue pits are clearly visible in Figure 3A. Indeed, all persons are individual, and one should not expect to reproduce identical transient trajectories of the JT/ST dynamics for different persons. One could also observe that the physical endurance of person #1 is better if compared to person #2. Both persons did terminate the exercise at 300 W load, but person #1 managed to last almost 14 min (person #2 lasted less than 13 min).
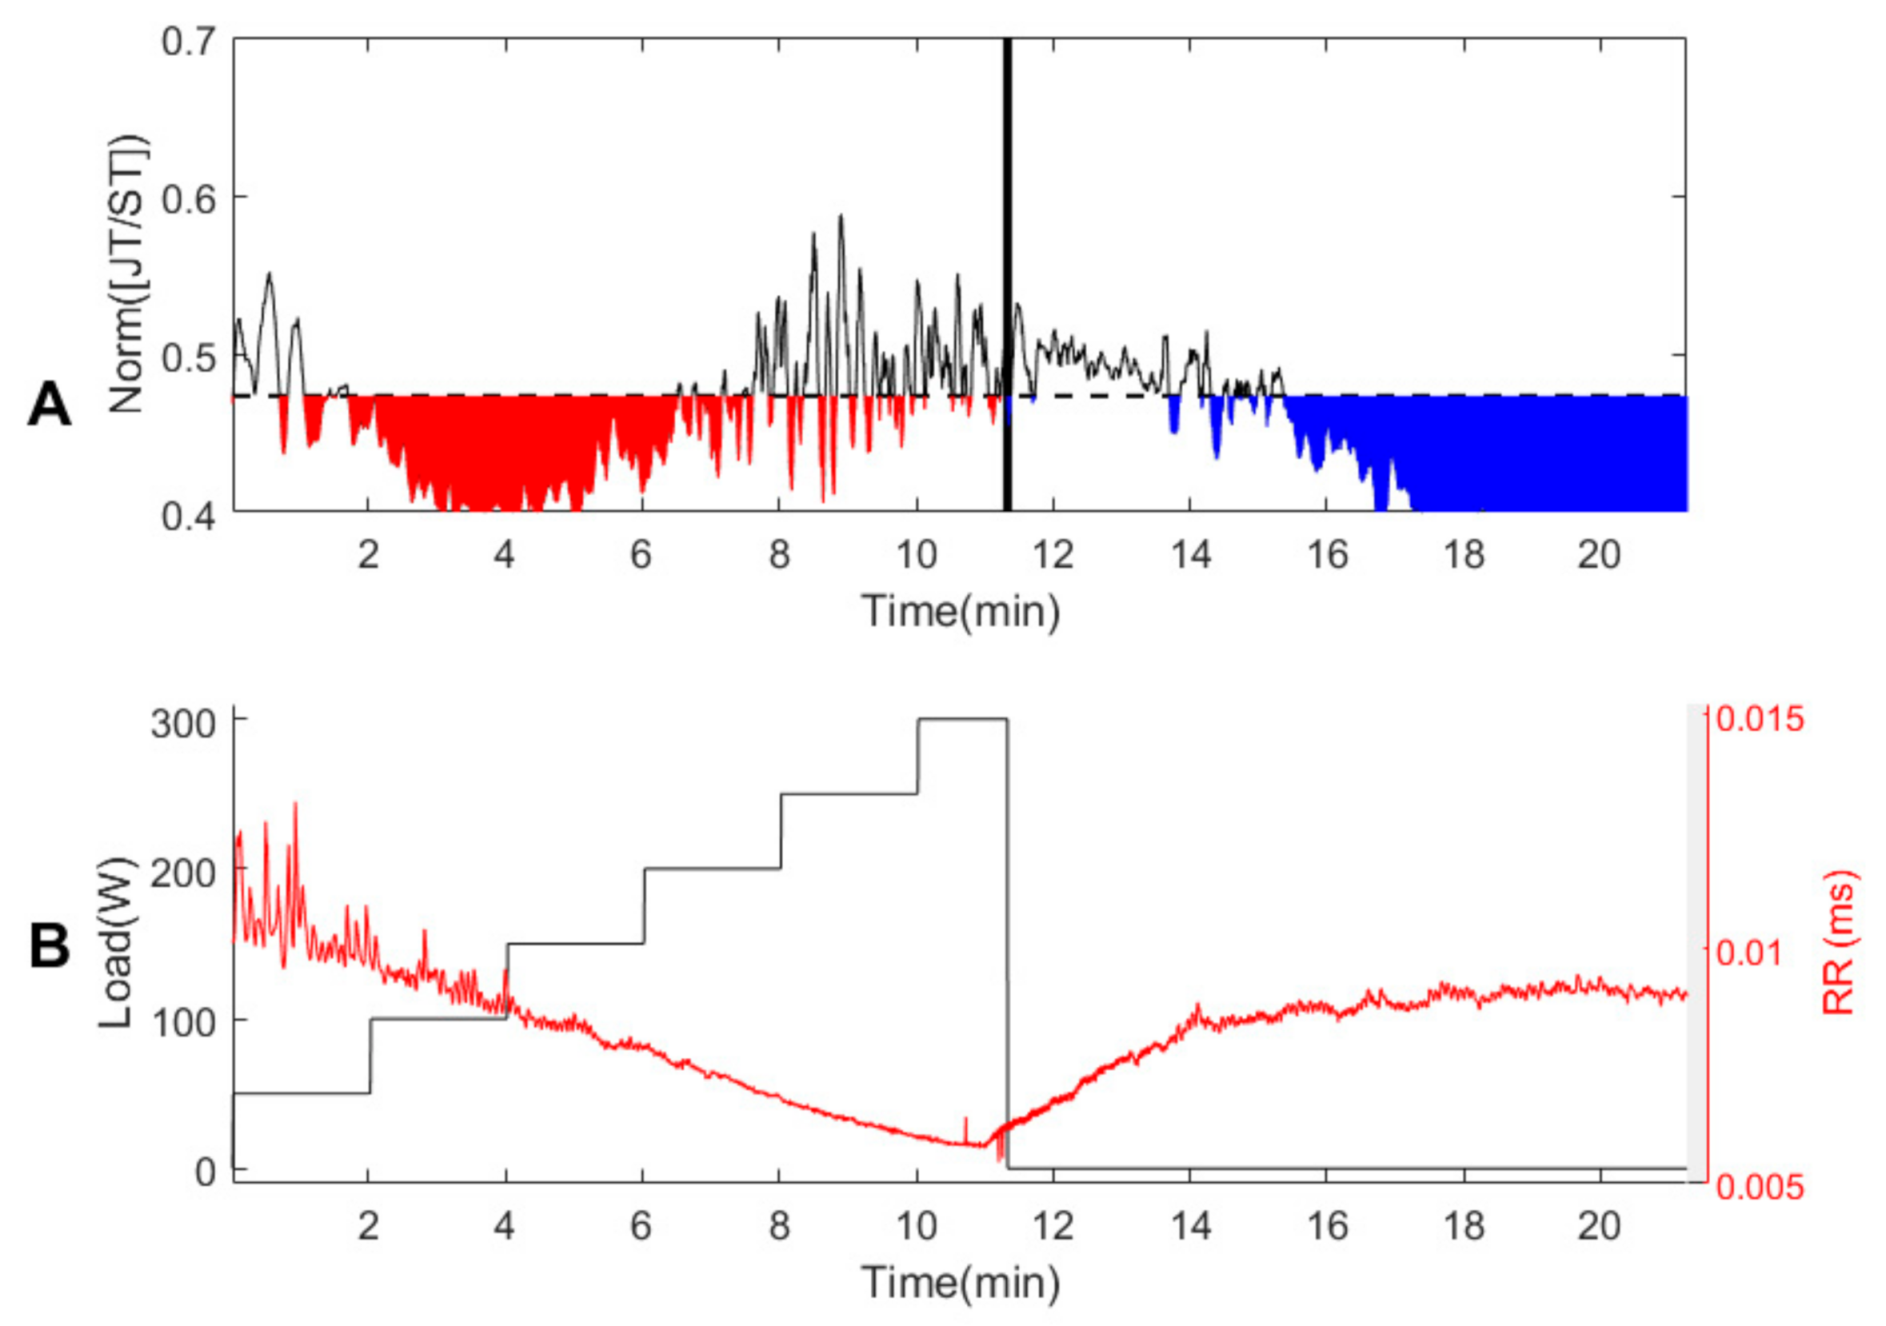
The dynamics of the JT/ST relationship during the load and the recovery processes for person #3 are depicted in Figure 4. Firstly, it can be observed that person #3 did manage to reach only 250 W maximum load, and the bicycle ergometry exercise did last for only almost 11 min. Additionally, though both pits (the red and the blue one) are clearly visible in Figure 4A, the fluctuations before the load termination moment, and the complexity of the transient process after the global minimum of the second pit, are much higher if compared to person #2 (and person #1, of course). This is a clear indication that the ability of the cardiovascular system of person #3 to adapt to the load and recover after the load is less pronounced, compared to person #2 and person #1. Needless to say, these aspects of self-organization of the cardiovascular system can be visualized by plotting the dynamics of the algebraic JT/ST relationship.
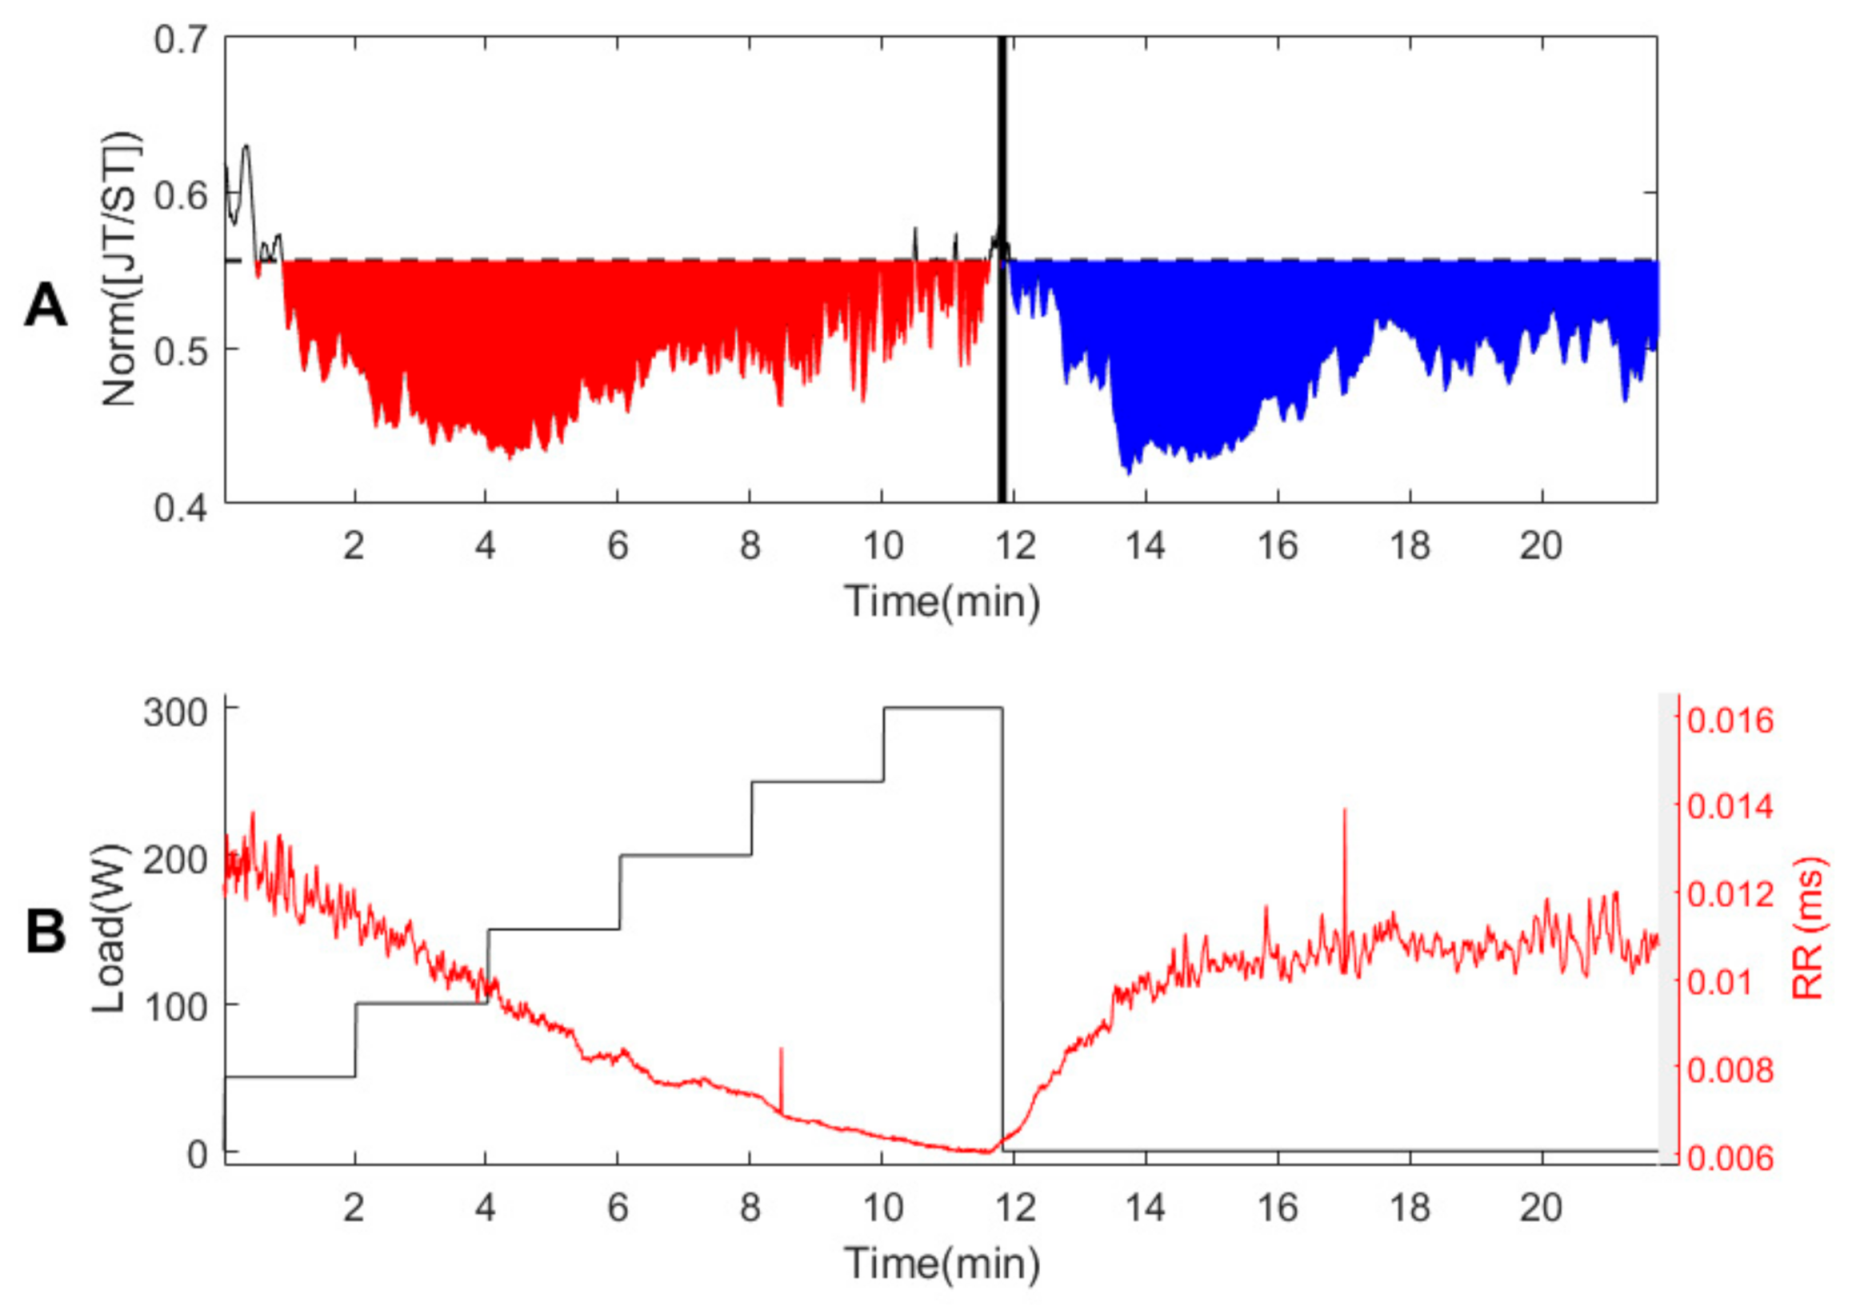
The dynamics of the JT/ST relationship for person #4 are even more different, compared to the previous three ones. In fact, one single pit does not exist during the load process (Figure 5A). The JT/ST relationship fluctuates violently in the time interval between the first minimum point and the point of the termination of the exercise (Figure 5A). The self-organization of the cardiovascular system of person #4 is very complex. In fact, it seems that the cardiovascular system of person #4 is trying to seek an optimal configuration in the second part of the load process. Indeed, it fails to find a stable configuration until the termination of the load (Figure 5A). This could be due to physical load intolerance. However, the recovery process is much smoother, and the blue pit is clearly expressed (Figure 5A). Note that person #4 did manage to endure the increasing load for almost 11 min.
Figure 6 depicts the dynamics of the JT/ST relationship for person #5. The red pit is clearly expressed at the first part of the load (Figure 6A). However, the JT/ST relationship becomes unstable at the second part of the load, and these fast oscillations are much stronger, compared to persons #1–4. Nevertheless, person #5 managed to continue the exercise for more than 13 min (Figure 6A). Such violent oscillations before the termination of the load are probably a sign of extreme efforts to keep up with the load. As a consequence, the recovery process was long. The JT/ST relationship is still at the bottom of the blue pit after 23 min from the beginning of the experiment (Figure 6A).
The dynamics of the JT/ST relationship for person #6 are shown in Figure 7. Person #6 managed to run the exercise for the longest period of time (more than 14 min). The global minimum (the collapse of the complexity of the JT/ST relationship) was reached soon (right after the fourth minute). Then, the dynamics of the JT/ST relationship were rather smooth, compared to other persons, until the end of the load process. However, the start of the recovery process is marked by several strong peaks (Figure 7A). In fact, that is the reason why the average value S ¯ is much higher if compared to other persons. Later, the recovery process is rather smooth again, and the blue pit is clearly expressed in Figure 7A.
Finally, the JT/ST relationships for person #7 are shown in Figure 8. The variation of the ST/JT relationship for person #7is similar to that of person #6. Person #7 managed to keep running the exercise for almost 14 min; the variability of the JT/ST relationship is not very high before the termination of the load. The recovery process is also similar to that of person #6. The main difference between person #7 and person #6 is that strongly expressed peaks are missing right after the termination of the load (Figure 8A).

3.3. Persons with Suspected Ischemic Heart Disease #8–#10

The results of bicycle ergometry experiments with healthy persons demonstrate that the double consecutive decline of the JT/ST relationship (the red and the blue pits) can be used for subtle characterization of the self-organization of the cardiovascular system during the load and the recovery processes. It is interesting to observe if similar patterns could be observed in the JT/ST relationship for persons having different suspected ischemic heart disease conditions.
Person #8 had ischemic effects in the myocardium and could continue the exercise for less than 4 min (Figure 9). The first pit during the load did not have enough time to develop (Figure 9A). The blue pit during the recovery process is missing completely. In fact, the trajectory of the JT/ST relationship during the recovery process reminds a wandering chaotic process. The ability of the cardiovascular system to self-organize during the recovery process is impaired.
Similar results are observed in Figure 10. Person #9 managed to reach only 100 W load. The red and the blue pits are completely missing. However, the recovery process for person #9 looks better, compared to person #8. The JT/ST relationship quickly returns and then starts wandering around the initial state (Figure 10A). Person #9 had ischemic changes in the heart. The supply of oxygen to the heart becomes deficient soon after the beginning of the physical exercise.
The dynamics of the JT/ST relationship for person #10 are depicted in Figure 11. The maximal load is 250 W; however, this load is reached in around 5 min only (Figure 11B). Clearly expressed pits do not form during the load or recovery processes.

4. Discussion

The depression of the amplitude of the ST segment during the stress exercise is a traditional biomarker for the diagnosis of coronary heart disease (CHD). However, the prognostic information of this variable has not yet been specifically studied and compared with more traditional exercise ECG variables such as a simple end-exercise ST-segment depression, or heart rate-adjusted ST/HR index [19,20] and ST/HR slope [21,22]. Since ST-segment depression has limited diagnostic characterization at exercise electrocardiography (ECG), ST-segment depression/heart rate (ST/HR) hysteresis and cardiopulmonary exercise test (CPET)-derived parameters have been proposed as alternatives for the diagnosis of the exercise-induced myocardial ischemia [23].
Recently, the prognostic information of other exercises, i.e., ECG variables based on the combined ST/HR data sampled during exercise and recovery phases (the so-called stress recovery index (SRI) [24]) has been demonstrated by [25,26]. The ST/HR hysteresis takes also into account a recovery phase but is not so susceptible to the reached maximum heart rate during the exercise. To obtain more precise information about an individual patient’s exercise capacity, the measurements of metabolic equivalents and oxygen consumption should be analyzed accurately [27].
This paper introduces a novel approach that provides valuable information about individual metabolic performance from the variation of the algebraic JT/ST relationship during the load and the recovery processes. The JT interval corresponds to the cardiac electric systole in the repolarization phase, and its changes are associated with the intensity of the myocardial metabolism. The alterations of the JT interval are influenced by the regulatory nervous system. Metabolic changes in the organism are closely associated with repolarization changes. ECG leads, where the JT interval is shorter, show that the repolarization processes happen faster in those myocardium areas. A longer duration of the JT interval indicates slower repolarization (and slower metabolic reactions) [28].
The limitations of this study are, first of all, related to the fact that this study included only men (in order to avoid higher dispersion of the obtained data). All data were recorded during the bicycle ergometry tests, and the functional state evaluation was performed only on these data.
Every assessed parameter reflects only specific physiological information of the human body. Our hypothesis is that all circuits of the organ control systems that have been activated during the load return to the baseline levels during the recovery process (for healthy people). In fact, the minimum level of the JT/ST relationship was in the range between 0.3 and 0.5 for all observed persons. We assume that when the human organism reaches this limit, it can no longer fall below this range, and then the reorganization of the cardiovascular system takes place. There are two possible options during the repolarization process—the compensatory mechanisms are turned on for healthy persons or are completely imbalanced for persons with ischemic heart disease.
It can be observed that healthy persons are submitted to protocols with rather high loads. The possible transit through the anaerobic threshold could be a factor affecting the JT/ST relationship. Therefore, the variation of the RR interval (the interbeat interval) during the load and the recovery processes is depicted for all subjects in Figure 2B, Figure 3B, Figure 4B, Figure 5B, Figure 6B, Figure 7B, Figure 8B, Figure 9B, Figure 10B and Figure 11B. In 1982, Conconi [29,30] stated that the anaerobic threshold correlates to a deflection point in the heart rate during the exercise (the heart rate reaches a plateau at near maximal exercise intensities). However, the RR interval reaches a sharp minimum at the load termination moment (for all persons except person #6 and person #8). Therefore, it can be concluded that the anaerobic threshold does not play the role of a causal factor that influences the formation of two consecutive declines in the JT/ST algebraic relationship.

5. Conclusions

The JT/ST algebraic relationship reveals interesting and important information on the dynamics of self-organization of the human cardiovascular system during the load and recovery processes for healthy persons. The JT/ST relationship starts rising at higher loads until the end of the exercise. Such an effect can be related to the activation of compensatory adaptive mechanisms of the cardiovascular system. The JT/ST relationship decreases again at the beginning of the recovery process. Such an effect indicates the shutdown of the compensatory mechanisms. Finally, the function of the cardiovascular system returns to the idle state observed before the exercise.
The dynamics of the JT/ST relationship for persons with suspected ischemic heart disease revealed a single decrease during the load process. Such an effect shows a relatively small activation of compensatory mechanisms and could serve as an early predictor of ischemic heart disease.

Author Contributions

Conceptualization, A.V. and M.R.; methodology, A.V., Z.N.; software, M.R.; validation, V.Š, M.R. and A.V.; formal analysis, Z.N.; investigation, A.V and V.Š.; resources, A.V.; data curation, A.V.; writing—original draft preparation, V.Š.; writing—review and editing, V.Š., M.R. and A.V..; visualization, V.Š.; supervision, A.V and M.R.; project administration, A.V.; funding acquisition, A.V. All authors have read and agreed to the published version of the manuscript.

Funding

This research received no external funding.

Institutional Review Board Statement

The study was conducted according to the guidelines of the Declaration of Helsinki and approved by the Kaunas Regional Ethics Committee for Biomedical Investigations (No. BE-2-51, 23.12.2015).

Informed Consent Statement

Informed consent was obtained from all subjects involved in the study.

Data Availability Statement

All datasets analyzed in the current study are available from the corresponding author on reasonable request.

Conflicts of Interest

The authors declare no conflict of interest.

References

  1. Seely, A.J.E.; Christou, N.V. Multiple organ dysfunction syndrome: Exploring the paradigm of complex nonlinear systems. Crit. Care Med. 2000, 28, 2193–2200. [Google Scholar] [CrossRef]
  2. Que, C.; Kenyon, C.; Olivenstein, R.; Macklem, P.; Maksym, G. Homeokinesis and short-term variability of human airway caliber. J. Appl. Physiol. 2001, 91, 1131–1141. [Google Scholar] [CrossRef] [PubMed]
  3. Muntianaitė-Dulkinienė, I.; Poškaitis, V.; Vainoras, A.; Jurevičius, J.; Bikulčienė, L.; Navickas, Z. Cointegration of Different ECG Parametres for Various Physical Tasks. Elektronika ir Elektrotechnika 2009, 94, 77–80. [Google Scholar]
  4. De Bruyne, M. Prolonged QT interval predicts cardiac and all-cause mortality in the elderly The Rotterdam Study. Eur. Heart J. 1999, 20, 278–284. [Google Scholar] [CrossRef] [PubMed] [Green Version]
  5. Dekker, J.; Schouten, E.; Klootwijk, P.; Pool, J.; Kromhout, D. Association between QT interval and coronary heart disease in middle-aged and elderly men. The Zutphen Study. Circulation 1994, 90, 779–785. [Google Scholar] [CrossRef] [PubMed] [Green Version]
  6. Crow, R.; Hannan, P.; Folsom, A. Prognostic significance of corrected QT and corrected JT interval for incident coronary heart disease in a general population sample stratified by presence or absence of wide QRS complex. ACC Curr. J. Rev. 2004, 13, 28. [Google Scholar] [CrossRef]
  7. Rautaharju, P.M.; Zhang, Z.M.; Prineas, R.; Heiss, G. Assessment of prolonged QT and JT intervals in ventricular conduction defects. Am. J. Cardiol. 2004, 93, 1017–1021. [Google Scholar] [CrossRef] [PubMed]
  8. Ahnve, S. Correction of the QT interval for heart rate: Review of different formulas and the use of Bazett’s formula in myocardial infarction. Am. Heart J. 1985, 109, 568–574. [Google Scholar] [CrossRef]
  9. Goldenberg, I.; Moss, A.J.; Zareba, W. QT interval: How to measure it and what is “normal”. J. Cardiovasc. Electrophysiol. 2006, 17, 333–336. [Google Scholar] [CrossRef]
  10. Taylor-Piliae, R.E. Tai Chi as an Adjunct to Cardiac Rehabilitation Exercise Training. J. Cardiopulm. Rehabil. 2003, 23, 90–96. [Google Scholar] [CrossRef]
  11. Zarafshar, S.; Wong, M.; Singh, N.; Aggarwal, S.; Adhikarla, C.; Froelicher, V.F. Resting ST amplitude: Prognosis and normal values in an ambulatory clinical population. Ann. Noninvasive Electrocardiol. 2013, 18, 519–529. [Google Scholar] [CrossRef]
  12. Ziaukas, P.; Alabdulgader, A.; Vainoras, A.; Navickas, Z.; Ragulskis, M. New approach for visualization of relationships between RR and JT intervals. PLoS ONE 2017, 12, e0174279. [Google Scholar] [CrossRef] [PubMed]
  13. Saunoriene, L.; Siauciunaite, V.; Vainoras, A.; Bertasiute, V.; Navickas, Z.; Ragulskis, M. The characterization of the transit through the anaerobic threshold based on relationships between RR and QRS cardiac intervals. PLoS ONE 2019, 14, e0216938. [Google Scholar] [CrossRef] [PubMed]
  14. Vainoras, A.; Gargasas, L.; Ruseckas, R.; Miškinis, V.; Jurkonienė, R. Computerised exercise electrocardiogram analysis system “Kaunas-Load”. In Proceedings of the 24th international congress on Electrocardiology [and] 38th international symposium on Vectorcardiography: Abstracts book, Bratislava, Slovak, 24–28 June 1997. [Google Scholar]
  15. Gargasas, L.; Vainoras, A.; Ruseckas, R.; Jurkoniene, R.; Jurkonis, V.; Miskinis, V. A new software for ECG monitoring system. In NCeHT2006, Proceedings of the 6th Nordic Conference on eHealth and Telemedicine, Helsinki, Finland, 31 August–1 September 2006; Doupi, P., Ed.; Valopaino Oy: Helsinki, Finland, 2006; pp. 255–256. [Google Scholar]
  16. Bazett, H.C. An analysis of the time relations of electrocardiograms. Heart 1920, 7, 353–370. [Google Scholar] [CrossRef]
  17. Bretscher, O. Linear Algebra with Applications; Pearson/Prentice Hall: Upper Saddle River, NJ, USA, 2005. [Google Scholar]
  18. Vázquez, P.; Hristovski, R.; Balagué, N. The Path to Exhaustion: Time-Variability Properties of Coordinative Variables during Continuous Exercise. Front. Physiol. 2016, 7, 37. [Google Scholar] [CrossRef] [Green Version]
  19. Detrano, R.; Salcedo, E.; Passalacqua, M.; Friis, R. Exercise electrocardiographic variables: A critical appraisal. J. Am. Coll. Cardiol. 1986, 8, 836–847. [Google Scholar] [CrossRef]
  20. Kligfield, P.; Ameisen, O.; Okin, P.M. Relation of the exercise ST/HR slope to simple heart rate adjustment of ST segment depression. J. Electrocardiol. 1987, 20, 135. [Google Scholar]
  21. Elamin, M.; Mary, D.; Smith, D.; Linden, R. Prediction of severity of coronary artery disease using slope of submaximal ST segment/heart rate relationship. Cardiovasc. Res. 1980, 14, 681–691. [Google Scholar] [CrossRef]
  22. Kligfield, P.; Ameisen, O.; Okin, P. Heart rate adjustment of ST segment depression for improved detection of coronary artery disease. Circulation 1989, 79, 245–255. [Google Scholar] [CrossRef] [Green Version]
  23. Lehtinen, R. ST/HR hysteresis: Exercise and recovery phase ST depression/heart rate analysis of the exercise ECG. J. Electrocardiol. 1999, 32, 198–204. [Google Scholar] [CrossRef]
  24. Bigi, R.; Maffi, M.; Occhi, G.; Bolognese, L.; Pozzoni, L.; Curti, G. Improvement in identification of multivessel disease after acute myocardial infarction following stress-recovery analysis of ST depression in the heart rate domain during exercise. Eur. Heart J. 1994, 15, 1240–1246. [Google Scholar] [CrossRef] [PubMed]
  25. Bigi, R.; Cortigiani, L.; Gregori, D.; Bax, J.; Fiorentini, C. Prognostic Value of Combined Exercise and Recovery Electrocardiographic Analysis. Arch. Intern. Med. 2005, 165, 1253. [Google Scholar] [CrossRef] [Green Version]
  26. Bigi, R.; Cortigiani, L.; Gregori, D.; Fiorentini, C. Comparison of the Prognostic Value of the Stress-Recovery Index Versus Standard Electrocardiographic Criteria in Patients with a Negative Exercise Electrocardiogram. Am. J. Cardiol. 2007, 100, 605–609. [Google Scholar] [CrossRef] [PubMed]
  27. Svart, K.; Lehtinen, R.; Nieminen, T.; Nikus, K.; Lehtimäki, T.; Kööbi, T.; Niemelä, K.; Niemi, M.; Turjanmaa, V.; Kähönen, M.; et al. Exercise electrocardiography detection of coronary artery disease by ST-segment depression/heart rate hysteresis in women: The Finnish Cardiovascular Study. Int. J. Cardiol. 2010, 140, 182–188. [Google Scholar] [CrossRef]
  28. Gargasas, L.; Vainoras, A.; Schwela, H.; Jaruševičius, G.; Ruseckas, R.; Miškinis, V. JT interval changes during bicycle ergometry. In Proceedings of the Kardiologia Polska: II Miedzynarodowy Kongres Polskiego Towarzystwa Kardiologieznego, Kotowice, Poland, 4–6 September 1998; Volume 49, pp. 1–153. [Google Scholar]
  29. Conconi, F.; Ferrrari, M.; Ziglio, P.G.; Droghetti, P.; Codeca, L. Determination of the anaerobic threshold by a noninvasive field test in runners. J. Appl. Physiol. 1982, 52, 862–873. [Google Scholar] [CrossRef] [PubMed] [Green Version]
  30. Ballarin, E.; Borsetto, C.; Cellini, M.; Patracchini, M.; Vitiello, P.; Ziglio, P.G.; Conconi, F. Adaptation of the “Conconi test” to children and adolescents. Int. J. Sports Med. 1989, 10, 334–338. [Google Scholar] [CrossRef] [PubMed]
Figure 1. Diagram of typical ECG cardiac intervals and amplitudes used in the study.
Applsci 11 04805 g001
Figure 2. The dynamics of the JT/ST relationship during the load and the recovery processes for person #1 The x-axis in parts (A,B) represents the time (measured in minutes) from the beginning of the cycle ergometry exercise. The left y-axis in part (B) represents the power of the load in Watts. The right y-axis in part (B) represents the variation of the RR interval in ms. The algebraic JT/ST relationship is represented by the thin dashed black line in part A. The thick black solid vertical line in part A marks the end of the load.
Applsci 11 04805 g002
Figure 3. The dynamics of the JT/ST relationship during the load and recovery processes for person #2. The x-axis in parts (A,B) represents the time (measured in minutes) from the beginning of the cycle ergometry exercise. The left y-axis in part (B) represents the power of the load in Watts. The right y-axis in part (B) represents the variation of the RR interval in ms. The algebraic JT/ST relationship is represented by the thin dashed black line in part A. The thick black solid vertical line in part A marks the end of the load.
Applsci 11 04805 g003
Figure 4. The dynamics of the JT/ST relationship during the load and recovery processes for person #3. The x-axis in parts (A,B) represents the time (measured in minutes) from the beginning of the cycle ergometry exercise. The left y-axis in part (B) represents the power of the load in Watts. The right y-axis in part (B) represents the variation of the RR interval in ms. The algebraic JT/ST relationship is represented by the thin dashed black line in part A. The thick black solid vertical line in part A marks the end of the load.
Applsci 11 04805 g004
Figure 5. The dynamics of the JT/ST relationship during the load and recovery processes for person #4. The x-axis in parts (A,B) represents the time (measured in minutes) from the beginning of the cycle ergometry exercise. The left y-axis in part (B) represents the power of the load in Watts. The right y-axis in part (B) represents the variation of the RR interval in ms. The algebraic JT/ST relationship is represented by the thin dashed black line in part A. The thick black solid vertical line in part A marks the end of the load.
Applsci 11 04805 g005
Figure 6. The dynamics of the JT/ST relationship during the load and recovery processes for person #5. The x-axis in parts (A,B) represents the time (measured in minutes) from the beginning of the cycle ergometry exercise. The left y-axis in part (B) represents the power of the load in Watts. The right y-axis in part (B) represents the variation of the RR interval in ms. The algebraic JT/ST relationship is represented by the thin dashed black line in part A. The thick black solid vertical line in part A marks the end of the load.
Applsci 11 04805 g006
Figure 7. The dynamics of the JT/ST relationship during the load and recovery processes for person #6. The x-axis in parts (A,B) represents the time (measured in minutes) from the beginning of the cycle ergometry exercise. The left y-axis in part (B) represents the power of the load in Watts. The right y-axis in part (B) represents the variation of the RR interval in ms. The algebraic JT/ST relationship is represented by the thin dashed black line in part A. The thick black solid vertical line in part A marks the end of the load.
Applsci 11 04805 g007
Figure 8. The dynamics of the JT/ST relationship during the load and recovery processes for person #7. The x-axis in parts (A,B) represents the time (measured in minutes) from the beginning of the cycle ergometry exercise. The left y-axis in part (B) represents the power of the load in Watts. The right y-axis in part (B) represents the variation of the RR interval in ms. The algebraic JT/ST relationship is represented by the thin dashed black line in part A. The thick black solid vertical line in part A marks the end of the load.
Applsci 11 04805 g008
Figure 9. The dynamics of the JT/ST relationship during the load and the recovery processes for person #8. The x-axis in parts (A,B) represents the time (measured in minutes) from the beginning of the cycle ergometry exercise. The left y-axis in part (B) represents the power of the load in Watts. The right y-axis in part (B) represents the variation of the RR interval in ms. The algebraic JT/ST relationship is represented by the thin dashed black line in part A. The thick black solid vertical line in part A marks the end of the load.
Applsci 11 04805 g009
Figure 10. The dynamics of the JT/ST relationship during the load and recovery processes for person #9. The x-axis in parts (A,B) represents the time (measured in minutes) from the beginning of the cycle ergometry exercise. The left y-axis in part (B) represents the power of the load in Watts. The right y-axis in part (B) represents the variation of the RR interval in ms. The algebraic JT/ST relationship is represented by the thin dashed black line in part A. The thick black solid vertical line in part A marks the end of the load.
Applsci 11 04805 g010
Figure 11. The dynamics of the JT/ST relationship during the load and recovery processes for person #10. The x-axis in parts (A,B) represents the time (measured in minutes) from the beginning of the cycle ergometry exercise. The left y-axis in part (B) represents the power of the load in Watts. The right y-axis in part (B) represents the variation of the RR interval in ms. The algebraic JT/ST relationship is represented by the thin dashed black line in part A. The thick black solid vertical line in part A marks the end of the load.
Applsci 11 04805 g011
Publisher’s Note: MDPI stays neutral with regard to jurisdictional claims in published maps and institutional affiliations.