Article

Evaluation of Heating Technique of Deformed Reinforcement Using High-Frequency Induction Heating System

1
Department of Architecture Engineering, Songwon University, Gwangju 61756, Korea
2
Department of Mechanical and Shipbuilding Convergence Engineering, Pukyong National University, Busan 48547, Korea
*
Author to whom correspondence should be addressed.
Appl. Sci. 2021, 11(11), 4947; https://doi.org/10.3390/app11114947
Submission received: 29 April 2021 / Revised: 24 May 2021 / Accepted: 25 May 2021 / Published: 27 May 2021

Abstract

:
To improve recycling quality, it is necessary to develop a demolition technology that can be combined with existing crushing methods that employ large shredding-efficient equipment. The efficient collection of bones in a segmentation dismantling method must be considered according to the procedure. Furthermore, there is a need for the development of partial dismantling technologies that enable efficient remodeling, maintenance, and reinforcement. In this study, we experimentally investigated the temperature-rise characteristics of reinforced concrete through partial rapid heating during high-frequency induced heating. Accordingly, the chemical and physical vulnerability characteristics of the reinforced concrete were verified by studying the thermal conduction on the surface of the rebars and the cracks caused by the thermal expansion pressure of the rebars. Furthermore, we aimed to verify the applicability of the proposed technology by specifying the vulnerability range of the reinforced concrete based on the heating range, as well as the appropriate energy consumption. We investigated the temperature rise and temperature distribution characteristics of the rebar surfaces based on diameter, length, bar placement conditions, heating distance, heating coil location, and output, using reinforced steel of grade SD345. Maximum powers of 5, 6, and 10 kW, and inductive heating were used to achieve satisfactory results.

1. Introduction

High-frequency magnetic fields are mainly used to induce heat, and heating methods can be classified based on the principle of heat generation and application. In general, radio-frequency heating methods can be classified into two types, namely induction and dielectric heating. Induction heating is a method wherein an object is heated by eddy currents that are generated [1,2,3] when a high-frequency magnetic field is applied to a conductor, such as a metal. In contrast, dielectric heating is a method wherein an object is heated by dielectric loss caused by a high-frequency current applied to the dielectric [4,5,6].
Conducting a nondestructive investigation to assess steel corrosion in a reinforced concrete bridge throughout its life cycle is necessary because internal corrosion is not visible from the outside. Extensive research has been conducted on this matter, which has led to many nondestructive testing methods being proposed [7], namely the analytical method [8], half-cell potential method [9,10], resistance probe method [11], ray method [12], ultrasonic detection [13], and optical fiber sensing technology [14]. Although these methods have significantly improved the detection of steel corrosion, certain restrictions exist for their widespread use. For example, the analytical method relies on a reasonable and reliable predictive model for assessing steel corrosion [15], while the electrochemical method can calibrate the corrosion rate but cannot detect the corrosion quantity of the steel bar [16,17]. Thus, a more effective and convenient technology for corrosion detection is urgently required. The eddy current thermography method is a nondestructive testing technology that has been developed in recent years [18] and is based on the principles of electromagnetic induction and infrared radiation. When a conductor is placed in an alternating electromagnetic field, an eddy current is induced, which causes heat dissipation. The surface temperature of the conductor can be recorded using an infrared camera. The heating efficiency is controlled by the material characteristics of the conductor; therefore, the characteristics of the defects in the object can be assessed by analyzing the temperature variations.
Many researchers have conducted research on detecting structural defects [19,20,21], pipe leakages [22], and cracks [23]. Further, some research groups have investigated corrosion in steel bars based on eddy current thermography, and found that the temperature of a steel bar is dependent on the degree of corrosion of the specimens [24,25,26,27]. However, many other factors can influence the thermal properties of steel bars, such as the depth of the concrete layer, the diameter of the steel bar, and the humidity of concrete. These factors can affect the ability to detect corrosion in reinforcement structures, and the lack of research regarding their influence limits the application of these methods to quantitatively determine the degree of corrosion in steel bars.
Heat is primarily produced by applying high-frequency magnetic fields. Detection methods are thus classified according to the principle of heat generation and application. Typically, radio-frequency heating can be classified as induction or dielectric heating. Induction heating uses an eddy current generated [28,29,30] when a high-frequency magnetic field is applied to a conductor such as a metal. Conversely, the dielectric heating method uses the dielectric loss caused by a high-frequency current applied to the dielectric medium to generate heat [31,32].
This weakening mechanism has already been applied in the manufacturing of recycled aggregates as well as for removing deposited mortar on the surface of aggregates. However, heating methods using external heat sources have low energy efficiency, which results in high energy consumption and greenhouse gas generation through regeneration processes [33,34,35].
In contrast, dielectric heating can achieve uniform internal heating and, if necessary, the location of the electric field can be specified [36,37]. However, the dielectric constant of a heated object may vary significantly during heating. Further, because dielectric heating requires a higher frequency power supply than induction heating, power converters such as inverters are required [38]. Therefore, dielectric heating systems are expensive, and there is a risk of inductive and radio wave interferences due to the harmonic waves generated by power converters. To avoid the inductive failure of the power supply system, the supply line providing power to the dielectric heating furnace and other power supply systems are kept independent, and an active filter is also used [39]. Furthermore, to overcome the possible interference with other radio devices, a power source in a frequency band provided exclusively for dielectric heating is used. However, owing to problems associated with high frequencies (short wavelengths) and the required equipment, the efficiency of use for dismantling structures is relatively poor compared to induction heating methods [40].
Weakening mechanisms have been applied in the manufacturing of recycled aggregates with the aim of removing deposited mortar on the surface of aggregates. However, heating methods involving external heat sources exhibit a low energy efficiency and high energy consumption, and result in the generation of greenhouse gases during the regeneration processes [41,42,43].
Dielectric heating can be performed through uniform internal heating and, if necessary, by selecting the location of the electric field [44,45]. However, the dielectric constant of an object may vary significantly during heating. Because dielectric heating requires a higher frequency power supply than that of induction heating, power converters, such as inverters are required [46]. Therefore, the use of dielectric heating systems in facilities is considered to be expensive; these systems also pose a risk of inductive interference and radio wave interference due to the generation of harmonic waves by power converters. To overcome such cases of inductive failure of the power supply system, a separate power supply system is used for the dielectric heating furnace alone, and an active filter is used to reduce the interference [47]. Furthermore, radio wave interference with other radio devices can be overcome by using a power source in the frequency band provided exclusively for dielectric heating. However, owing to challenges faced with high frequencies (shortening wavelengths) and the required equipment, the use of dielectric heating methods for dismantling structures is considered to be less effective than that of induction heating methods [48].
Therefore, this study adopts a high-frequency induction heating mechanism wherein the most commonly used reinforcing steel inside concrete is considered as a conductive resistor and is heated [49]. The actual reinforced concrete structure uses a variety of different diameters of reinforcements depending on its shape and characteristics. Moreover, because the concrete is reinforced with varying thicknesses of the coating layer, the heating efficiency varies significantly depending on the diameter of the reinforcement.
In this study, the most commonly used reinforcing bars were used, and the heating efficiency based on the diameter of the reinforcing bars and the penetration efficiency based on the thickness of the coating were determined. The effects of the frequency used and the maximum heating area to be heated based on the temperature distribution were simultaneously and comprehensively examined to verify the feasibility of the heating system technology. Based on the various heating patterns, which depended on the back-reinforcement state and heating position of the reinforcing steel to be heated, we attempted to establish a methodology to achieve the optimum efficiency of the temperature-raising mechanism through high-frequency induction heating.

2. Heat Generation Model for Reinforcing Steel

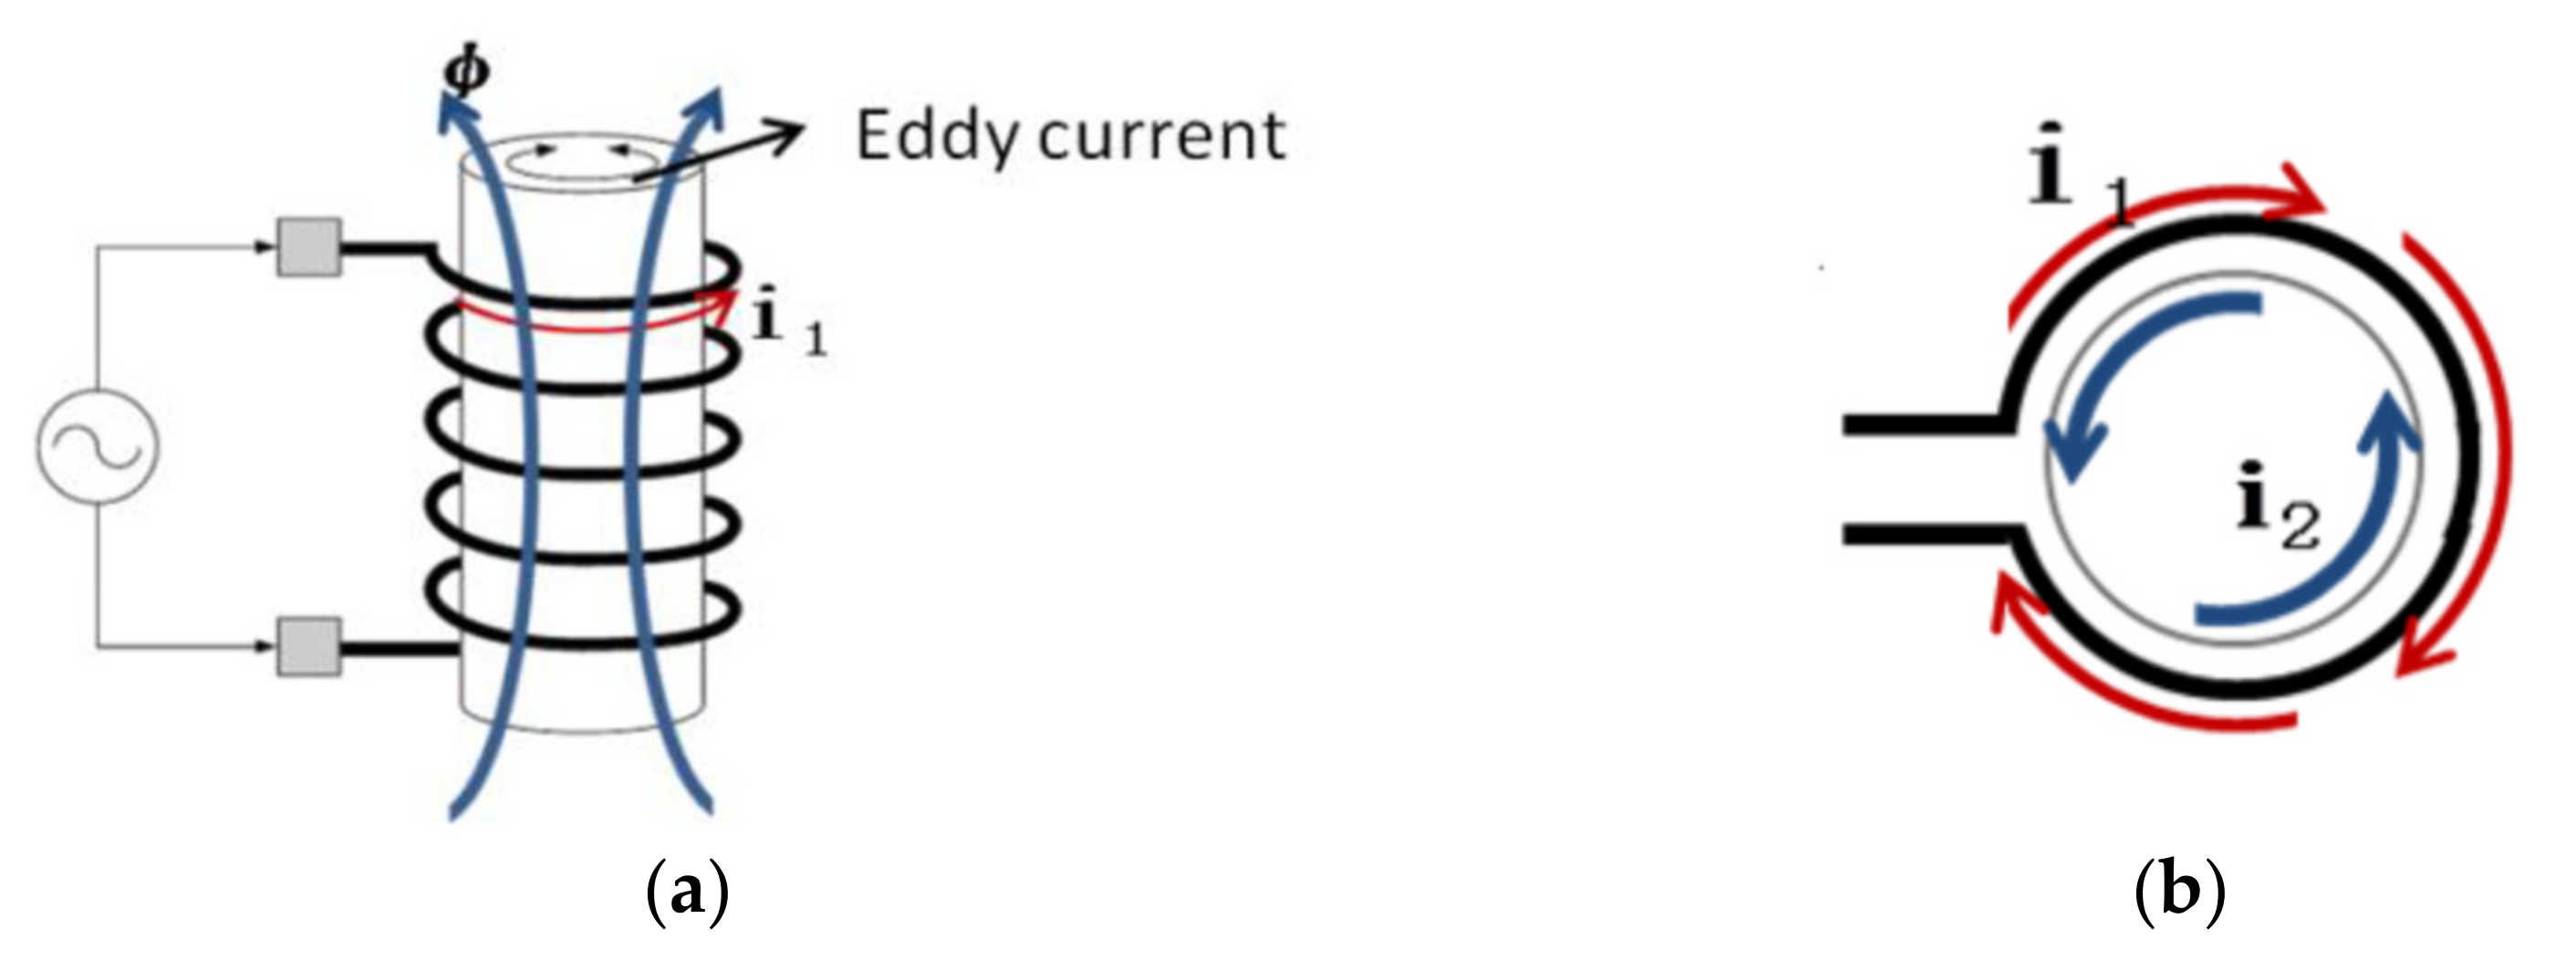
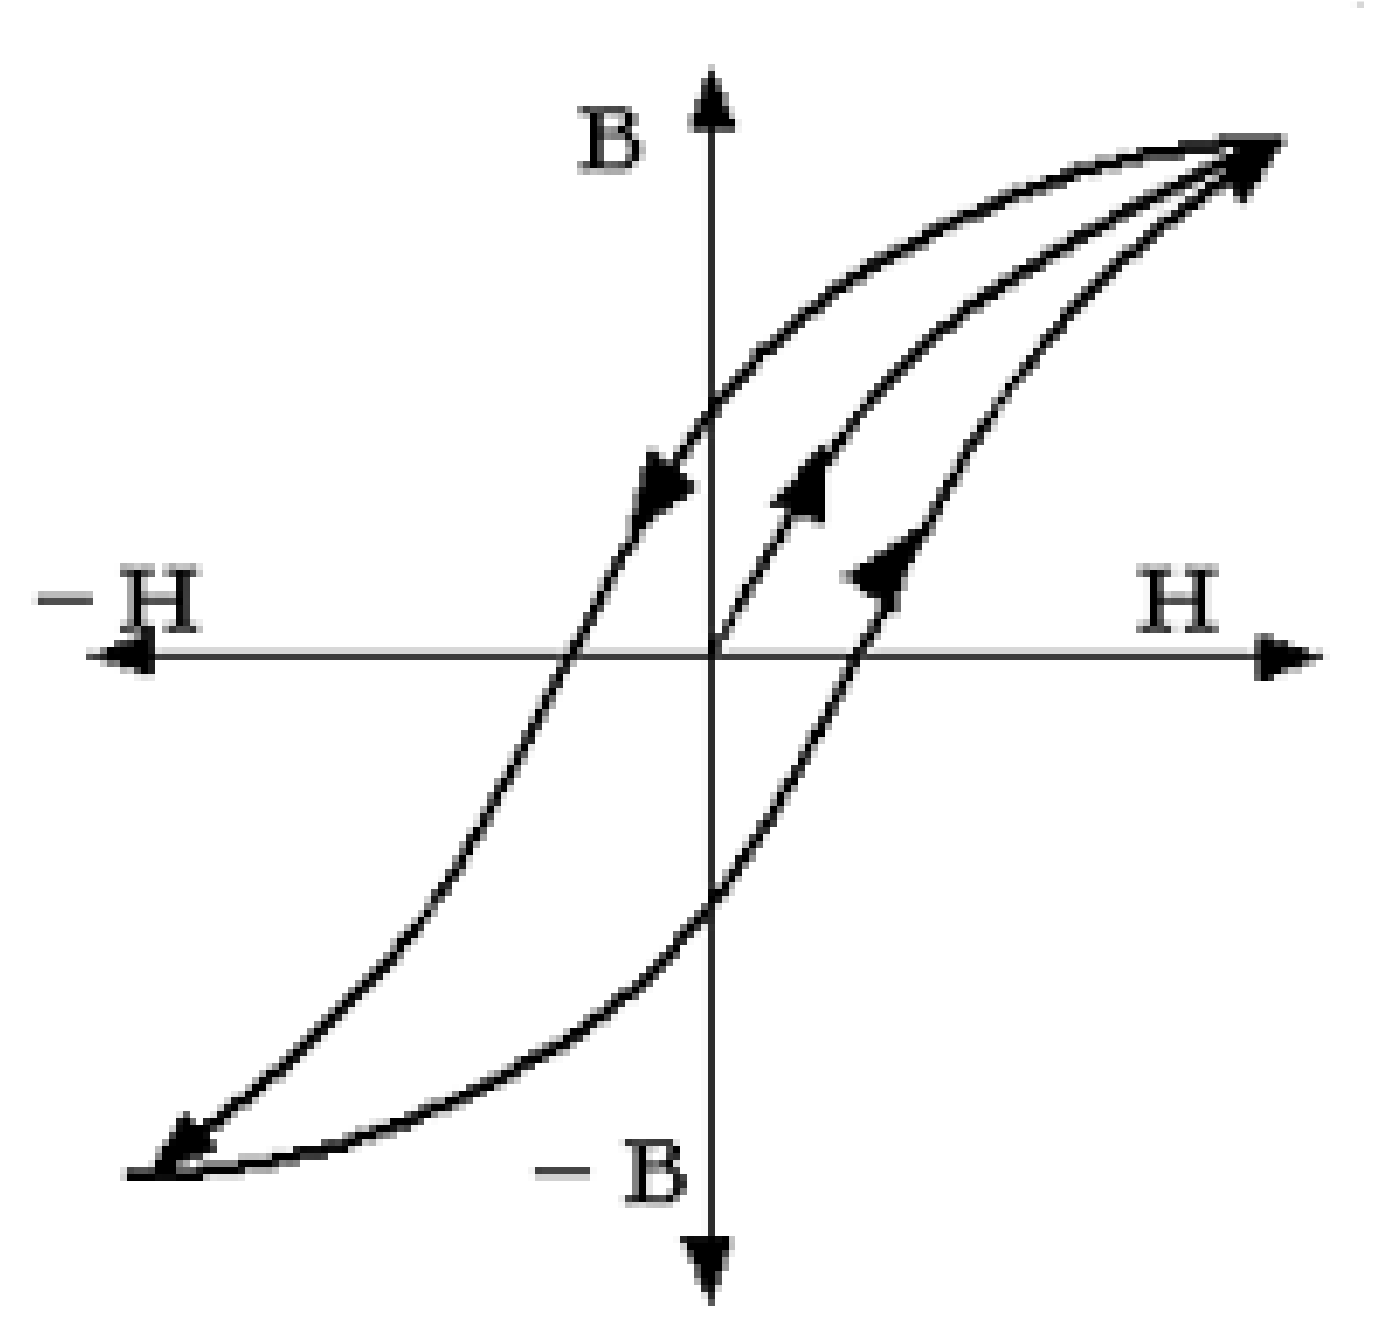
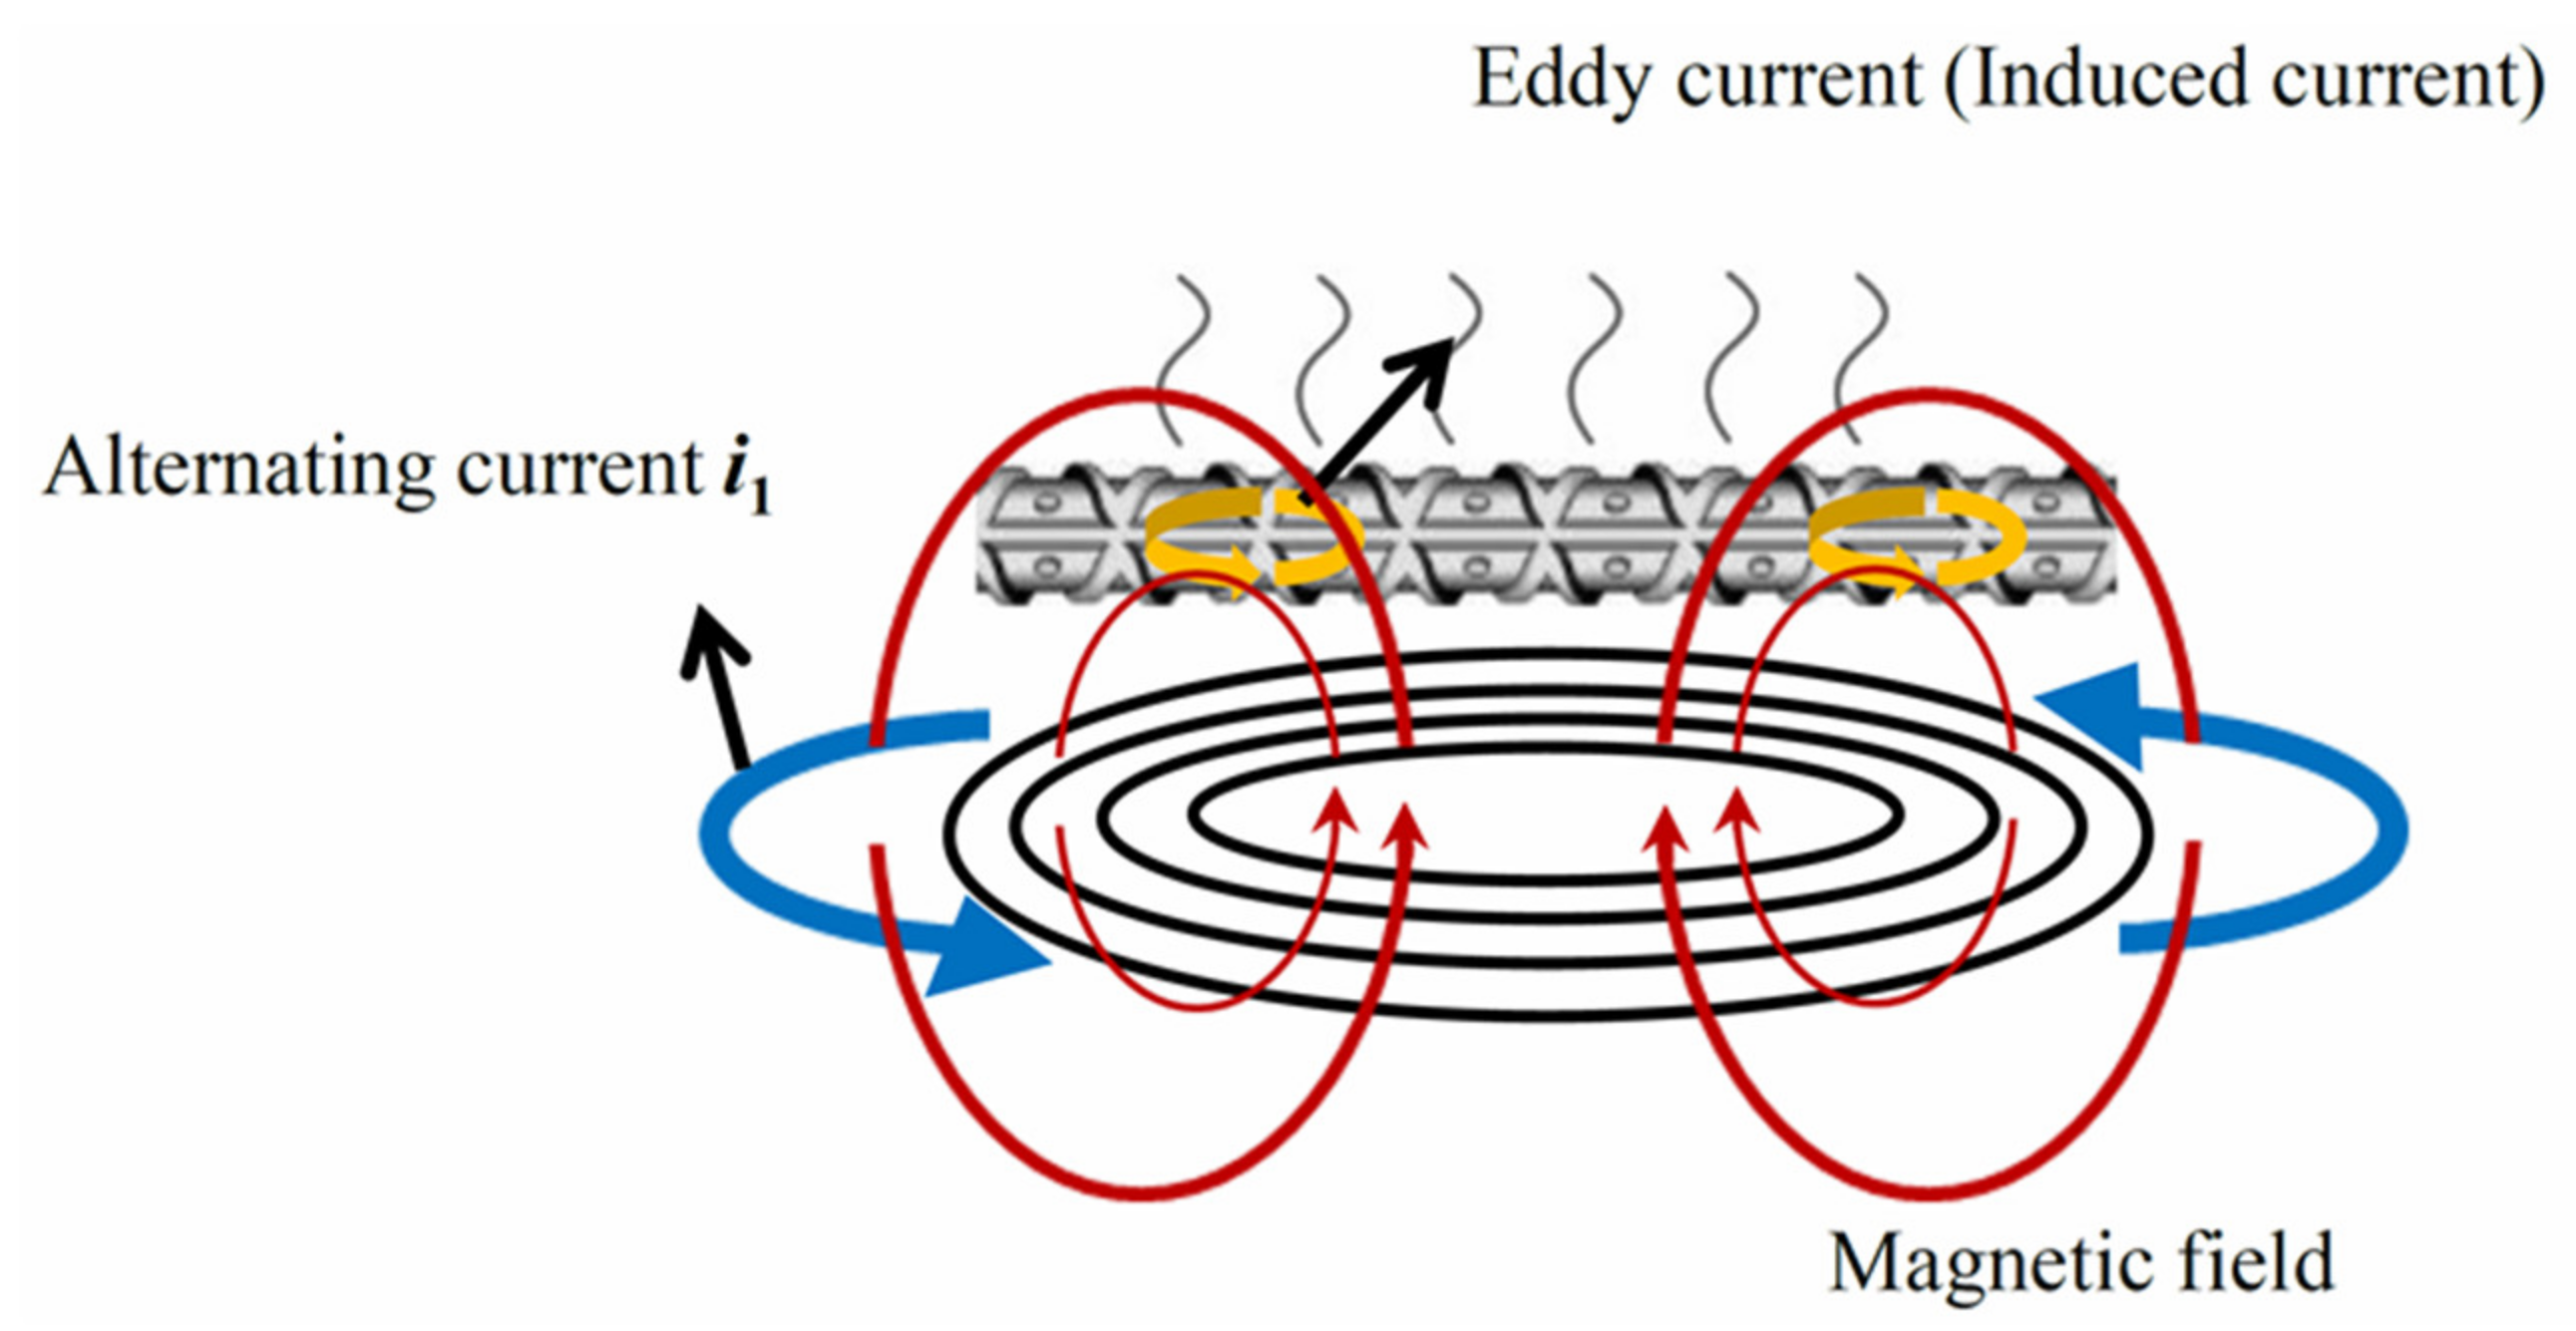
2.1. Definition and Mechanism of High-Frequency Induction Heating

Induction heating is a method of heating conductive resistors, such as metals, using electrical energy converted from high-frequency current transport conductors known as induction coils [50].
When an alternating current flow through the coil, a magnetic field is generated according to the principle of electromagnetic induction. The magnetic field changes with the current in an alternating current. Therefore, as shown in Figure 1, an induced eddy current (overcurrent) is generated in the metallic body in the coil without conducting wires, thereby generating heat due to resistance loss. Further, when an alternating current flow through the coil, a magnetic flux is generated inside the metal body surrounded by the coil. If the metal body is a magnetic body such as iron, the magnetic flux draws a hysteresis loop for the alternating current. Every time the loop is drawn once, the energy corresponding to the area enclosed by the loop is supplied from the external magnetic field to the magnetic body, whose magnetic energy is then converted into heat energy. In general, however, induction heating does not produce a closed magnetic path like a transformer, and the magnetic flux density is extremely large at 1 T (tesla = 1 Wb/m2)), so the effective permeability and the hysteresis coefficient are also small. Moreover, as the frequency used increases above 10 KHz, the hysteresis loss becomes negligible because the eddy current loss increases proportionally with the square of the frequency. As illustrated in Figure 1, placing an electrically conducting material (typically metal) near it causes an eddy current to flow through the metal under the influence of the changing magnetic line of force. Metals typically exhibit electrical resistance; thus, when current flows through the metal, Joule heat corresponding to “power = square of current × resistance” is generated, thereby heating the metal. This phenomenon is known as induction heating [51]. Induction heating can be used only for heating metals; consequently, the risk of temperature rise outside the heating part is low and heat loss is low.
An eddy current is the electric current induced by a change in the magnetic field. In general, when magnetic flux penetrates the fuselage or the magnetic flux in the fuselage moves relatively to cause a change in time, current may flow through any closed circuit that is formed locally in the direction that interferes with this change, and this current is called eddy current [1,2,3]. The magnitude and streamline of this current can be determined by the shape, step, conductivity, and magnetic flux of the conductor. When eddy currents are generated in the fuselage, they affect the normal current distribution and generate Joule heat, causing a power loss known eddy current loss [52]. Most of the eddy current is concentrated at a penetration depth of 90% from the surface; therefore, the average power Pm can be considered to be the same as the eddy current loss Pe. The eddy current loss is proportional to the square of the alternating flux and maximum magnetic flux density [53,54,55] and is inversely proportional to the resistivity; therefore, the conductivity of the conductor can be defined as the eddy current loss per unit volume (W), and is given by Equation (1).
Ρ σ 2 Β 𝓂 2
where   Β 𝓂 wb m 2 is the maximum magnetic flux density.
In Equation (1), the power generated when heating with a large frequency change to an arbitrary load increases in proportion to the square of the frequency when the frequency is low, but increases in proportion to the square of the frequency when the frequency exceeds a certain frequency. This is because the magnetic lines of force intersect with and offset each other in the load when they are too low in comparison with the penetration depth. Therefore, the frequency of the inflection points at which the generation of the induced power changes, that is, the point that represents the boundary between the two characteristics, is called the critical frequency. If the frequency is lower than the critical frequency, the slight frequency fluctuation causes a large change in the heating state, and if the frequency is too high, the intensity of the epidermal effect increases, thereby decreasing the heating efficiency. Consequently, a frequency of five times or more of the normal critical frequency was selected. Thus, in induction heating, frequency selection should be pruned, considering both the epidermal effect and critical frequency corresponding to the type and size of the material [3,4].
The alternating current in the coil winding is depicted in Figure 1. Flowing I generate a magnetic flux in the metal. If this metal body is a magnetic body such as iron, an alternating current is applied to it. A hysteresis curve was drawn, as depicted in Figure 2. As the area of this curve increases, the hysteresis loss increases, as represented by Steinmetz’s experimental formula [56].
Accordingly, the hysteresis loss Pk (W) can be represented by Equation (2):
Ρ 𝓀 = η ( Β 𝓂 ) 2 V
where, η is the hysteresis constant, and V is the iron core volume [m3].
The hysteresis constant η varies depending on the magnetic substance material, and unlike a normal transformer, a larger value of η enables easier induction heating. However, even if the heated body is a magnetic body, such as iron, the heated body generally does not form a closed circuit, such as a transformer, in induction heating; therefore, the magnetic flux density and effective magnetic permeability are small and the value of η is small. In addition, when the frequency reaches or exceeds 10 kHz, the loss of hysteresis may be ignored in induction heating because the loss of eddy current increases in proportion to the square of the frequency and becomes overwhelmingly larger [52,53].

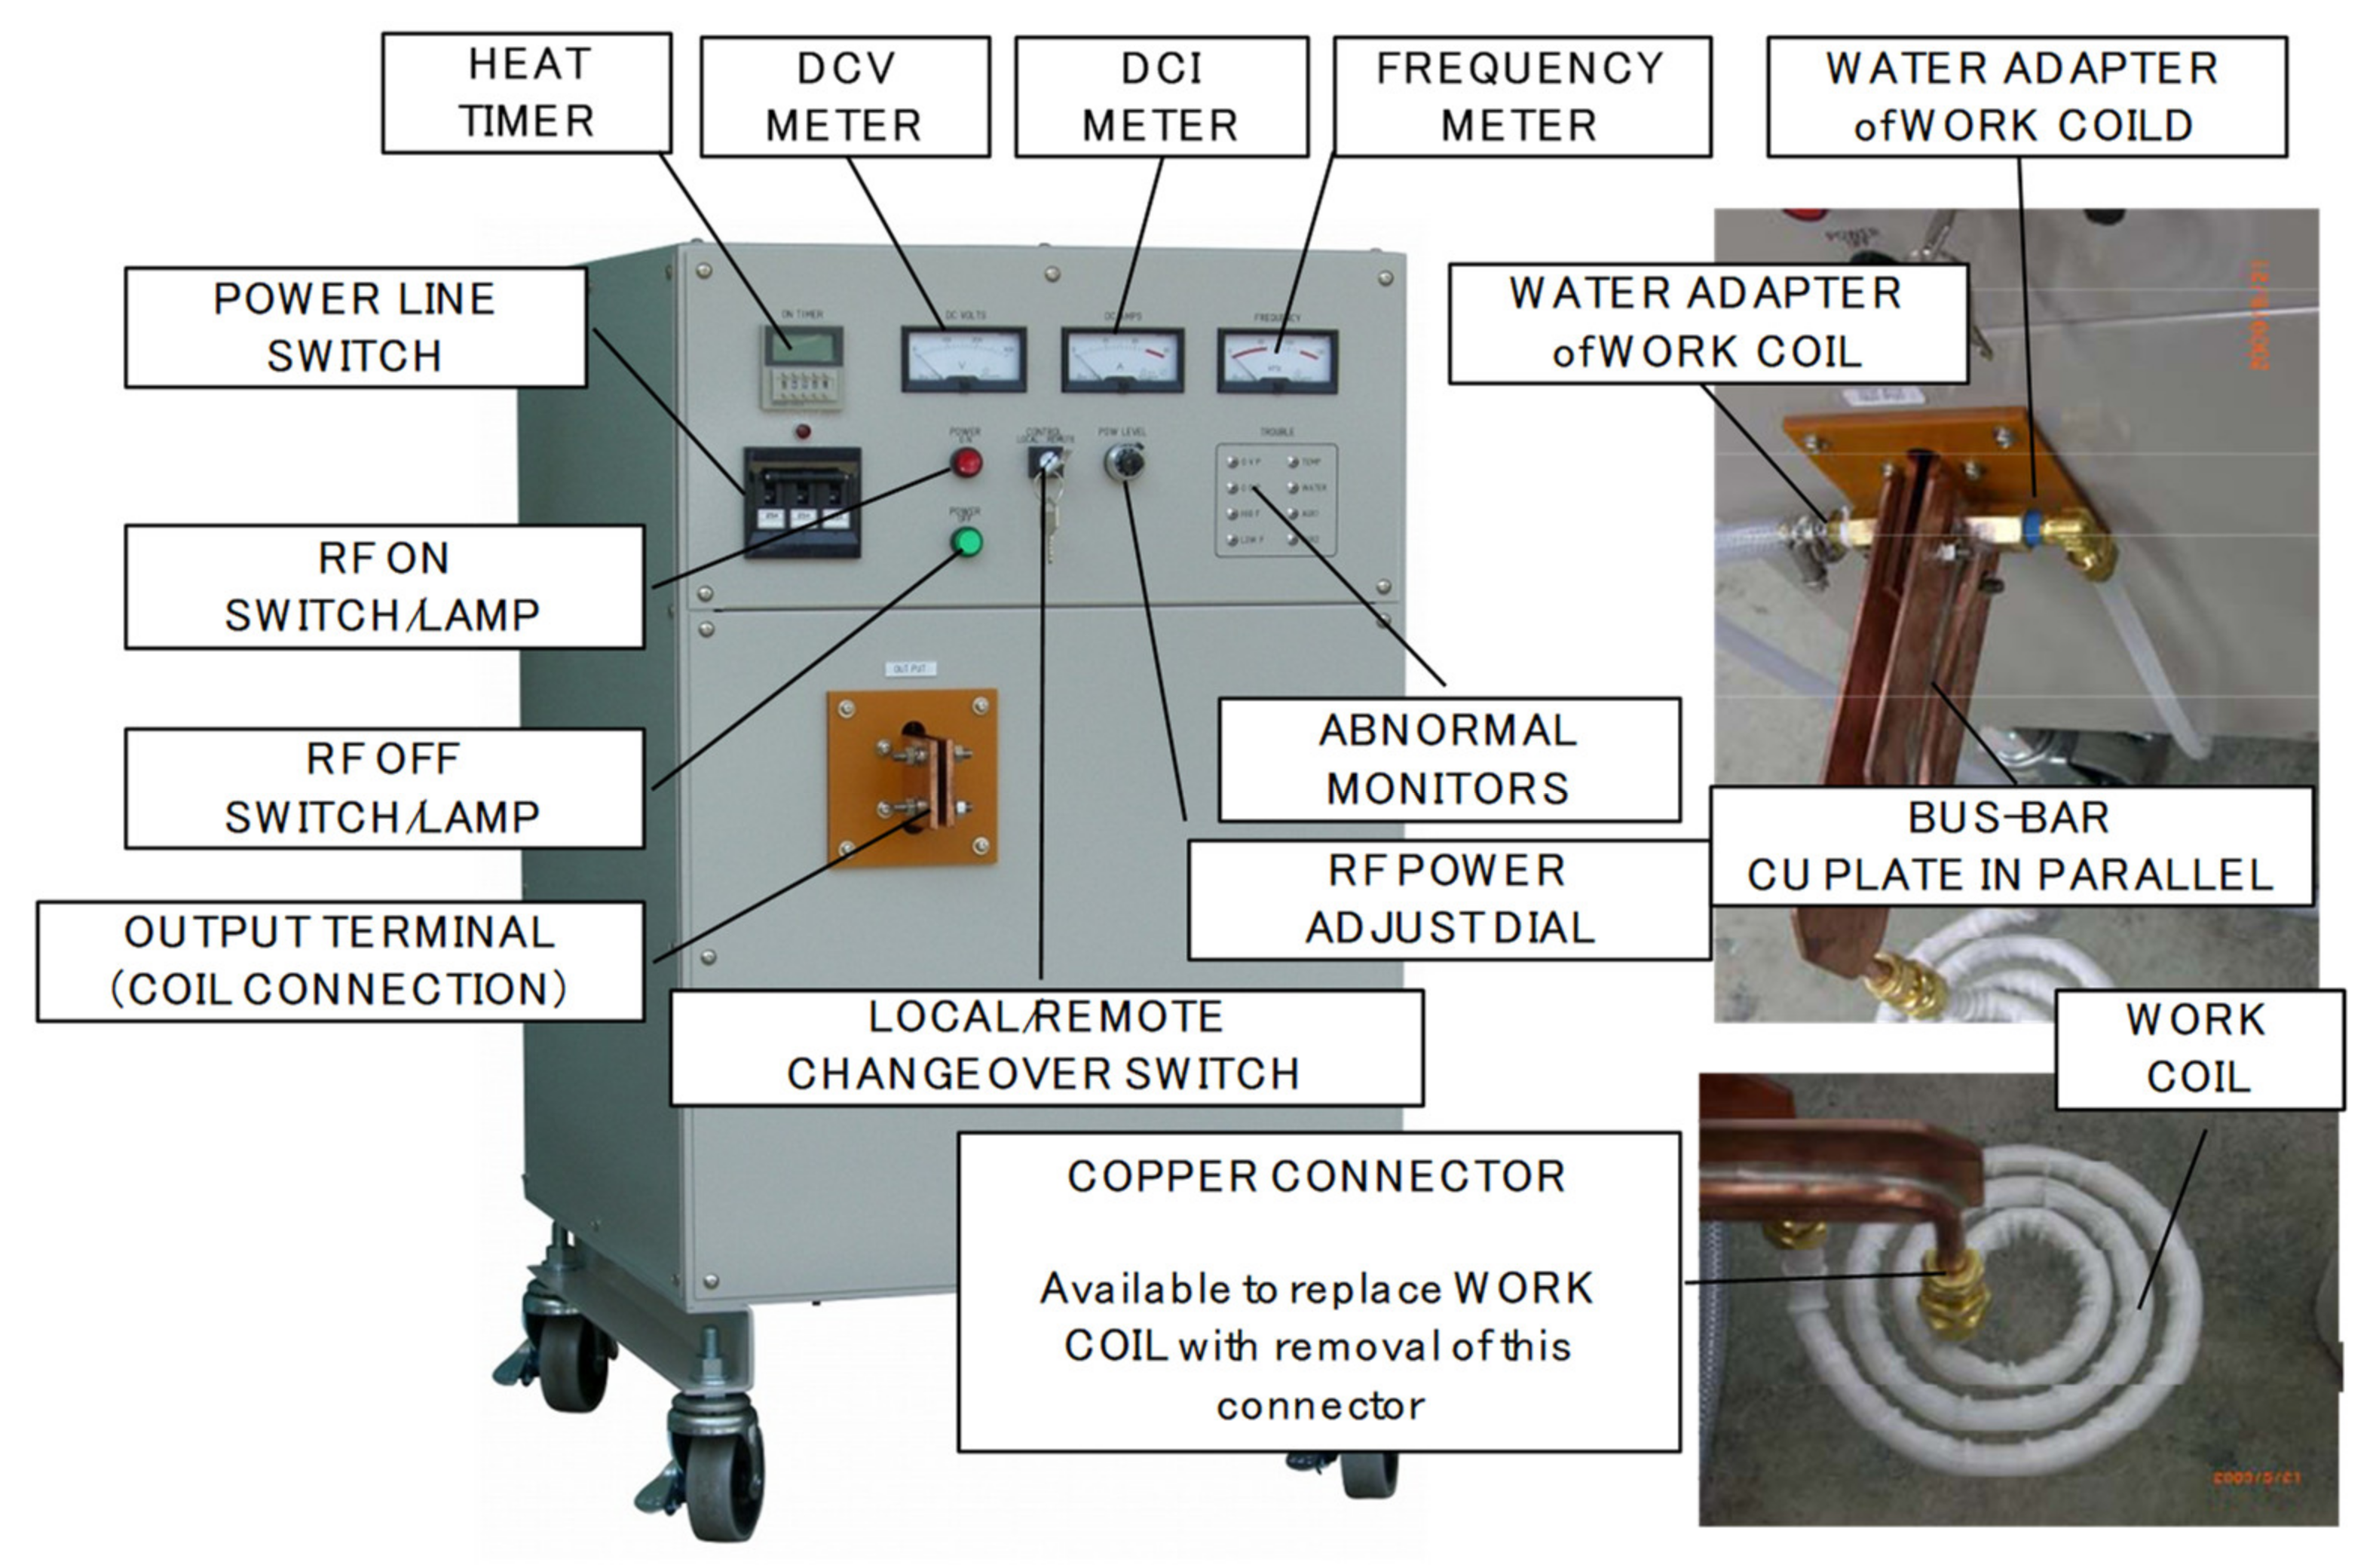
2.2. Heating Model of Reinforcement Using High-Frequency Induction Heating

As described above, when a high-frequency AC power supply is applied to the coil, an eddy current is induced, which acts as a heat source based on the resistance of the metal to heat the metal [54]. In the case of high-frequency induction heating, a large difference in heating efficiency occurs depending on the magnetic characteristics of the heated body; however, in the case of a magnetic body, a large eddy current [3,4] is induced in comparison with that in the case of a nonmagnetic body. Particularly in the case of magnetic materials, as indicated by Equation (3), the penetration depth decreases owing to the increase in relative permeability, and the efficiency of surface heating is further increased.
When using reinforcing bars with high relative permeability, the magnetic field generated by the coil is absorbed into the metal table, and the induction current is concentrated at the insertion site; thus, local heating on the surface of the reinforcing bar is considered possible. Moreover, because the range of the magnetic field can be adjusted by the rectilinear longitude of the heating coil, it is thought that local heating can be selectively performed [55]. Figure 3 illustrates the heating model of the reinforcing steel subjected to high-frequency induction heating.
As depicted in Figure 3, when a coil is arranged in a space and a current ί(t) flows, a magnetic vector potential A is generated at any point P(x,y,z) in space. A relational expression between the current density J and the magnetic vector potential A is obtained as follows.
A = μ 4 π v J γ 𝒹 V
If the current is AC, the magnetic vector potential A is also AC. The relational expression between the magnetic vector potential and magnetic flux density B is defined as follows.
B = × A
If the magnetic vector potential A is AC, then the magnetic flux density B is also AC. Accordingly, when a fluid is placed there, an electric field E is generated according to Equation (5). Furthermore, an eddy current J is generated by the electric field.
× E = B t
J = σ E
where σ is the conductivity of the conductor.
The entire magnetic field is determined by both the magnetic field generated by the current flowing through the coil and the magnetic field generated by the eddy current. This generates an electromotive force in the coil. As shown in Equation (7), the electromotive force of the coil represents the electric field generated along its winding.
V = c E × 𝒹 = c A t   𝒹
Thus, when the coil is placed close to the conductor, the magnetic field in the conductor corresponds to the eddy current distribution [2,52].

3. Results and Investigation

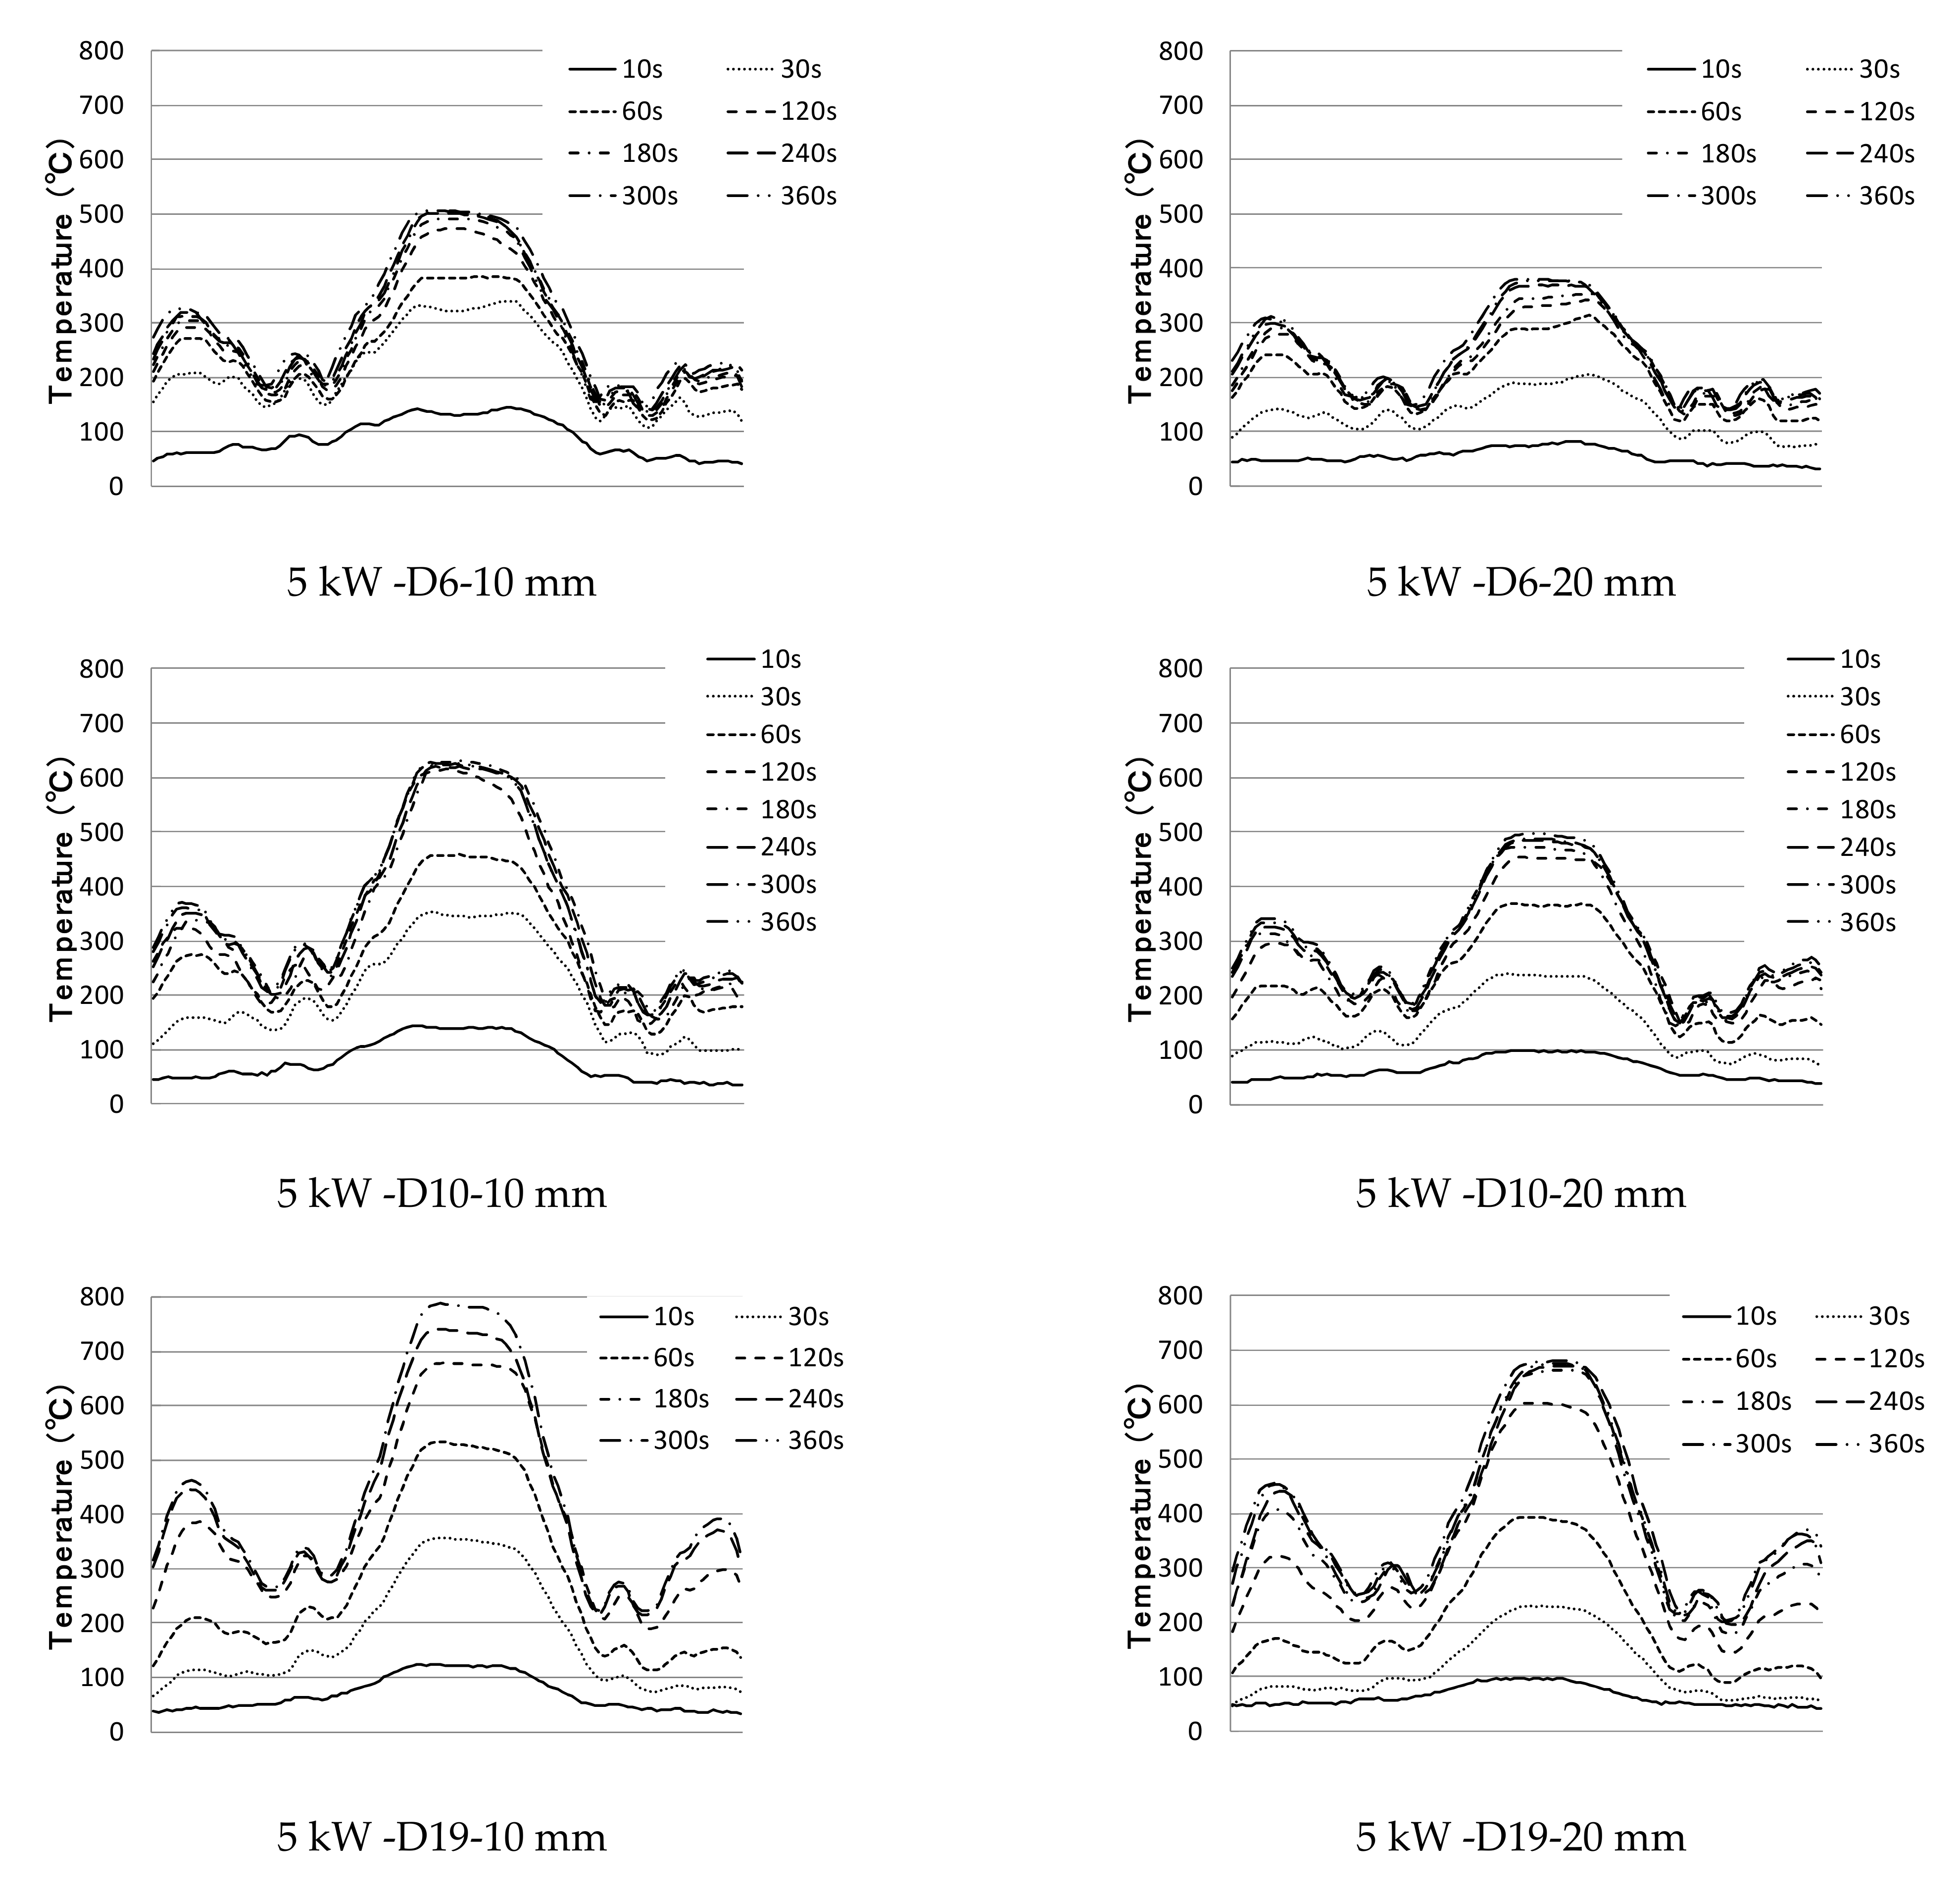
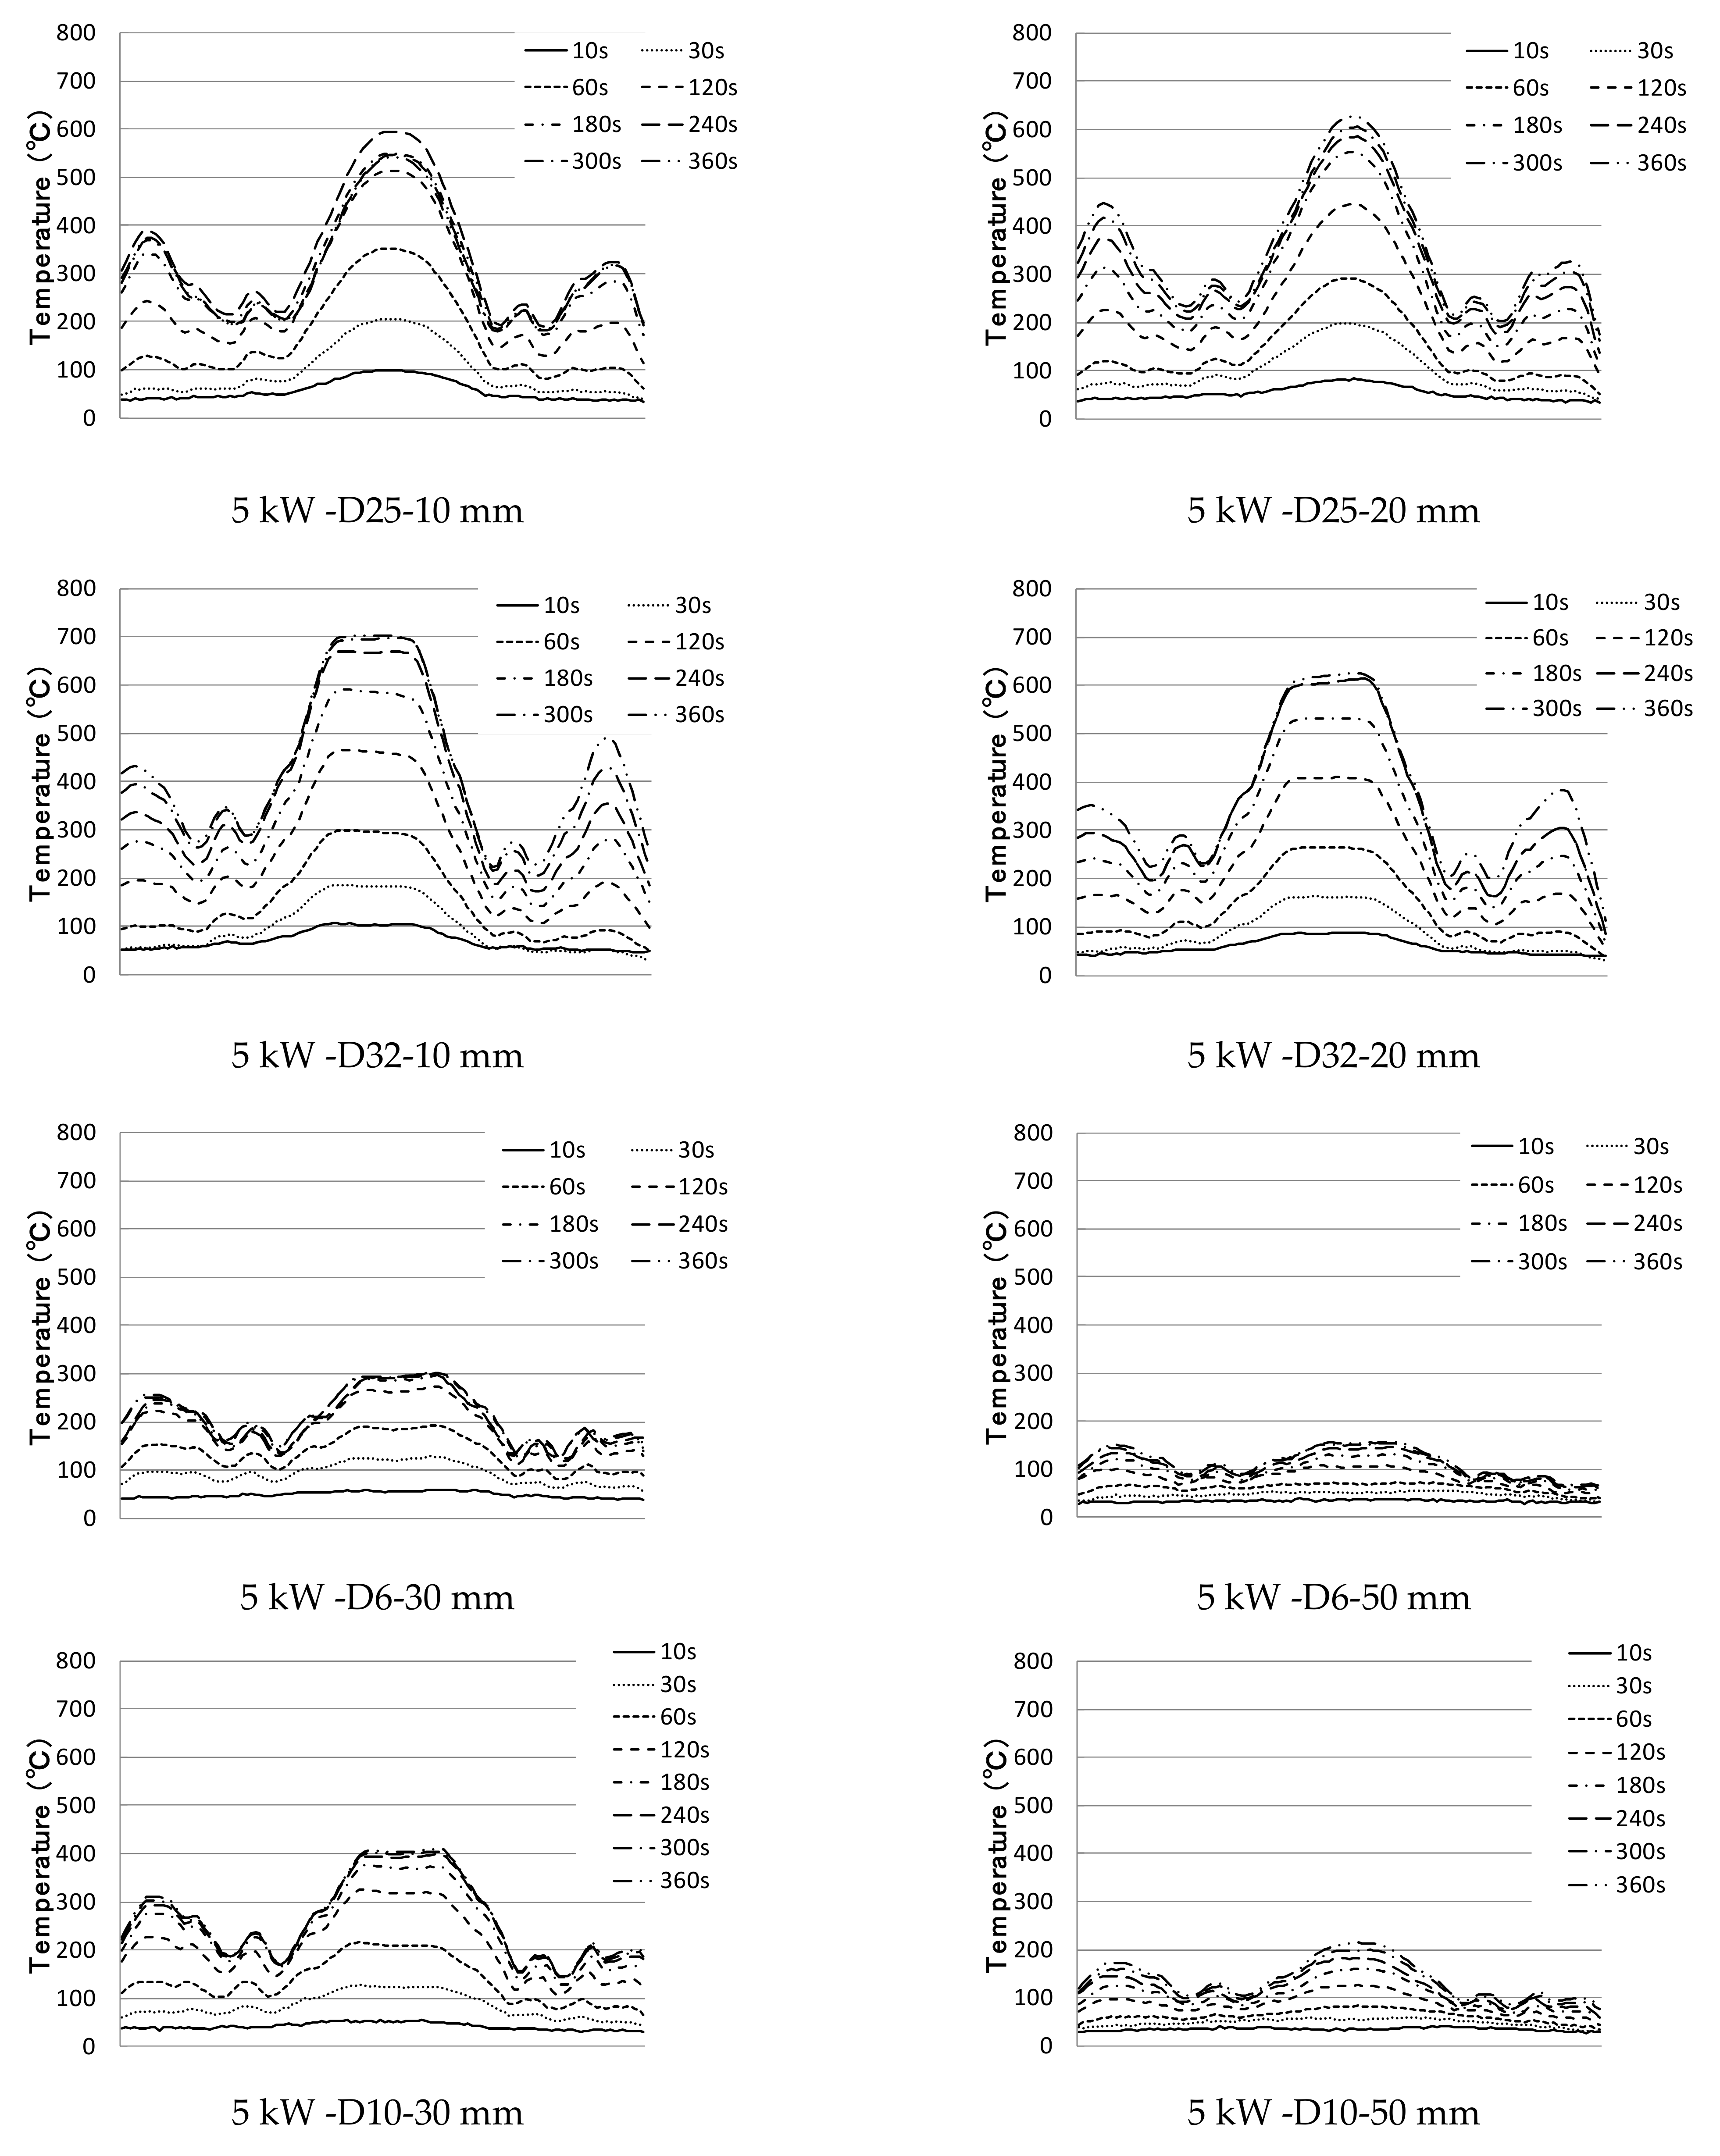
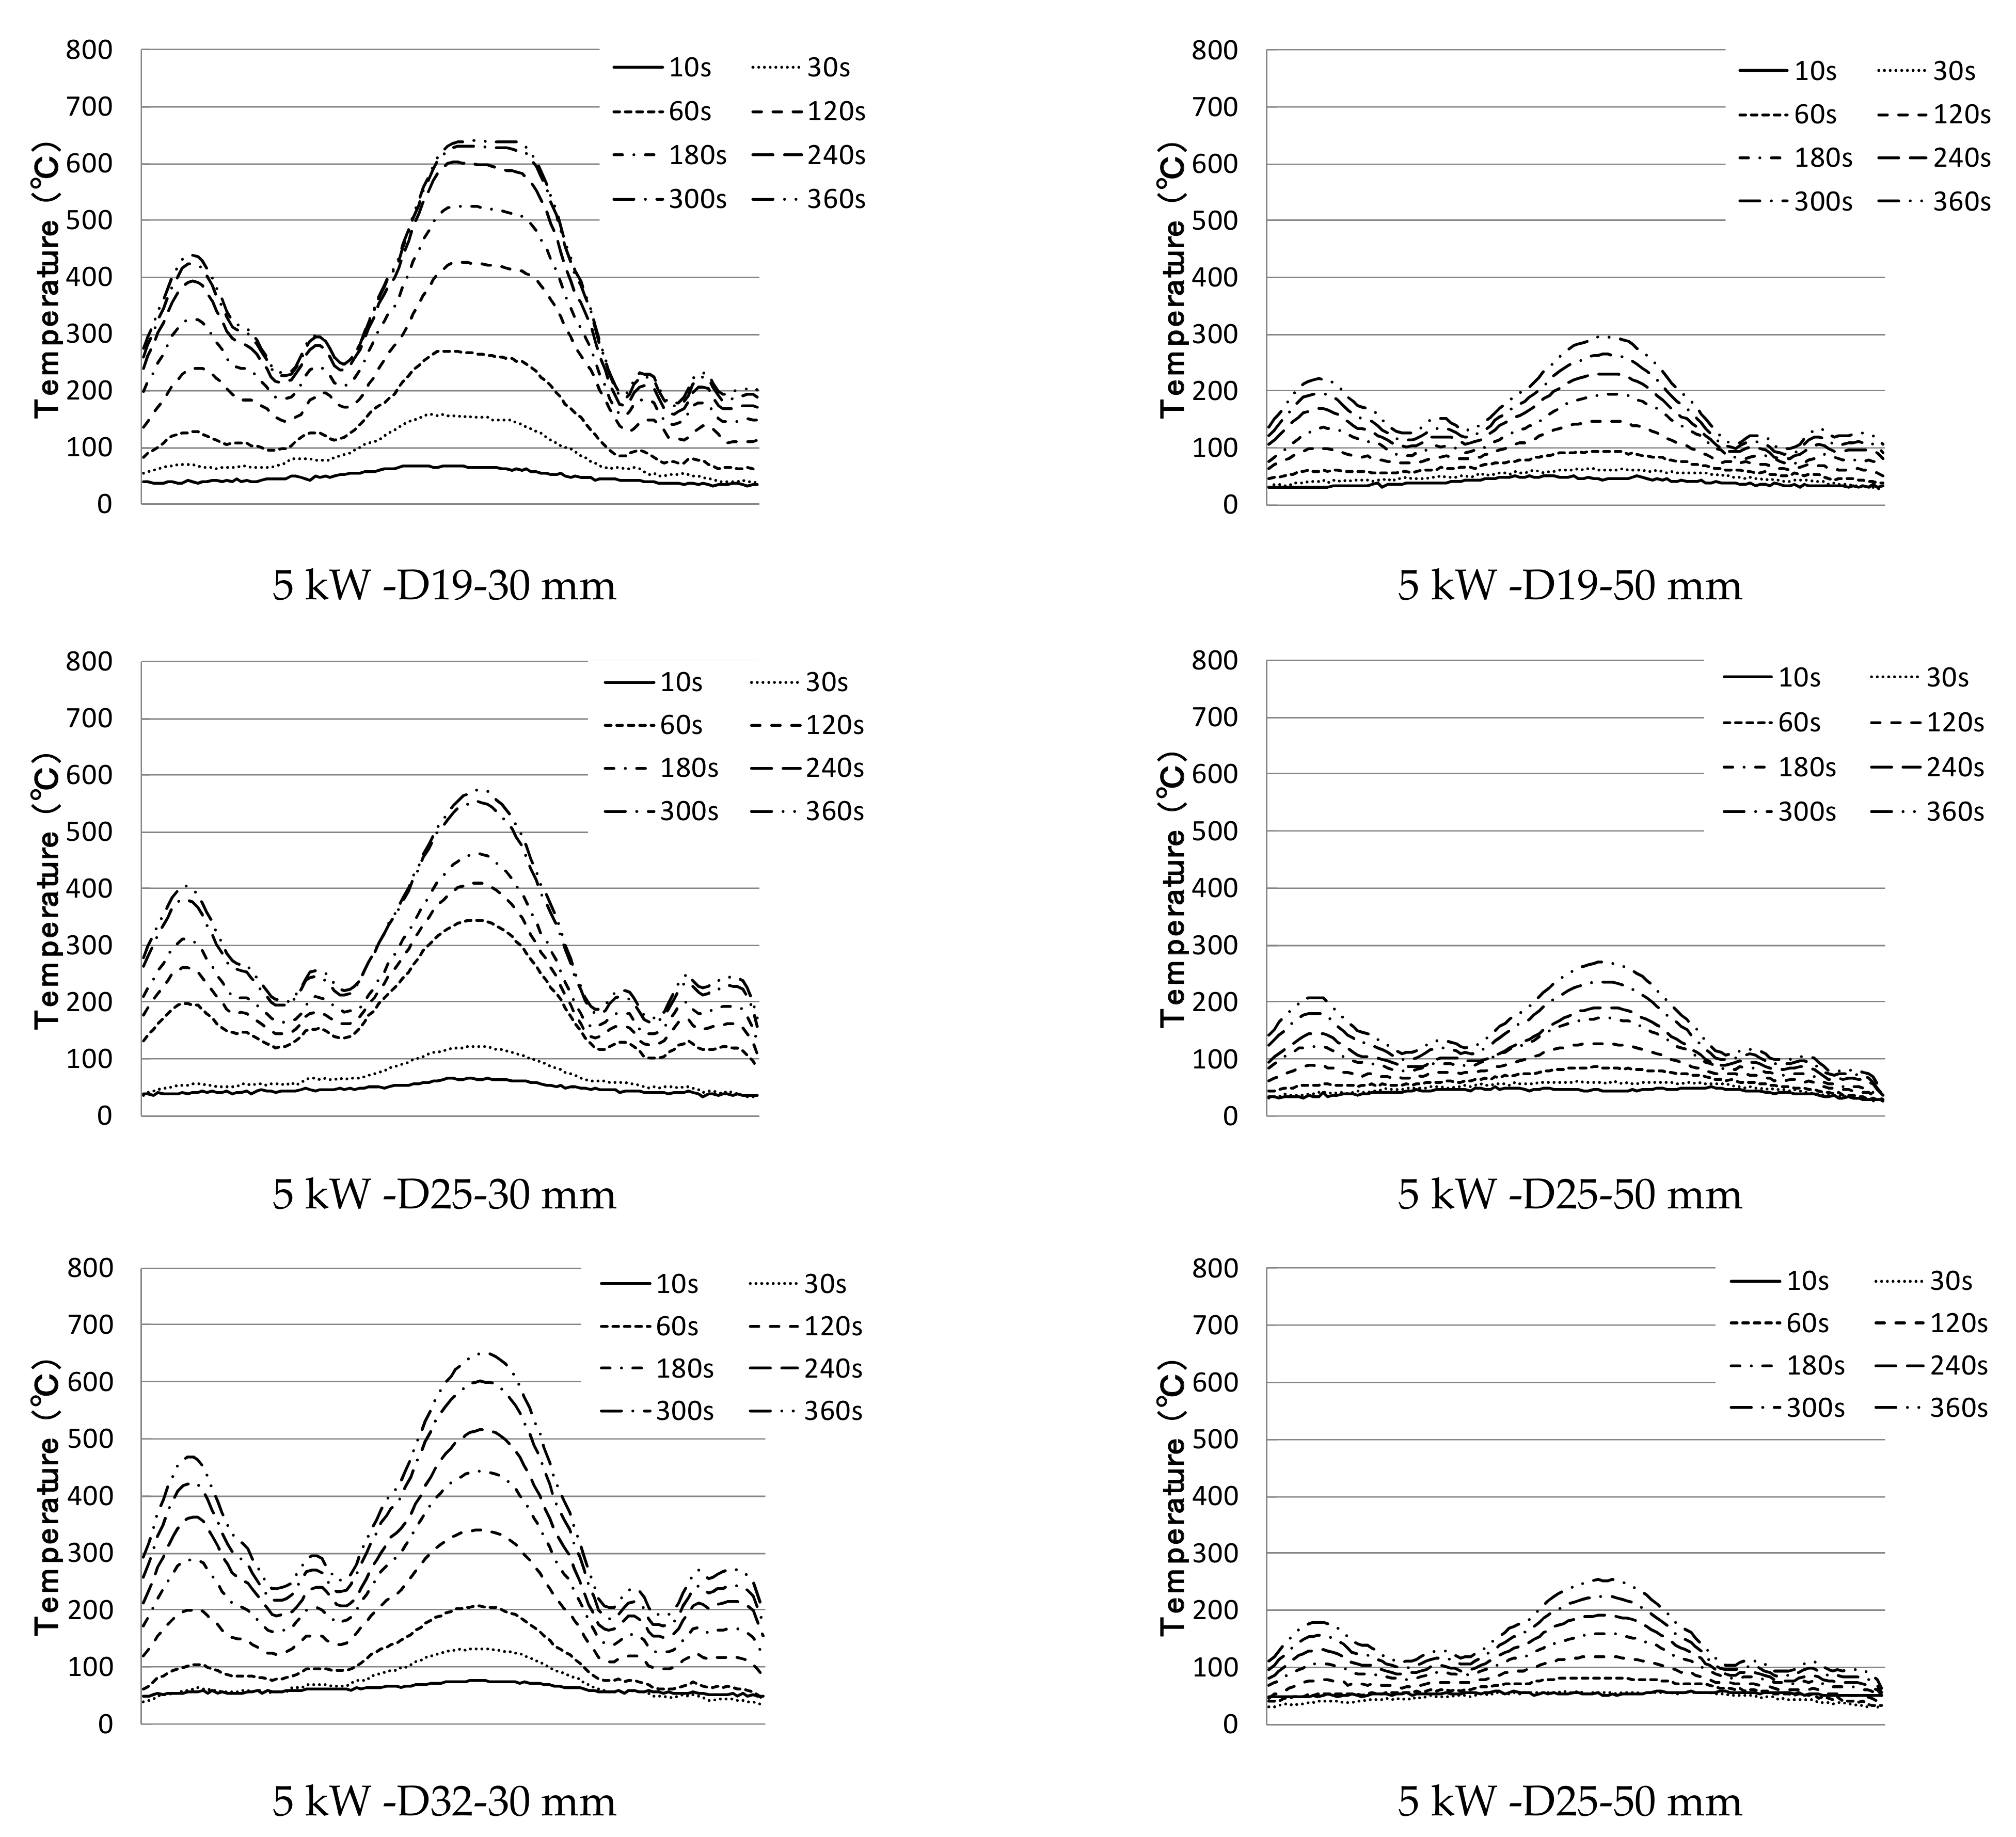
3.1. Temperature Characteristics of Single Reinforcement by Induction Heating

3.1.1. Materials Used

Deformed reinforcement of grade SD345 and nominal numbers D6, D10, D19, D25, and D32 was used. As presented in the experimental results, the length of the reinforcement was cut to 150 mm and 430 mm. The dimensions and mechanical properties of the deformed steel bars are listed in Table 1.

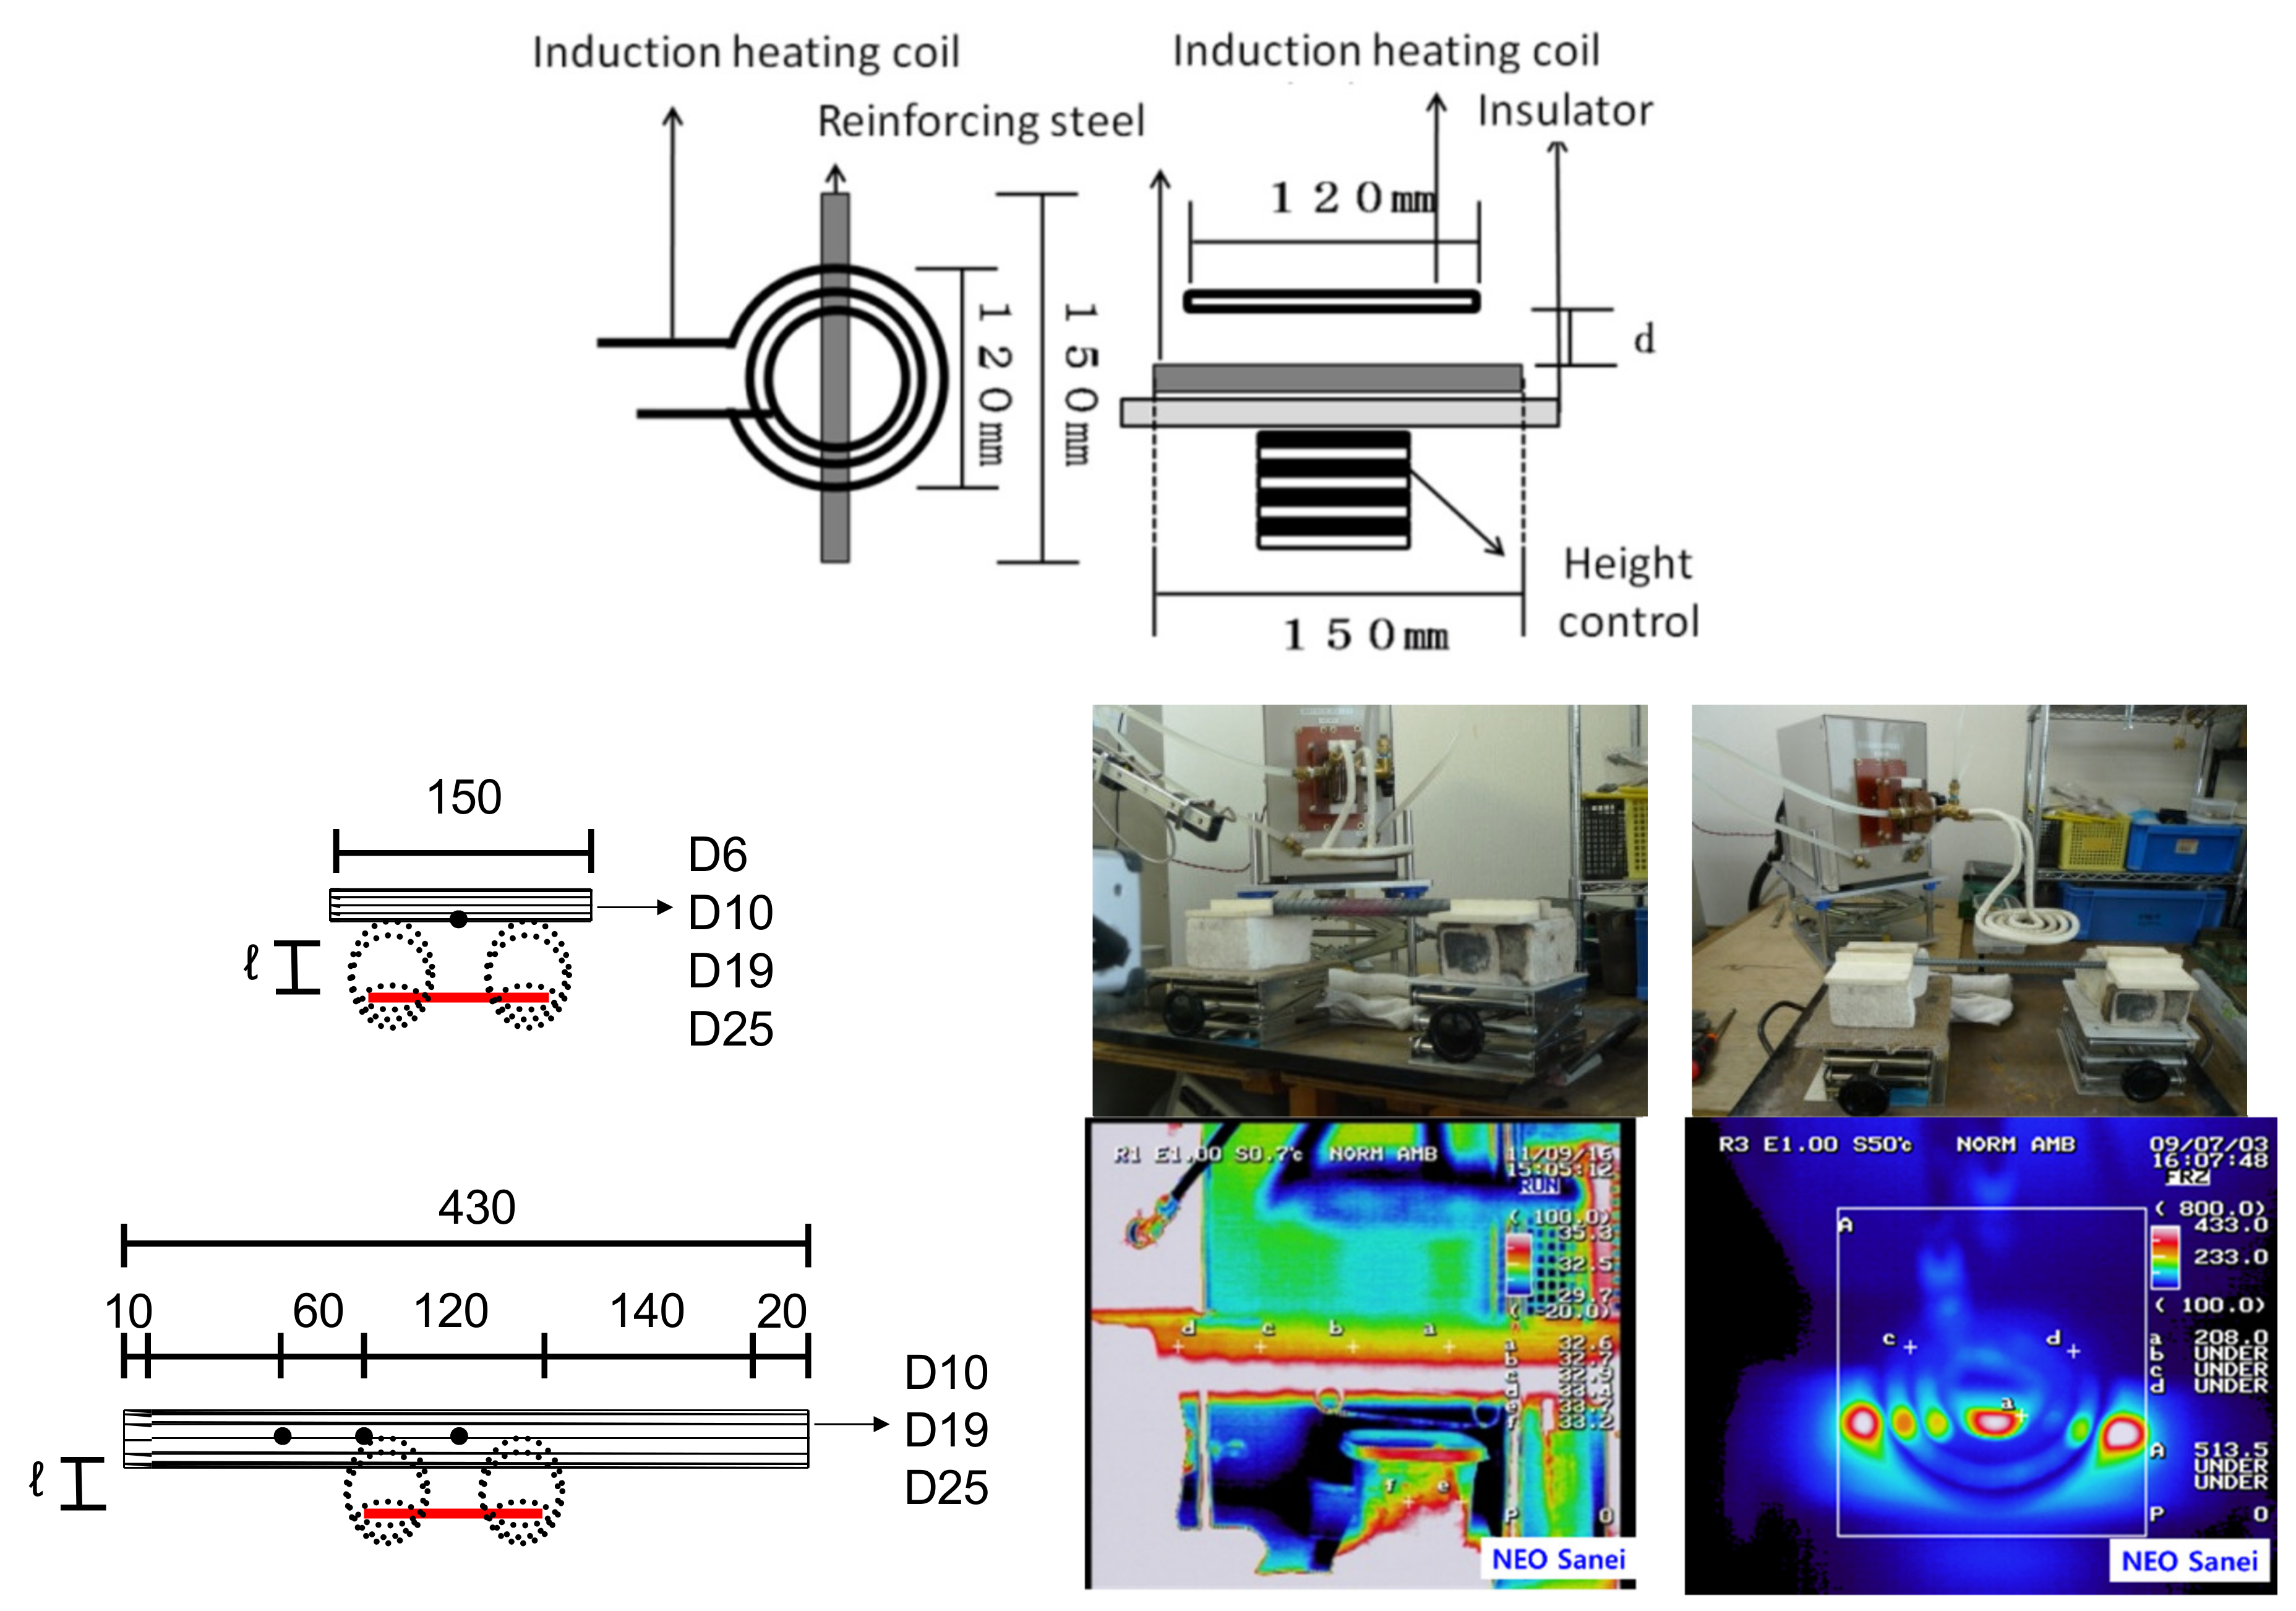
3.1.2. Experimental Methodology

(1) Induction heating
For induction heating, an experimental device with a basic frequency of 120 kHz (operating frequency of 60–120 kHz) and a maximum high-frequency output of 6 kW was used. The output stability was within ±2%, and the output was adjusted according to its relation with the DC voltage, as depicted in Figure 4 and Figure 5. However, in high-frequency induction heating, the operating frequency varies when the coil is changed because the heating coil and the object to be heated are considered as a circuit acoustic element. The high-frequency power supply adopts a system that automatically tracks the resonance frequency determined by the resonance capacitor inside the matching device, inductance of the output lead, and inductance of the heating coil. A 3-turn pancake-type heating coil with dimensions of ϕ120 and thickness ϕ10 was used.
(2) Reinforcing-bar heating experiment.
In the case of a single reinforcement heating experiment, the reinforcing bars D6, D10, D19, D25, and D32 of SD345 were cut to 150 mm and heated to confirm the proper output and temperature distribution of the reinforcing bars during heating. The distance from the surface of the output reinforcing bars, with a maximum output of 5 and 6 kW, to the induction coil surface, was varied, and the temperature of the center point of the upper part of the surface of the reinforcing bar was measured experimentally.
Additionally, for placement in a reinforced concrete laboratory, according to the size of the laboratory, the reinforcing bars of each academic field were cut to 430 mm, and the same experiment as described above was conducted. Using a thermal resistance camera, the center of the surface of the reinforcing steel, which is worthy of the direct coil system, and the direct coil system were used. We measured the temperature in the region 30 mm from the heating coil. Illustration of the heating experiment method for a single reinforcement is presented in Figure 6.

3.1.3. Experimental Results and Investigation

Temperature-rise characteristics of a single reinforcement by high-frequency induction heating
(1) Rising temperature characteristics
Figure 7 depicts the results of the temperature-rise characteristics (150 mm length) of the reinforcing steel by induction heating in the order of 5 kW and 6 kW. As depicted in the figure, the results for 5 and 6 kW showed no significant difference. However, temperatures above 800 °C could not be measured and were considered 800 °C.
With respect to time and temperature, if the distance from the heating coil to the surface of the reinforcing steel was 10, 20, or 30 mm, the target temperature reached 300 °C within 60 s. The smaller this distance, the faster the increase in temperature, and the faster the temperature increased to over 600 °C. In the case of distances of 10 and 20 mm, a state of thermal equilibrium was attained between 600 and 800 °C, and in the case of a distance of 30 mm, a state of thermal equilibrium was attained between 500 and 700 °C. However, in the case of a 50 mm distance, it took more than 300 s to reach 300 °C. Consequently, the closer the coil was to the reinforcement, the more rapidly the temperature rose in a short time immediately after heating, after which the temperature remained almost constant. In contrast, when the coil was far away from the reinforcement, the temperature increased gradually. Therefore, when heating bars with a maximum output of 6 kW, considering the dismantling performance and energy effect, a distance of 30 mm or less with a steep gradient was considered appropriate.
In the case of D6, D10, D19, and D25, the temperature-rising characteristics of each reinforcing bar exhibited rapid temperature-rise characteristics; however, in the case of D32, the temperature rising characteristics tended to decrease in comparison with those of other types of reinforcing bars. This may be attributed to the fact that in the case of induction heating, the surface of the reinforcing bar is heated rapidly, whereas in the case of a reinforcing bar with a thick diameter, the duration of molecular motion in the reinforcing bar until no difference is observed in the temperature due to surface heating is long.
The results of heating reinforcing bars with a length of 430 mm using a high-frequency induction heating system are classified into those with an output of 5 kW and 10 kW, as depicted in Figure 8. As mentioned above, a temperature of 800 °C or higher could not be measured; thus, the temperature was determined to be 800 °C. When the reinforcing bars with an output of 5 kW were heated, they exhibited a temperature-rise characteristic similar to that of the 150 mm long reinforcing steel. Moreover, because there was little heat conduction loss due to the length of the reinforcing steel, it was possible to selectively heat the bars based on their position.
In addition, it was confirmed that there was no significant difference between the experimental results of the bars with outputs of 5 and 6 kW, whereas in the case of the bars with outputs of 5 and 10 kW, a significant difference was observed in the temperature-rise characteristics. When the heating distance was 10 mm shorter for the 10 kW output bars, the measurement could not be performed at temperatures higher than 800 °C within 30 s. Even when the heating distance was 30 or 40 mm, the temperature reached the target within 30 s and increased to over 600 °C within 90 s. In the case of a 5 kW output, the target temperature was reached within 90 s even at a distance of 50 mm, exhibiting the worst heating efficiency, and the maximum temperature was recorded at 500–600 °C. As previously explained, if the output is higher than a certain amount, the penetration depth is increased by the output. If the electric field is higher than the Curie temperature, the relative permeability drops to 1, and if the electric field reaches the critical temperature.
(2) Temperature-distribution characteristics
Excessive heating, insufficient heating, and unevenness in the temperature rise during the heating process of reinforcing steel using an induction heater can increase concrete fragility. Using the infrared radiation temperature measurement method, the temperature distribution at the time of temperature rise in the reinforcement bar was analyzed under induction heating conditions of 5 kW and 6 kW. The results, including the highest temperature increase rate, are shown in Figure 9. The horizontal axis of the figure is 150 mm, which is the length of the specimen; however, there may be some errors in the region due to radiation heat. The x-axis of Figure 9 is 160 ± 5 mm on average, and an error of 10 ± 5 mm due to radiant heat is considered to have no significant effect on the measurement of the central and end heating phenomena. In most of the test specimens, the central part was heated more intensively than the end. Reinforcing bars at parts outside the heating coil with a diameter of 120 mm exhibited a temperature of 150–450 °C, and it was necessary to consider the temperature deviation in subsequent heating conditions.
In the case of a 5 kW output for the 430 mm specimen reinforcement heating experiment, the diameter of the heating coil was 120 mm. Therefore, the points were measured at a distance of 30 mm in the reinforcement length direction based on the direct light center of the coil, and the results are shown in Figure 10. The 430 mm specimen at 10 kW output was tested in the same way, and the results are shown in Figure 11. The temperature difference between the inside and outside of the coil diameter was not significant; however, the temperature difference between the outside 30 mm and 100 °C was removed from the magnetic field area from the outside 60 mm.
In the case of an output of 10 kW, the surface of the reinforcing bar closer to the outer boundary than the center point at the internal point of the coil diameter was heated first, and after a lapse of time, the temperature of the center point increased. This was considered to occur because the eddy current was drawn internally from the heating coil to the surface of the reinforcing bar, and then, heating direction was reversed owing to the highest current density at the internal center point. However, in the case of 5 kW, i.e., a small output, heat was applied to the surface of the reinforcing steel at the same time as heat generation. As the time difference between the heat generation and temperature rise was short, there was almost no temperature deviation.
The red heat phenomenon on the surface of reinforcing steel is usually observed between 400 and 500 °C. This phenomenon occurred only directly inside the heating coil and not due to heat conduction; therefore, it clearly showed the local heating phenomenon due to selective heating.

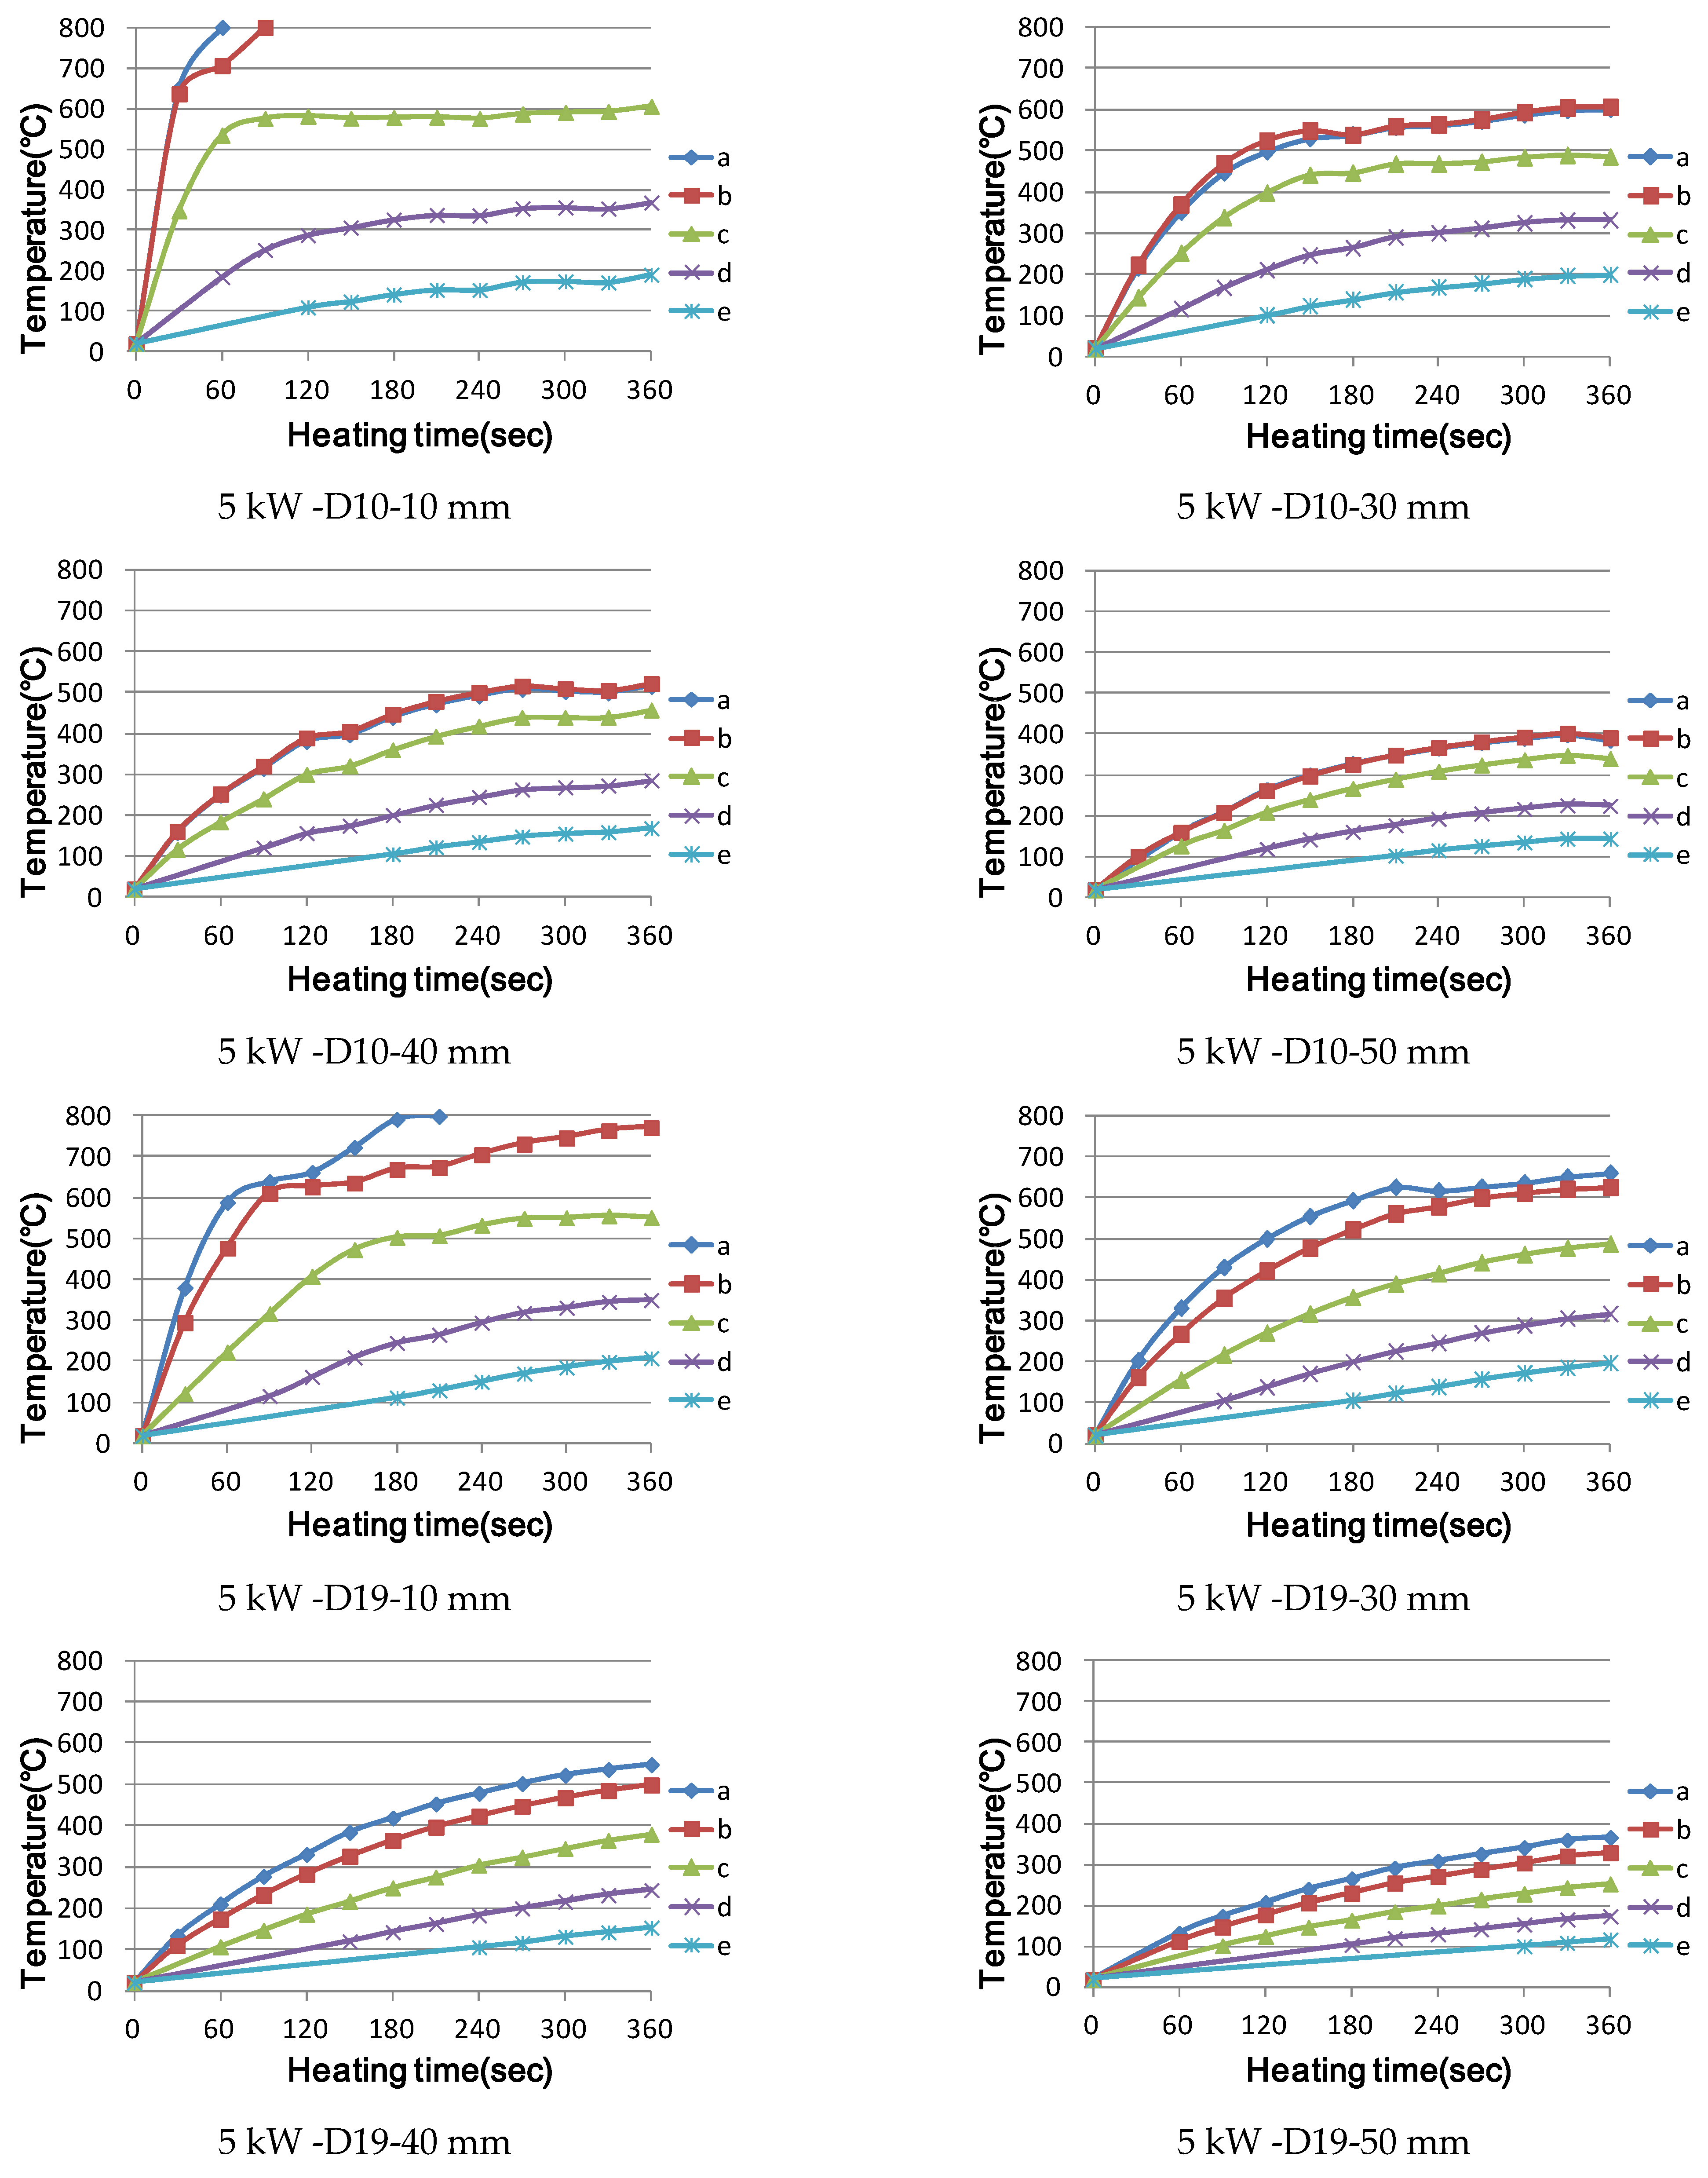
3.2. Temperature Characteristics of a Cross-Bar during Induction Heating

3.2.1. Experimental Methodology

In the case of the cross-reinforcing steel heating experiment, rebars D10, D19, D25, and D32 of SD345 were used to check the proper power output and temperature distribution of the rebar by heating. To conduct the experiment under the same conditions as the reinforced concrete members, they were cut into lengths of 355 mm. We also assumed that D19, D25, and D32 reinforcing bars were the main muscles and experimented with D10 reinforcing bars on the main muscles with back muscles on the lower part and back muscles in the direction of crossing. The temperature characteristics were evaluated according to type and distance by placing heating coils at the intersection of the reinforcing bars to select the optimum heating coil position. Temperature measurements were made using the same thermal resistance camera as that in the previous single reinforcing bar heating experiment, measuring five locations at intervals of 30 mm from the center of the upper and lower reinforcing bars. In this section, the surface temperature of a total of 10 reinforcing bars was measured, and the temperature rise and temperature distribution characteristics were comprehensively evaluated; the results are shown. Figure 12 shows the heating experiment method for crossed reinforcing bars.

3.2.2. Experimental Results and Investigation

(1) Frequency—5 kW output (center heating)
The high-frequency output of 5 kW (shown in Figure 13) showed the same variation tendency as that of a single reinforcement, and the initial temperature-rise curve showed a steep gradient; however, compared to a single reinforcement, the thermal equilibrium was reached quickly with a temperature reduction of up to 100 °C. The temperature difference between the upper and lower reinforcing bars was not significant when the heating distance was large; however, the temperature difference between the upper and lower reinforcing bars was 80–180 °C at a heating distance of 40 mm or more. If the distance increases, a magnetic field is formed around the upper reinforcing bar before reaching the lower reinforcing bar, and the lower reinforcing bar is heated only via conduction.
As mentioned above, if the heating distance is short, a magnetic field is formed on the lower reinforcing bar, and the surface area of the reinforcing bar is removed from the magnetic field area, and most of the reinforcing bar is heated via conduction.
The temperature distribution was similar for single reinforcing bars; however, for the upper reinforcing bars, the temperature difference between the reinforcing bars inside the diameter and those outside the rectilinear longitude varied from 50 to 200 °C for a heating distance of 10–30 mm. This is a result of a clear difference in temperature between the heat-generating part and the conducting part in the magnetic field area in the upper part. In the case of the lower part, it seems that the range of temperature rise due to conduction was larger than the phenomenon of heat generation itself.
(2) Frequency—5 kW output (side heating)
In the case of conductive resistors, it is important to select a heating position because the heat transfer rate shows a sharp difference depending on the position and distance of the reinforcing bar applied to the heating coil as shown in Figure 14. In this experiment, it was not an intersection of the reinforcing bars. Reinforcing bars were placed in the center of the well-shaped reinforcing bars, and the temperature rise and temperature distribution characteristics based on the diameter and distance of the reinforcing bars used were examined. Figure 15 shows the temperature characteristics.
In the case of temperature-rise characteristics, the center of the well-shaped reinforcement showed a difference of up to 100 °C when a heating coil was placed at the intersection. When the heating coil was positioned and heated, only one of the three upper and lower reinforcing bars was heated; as the reinforcement bar moved farther away from the heating coil, only the upper reinforcing bars were heated, and only the lower reinforcing bars were heated by heat conduction. When the heating coil was located in the center of the well-shaped reinforcing bar, the temperature increase rate showed the same tendency; however, the heating efficiency showed a slight decrease. In contrast, in the area to be heated, the upper two reinforcing bars and the strain two reinforcing bars applied to the coil were simultaneously heated to increase the width of the heating range.
This may have been due to the coupling efficiencies of the reinforcing bars and heating coils. As expressed in Equations (8) and (9) the heating coil is basically a resistor (inductance); it generates heat based on the surface area (current flowing through the coil × diameter).
The magnetic force is proportional to half of the square of the distance, while the strength of the magnetic force is proportional to the current generated in the coil and the coil differential (relative change between the two coils). Therefore, if the coupling efficiency between the reinforcing bar and coil is poor, a large current flow. Furthermore, there are capacitors and transformers in the matching device (circuit), which act as resistors.
F = G m 1 m 2 r 2
Here, G = 6.672 × 10 11 m 3 / k g · s 2
m = mass
r = distance
F = magnetic force
magnetic   force   intensity   of   magnetic   field = A current × T coil   differential
As shown in Figure 14, the distance between the coils is the same, and the distance between the heating coil and the surface of the reinforcing bar is the same.
(3) Frequency—10 KW output
Using a maximum output of 10 kW, the crossed reinforcing bars were heated, and the results according to the reinforcing bar type and temperature characteristics are shown in Figure 16.
In the case of 10 kW, when the distance from the heating coil was close to 5 kW, the target temperature was reached in a shorter time than 5 kW, while showing a sudden temperature rise gradient. At a short distance of less than 10 mm, the temperature rose sharply and exceeded 800 °C within 20 s, making the temperature impossible to measure. In addition, as the output increased, it was confirmed that the heating range expanded, and a magnetic field was formed at 5 kW until the temperature exceeded the range of temperature rise, affecting the reinforcement surface up to 90 mm from the center.
In the case of the lower reinforcing bars, a heating distance of 30 mm or less was within the magnetic field formation range, and the heating distance of the reinforcing bar was 40 mm or more, which was higher than the heat conduction effect of the upper reinforcing bar.
This was determined to be the result of the increase in penetration depth due to the output structure, indicating the possibility of adjusting the range of magnetic field formation by structuring the output volume without consideration of the diameter of the coil.

4. Conclusions

In this study, we examined the characteristics of the temperature rise and temperature distribution of reinforcing steel surfaces based on the diameter, length, bar arrangement condition, heating distance, heating coil position, and output using SD345 reinforcing steel. Using maximum outputs of 5 kW, 6 kW, and 10 kW and induction heating, the following conclusions were obtained.
(1)
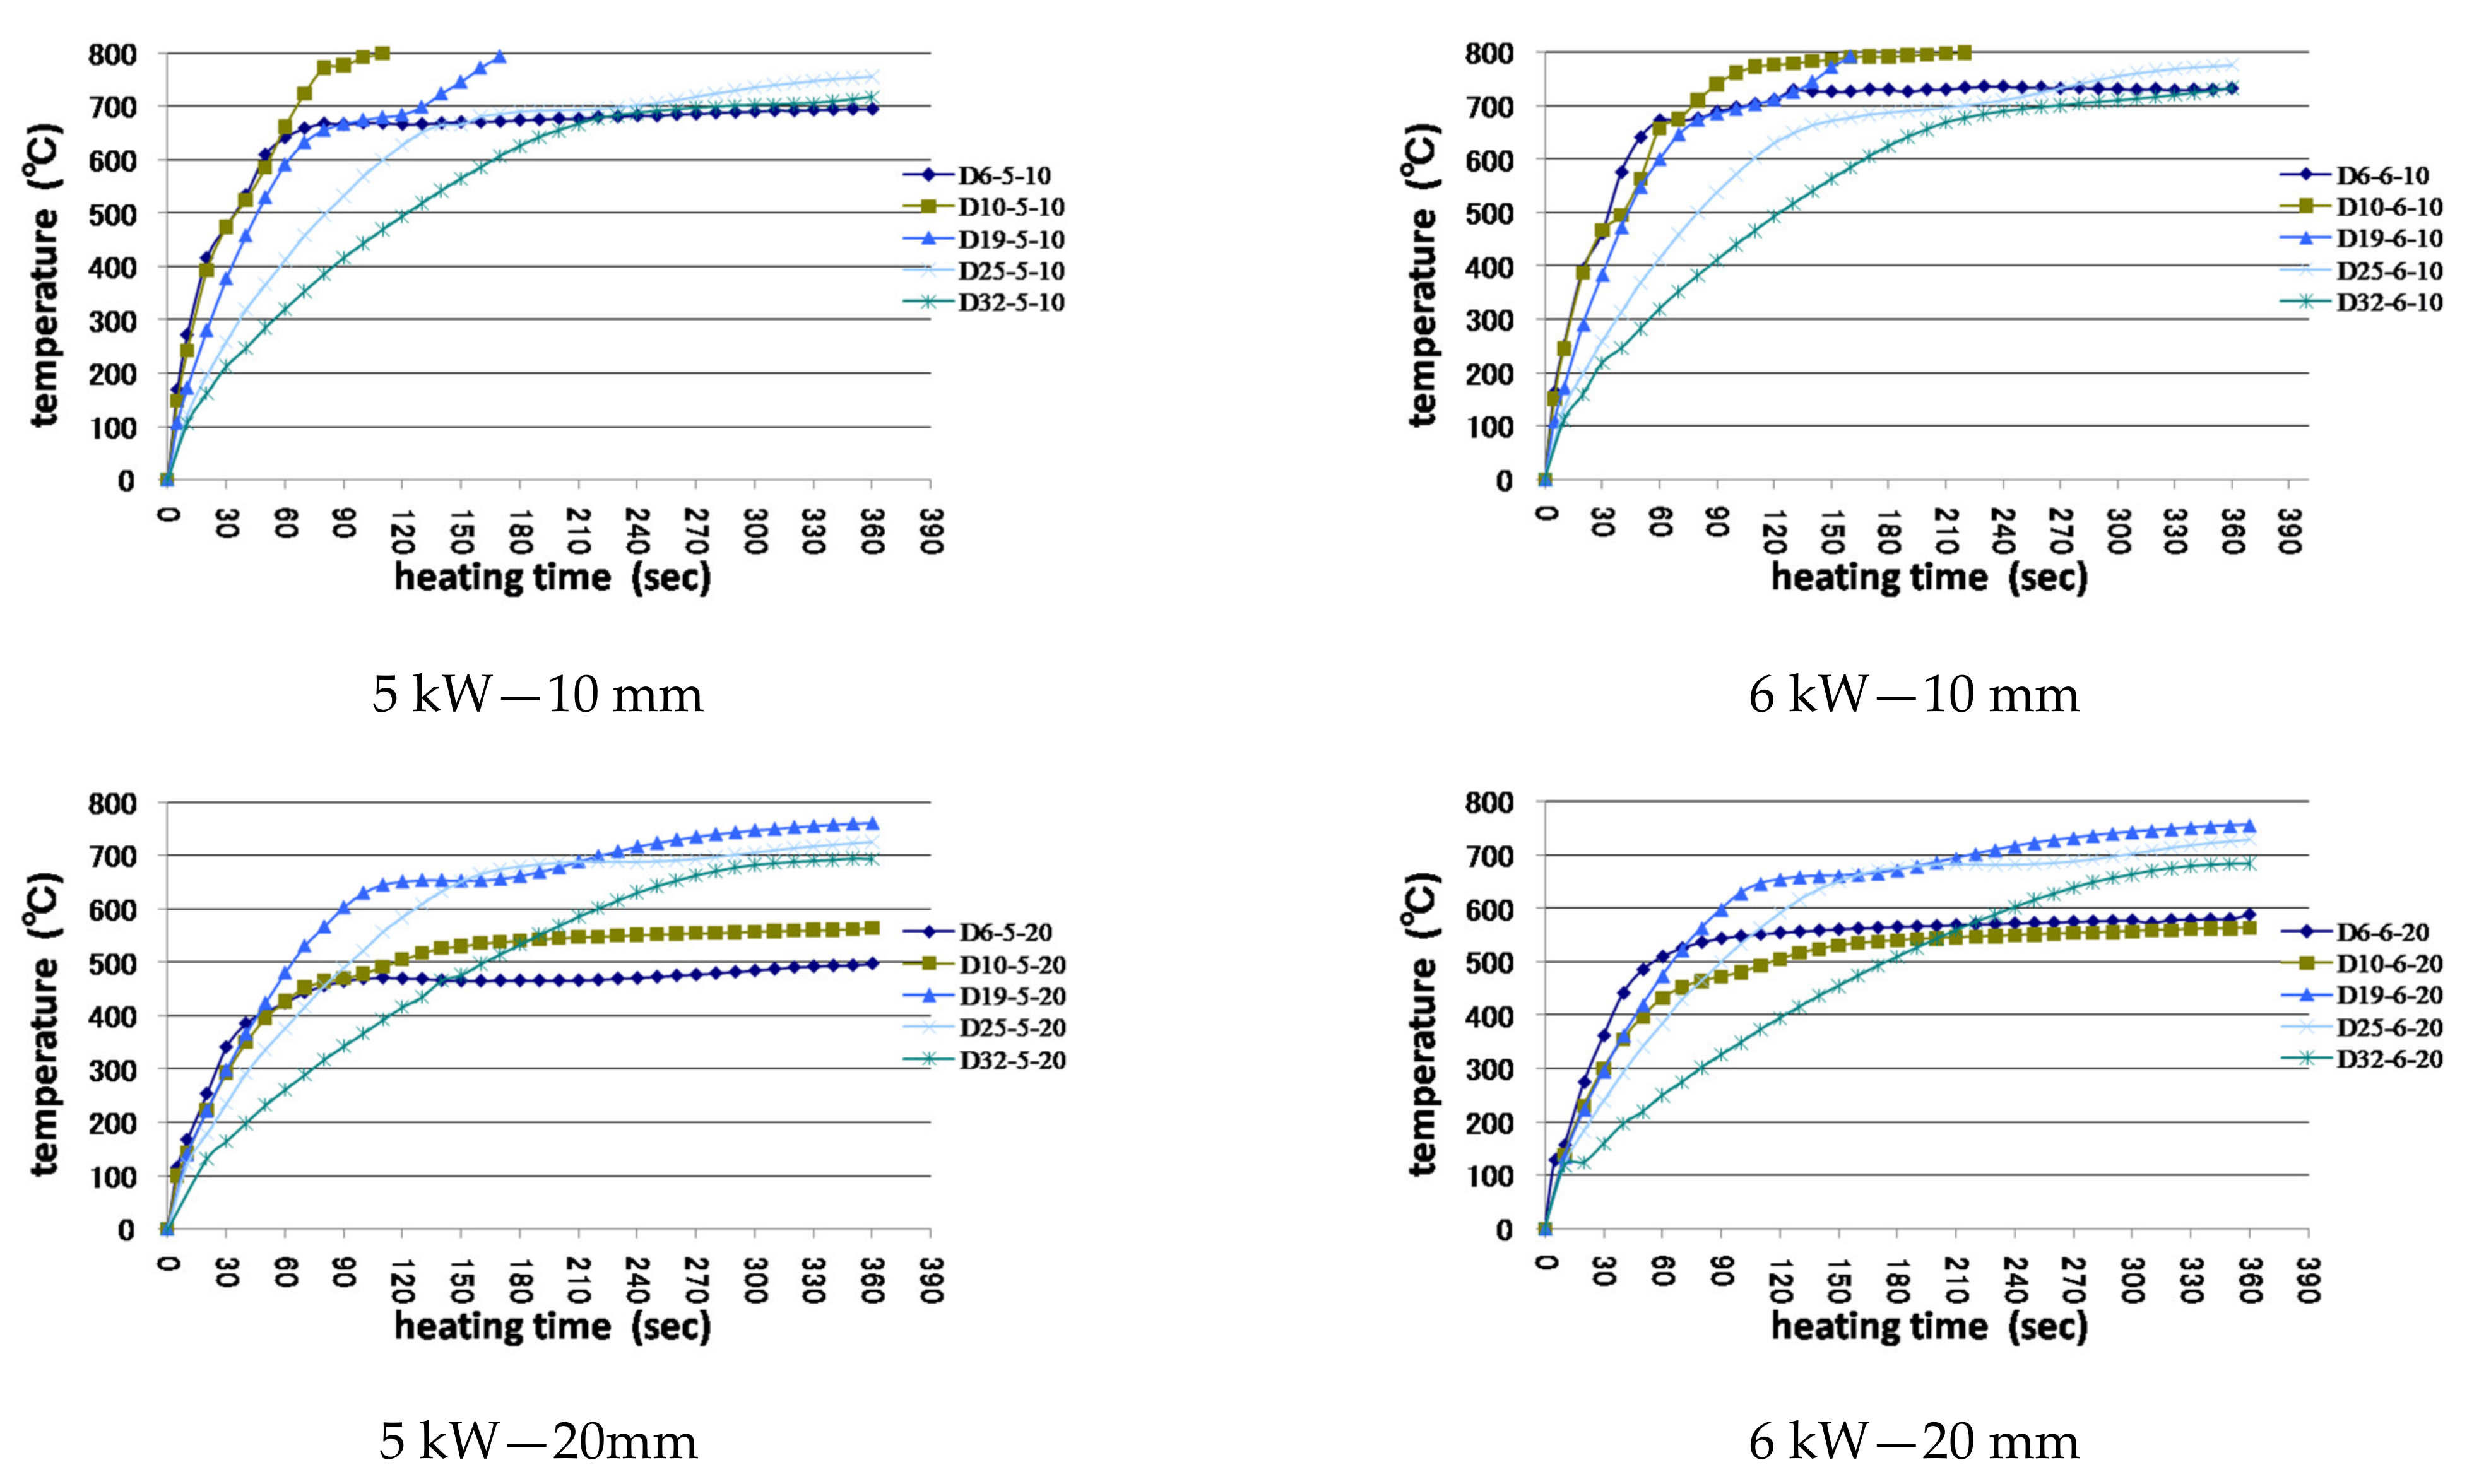
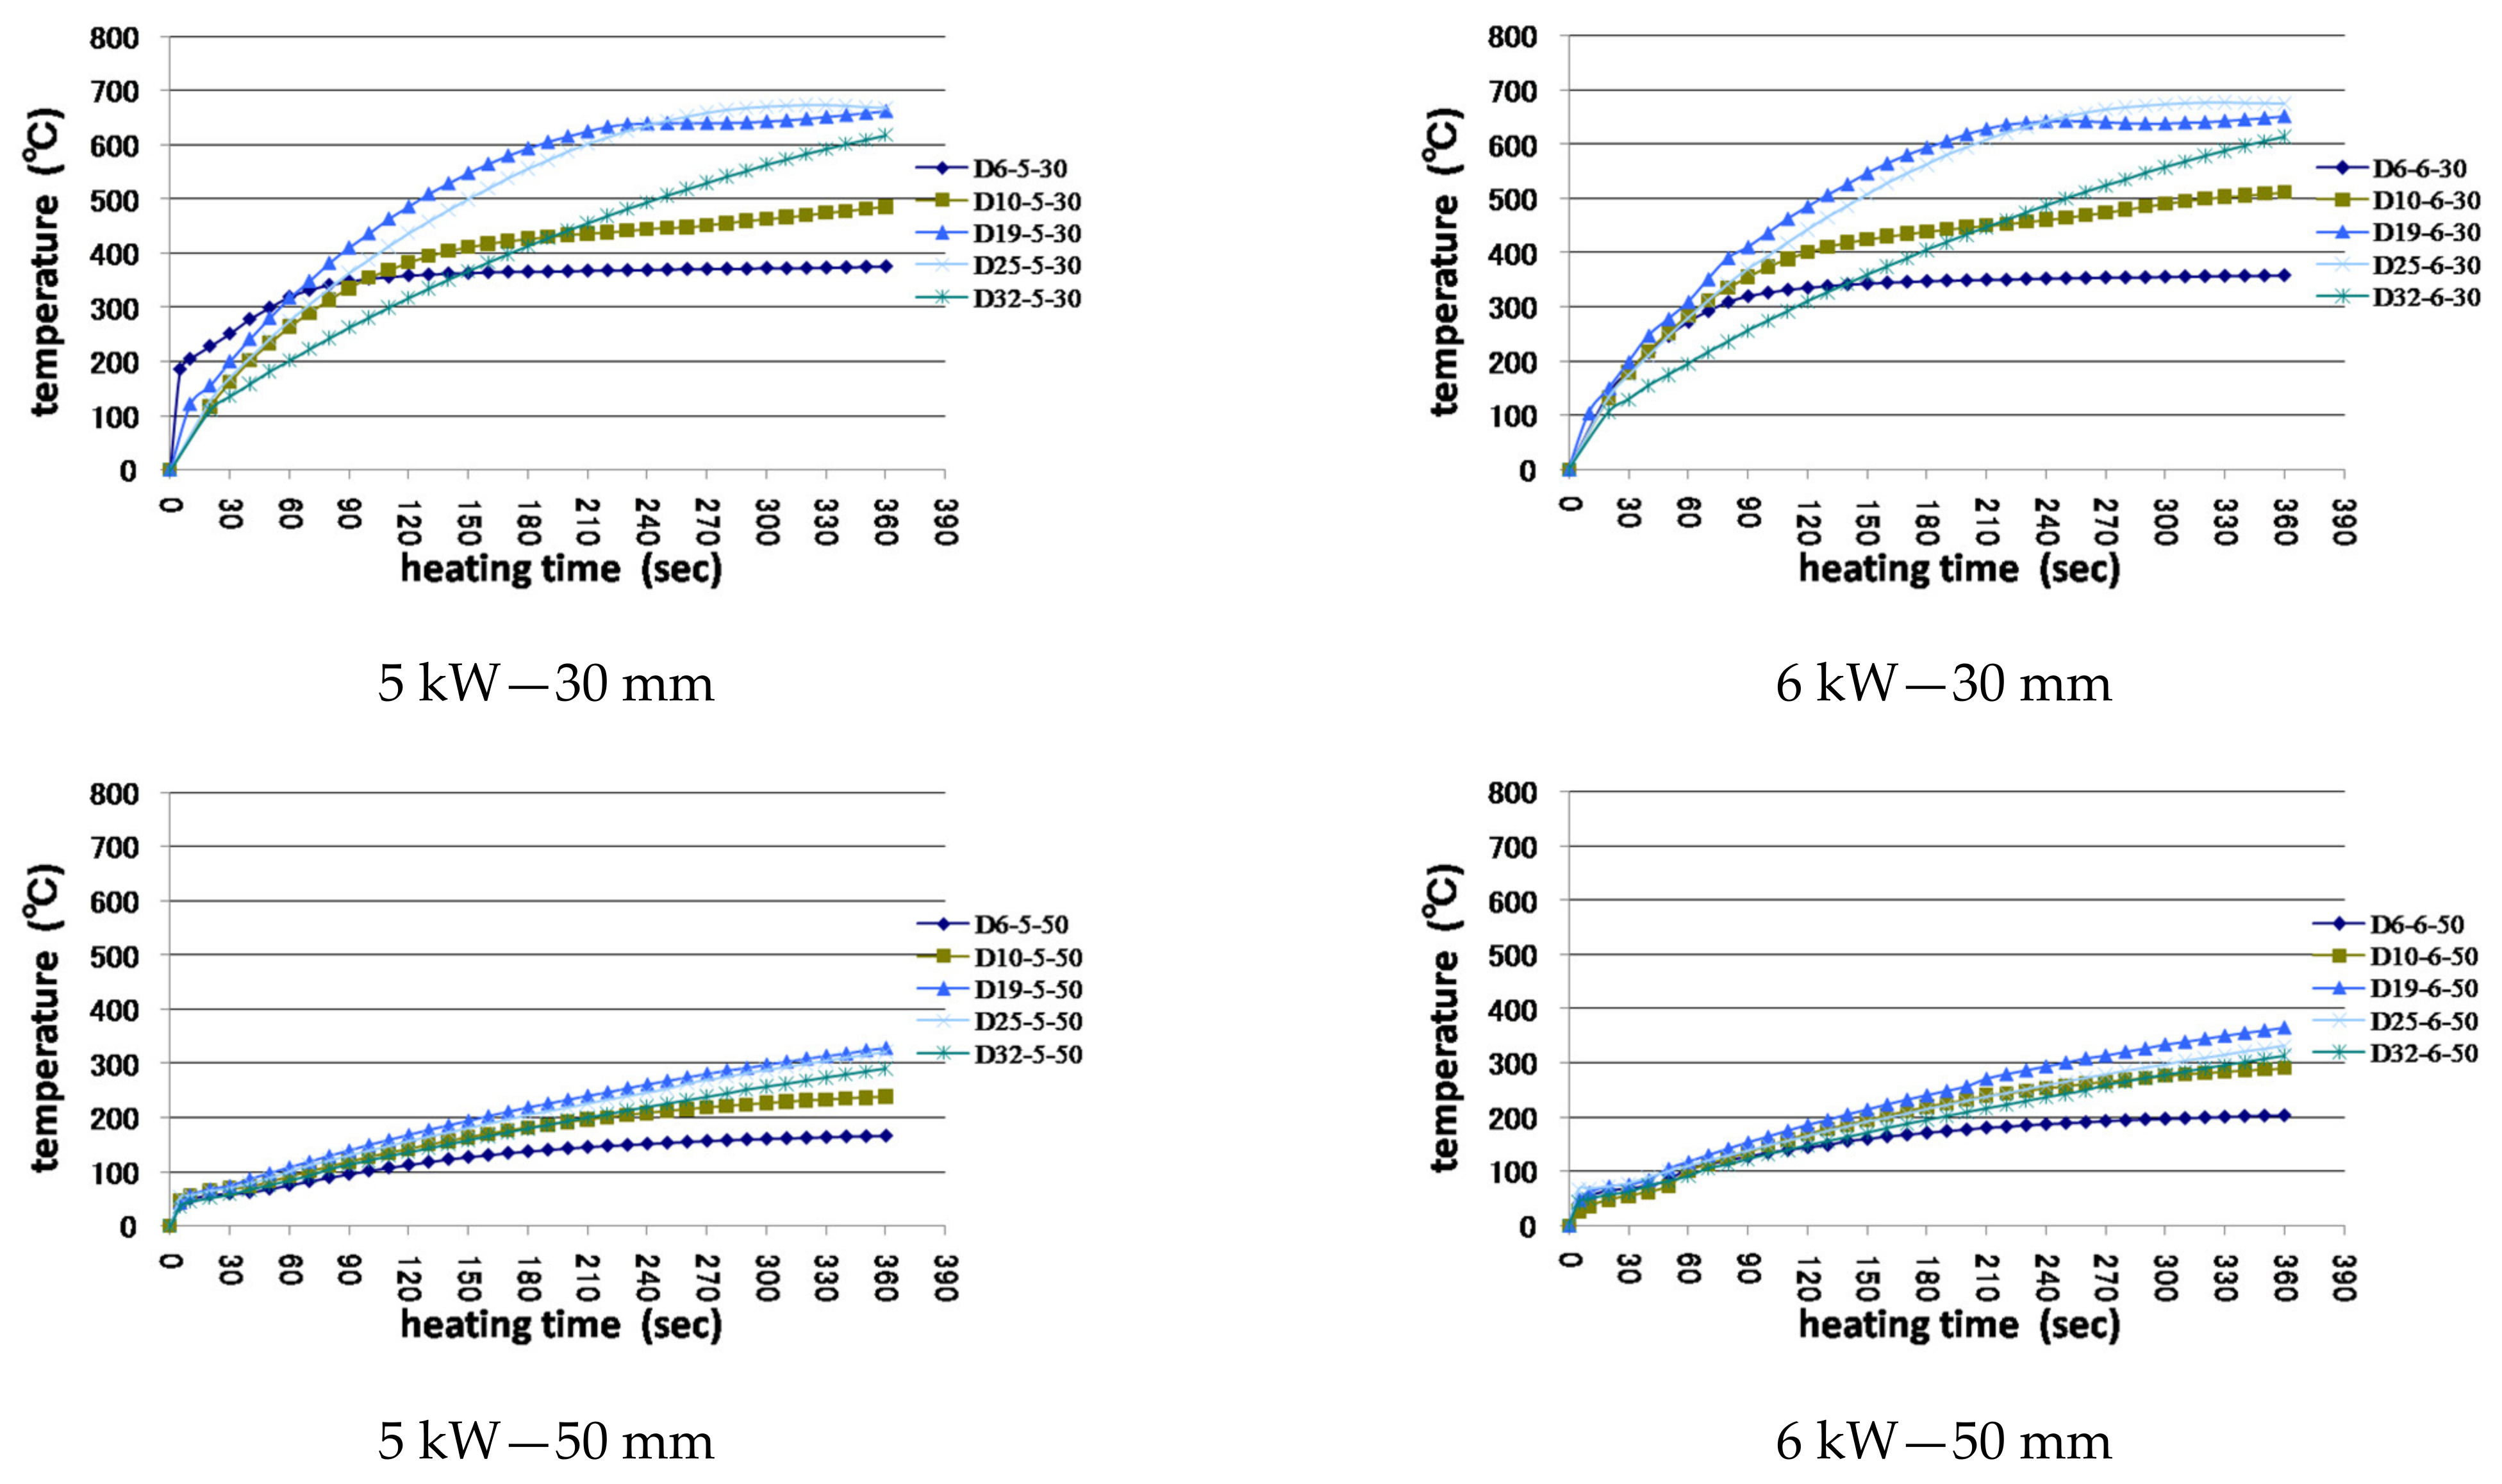
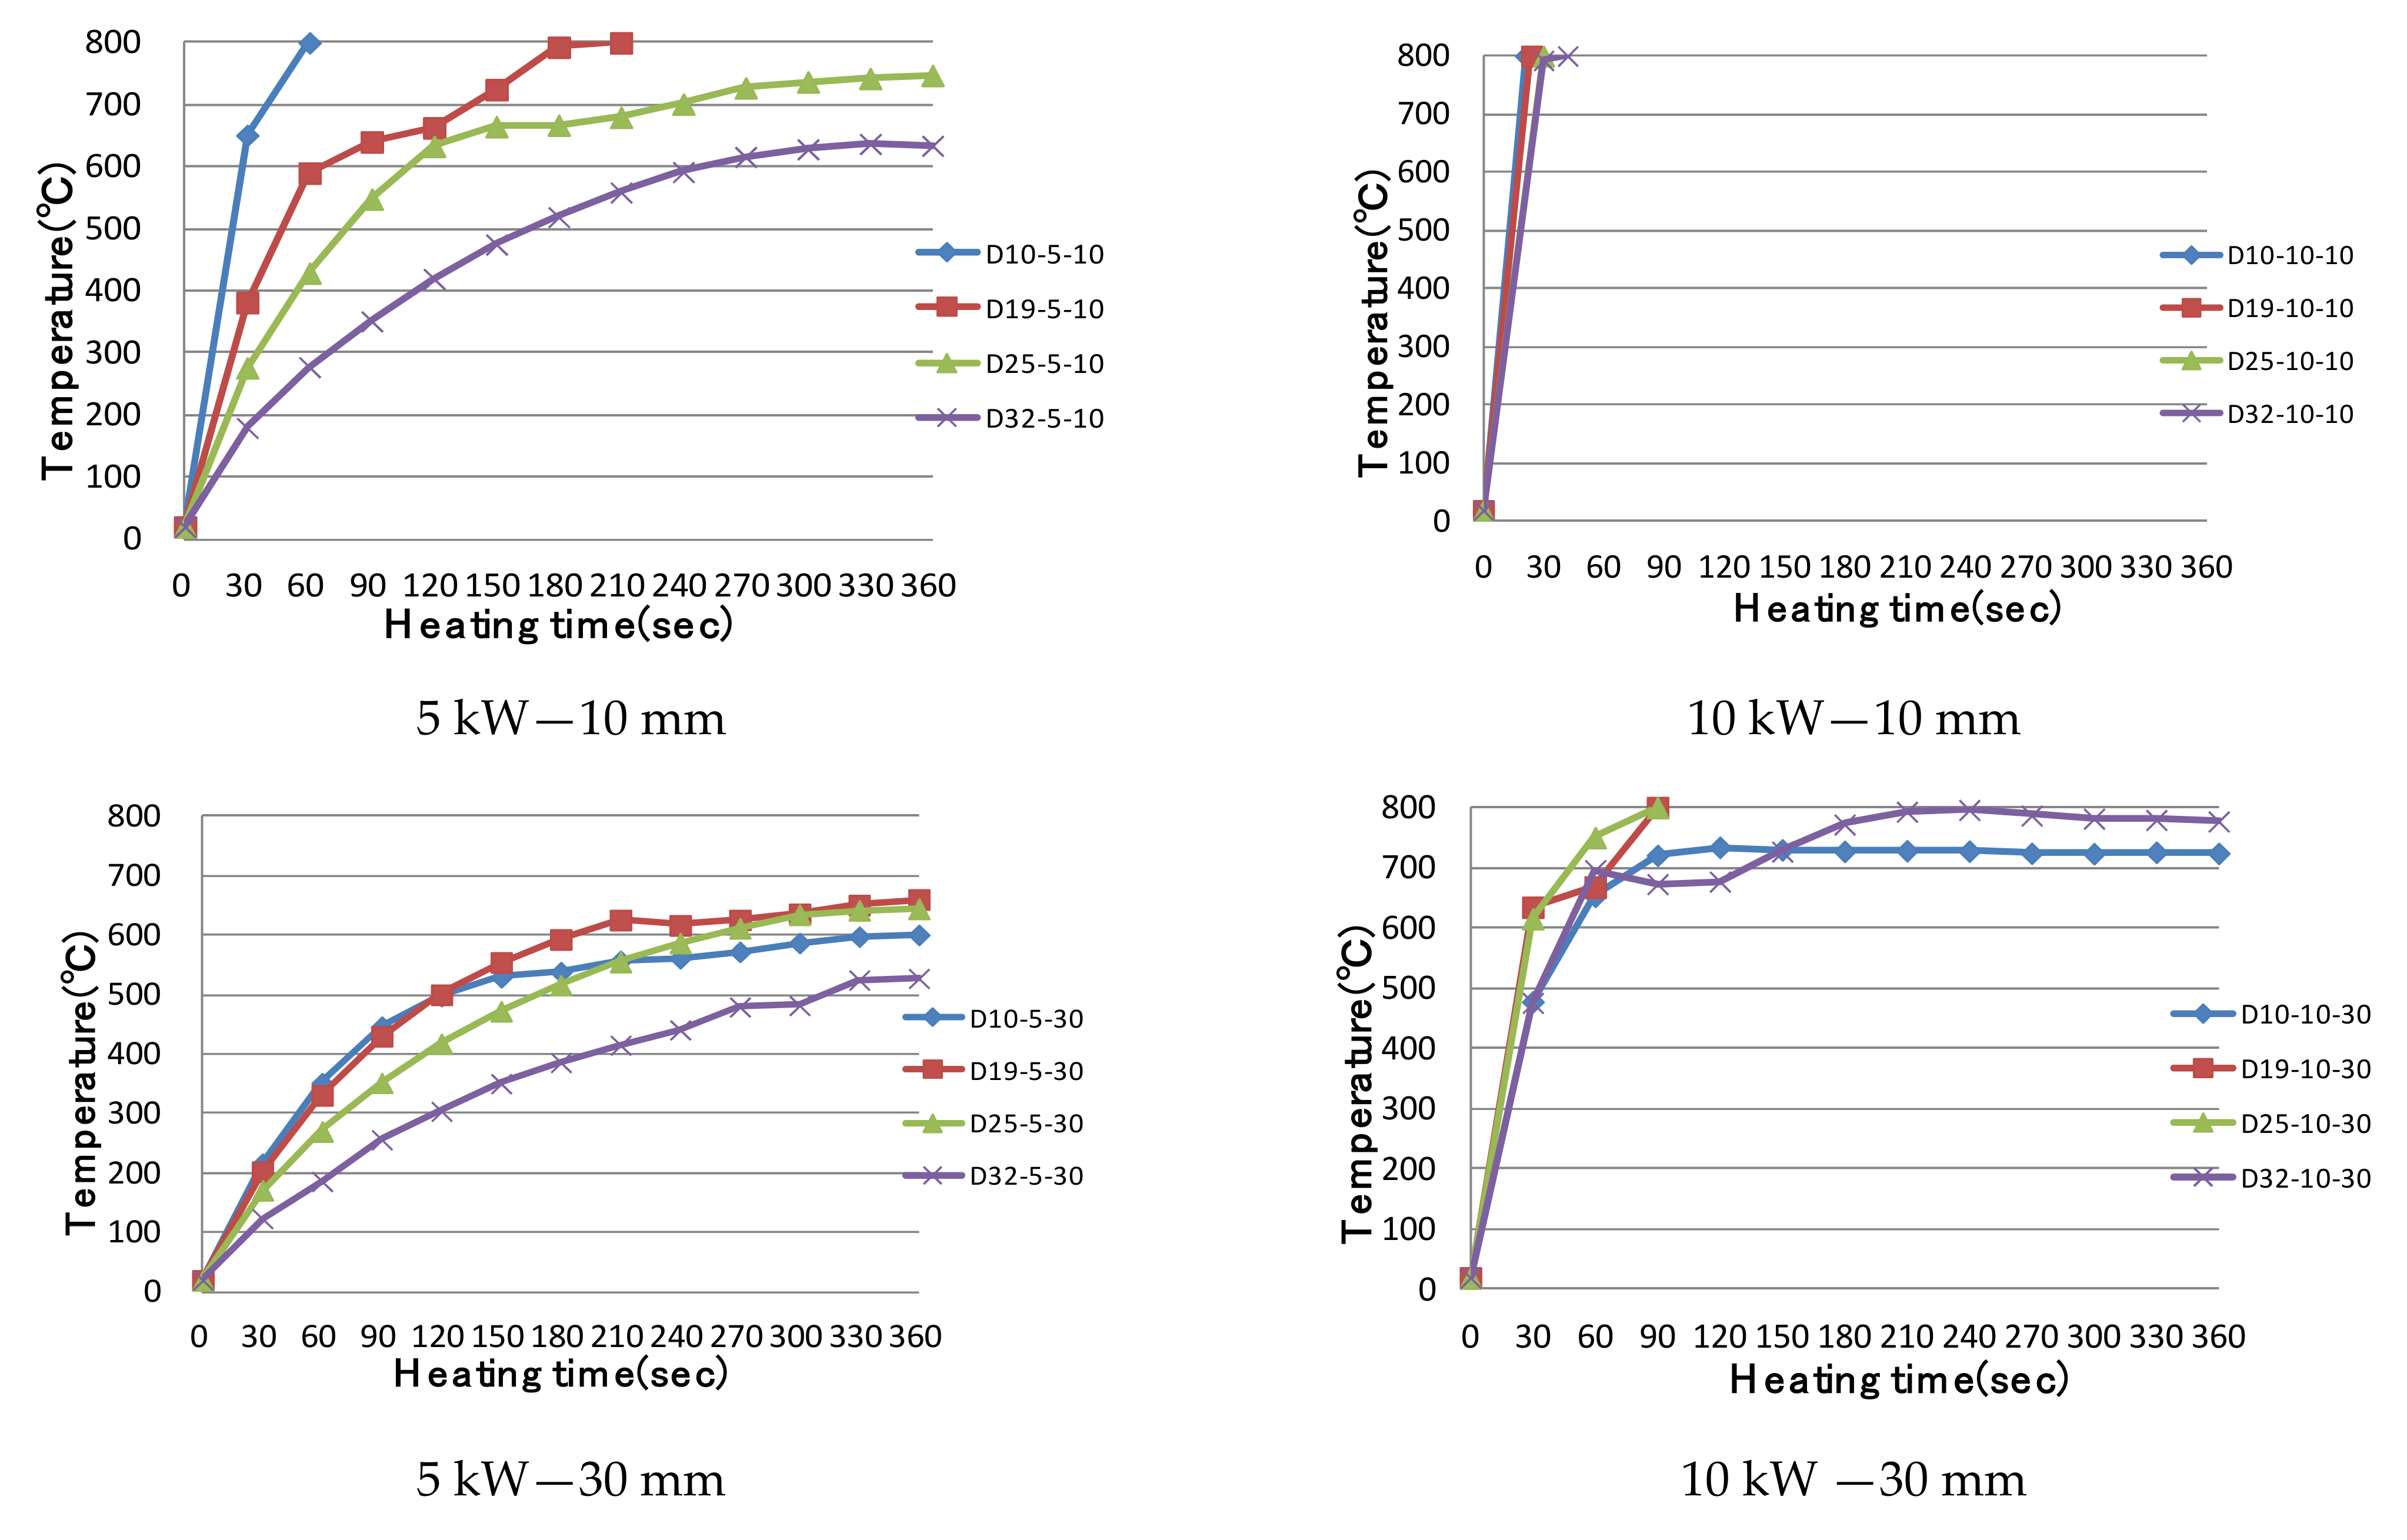
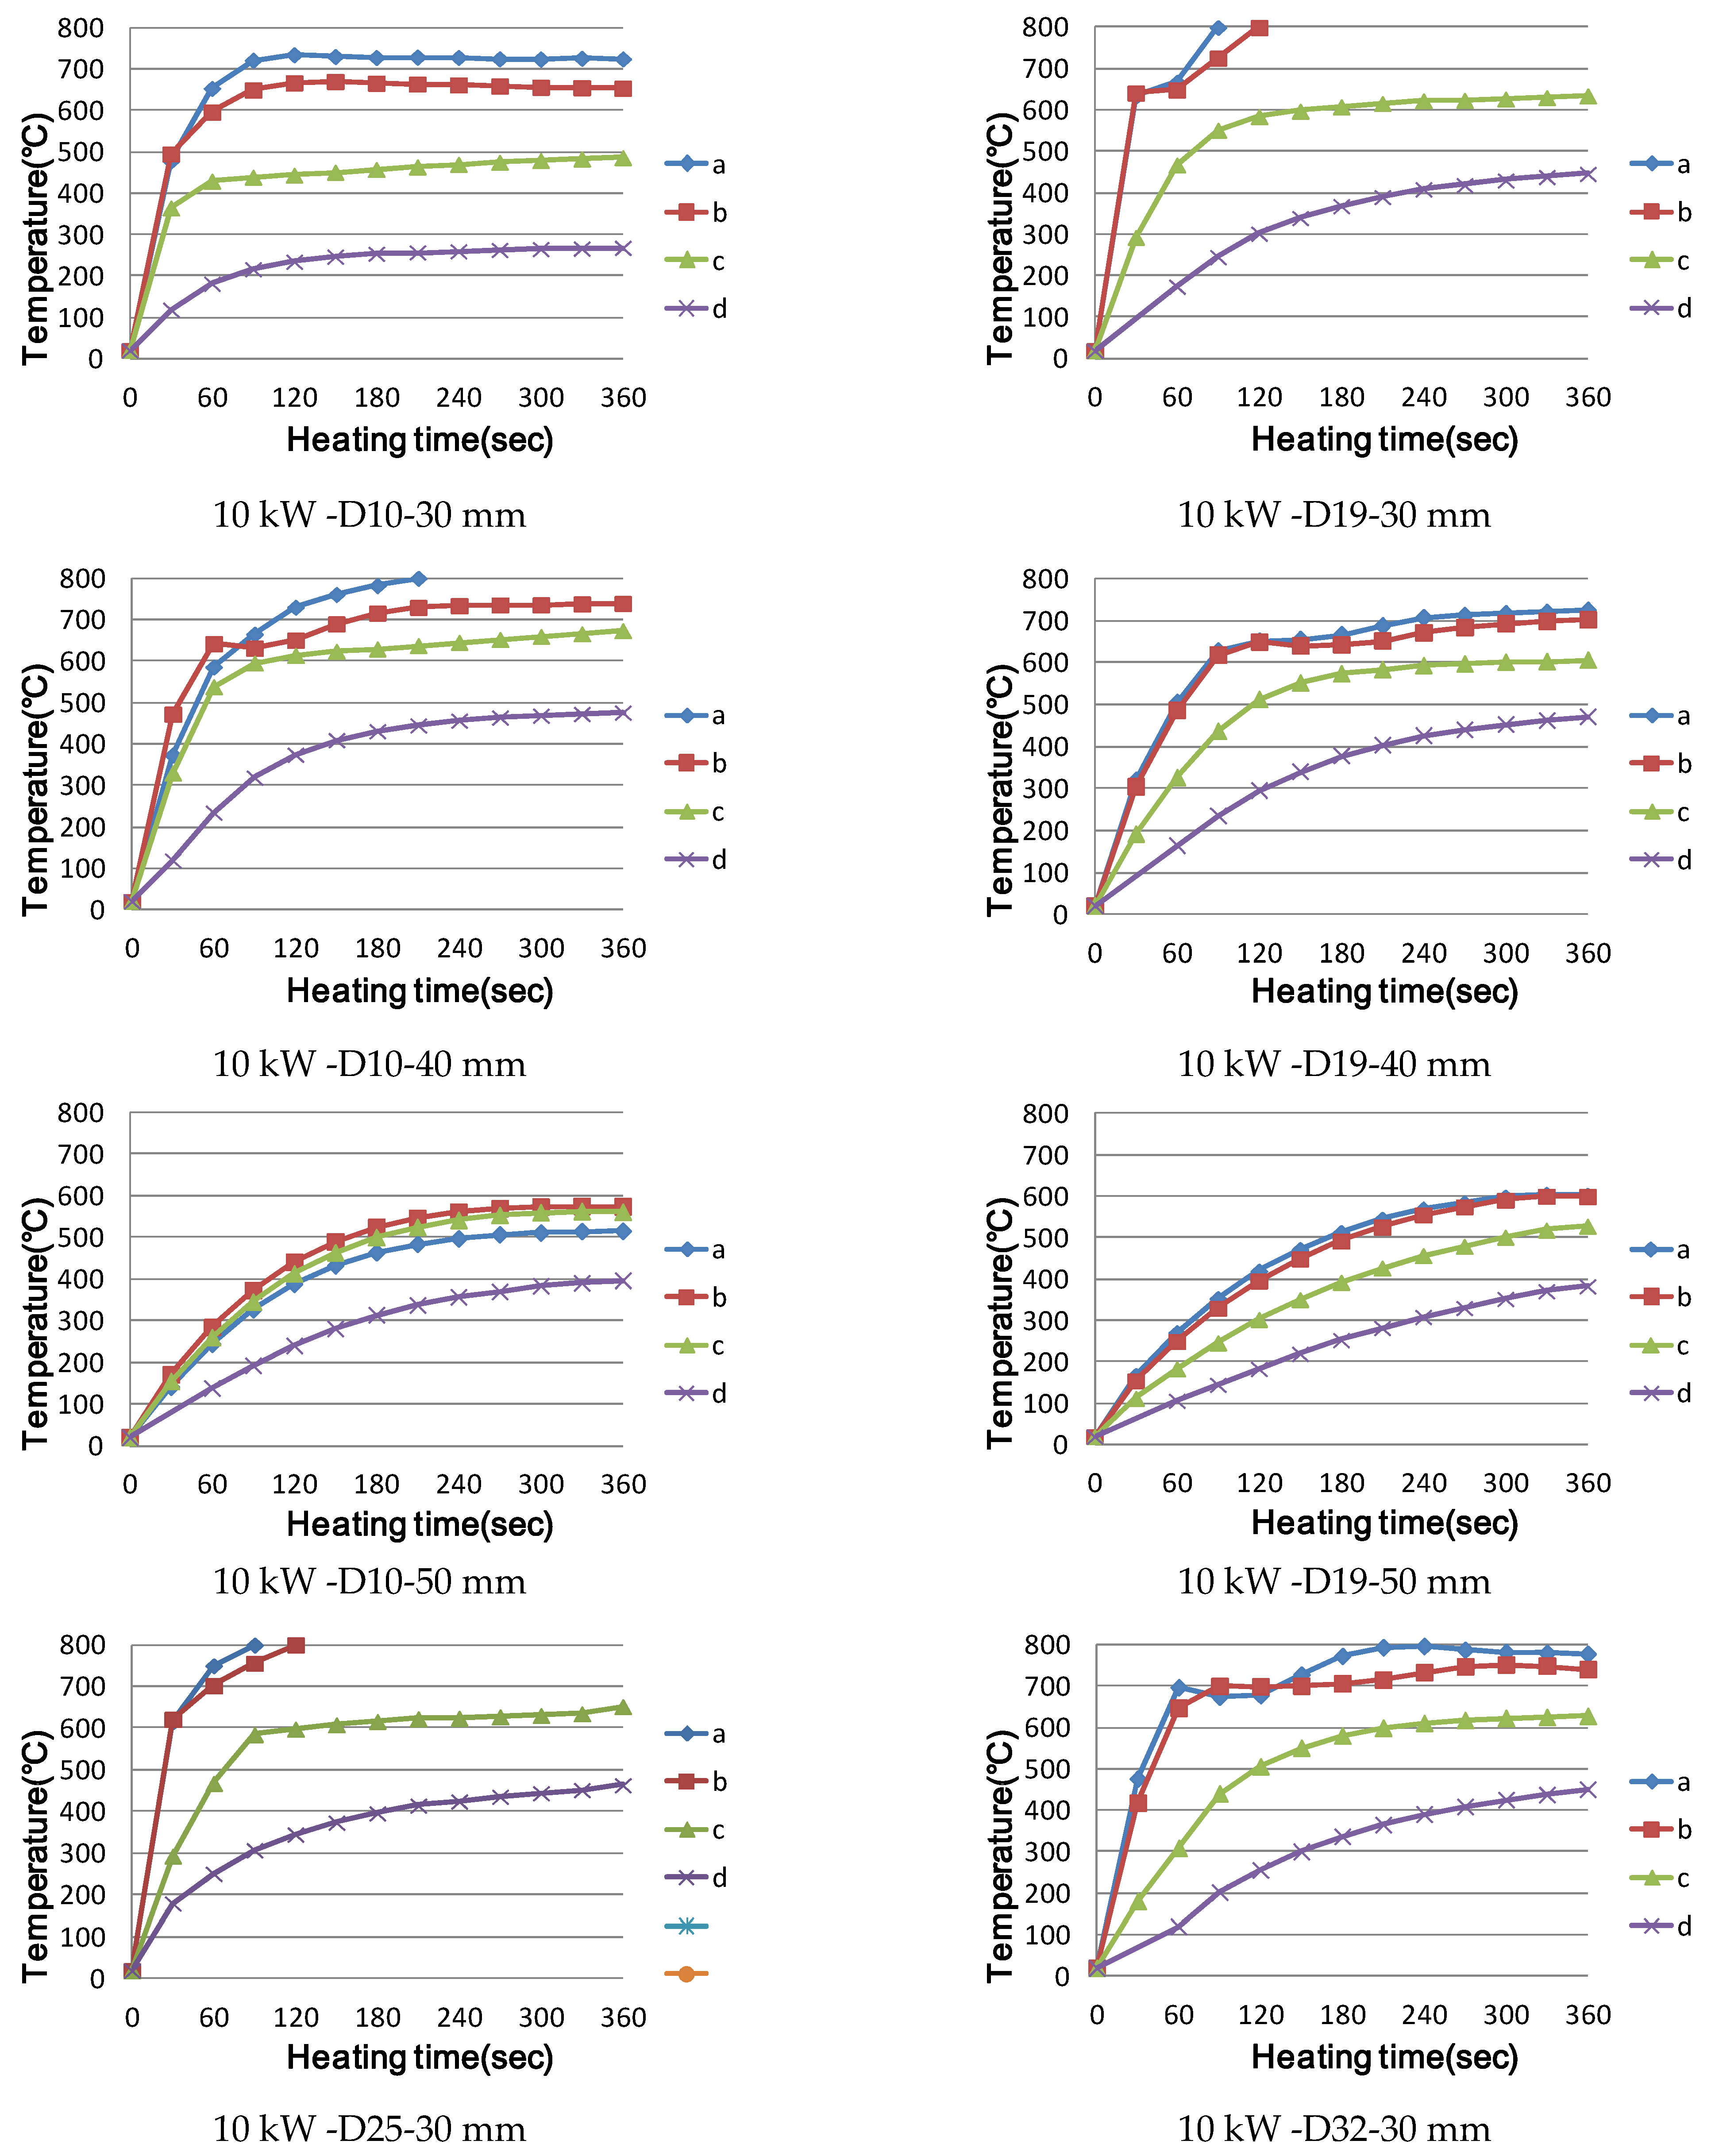
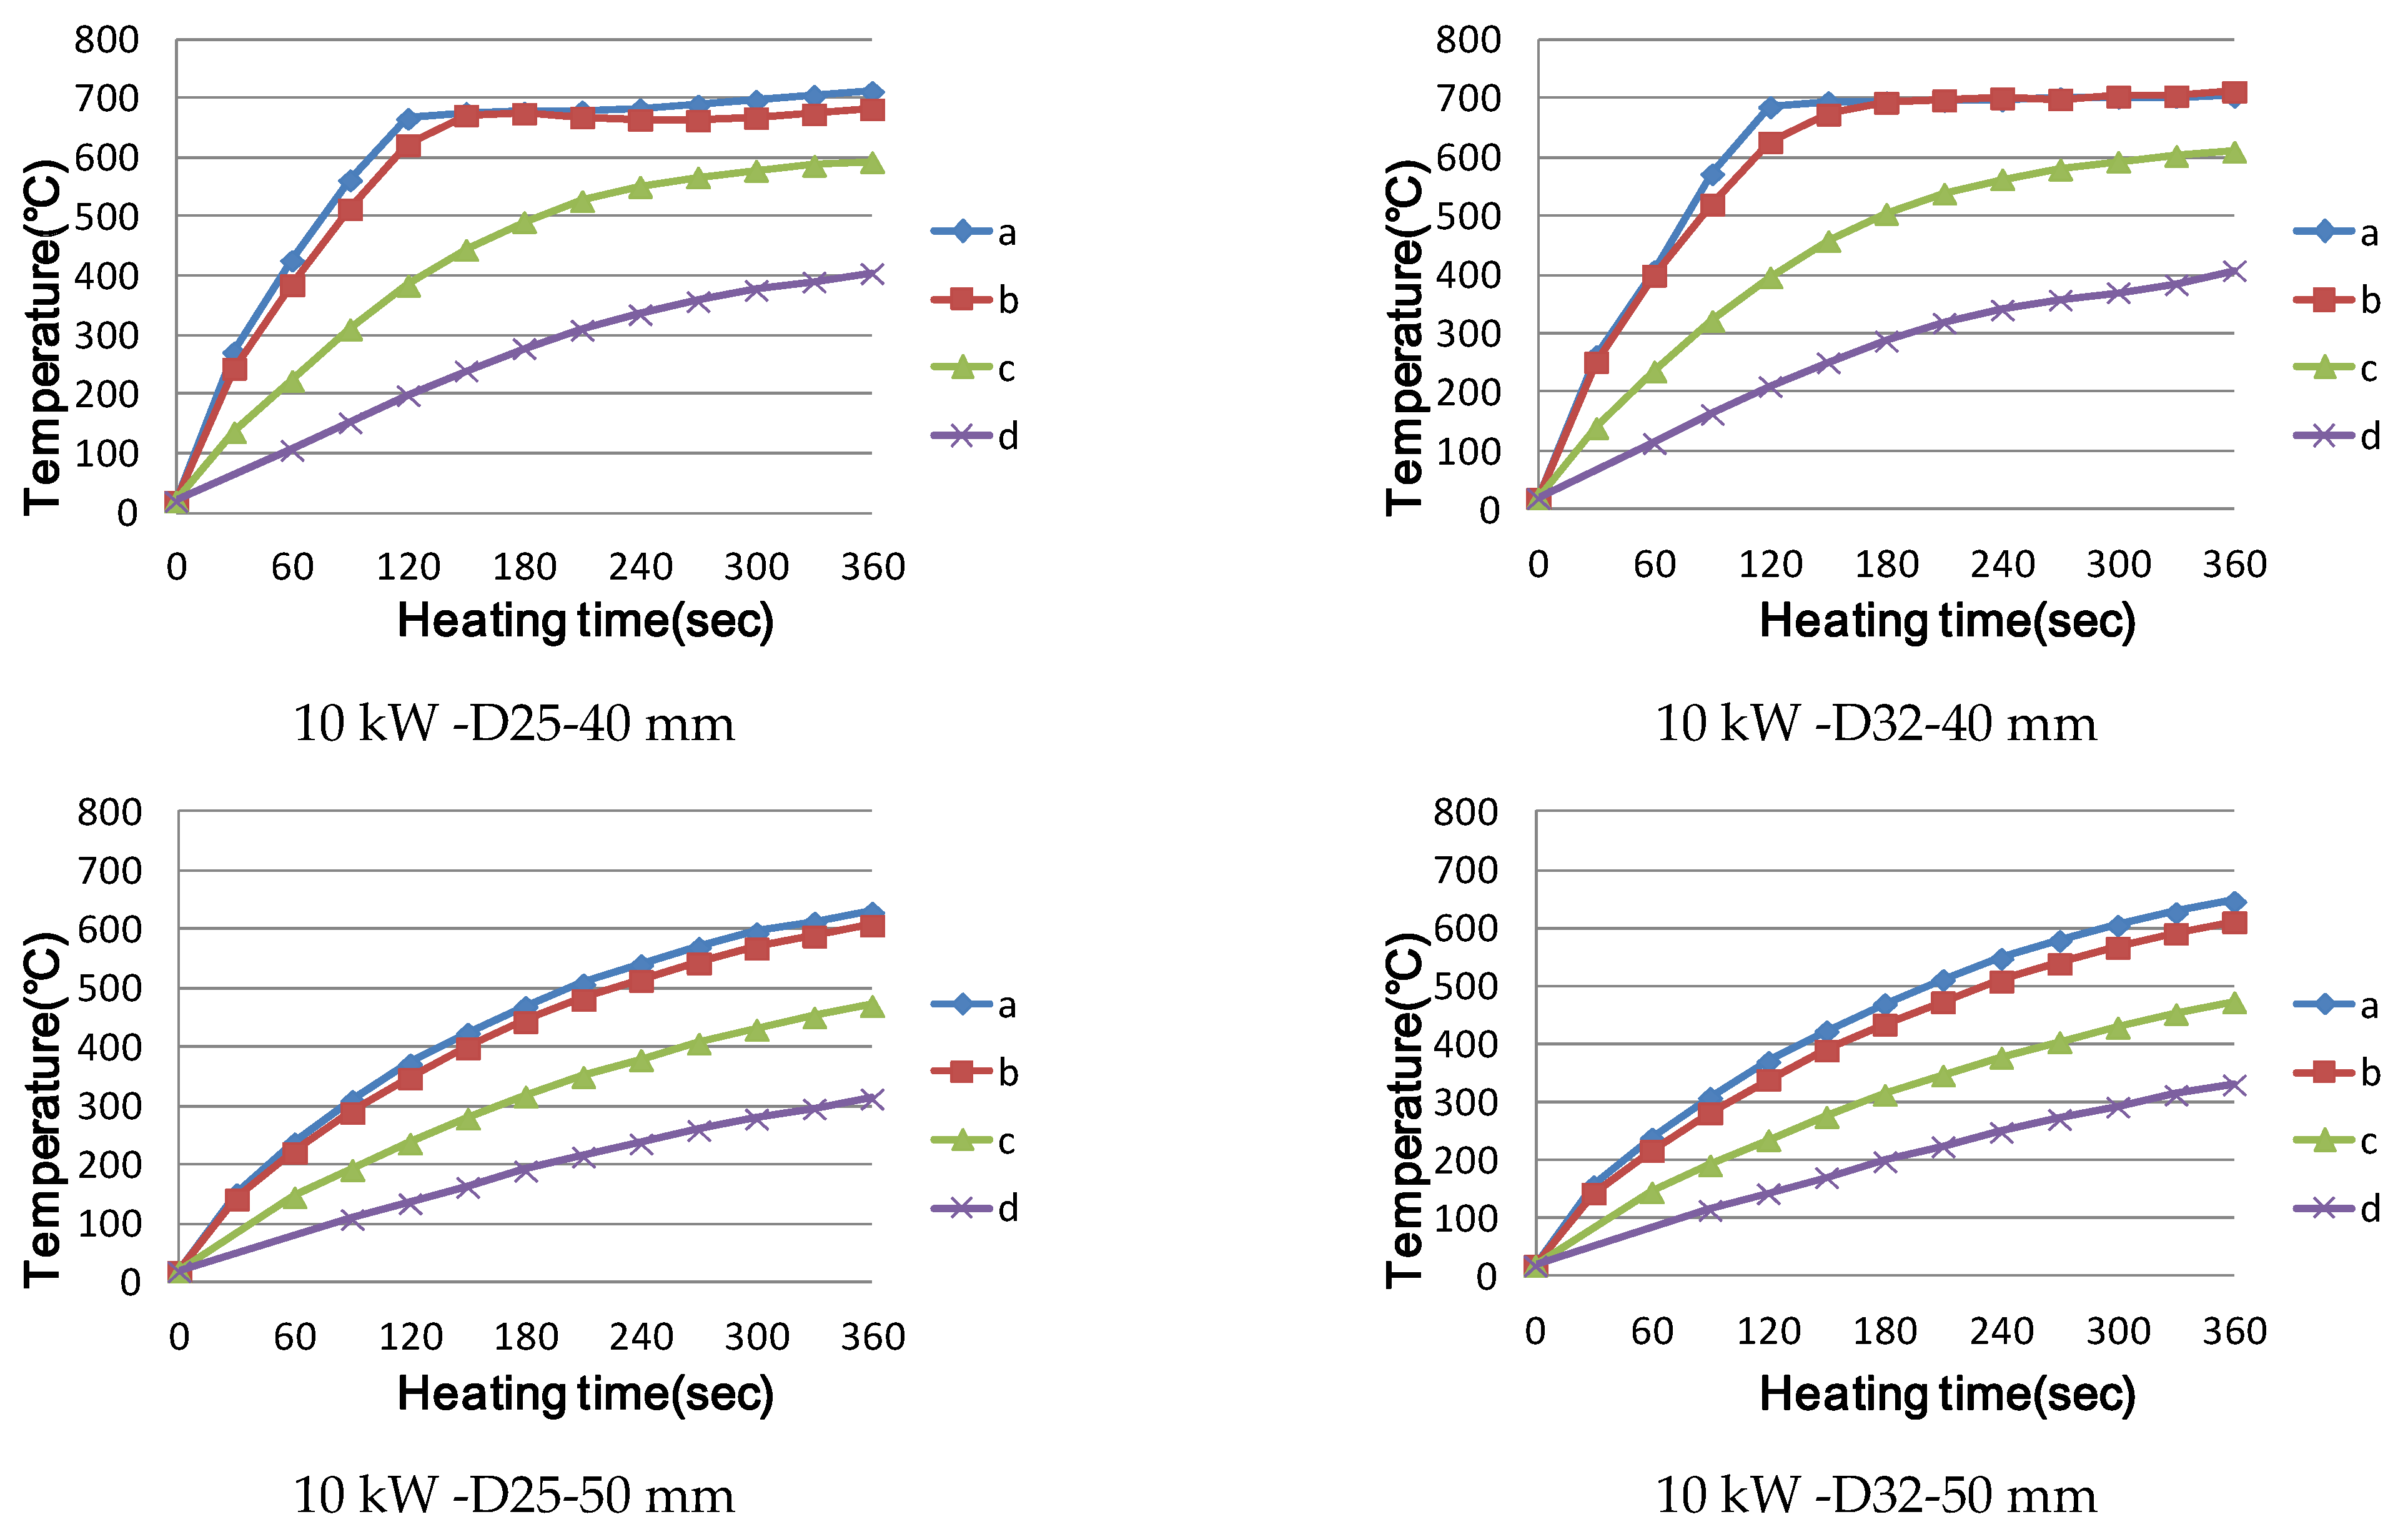
When using the high-frequency induction heating system, the difference in temperature characteristics between the maximum output of 5 kW and the maximum output of 6 kW is not large; however, when using the output of 10 kW, the early temperature-rise effect and range of magnetic field formation can be increased.
(2)
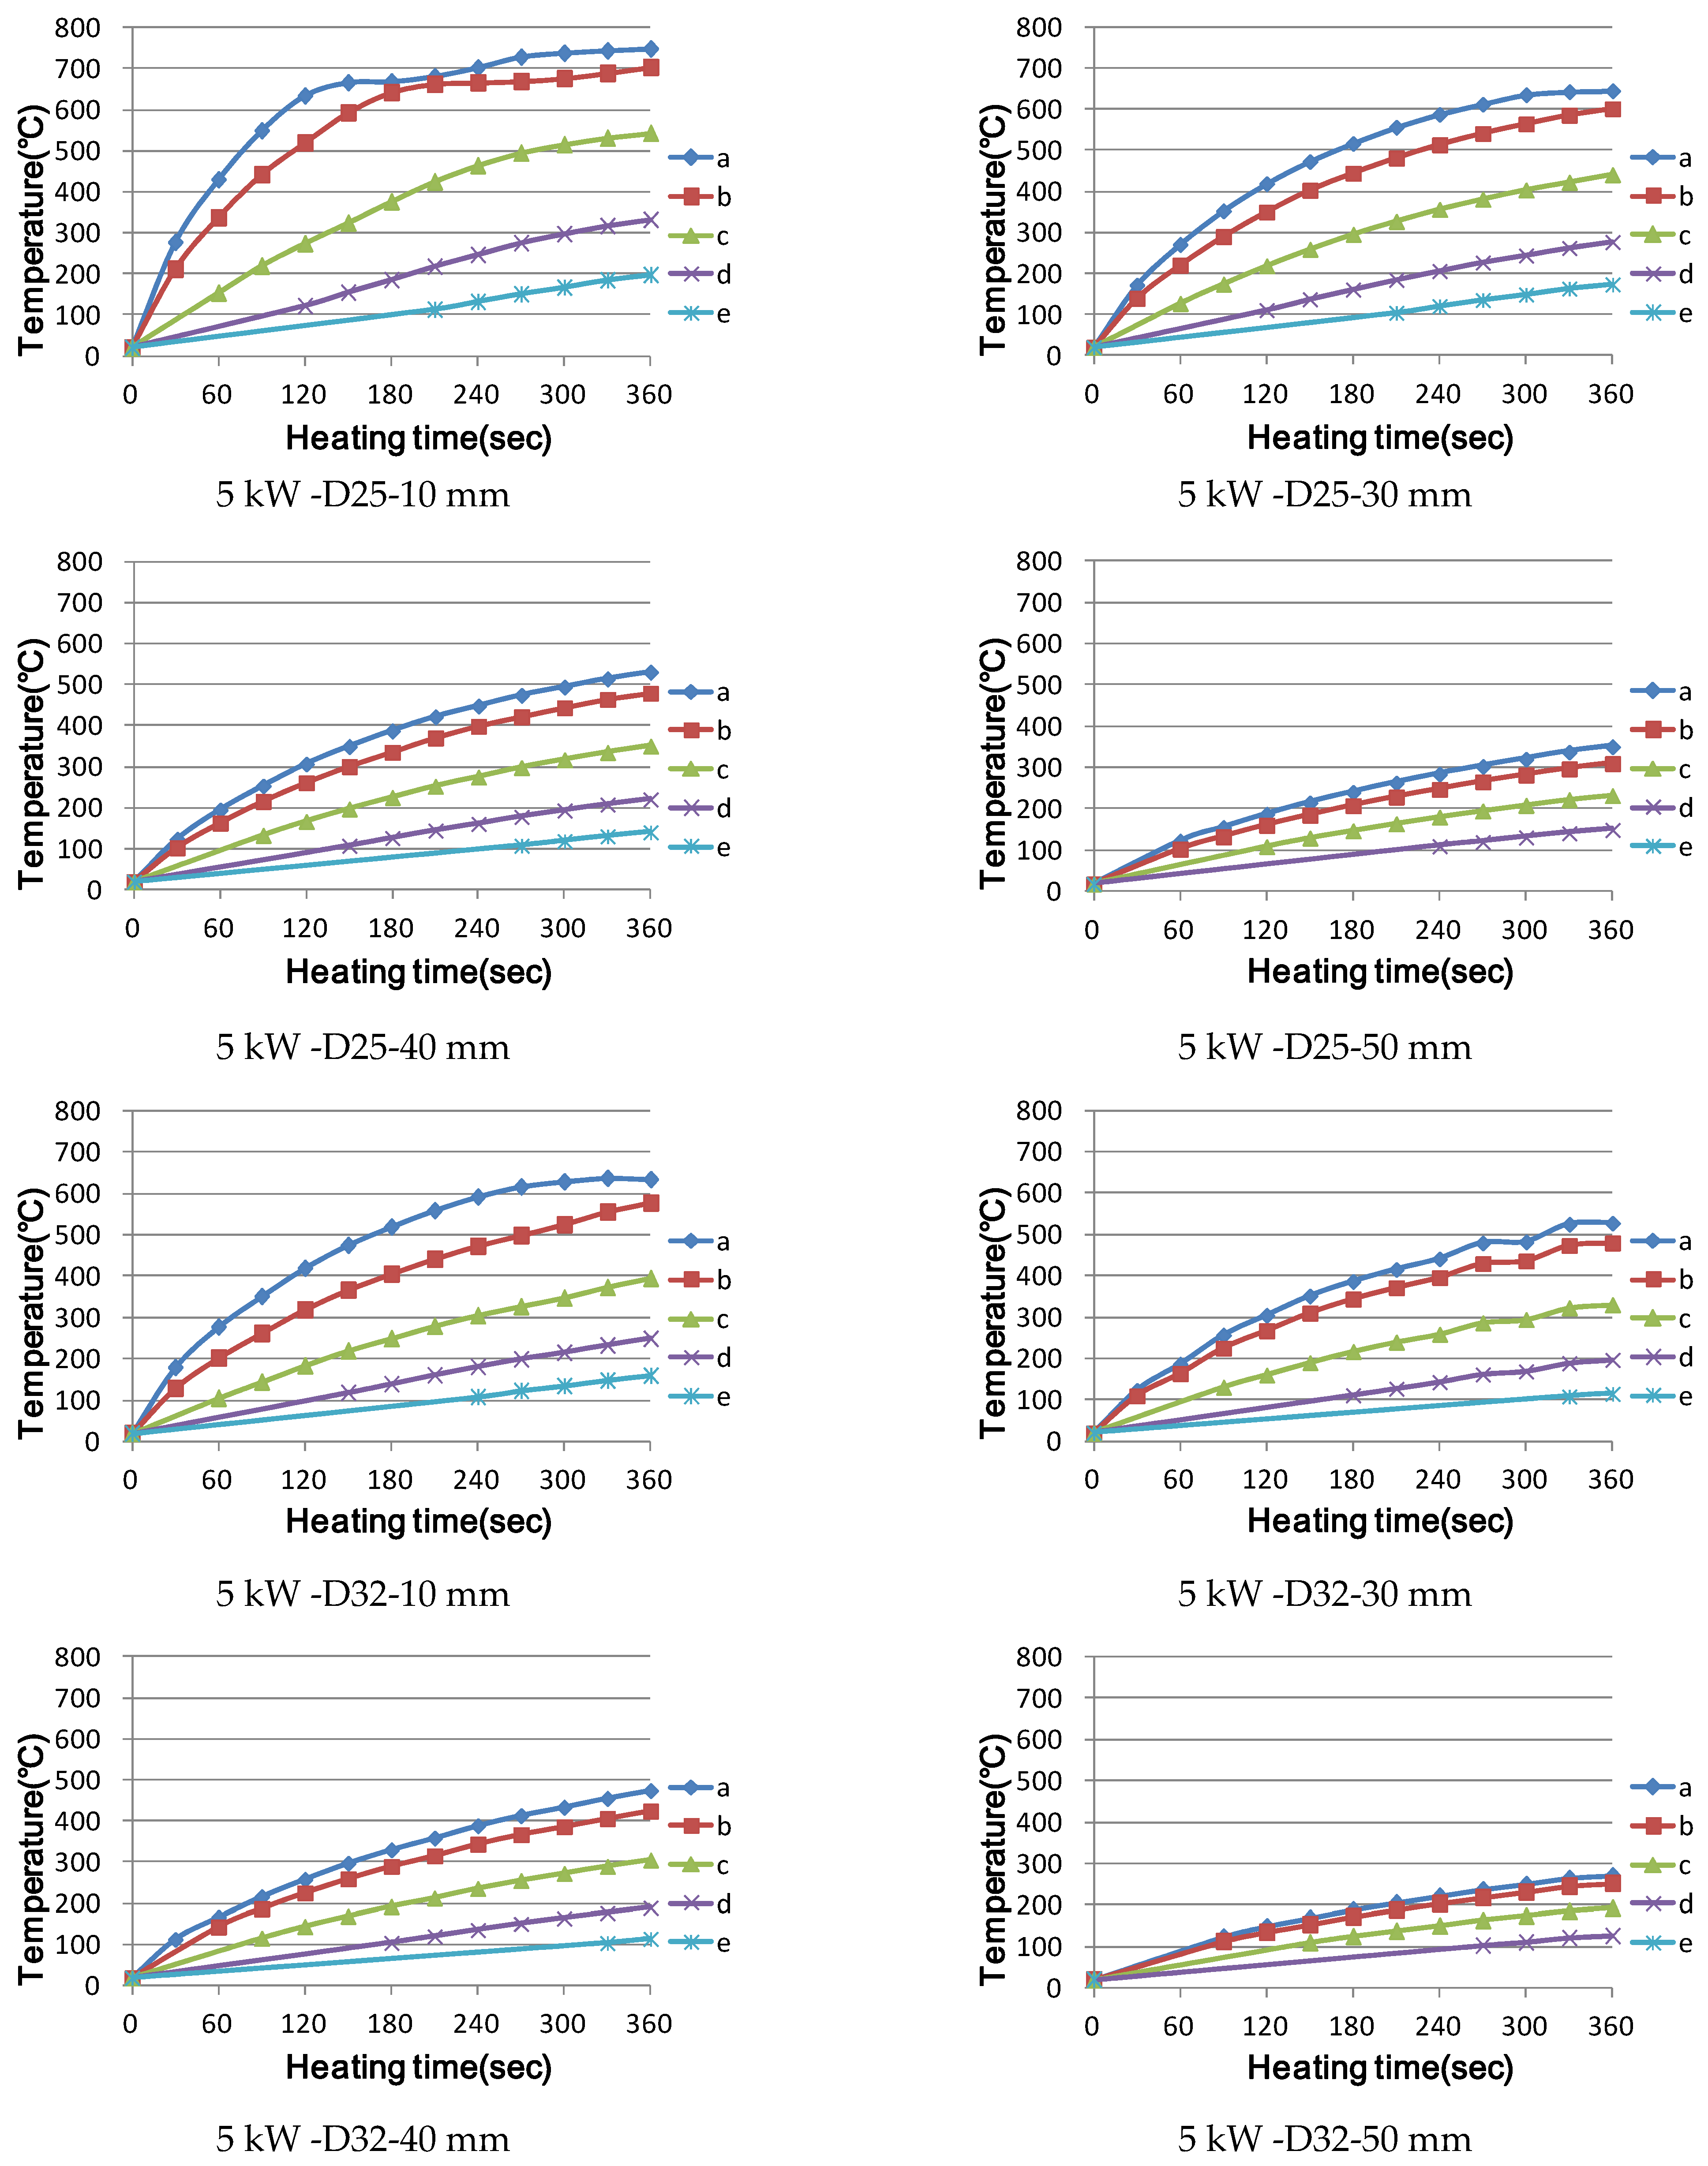
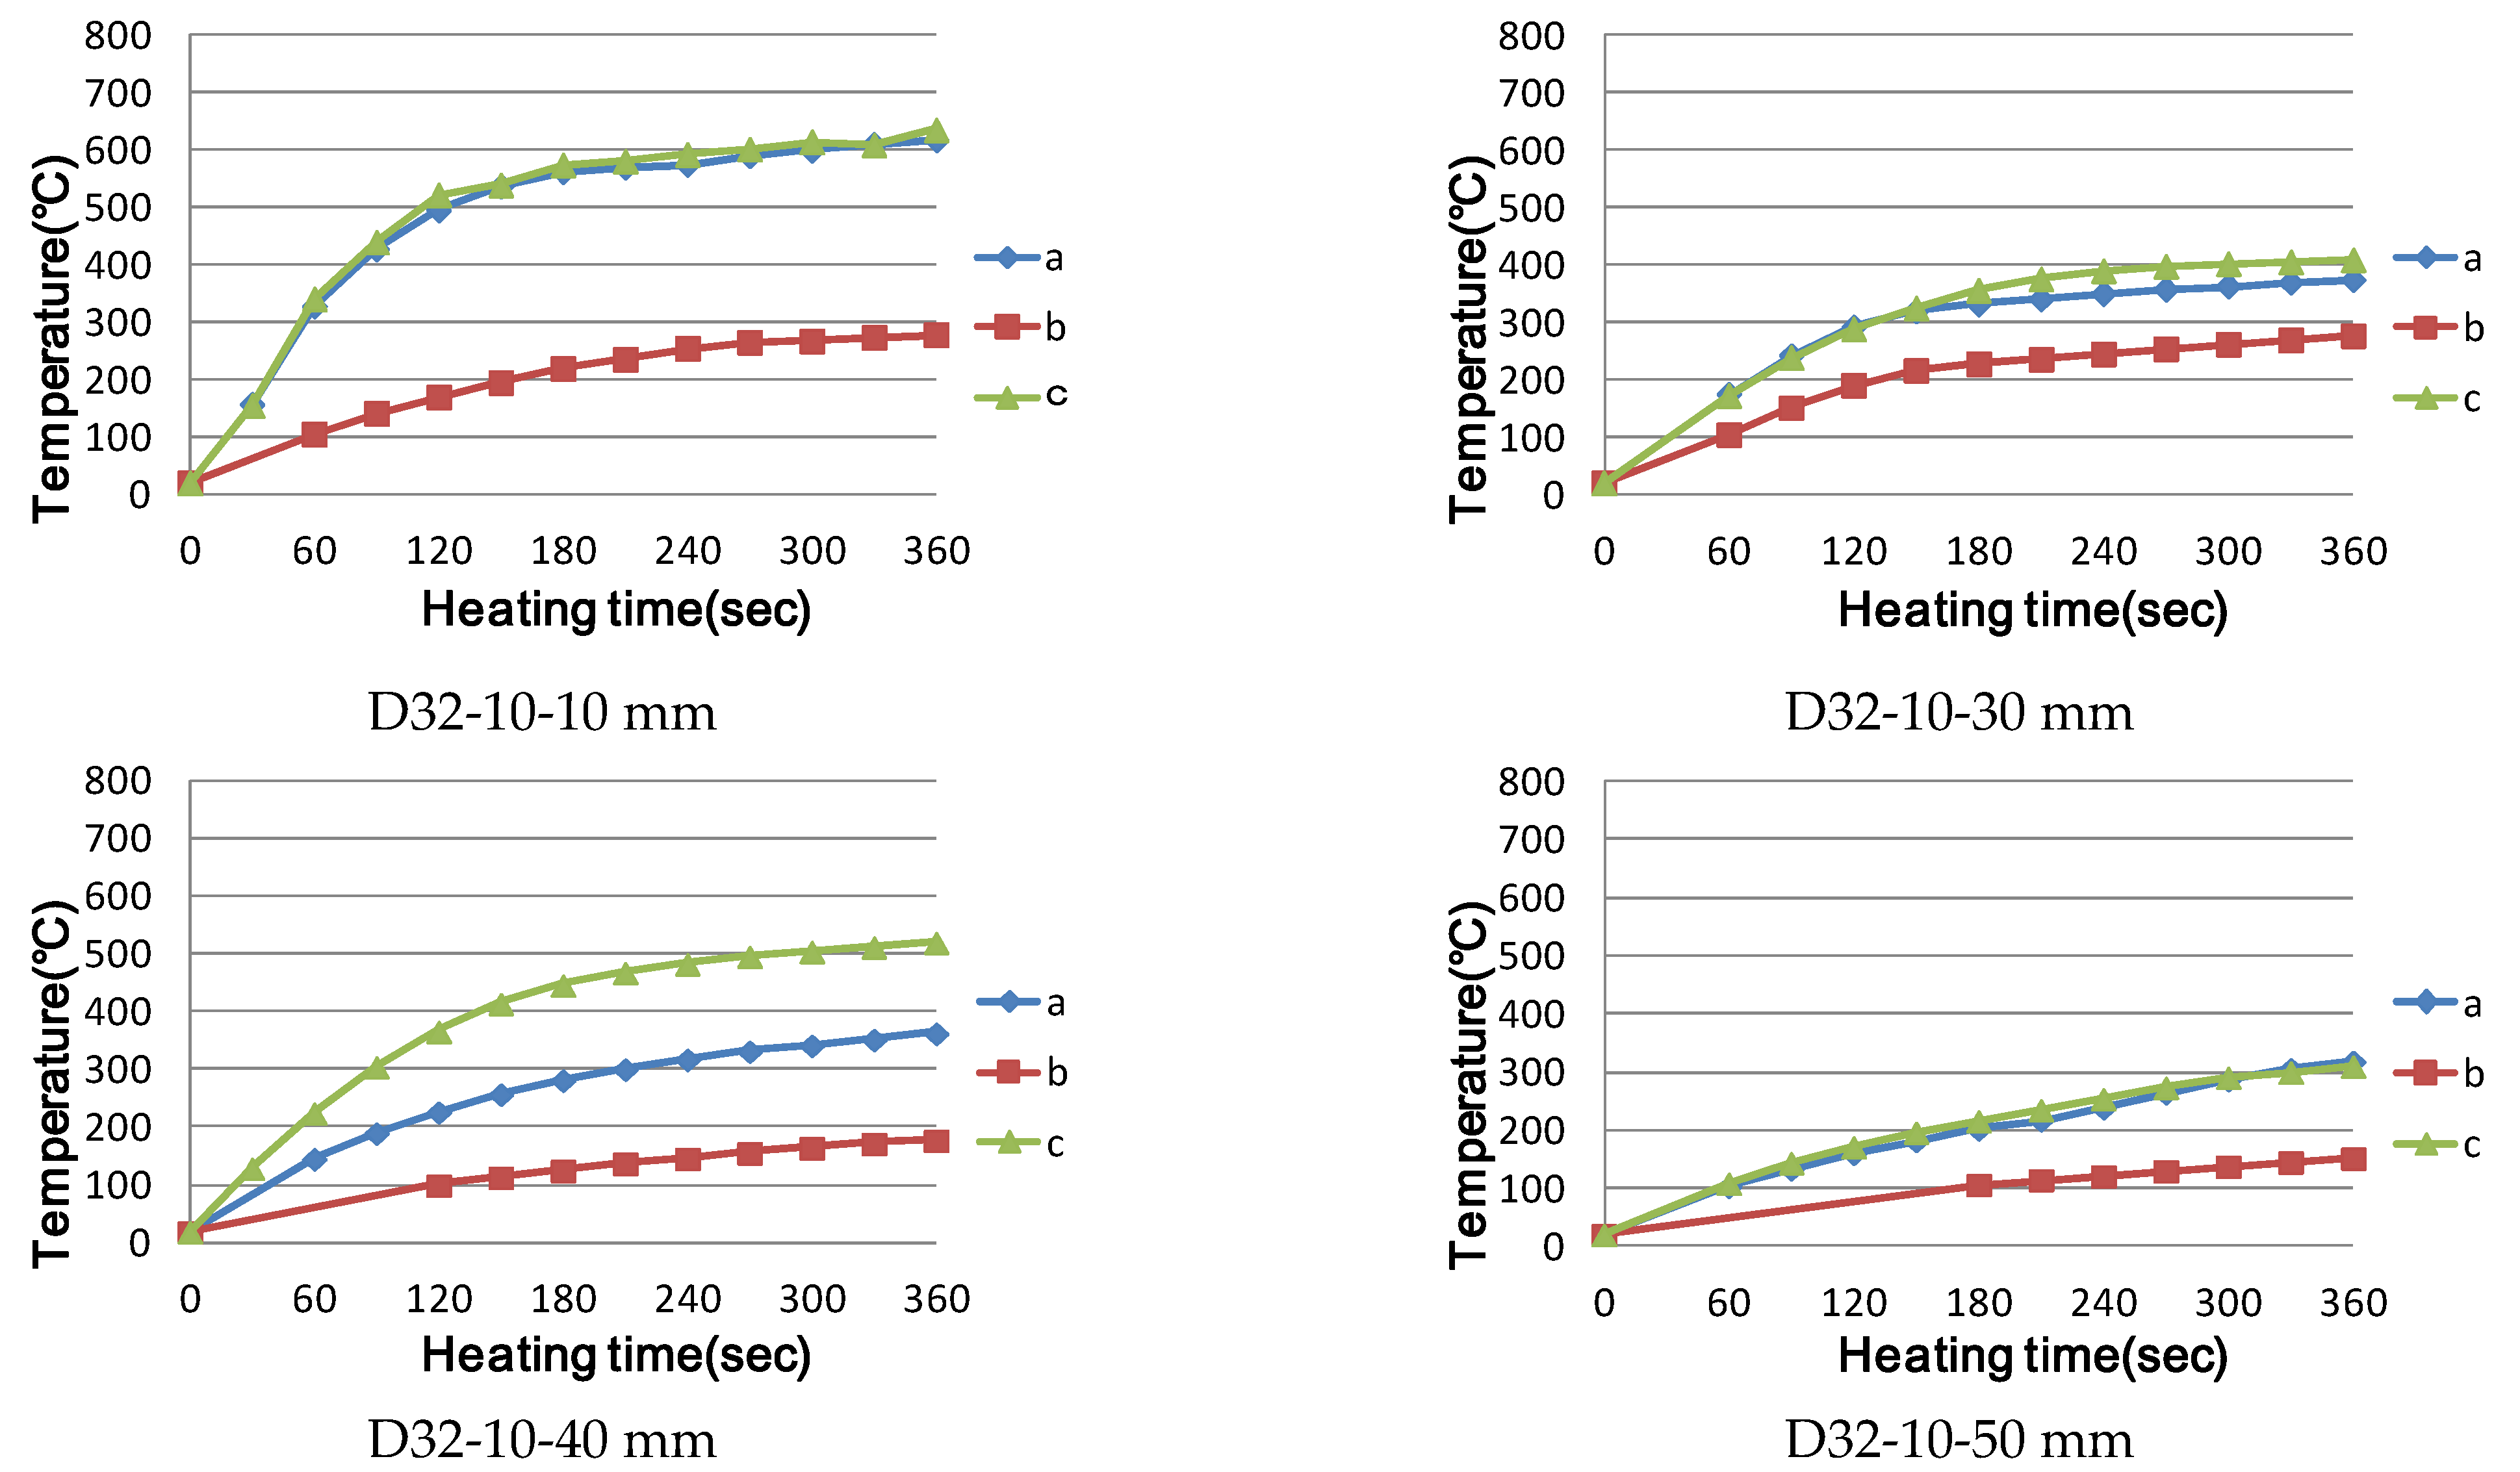
Small rebar diameters, such as those of D10 or less, at the same power output, show an early rapid temperature rise effect; however, after reaching the Curie point, thermal equilibrium is attained, resulting in power loss. In addition, when the diameter of the reinforcing bar is larger than that of D32, heat is concentrated on the surface owing to the surface heating effect, and the time elapsed to conduct heat to the inside of the reinforcing bar was confirmed.
(3)
When all heating conditions were the same, the following were confirmed: there was no significant effect due to the varying length of the reinforcing bar, selective local heating is possible when using the high-frequency induction heating method, and the heating range can be adjusted by changing the output.
(4)
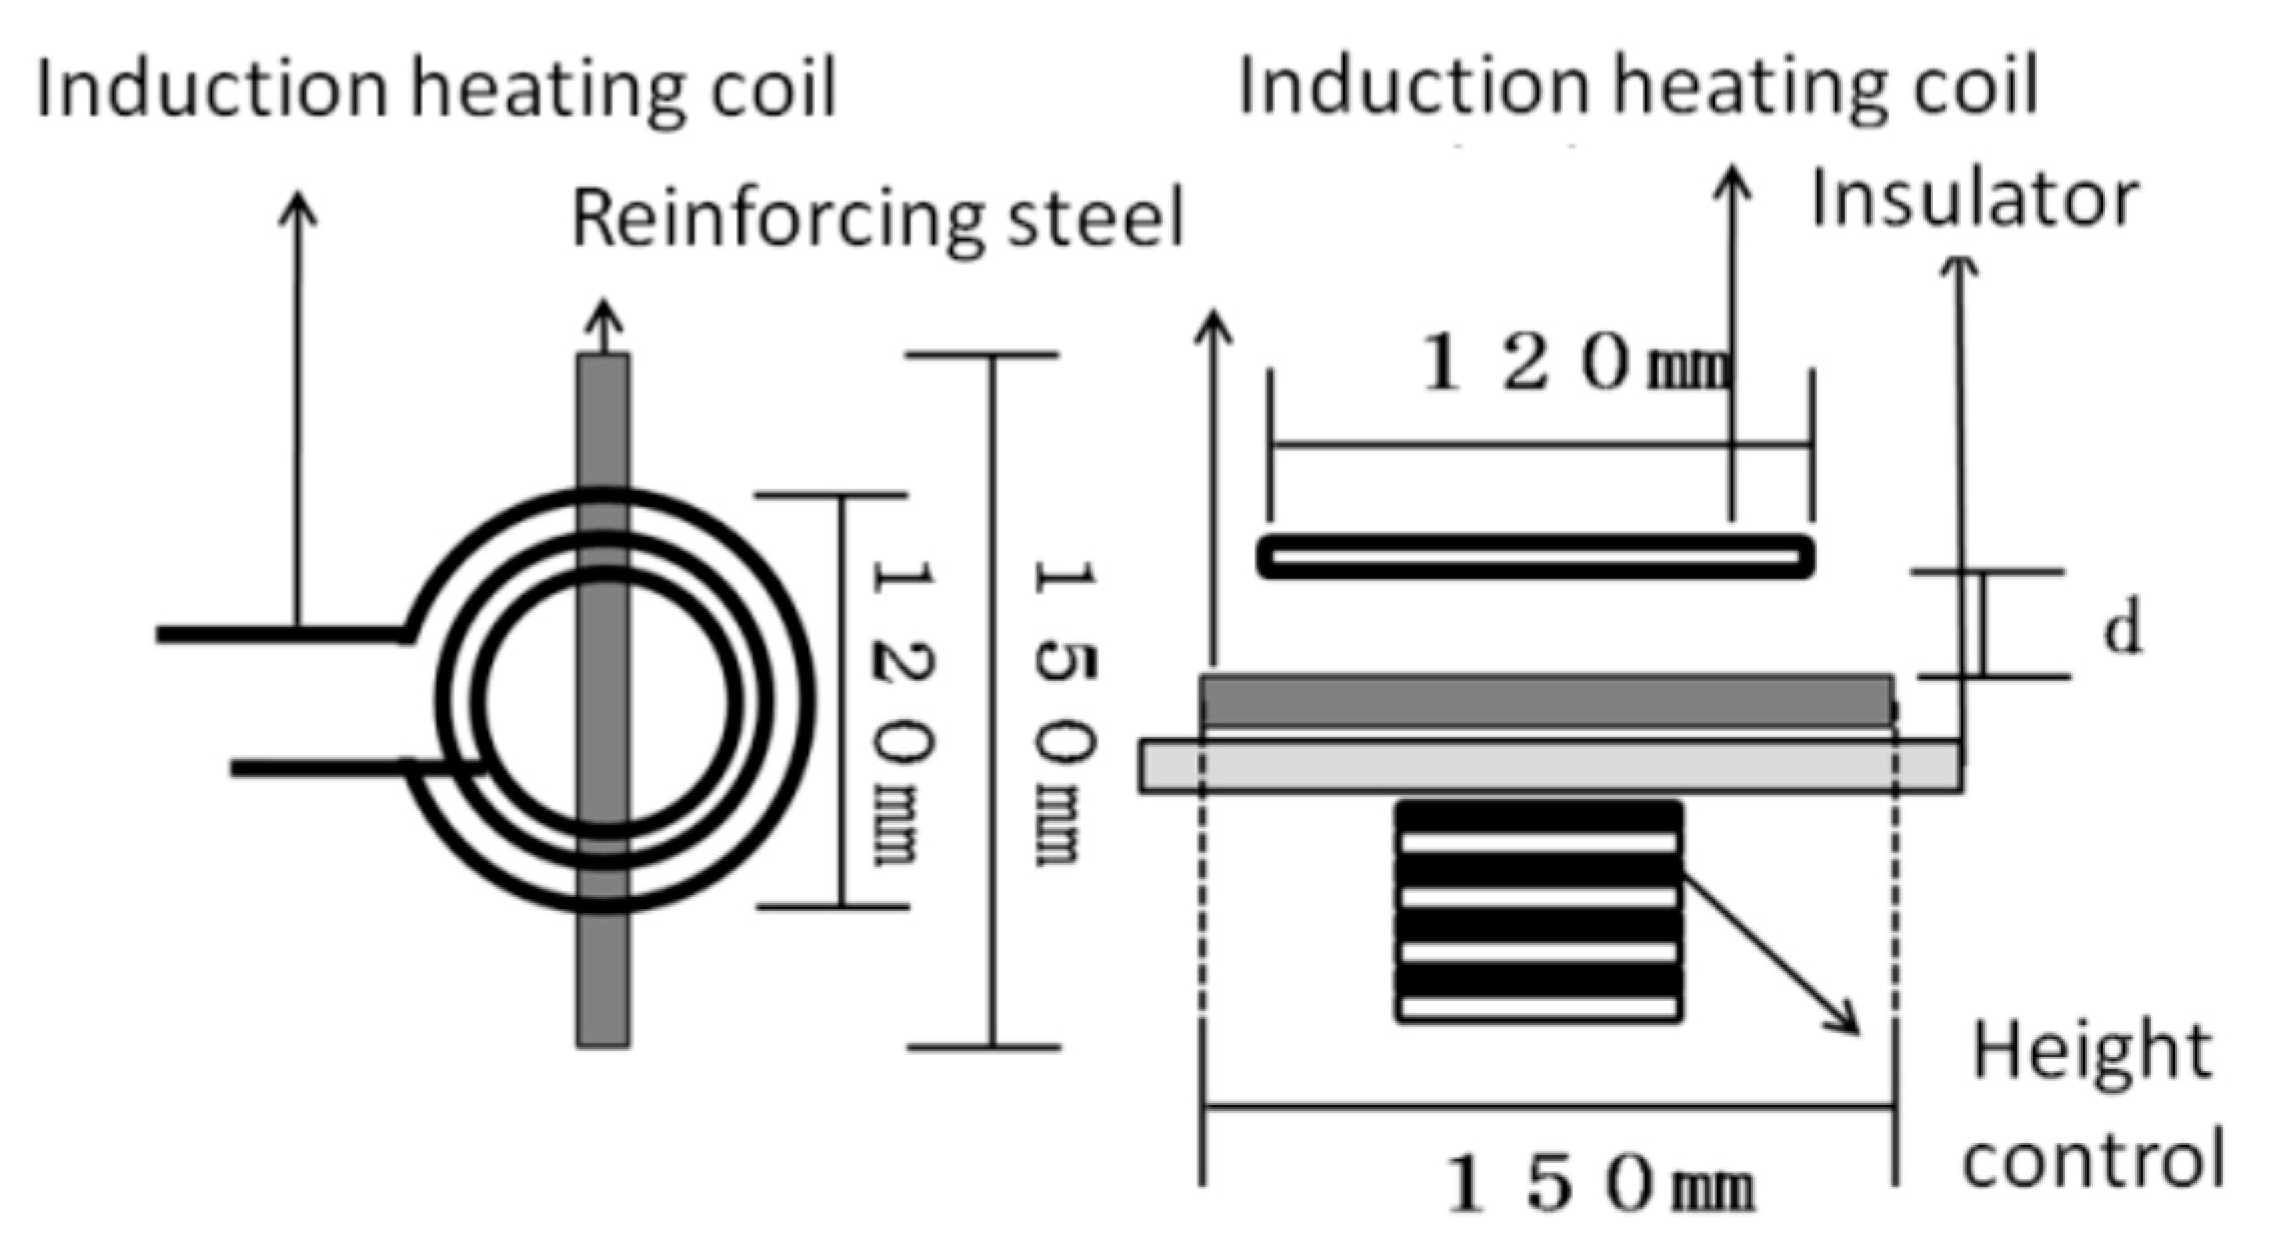
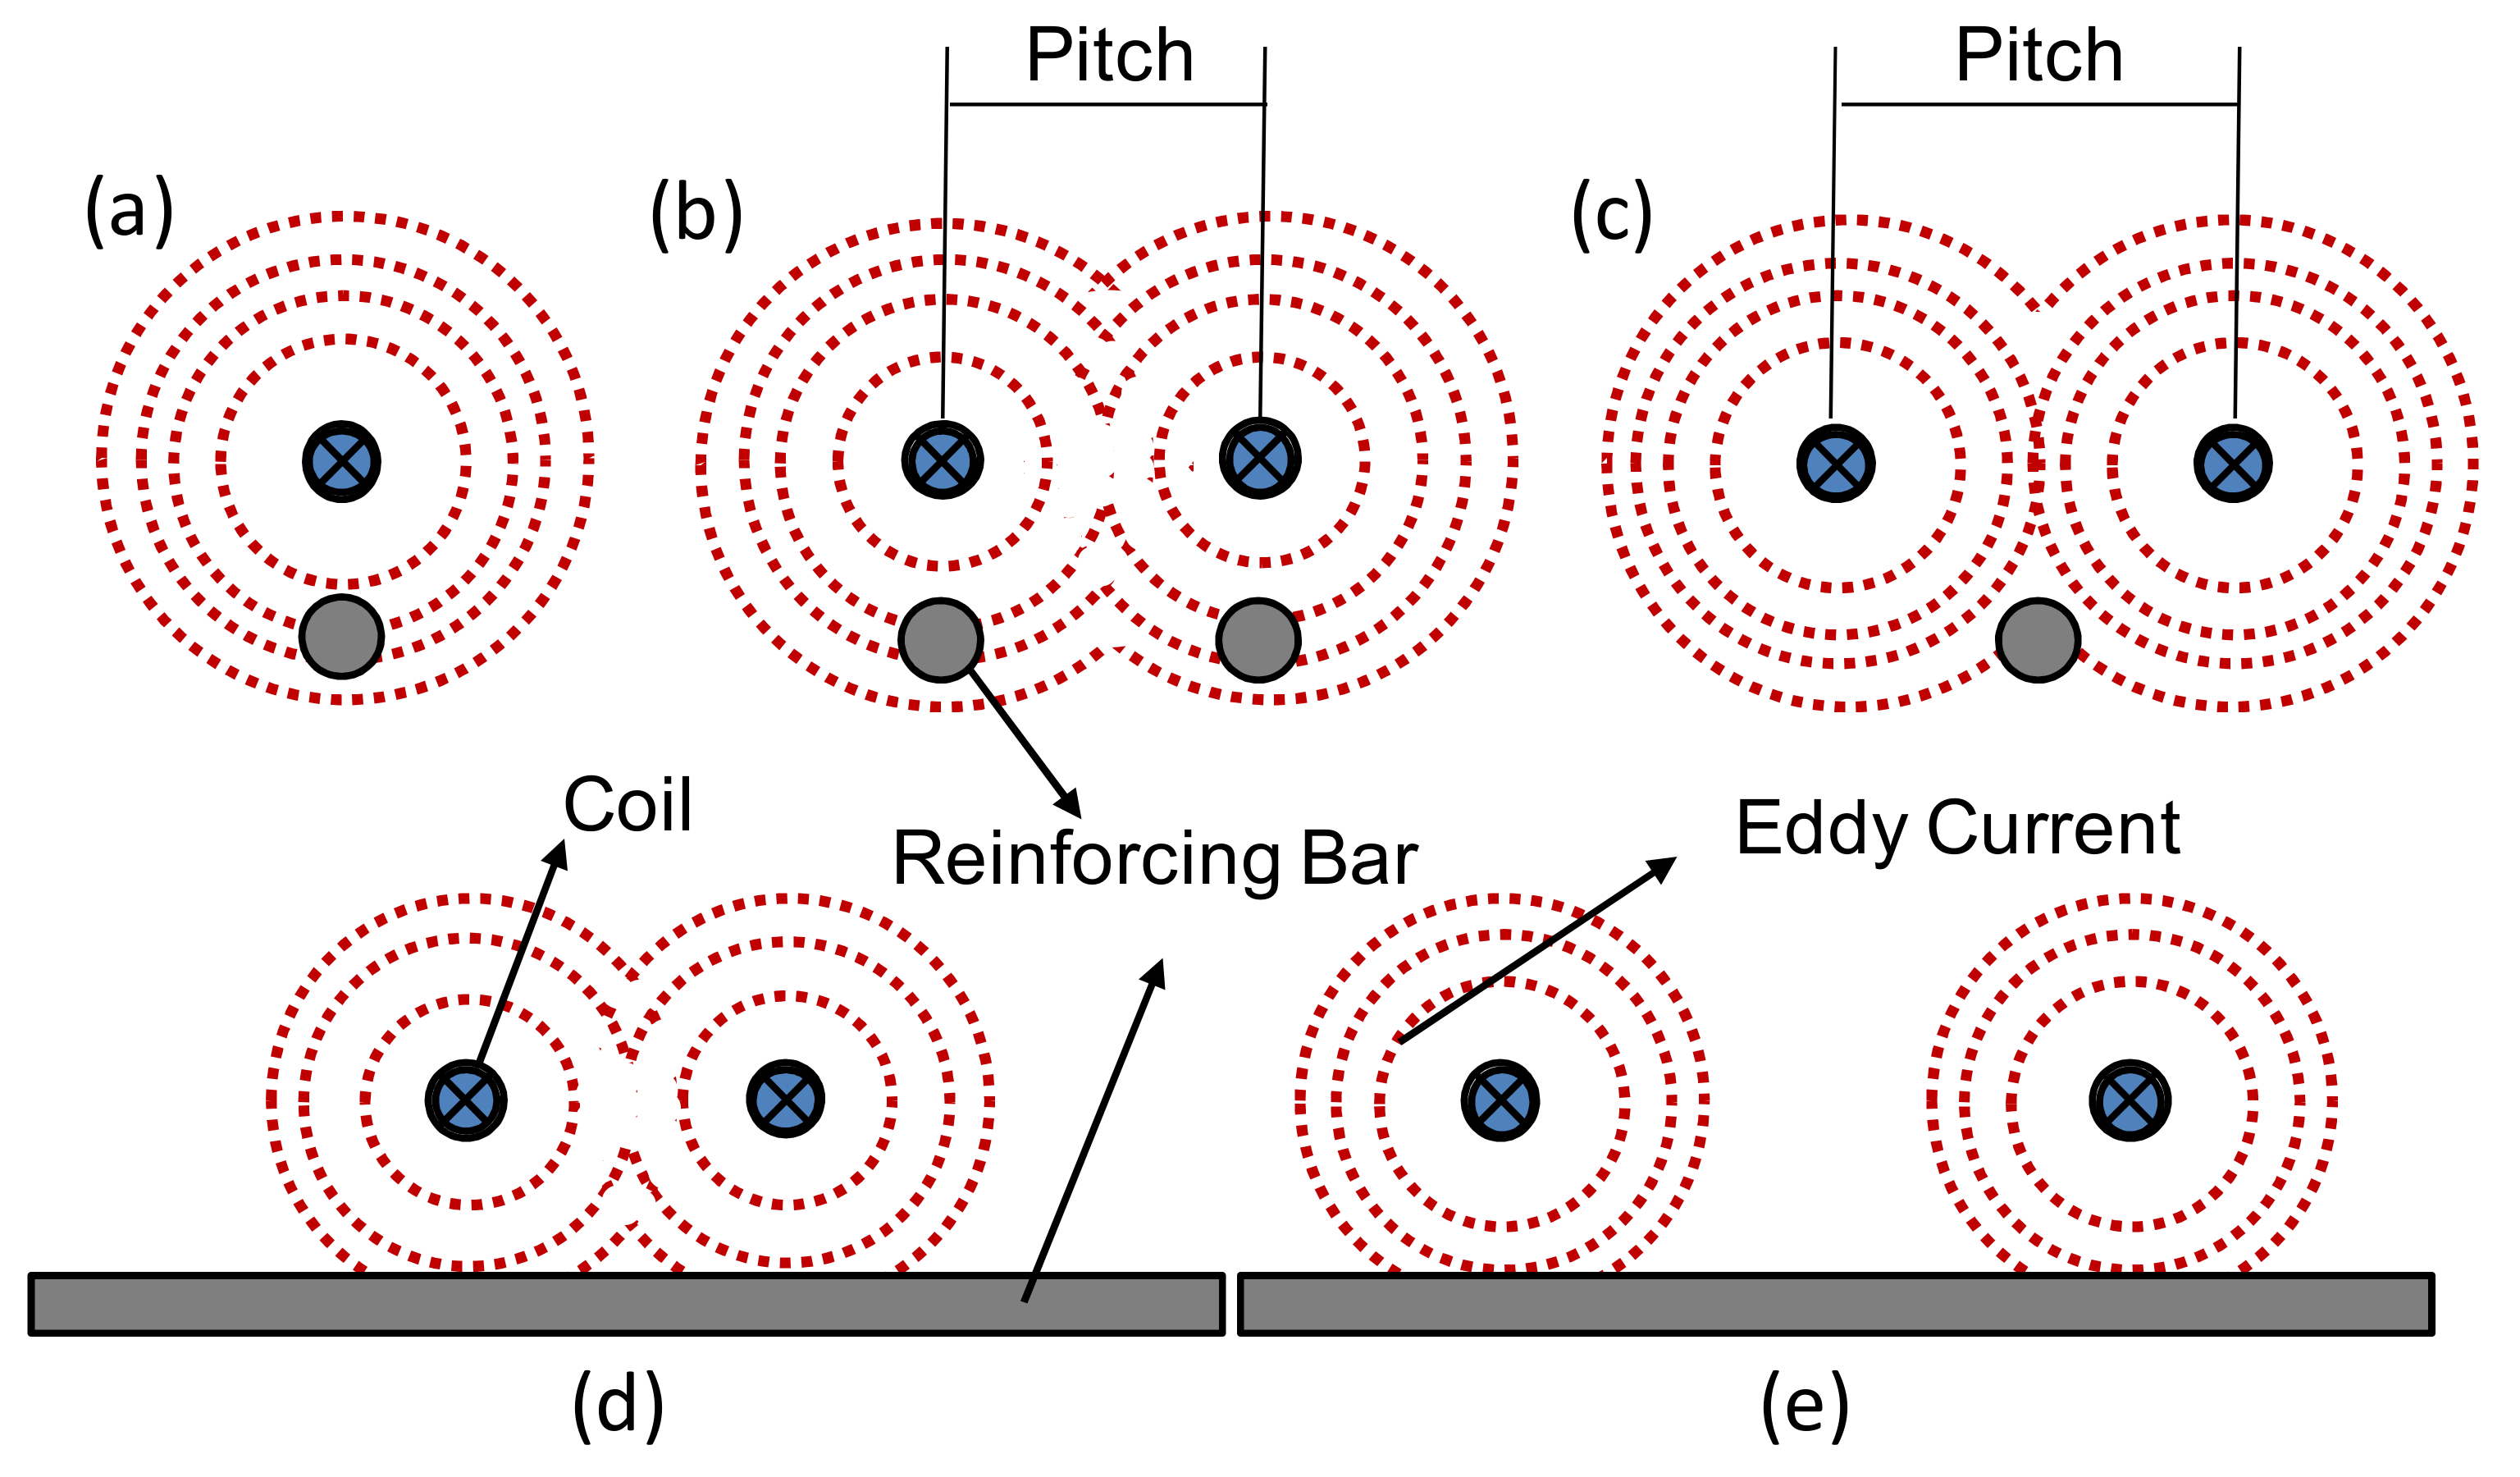
When selecting the location of the heating coil, the heating range is found to be larger when there are more steel bars being heated directly inside the heating coil than when it is heated under the same output and distance.
(5)
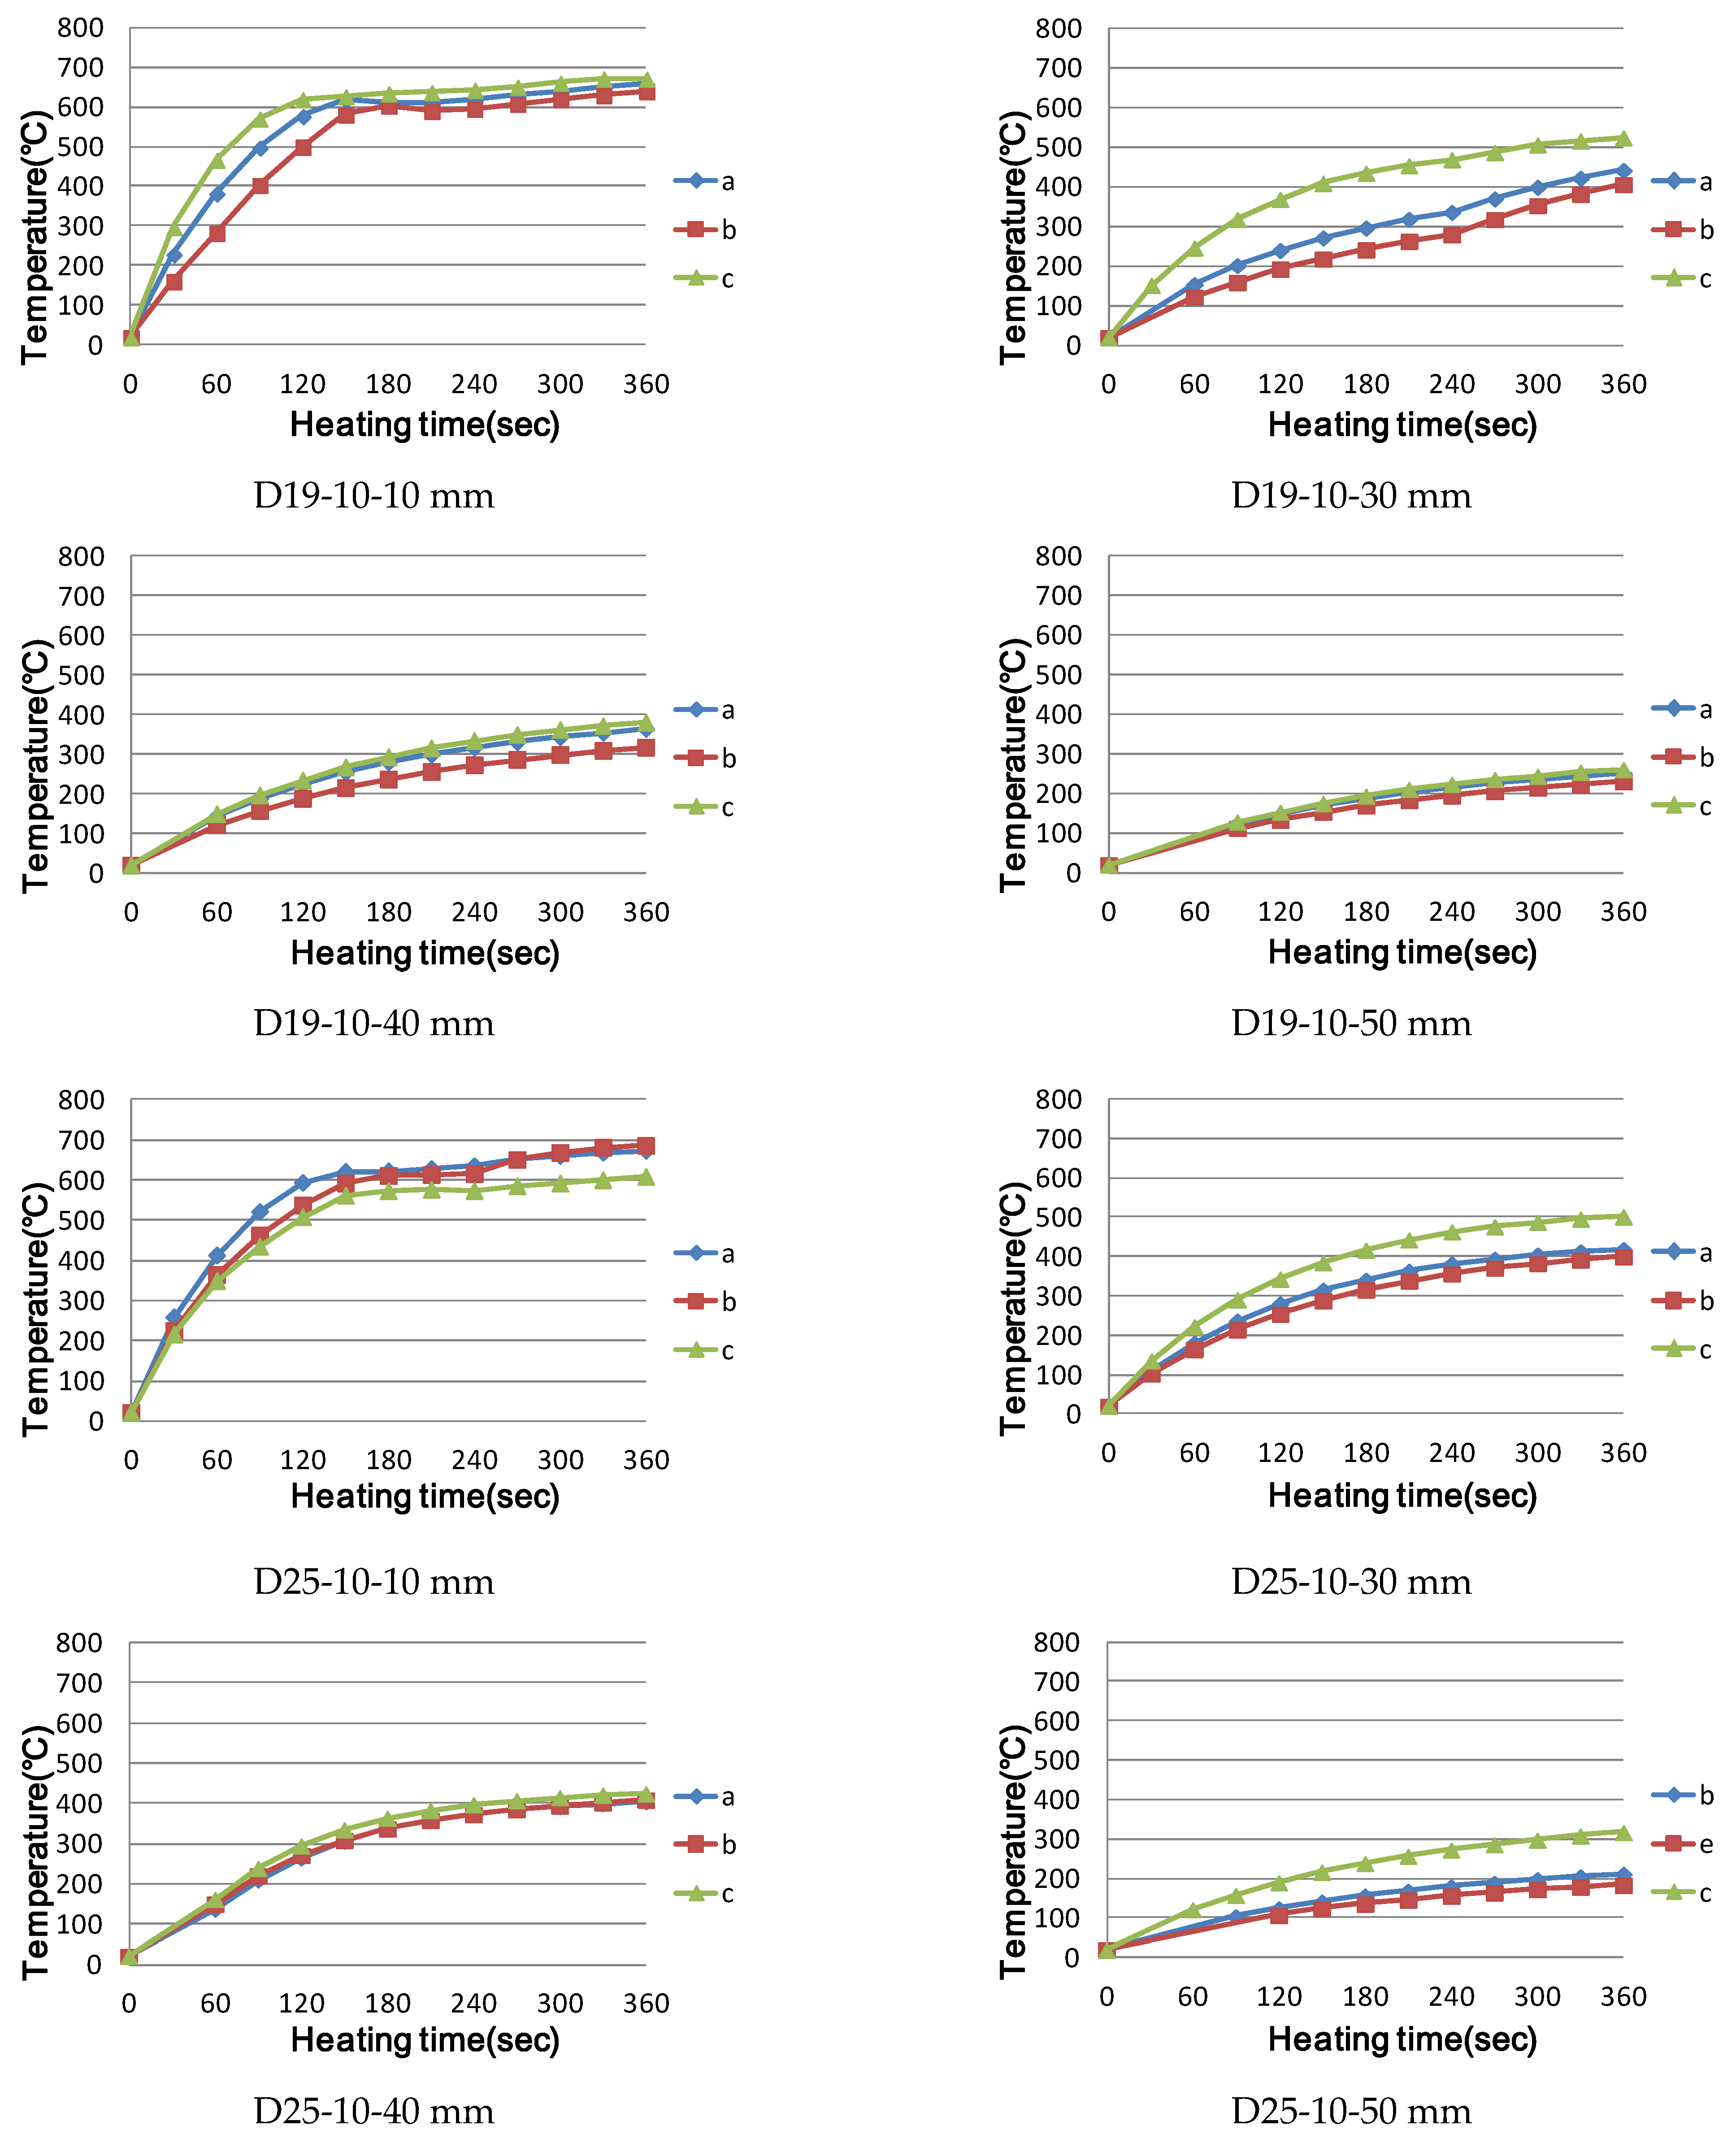
When the heating distance was 30 mm in cross-reinforcing bar heating, even the lower reinforcing bar was included in the magnetic field area, and a resistance heating phenomenon occurred. If the distance is greater than 40 mm, a magnetic field is formed around the upper reinforcing bar, and the lower reinforcing bar is outside the magnetic field area; as the diameter of the lower reinforcing bar increases, the temperature of the lower reinforcing bar increases to the weakened temperature of concrete.

Author Contributions

Conceptualization, M.-k.L.; methodology, M.-k.L.; investigation, M.-k.L.; data curation, M.-k.L.; writing—original draft preparation, C.L.; writing—review and editing, C.L. All authors have read and agreed to the published version of the manuscript.

Funding

This work was supported by a National Research Foundation of Korea (NRF) grant funded by the Korean government (NRF-2018R1D1A1B07049390).

Institutional Review Board Statement

Not applicable.

Informed Consent Statement

Not applicable.

Data Availability Statement

Not applicable.

Conflicts of Interest

The authors declare no conflict of interest.

References

  1. Landau, L.D.; Lifshitz, E.M.; Pitaevskii, L.P. Electrodynamics of Continuous Media; Pergamon Press: Oxford, UK, 1960. [Google Scholar]
  2. Aguiar, P.M.; Jacquinot, J.F.; Sakellariou, D. Experimental and Numerical Examination of Eddy (Foucault) Currents in Rotating Micro-Coils: Generation of Heat and Its Impact on Sample Temperature. J. Magn. Reson. 2009, 200, 6–14. [Google Scholar] [CrossRef]
  3. Cheng, J.; Roy, R.; Agrawal, D. Radically Different Effects on Materials by Separated Microwave Electric and Magnetic Fields. Mater. Res. Innov. 2002, 5, 170–177. [Google Scholar] [CrossRef]
  4. Cherradi, A.; Desgardin, G.; Provost, J.; Raveau, B. Electric & Magnetic Field Contributions to the Microwave Sintering of Ceramics Elelctroceramics IV; Wasner, R., Hoffman, S., Bonnenberg, D., Hoffmann, C., Eds.; RWTN: Aachen, Germany, 1994; Volume 2, pp. 1219–1224. [Google Scholar]
  5. Cao, Z.; Wang, Z.; Yoshikawa, N.; Taniguchi, S. Microwave Heating Origination and Rapid Crystallization of PZT Thin Films in Separated H Field. J. Phys. D Appl. Phys. 2008, 41, 092003. [Google Scholar] [CrossRef]
  6. Jin, R.; Chen, Q. Investigation of Concrete Recycling in the U.S. Construction Industry. Procedia Eng. 2015, 118, 894–901. [Google Scholar] [CrossRef]
  7. McCann, D.M.; Forde, M.C. Review of NDT methods in the assessment of concrete and masonry structures. NDT E Int. 2001, 34, 71–84. [Google Scholar] [CrossRef]
  8. Pradhan, B.; Bhattacharjee, B. Performance evaluation of rebar in chloride contaminated concrete by corrosion rate. Constr. Build. Mater. 2009, 23, 2346–2356. [Google Scholar] [CrossRef]
  9. Parthiban, T.; Ravi, R.; Parthiban, G.T. Potential monitoring system for corrosion of steel in concrete. Adv. Eng. Softw. 2006, 37, 375–381. [Google Scholar] [CrossRef]
  10. Pour-Ghaz, M.; Isgor, O.B.; Ghods, P. Quantitative interpretation of half-cell potential measurements in concrete structures. J. Mater. Civ. Eng. 2009, 21, 467–475. [Google Scholar] [CrossRef]
  11. Hornbostel, K.; Larsen, K.; Geiker, M.R. Relationship between concrete resistivity and corrosion rate—A literature review. Cem. Concr. Comp. 2013, 39, 60–72. [Google Scholar] [CrossRef]
  12. Takahashi, Y.; Matsubara, E.; Suzuki, S.; Okamoto, Y.; Komatsu, T.; Konishi, H.; Mizuki, J.; Waseda, Y. In-situ x-ray diffraction of corrosion products formed on iron surfaces. Mater. Trans. 2005, 46, 637–662. [Google Scholar] [CrossRef] [Green Version]
  13. Yeih, W.; Huang, R. Detection of the corrosion damage in reinforced concrete members by ultrasonic testing. Cem. Concr. Res. 1998, 28, 1071–1083. [Google Scholar] [CrossRef]
  14. Ahmed, R.; Rifat, A.A.; Yetisen, A.K.; Salem, M.S.; Yun, S.-H.; Butt, H. Optical microring resonator based corrosion sensing. RSC Adv. 2016, 6, 56127–56133. [Google Scholar] [CrossRef]
  15. Vrana, J.; Goldammer, M.; Bailey, K. Induction and conduction thermography: Optimizing the electromagnetic excitation towards application. Rev. Prog. Quant. Nondestruct. Eval. 2009, 28, 518–525. [Google Scholar]
  16. Zhang, H.; Liao, L.; Zhao, R.; Zhou, J.; Yang, M.; Zhao, Y. A new judging criterion for corrosion testing of reinforced concrete based on self-magnetic flux leakage. Int. J. Appl. Electromagn. Mech. 2017, 54, 123–130. [Google Scholar] [CrossRef]
  17. Gonzalez, J.A.; Cobo, A.; Gonzalez, M.N.; Feliu, S. Onsite determination of corrosion rate in reinforced concrete structures by use of galvanostatic pulses. Corros. Sci. 2001, 43, 611–625. [Google Scholar] [CrossRef]
  18. Abidin, I.Z.; Gui, Y.T.; Wilson, J. Quantitative evaluation of angular defects by pulsed eddy current thermography. NDT E Int. 2010, 43, 537–546. [Google Scholar] [CrossRef]
  19. Clark, M.R.; McCann, M.R.; Forde, M.C. Application of infrared thermography to the non-destructive testing of concrete and masonry bridges. NDT E Int. 2003, 36, 265–275. [Google Scholar] [CrossRef]
  20. Clark, M.; McCann, D.M.; Forde, M.C. Infrared thermographic investigation of railway track ballast. NDT E Int. 2002, 35, 83–94. [Google Scholar] [CrossRef]
  21. Defer, D.; Shen, J.; Lassue, S.; Duthoit, B. Non-destructive testing of a building wall by studying natural thermal signals. Energy Build. 2002, 34, 63–69. [Google Scholar] [CrossRef]
  22. Engelbert, P.J.; Hotchkiss, R.H.; Kelly, W.E. Integrated remote sensing and geophysical techniques for locating canal seepage in Nebraska. J. Appl. Geophys. 1997, 38, 143–154. [Google Scholar] [CrossRef]
  23. Sakagami, T.; Kubo, S. Applications of pulse heating thermography and lock-in thermography to quantitative nondestructive evaluations. Infrared Phys. Technol. 2002, 43, 211–218. [Google Scholar] [CrossRef]
  24. Baek, S.; Xue, W.; Feng, M.Q.; KWon, S. Non-destructive corrosion detection in RC through integrated heat induction and IR thermography. J. Nondestr. Eval. 2012, 31, 181–190. [Google Scholar] [CrossRef]
  25. Weekes, B.; Almond, D.P.; Cawley, P.; Barden, T. Eddy current induced thermography-probability of detection study of small fatigue cracks in steel, titanium and nickel-based superalloy. NDT E Int. 2012, 49, 47–56. [Google Scholar] [CrossRef]
  26. He, Y.; Pan, M.; Tian, G.; Chen, D.; Tang, Y.; Zhang, H. Eddy current pulsed phase thermography for subsurface defect quantitatively evaluation. Appl. Phys. Lett. 2013, 103, 144108. [Google Scholar] [CrossRef]
  27. Liu, L.; Zheng, D.; Zhou, J.T.; He, J.; Xin, J.; Cao, Y. Corrosion detection of bridge reinforced concrete with induction heating and infrared thermography. Int. J. Rob. Autom. 2018, 33, 379–385. [Google Scholar] [CrossRef]
  28. Harmathy, T.Z. Fire Safety Design and Concrete; Longman Scientific & Technical: New York, NY, USA, 1993. [Google Scholar]
  29. Schneider, U. Properties of Materials at High Temperatures-Concrete, 2nd ed.; RILEM Report; Gesamthochschule: Kassel, Germany, 1986. [Google Scholar]
  30. Lim, M. Development of Eco-Friendly Deconstruction Technologies for Recycling Construction Waste. J. Environ. Prot. 2014, 5, 647–661. [Google Scholar] [CrossRef] [Green Version]
  31. Schneider, U. Behavior of Concrete at High Temperatures; Beuth: Berlin, Germany, 1982. [Google Scholar]
  32. Bazant, Z.P.; Kapal, M.F. Concrete at High Temperatures: Material Properties and Mathematical Models; Prentice Hall: Hoboken, NJ, USA, 1996. [Google Scholar]
  33. Arioz, O. Effect of elevated temperatures on properties of concrete. Fire Saf. J. 2007, 42, 516–522. [Google Scholar] [CrossRef]
  34. Chen, C.; Habert, G.; Bouzidi, Y.; Jullien, A. Environmental impact of cement production: Detail of the different processes and cement plant variability evaluation. J. Clean. Prod. 2010, 18, 478–485. [Google Scholar] [CrossRef]
  35. Rodríguez, G.; Sáez del Bosque, I.F.; Asensio, E.; Sánchez de Rojas, M.I.; Medina, C. Construction and demolition waste applications and maximum daily output in Spanish recycling plants. Waste Manag. Res. 2020, 38, 423–432. [Google Scholar] [CrossRef]
  36. Li, Y.F. Dielectric Properties and Thermal Properties of Materials during Microwave Heating; Kunming University of Science and Technology: Kunming, China, 2012. [Google Scholar]
  37. Peng, Z.; Hwang, J.Y.; Park, C.L.; Kim, B.-G.; Onyedika, G. Numerical analysis of heat transfer characteristics in microwave heating of magnetic dielectrics. Metall. Mater. Trans. A 2012, 43, 1070–1078. [Google Scholar] [CrossRef]
  38. Zhu, J.; Kuznetsov, A.V.; Sandeep, K.P. Mathematical modeling of continuous flow microwave heating of liquids (effects of dielectric properties and design parameters). Int. J. Therm. Sci. 2007, 46, 328–341. [Google Scholar] [CrossRef]
  39. Catalá-Civera, J.M.; Canós, A.J.; Plaza-González, P.; Gutierrez, J.D.; Garcia-Banos, B.; Penaranda-Foix, F.L. Dynamic measurement of dielectric properties of materials at high temperature during microwave heating in a dual mode cylindrical cavity. IEEE Trans. Microw. Theory Tech. 2015, 63, 2905–2914. [Google Scholar] [CrossRef]
  40. Szychta, E.; Szychta, L. Comparative analysis of effectiveness of resistance and induction turnout heating. Energies 2020, 13, 5262. [Google Scholar] [CrossRef]
  41. Eurocode 2: Design of Concrete Structures-Part 1–2: General Rules-Structural Fire Design; BSI: London, UK, 2004; pp. 26–29.
  42. ASTM C 234, Standard Test Method for Comparing Concrete on the Basis of the Bond Developed with Reinforced Steel; ASTM: Conshohocken, PA, USA, 1991.
  43. Lie, T.T. Fire and Buildings; Applied Science Publishers Ltd.: London, UK, 1972; p. 276. [Google Scholar]
  44. Lie, T.T. Structural Fire Protection. In ASCE Manuals and Reports on Engineering Practice; No. 78; ASCE: New York, NY, USA, 1992; 241p. [Google Scholar]
  45. Lie, T.T.; Lin, T.D.; Allen, D.E.; Abrams, M.S. Fire Resistance of Reinforced Concrete Columns; Technical Paper No. 378; Division of Building Research, National Research Council of Canada: Ottawa, ON, Canada, 1984. [Google Scholar]
  46. El-Fitiany, S.F.; Youssef, M.A. Assessing the flexural and axial behaviour of reinforced concrete members at elevated temperatures using sectional analysis. Fire Saf. J. 2009, 44, 691–703. [Google Scholar] [CrossRef]
  47. Kodur, V.K.R.; Sultan, M.A. Effect of temperature on thermal properties of high-strength concrete. ASCE J. Mater. Civ. Eng. 2003, 15, 101–107. [Google Scholar] [CrossRef]
  48. Cosoli, G.; Mobili, A.; Tittarelli, F.; Revel, G.M.; Chiariotti, P. Electrical Resistivity and Electrical Impedance Measurement in Mortar and Concrete Elements: A Systematic Review. Appl. Sci. 2020, 10, 9152. [Google Scholar] [CrossRef]
  49. Mohapatra, J.; Xing, M.; Liu, J.P. Inductive Thermal Effect of Ferrite Magnetic Nanoparticles. Materials 2019, 12, 3208. [Google Scholar] [CrossRef] [Green Version]
  50. Yarlagadda, S.; Kim, H.J.; Gillespie, J.W.; Shevchenko, N.B.; Fink, B.K. A Study on the Induction Heating of Conductive Fiber Reinforced Composites. J. Compos. Mater. 2002, 36, 401–421. [Google Scholar] [CrossRef]
  51. Rudolf, R.; Mitschang, P.; Neitzel, M. Induction Heating of Continuous Carbon-Fibre-Reinforced Thermoplastics. Compos. A 2000, 31, 1191–1202. [Google Scholar] [CrossRef]
  52. Niknejad, A.M.; Meyer, R.G. Analysis of Eddy-Current Losses Over Conductive Substrates With Applications to Monolithic Inductors and Transformers. IEEE Trans. Microw. Theory Tech. 2001, 49, 166–176. [Google Scholar] [CrossRef]
  53. Reinert, J.; Brockmeyer, A.; De Doncker, R.W.A.A. Calculation of Losses in Ferro- and Ferrimagnetic Materials Based on the Modified Steinmetz Equation. IEEE Trans. Ind. Appl. 2001, 37, 1055–1061. [Google Scholar] [CrossRef]
  54. Orihara, H.; Hashimoto, S.; Ishibashi, Y. A Theory of D-E Hysteresis Loop Based on the Avrami Model. J. Phys. Soc. Jpn. 1994, 63, 1031–1035. [Google Scholar] [CrossRef]
  55. Sadakata, H.; Fujita, A.; Sumiyoshi, S.; Omori, H.; Saha, B.; Ahmed, T.; Nakaoka, M. Latest Practical Developments of Triplex Series Load Resonant Frequency-Operated High Frequency Inverter for Induction-Heated Low Resistivity Metallic Appliances in Consumer Built-In Cooktops. In Proceedings of the 2010 Twenty-Fifth Annual IEEE Applied Power Electronics Conference and Exposition (APEC), Palm Springs, CA, USA, 21–25 February 2010; pp. 1825–1832. [Google Scholar]
  56. Vedalakshmi, R.; Raj, A.S.; Srinivasan, S.; Babu, K.G. Quantification of hydrated cement products of blended cements in kow and medium strength concrete using TG and DTA technique. Thermochim. Acta 2003, 407, 49–60. [Google Scholar] [CrossRef]
  57. Szczygłowski, J. Influence of eddy currents on magnetic hysteresis loops in soft magnetic materials. J. Magn. Magn. Mater. 2001, 223, 97–102. [Google Scholar] [CrossRef]
Figure 1. Induction heating mechanism [51]. (a) Magnetic flux by AC current i1 ϕ and (b) induced current (eddy current i2).
Applsci 11 04947 g001
Figure 2. Hysteresis loop [57].
Applsci 11 04947 g002
Figure 3. Heat generation model of reinforcing bars by induction heating [56].
Applsci 11 04947 g003
Figure 4. Induction heating unit productivity.
Applsci 11 04947 g004
Figure 5. Output of high-frequency induction heating unit.
Applsci 11 04947 g005
Figure 6. Heating experiment for single reinforcing bar.
Applsci 11 04947 g006
Figure 7. Temperature-rise characteristics of rebar during induction heating (150 mm—center). (D00-0-0, D reinforcement type; output, kW; distance, mm).
Applsci 11 04947 g007aApplsci 11 04947 g007b
Figure 8. Temperature rise characteristics of rebar during induction heating (430 mm—center). (D00-0-0, D reinforcement type; output, kW; distance, mm).
Applsci 11 04947 g008aApplsci 11 04947 g008b
Figure 9. Temperature distribution of reinforcing bar by induction heating (5 KW–150 mm).
Applsci 11 04947 g009aApplsci 11 04947 g009bApplsci 11 04947 g009c
Figure 10. Rebar temperature distribution by induction heating (5 kW-430 mm). Rebar surface temperatures a, b, c, and d = 0 mm, 30 mm, 60 mm, and 90 mm from the center of reinforcement, respectively.
Applsci 11 04947 g010aApplsci 11 04947 g010b
Figure 11. Temperature distribution of reinforcing bar by induction heating (10 kW-430 mm). Rebar surface temperatures a, b, c, and d = 0 mm, 30 mm, 60 mm, and 90 mm from the center of reinforcement, respectively.
Applsci 11 04947 g011aApplsci 11 04947 g011b
Figure 12. Thermal experiment method for crossed reinforcing bar.
Applsci 11 04947 g012aApplsci 11 04947 g012b
Figure 13. Temperature characteristics of crossed rebar (5 kW).
Applsci 11 04947 g013aApplsci 11 04947 g013bApplsci 11 04947 g013c
Figure 14. Relationship between work (reinforcing bar) and heating coil combination efficiency.
Applsci 11 04947 g014
Figure 15. Temperature characteristics of crossed rebar (5 kW).
Applsci 11 04947 g015aApplsci 11 04947 g015b
Figure 16. Temperature characteristics of crossed reinforcing bar (10 W).
Applsci 11 04947 g016aApplsci 11 04947 g016bApplsci 11 04947 g016c
Table 1. Dimensions, types, and mechanical properties of deformed steel bar.
Differential Bar Gauge No. of Bar Steel (JIS G 3112)Permission of a ClauseThe Angle between a Node and an Axis
TypeNominal DiameterNominal ChieftainNominal Cross SectionUnit WeightMaximum Average Interval for ClauseKnot HeightMaximum Sum of Clause Clearances
MinMax
Unitmmcmcm2kg/mmmmmmmmm
D66.352.00.31670.22494.40.30.65.045°
D109.353.00.71330.5606.70.40.87.5
D1312.74.01.2670.9958.90.51.010.0
D1615.95.01.9861.5611.10.71.412.5
D1919.16.02.8652.2513.41.02.015.0
D2222.27.03.8713.0415.51.12.217.5
D2525.48.05.0673.9817.81.32.620.0
D2928.69.06.4245.0420.01.42.822.5
D3231.810.07.9426.2322.31.63.225.0
D3534.911.09.5667.5124.41.73.427.5
D3838.112.011.408.9526.71.93.830.0
D4141.313.013.4010.528.92.14.232.5
D5150.814.020.2715.935.62.55.040.0
Publisher’s Note: MDPI stays neutral with regard to jurisdictional claims in published maps and institutional affiliations.

