Article

Comparative Analysis of Digital Models of Objects of Cultural Heritage Obtained by the “3D SLS” and “SfM” Methods

by
Marcin Barszcz
1,*,
Jerzy Montusiewicz
1,
Magdalena Paśnikowska-Łukaszuk
2 and
Anna Sałamacha
1
1
Department of Computer Science, Lublin University of Technology, Nadbystrzycka 36B, 20-618 Lublin, Poland
2
Department of Fundamentals of Technology, Lublin University of Technology, Nadbystrzycka 38, 20-618 Lublin, Poland
*
Author to whom correspondence should be addressed.
Appl. Sci. 2021, 11(12), 5321; https://doi.org/10.3390/app11125321
Submission received: 15 May 2021 / Revised: 1 June 2021 / Accepted: 5 June 2021 / Published: 8 June 2021

Abstract

:
In the era of the global pandemic caused by the COVID-19 virus, 3D digitisation of selected museum artefacts is becoming more and more frequent practice, but the vast majority is performed by specialised teams. The paper presents the results of comparative studies of 3D digital models of the same museum artefacts from the Silk Road area generated by two completely different technologies: Structure from Motion (SfM)—a method belonging to the so-called low-cost technologies—and by Structured-light 3D Scanning (3D SLS). Moreover, procedural differences in data acquisition and their processing to generate three-dimensional models are presented. Models built using a point cloud were created from data collected in the Afrasiyab museum in Samarkand (Uzbekistan) during “The 1st Scientific Expedition of the Lublin University of Technology to Central Asia” in 2017. Photos for creating 3D models in SfM technology were taken during a virtual expedition carried out under the “3D Digital Silk Road” program in 2021. The obtained results show that the quality of the 3D models generated with SfM differs from the models from the technology (3D SLS), but they may be placed in the galleries of the vitrual museum. The obtained models from SfM do not have information about their size, which means that they are not fully suitable for archiving purposes of cultural heritage, unlike the models from SLS.

1. Introduction

3D digitisation of museum resources is becoming a more and more frequent practice, but the vast majority is performed by specialised teams representing the scientific community or professional companies offering such services. In recent years, data acquisition technologies have been developed to create three-dimensional models that use data belonging to various types of information. In photogrammetry [1] and Structure from Motion (SfM) [2], a collection of photos is used to build 3D models, which in successive shots of an object cover at least 60% of the surface. Laser scanning or structured-light 3D scanning (3D SLS) provides a cloud of points (x, y coordinates from the object’s surface), which ultimately allows us to build its 3D model. In addition to the acquisition of surface point coordinates, colour data are also collected, thanks to which the generated digital model obtains realistic features. In the era of the global pandemic caused by the COVID-19 [3] virus, when excursion and pilgrimage traffic has been halted or significantly restricted, many cultural heritage museum institutions wish to maintain their presence in the tourism market by introducing traditional exhibitions into digital space. The attractiveness of such digital exhibitions, increasingly known as Virtual Museum (VM), will largely depend not only on the uniqueness of the exhibits presented, but also on their digital quality. SfM technology belongs to the so-called low-cost technologies, which may also suggest that the models obtained in this way will not be of sufficiently good quality. The paper presents the results of comparative studies of digital models of the same museum artefacts from the Silk Road area generated by two completely different technologies: SfM and 3D SLS. The developed three-dimensional models based on the point cloud obtained from the scanning were created from data collected in the Afrasiyab museum in Samarkand (Uzbekistan) during “The 1st Scientific Expedition of the Lublin University of Technology to Central Asia” in 2017 [4]. Photos for creating 3D models in SfM technology were taken during a virtual expedition carried out as part of the “3D Digital Silk Road” [5] program in 2021.
The purpose of the article can be summarized as follows:
  • Comparison of data acquisition procedures for artefacts of material cultural heritage in SfM and 3D SLS technologies.
  • Generating 3D objects of museum artefacts in SfM and 3D SLS technology.
  • Assessment of parameters and quality of 3D models obtained in SfM and 3D SLS technologies.

2. Background Study

In the last two decades, the acquisition of three-dimensional data by laser scanning [6], using structured light [7] or SfM [2,8] has become one of the standard methods of documenting cultural heritage. It makes it possible to analyse the shape, geometry historic artefacts in a safe way [9]. They do not damage the surface or structure of the exhibits, because the activities carried out using the abovementioned methods do not require direct contact with the analyzed object. They allow for the accurate development of digital documentation of the measured object and then, for example, for creating a copy using the 3D printing technique [10].
The interest in scanning techniques is constantly growing and is being developed [11], because digitisation of museum collections allows to preserve exhibits for many decades and to pass on modern scientific achievements to the next generations. Creative involvement in digital 3D models of heritage artefacts can stimulate learning and support new forms of activity using digital models of historic artifacts [12], e.g., it allows disseminating 3D models on the Internet or creating virtual museums. Highly accurate documentation and 3D reconstructions are of fundamental importance for analysis and further interpretations in archeology. In recent years, integrated digital research (ground-based research methods and UAV photogrammetry) has proven its major role in documenting and understanding excavation contexts. This has become possible thanks to the development of specialised devices and the development of appropriate methods for collecting a wide variety of data on site. Several historic sites in the Sepino area of Italy were investigated with these methods and were realised using both range-based and image-based data acquisition methods. The laser scanning data were combined with SfM clouds in the same frame of reference, determined by topographic and GPS measurements [13]. By means of photogrammetry, the area of the Great Plains was examined under field conditions [14], as well as areas of Jordan [15]. The study of the effects of deformation in thermally forced rock masses has aroused growing interest in engineering geologists in the last decade. In this context, digital photogrammetry and infrared thermography and laser scanning have become the two most frequently used analysis techniques in engineering geology applications as they can provide useful information on the geomechanical and thermal conditions of these complex natural systems [16,17]. Photogrammetry and 3D scanning were used in the Pinchango Alto research in Peru [18]. 3D scanning methods were also discussed in the [19] work on the virtual archaeological exhibition. In the study of a unique early Christian carved stone discovered in Scotland, 2D photos were used as the basis for the reconstruction of the 3D model using the SfM method [20]. A FARO Photon Laser Scanner 120/20 system was used to record the geometric data of a complex of historic buildings in Malacca (Malaysia), declared a UNESCO World Heritage Site in 2008 [21]. Scanning with the use of 3D technology was also used to create ethnographic collections [22].
Having digital 3D models allows one to perform a virtual reconstruction of incomplete or damaged artefacts by restoring their original shapes or decorations along with the functions they performed. An example is the reconstruction of a Roman cornice from the Castulo archaeological site (located in Spain) presented in [23]. Virtual 3D models were created on the basis of a series of photos in the paid Agisoft Metashape program, and digital reconstruction using the free Blender software. The reconstructed models were then used to recreate the cavities by 3D printing. Thanks to digital reconstruction, exhibitions in virtual museums gain a new format. Examples of virtual museums created with the use of 3D models obtained in the process of digitisation of objects are the Archaeological Museum in Zagreb [24] and the National Archaeological Museum in Florence [25]. Artefact scans are described in [26], and the obtained models were used to create integrated VR applications.
SfM technology is sometimes dedicated to specific devices. The work [27] describes an example of 3D digitisation of a dress using specialised Autodesk 123D Catch software developed for iPhone and iPad devices. The digital 3D model was generated on cloud servers, after which it was possible to perform surface finishing (Adobe Photoshop) and a 3D model (3ds Max), in which the object was also rendered to transfer it to the Unity engine for presentation purposes.
SfM technology is used in extremely different fields, such as forestry [28] or medicine [29,30]. The SfM method was used to study three contrasting terrain forms at different scales, including: (i) exposed rocky coastal cliffs, (ii) a disturbed complex of moraine dams, and (iii) a bedrock ridge carved in the glacier [31]. Photogrammetric three-dimensional models of objects were made in Colombia, which served as a library of props in landscape visualisation [32]. The mapping technique was used in georeferencing of archaeological aerial photographs [33], and it was also used to study large monuments of the northern river terrace of the Uyuk valley (Russia) and their state of preservation was assessed on the basis of high-resolution optical satellite data [34]. The use of scanning and mapping techniques in the field of geography was used in the study of the water-level fluctuation zone in the Three Gorges Reservoir area in China. An innovative approach to photogrammetry using ships as a device carrier, which was also used for 3D acquisition of landslides, was proposed [35].
Photogrammetry techniques can also contribute to the restoration works of buildings. Study [36] discusses the activities related to the main characteristic elements of the Venetian basilica, which were documented using very high resolution orthophotos. The SfM method was used to integrate the data obtained from the Multi View Stereo and the images generated by a camera placed on an unmanned aerial system (UAS). Tests of generating 3D models based on ground and aerial data acquisition were carried out in the conservation of the Cistercian Staffarda Abbey in Piedmont, a cultural heritage site in Italy. Airborne data acquisition was based on a photogrammetric Remotely Piloted Aircraft System (RPAS) flight, while ground-based research was carried out by laser scanning. Both methods allowed to extract and process various point clouds and generate mesh 3D models of different scales (different resolution, detail content and precision) [37]. In turn, the obtained 3D point cloud was used to study the brick bridge over the Sele River (southern Italy), characterised by unique architecture of historical value, dating from the mid-nineteenth century [38].
Description of available free software for SfM technology and comparative studies of the use of four programs (COLMAP, OpenMVG, Theia and VisualSFM) to create 3D models of several different objects of sizes from 1 to several meters is presented in [2].
In the light of the works discussed, it appears that the application of the SfM method can be found in various fields: cultural heritage, museology, archeology, geography, as well as medicine and even forestry. The cited works also present other technologies of 3D data acquisition of digitised objects. They most often present case studies, and methodological issues are discussed marginally. There is a lack of research that would concern comparative analyses of 3D models obtained by various methods. Only one work was found [39], in which the authors compared the 3D models obtained using four different methods: structured light scanning, triangulation laser scanning, photometric stereo and close-range photogrammetry. This article attempts to answer questions about the efficiency and effectiveness of data acquisition methods and for the creation of 3D models as well as various applications in research and dissemination. Considering the repeatability, time and resource implications, qualitative and quantitative potential, and ease of use, studies of the strengths and weaknesses of these four methods are presented.
In the present work, an attempt is made to fill in the existing gap and present a comparison of the 3D SLS and SfM methods on the examples of digitisation of the same objects representing artefacts of material cultural heritage.

3. Method and Materials

3.1. Structured-Light 3D Scanning

Structured light scanners are active devices because they emit light beams from their own source. Scanners of this type project an appropriate pattern of light (a series of fringes with different and, in addition, time-varying widths, a dot matrix or other shape) onto the digitised object. Thanks to this, it is possible to accurately capture the geometric shape of the analysed surface. A light beam with a defined pattern is produced by built-in LCD projectors or other sources. In existing structures, white light is most often used, but also blue or green. These devices also have two or more cameras, as well as detectors that analyse and calculate the distance of surface points in the field of view. Thus the transferred object to the digital world has real dimensions. It should be emphasised, however, that scanners of this type are very sensitive to lighting conditions. All shadows on the real object are mapped onto the generated digital 3D model. For this reason, using them outside can be quite problematic. These scanners typically do not (or even not at all) capture data from black, shiny or transparent surfaces. In such situations the solution used is a matted surface by covering them with a special spray with powder before scanning, which is not allowed when digitising historic artefacts due to their protection. Scanners of this design are characterised by high speed of data acquisition and accuracy of measurements up to several micrometers. These scanners work at short distances (usually 15–40 cm) and, importantly, some structures (e.g., by Artec) can be hand-held, which significantly increases the efficiency of work when using them. There are also known solutions that always have to be mounted on tripods (e.g., RangeVision Neo devices).
Currently, there are many 3D SLS design solutions on the market. Spider and Eva model scanners (Artec, Luksemburg, Luksemburg) are frequently used devices in museum conditions. The fact that these models belong to one manufacturer means that they have common software and the same configuration process. Their main advantage is the comfort of use, because they are light and small, and thus allow a full range of motion during scanning. The advantages also include precise texture and colour reproduction as well as high resolution of the obtained point clouds. This allows for precise examination of objects of various sizes and varied surfaces. The Artec Eva model is better suited for scanning simple geometries, while the Artec Spider model for objects with a complex structure and intricate patterns. It is important that they do not require the use of positioning markers while working, which makes them ideal for scanning museum artefacts. There is also no need to calibrate them before each scanning process, which significantly simplifies and speeds up the work. The specifications of both scanners are presented in Table 1.
These scanners are an effective solution for safe and non-contact digitisation of museum collections. The light with which the measurements are made is neutral for them, so they can also be used to scan very delicate, old and valuable objects. Of course, there are other solutions for devices of this class. Study [40] presents data of the devices compared and parameters of the 3D models obtained.

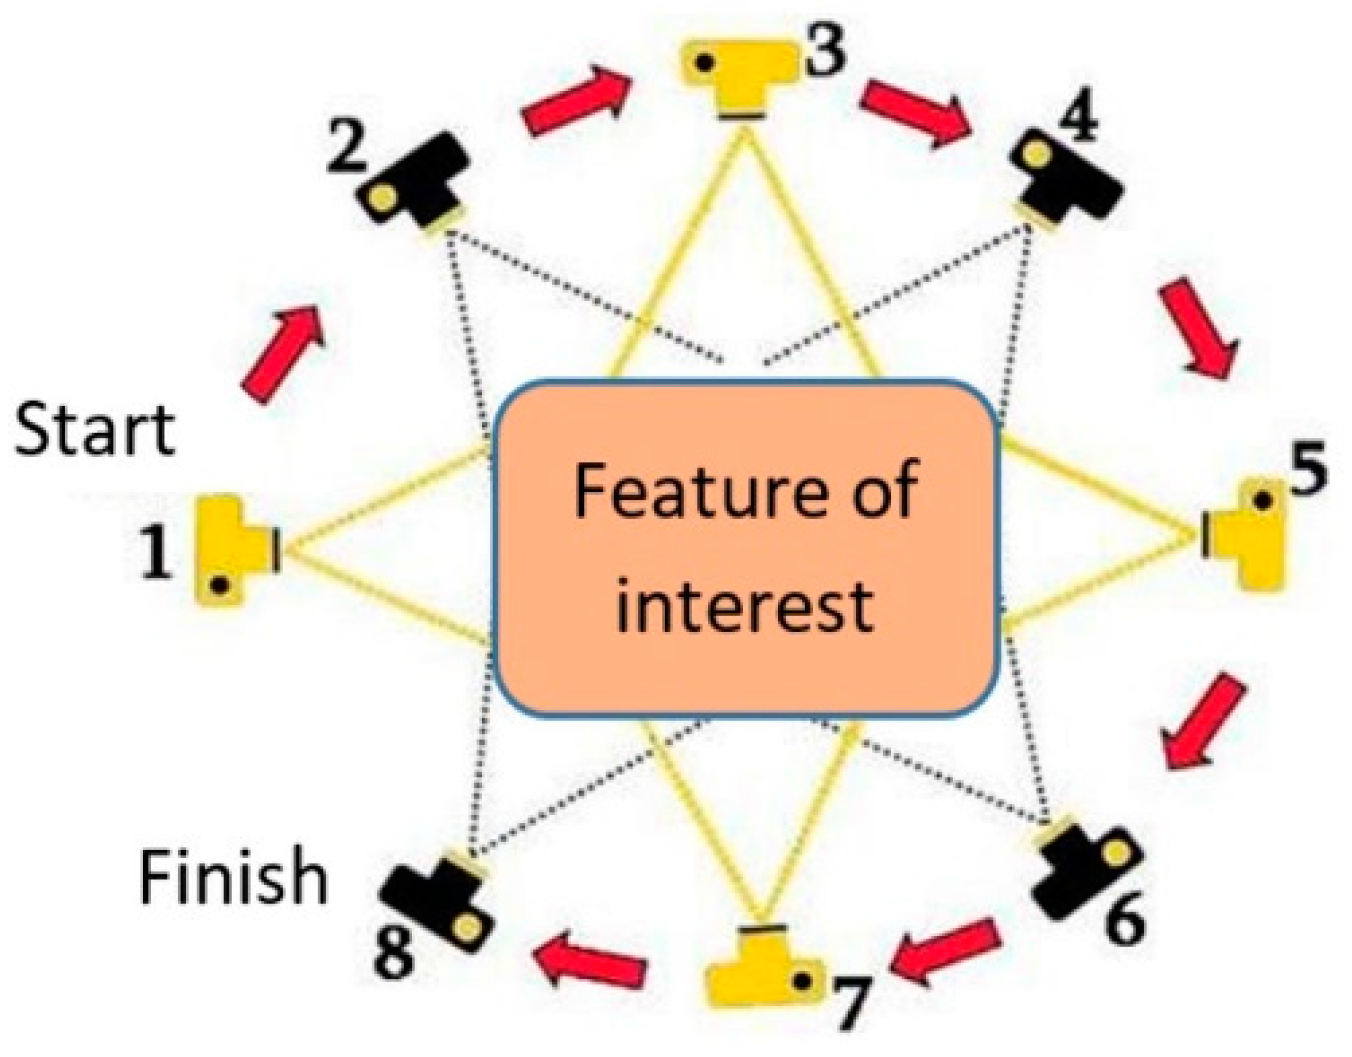
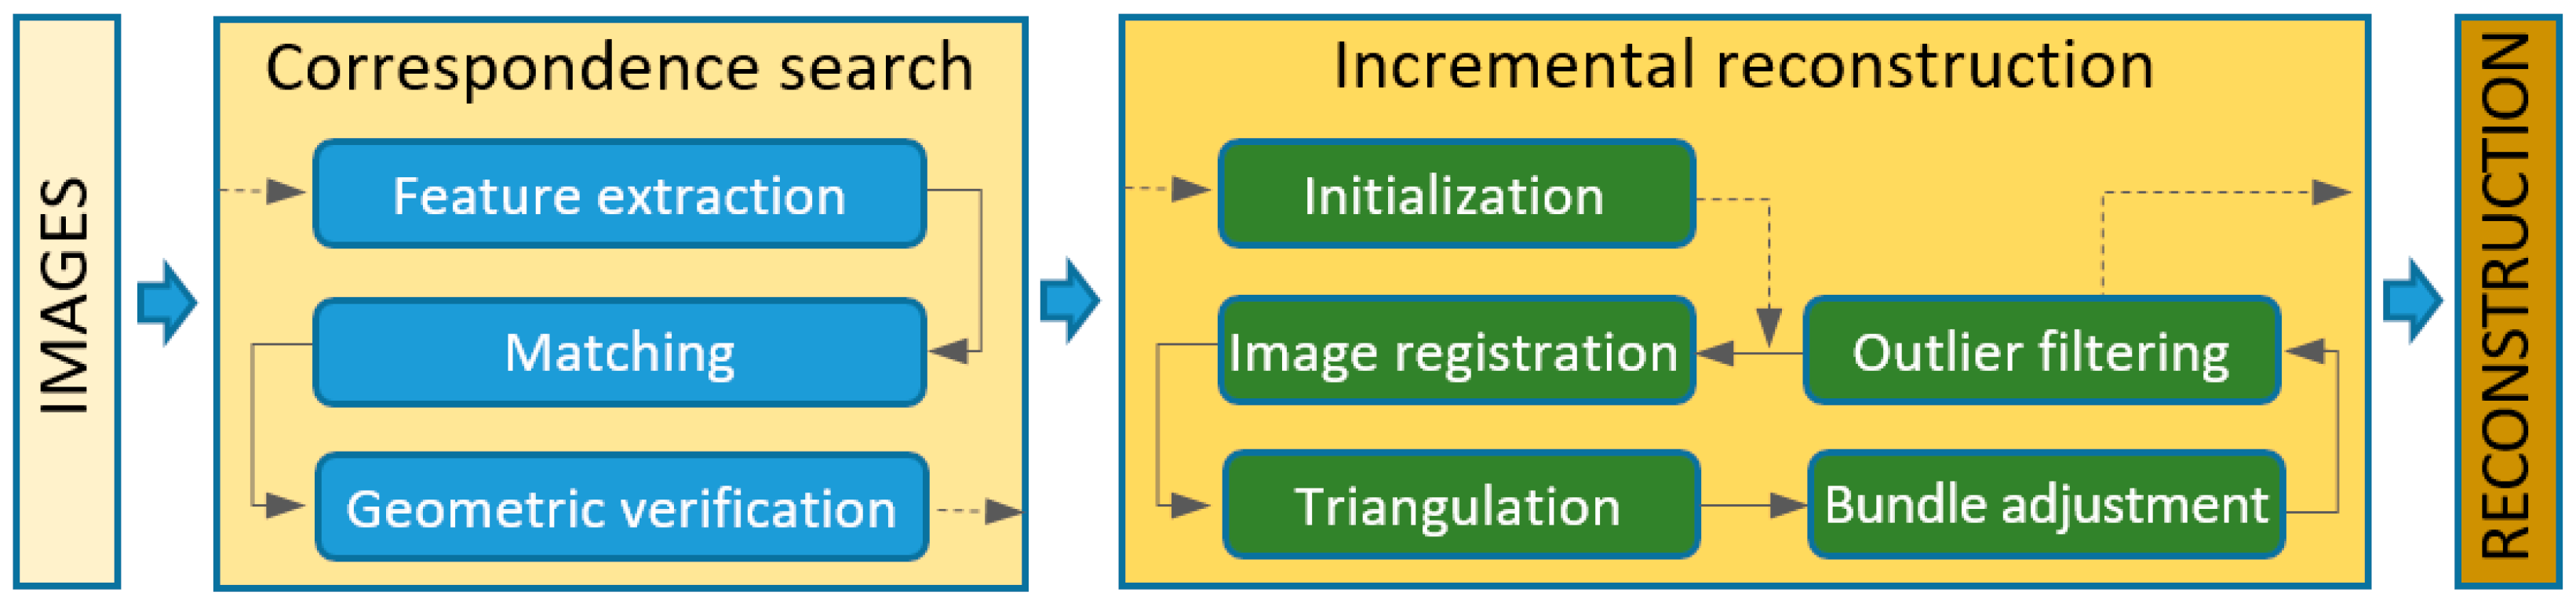
3.2. Structure from Motion

The SfM method, belonging to the passive data acquisition technology, allows to create digital 3D models based on many two-dimensional images (photos). To generate a three-dimensional model, one needs a series of images of an area or object with a large overlap (about 80%), taken at different angles and at different distances, Figure 1 [41]. An average quality camera is sufficient to take pictures, and now even a camera built into a smartphone, making this method a low-cost solution. The smartphone is considered a device of common use, because its price in relation to the many different possibilities it offers to each owner is relatively low.
In the SfM method, a series of photos is a set of data that is imported into an appropriate computer program dedicated to this method. This software allows to generate 3D models and textures. Today, there are many programs available, both free and open-source, such as Meshroom [42,43], Colmap [44], VisualSFM [45], and commercial: Agisoft PhotoScan, Capturing Reality RealityCapture [2].
The general process of incremental SfM operations is shown in Figure 2 [44]. It can be broken down into two main modules: correspondence search and incremental reconstruction. The first module aims to search for complete and diffuse matches specific to two images. It has three sub-steps: feature extraction, feature matching, and geometric verification. The second module aims to estimate the alignment of images and three-dimensional scene points. It is possible thanks to the following steps: initialisation (selection of the best pair of images), image registration (for orientation), triangulation (calculation of 3D points), adjustment of the beam (local and global improvement) and removal of outliers.

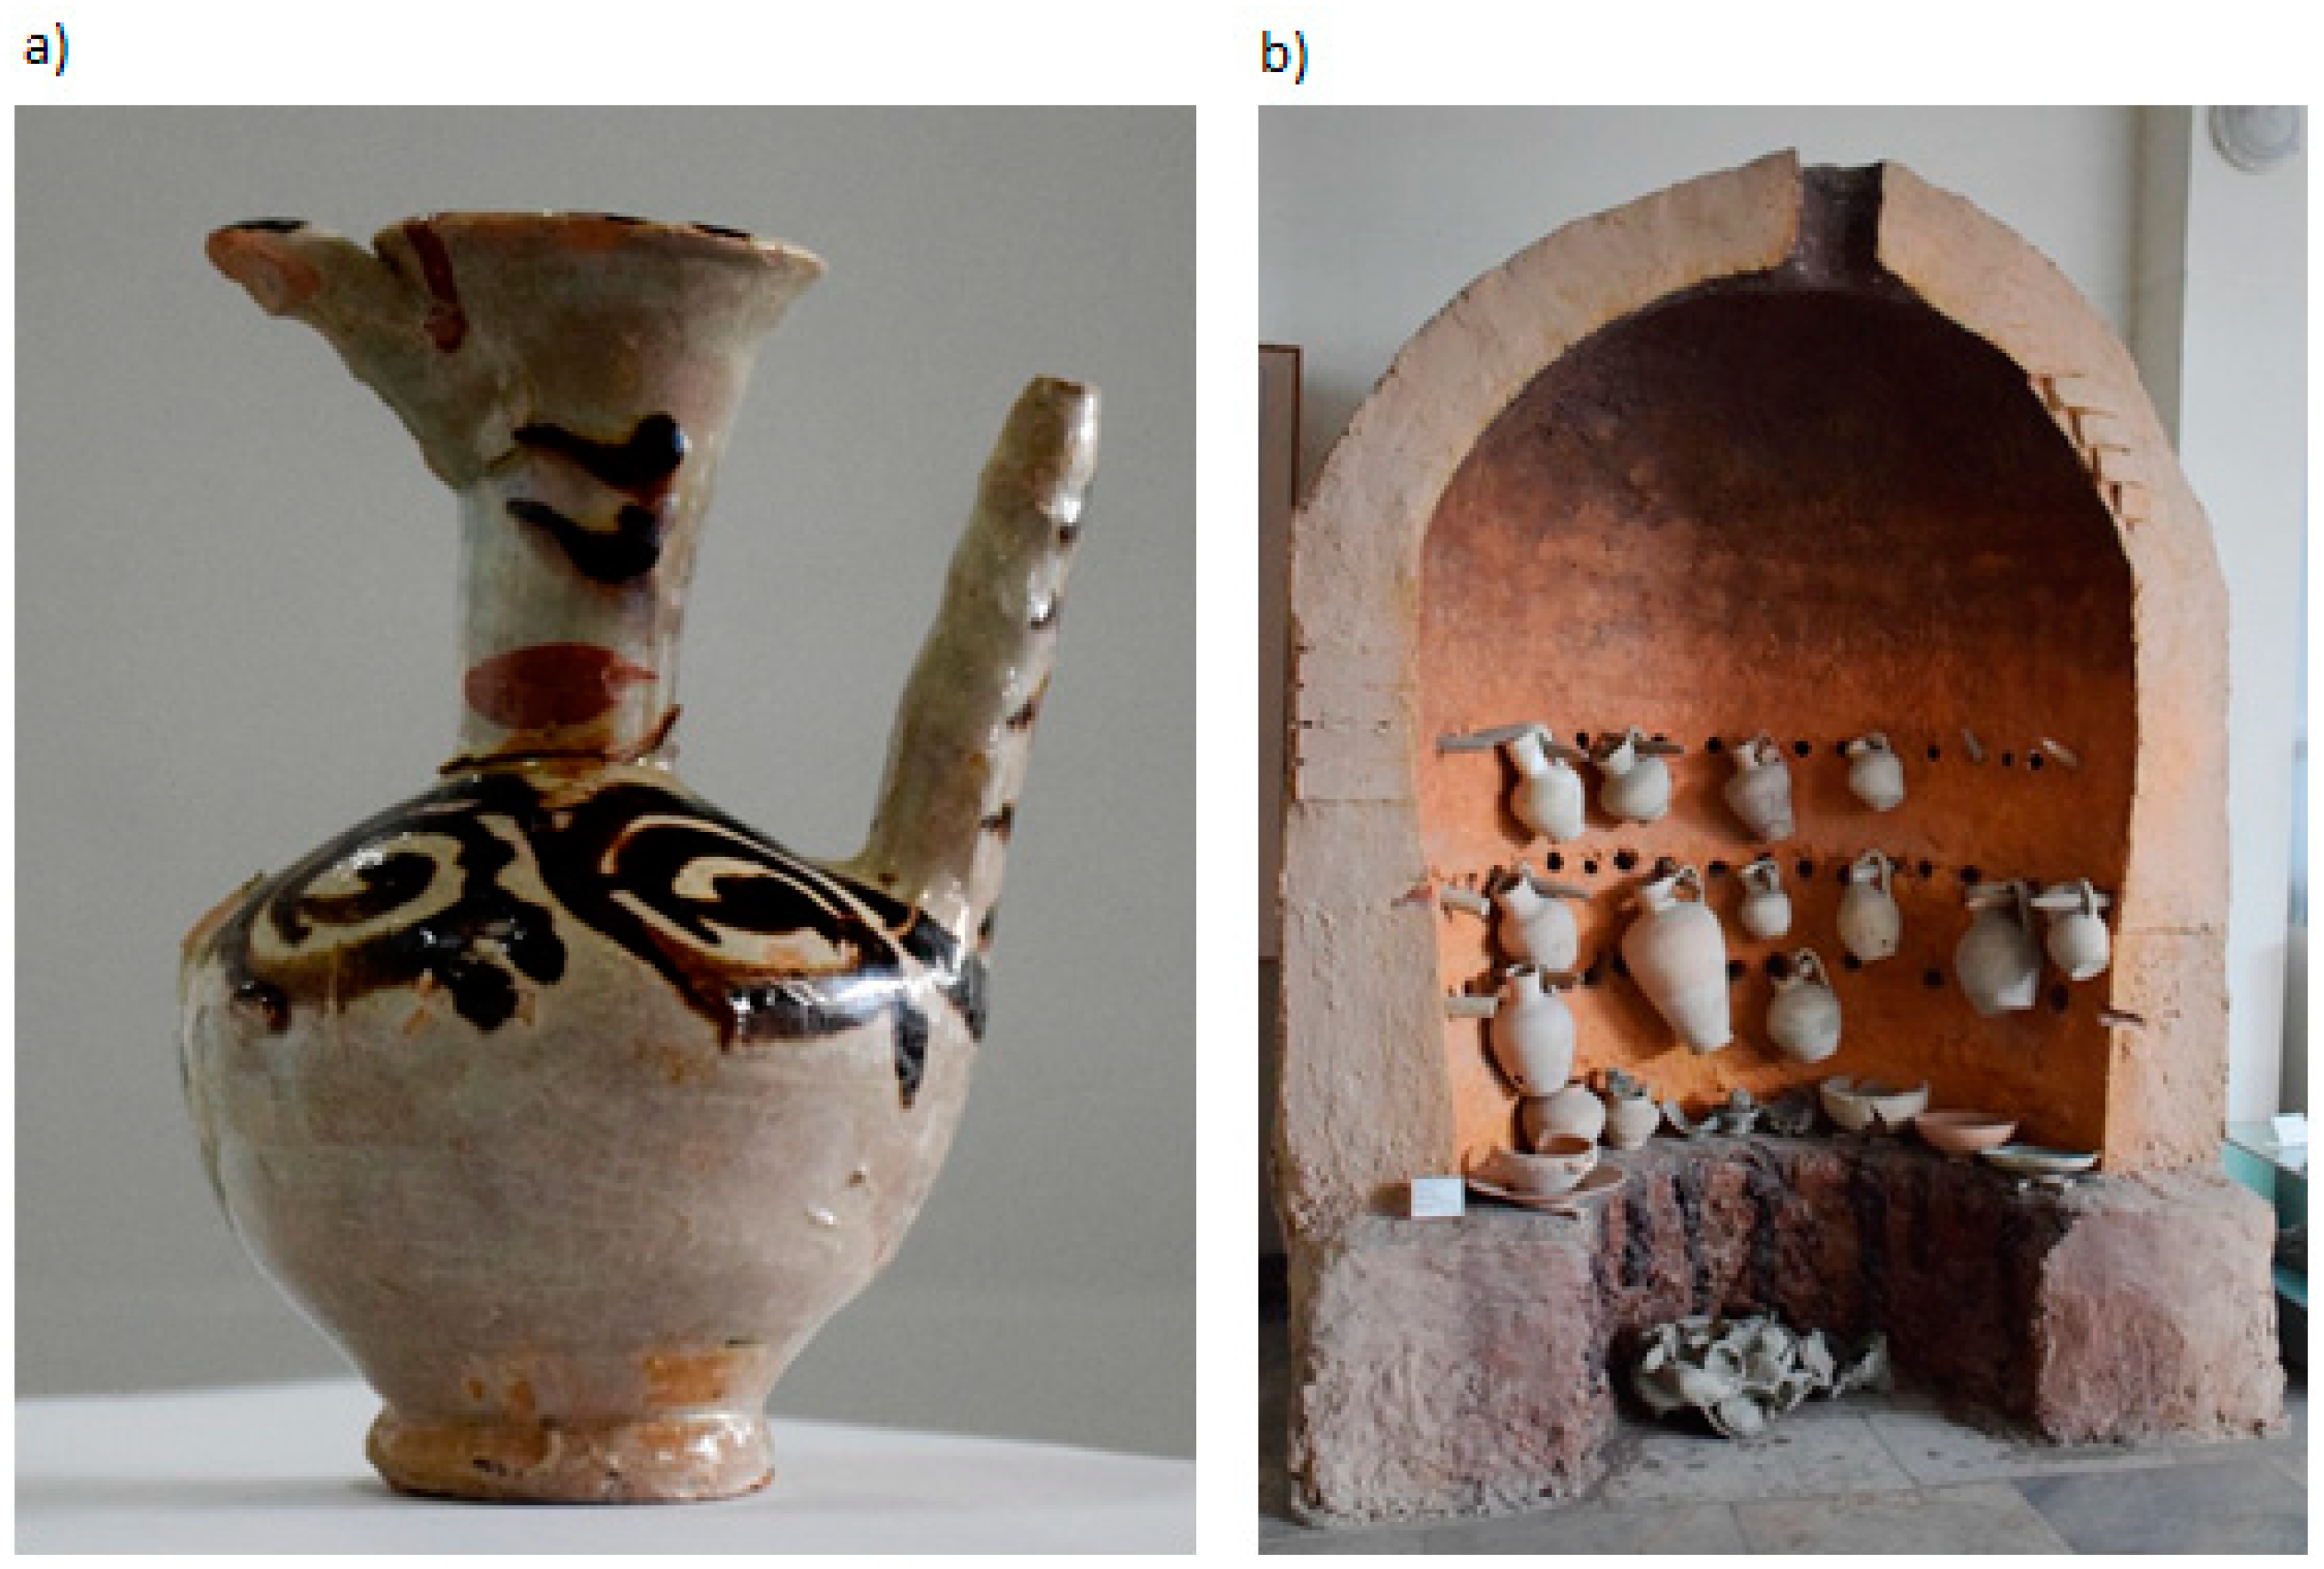
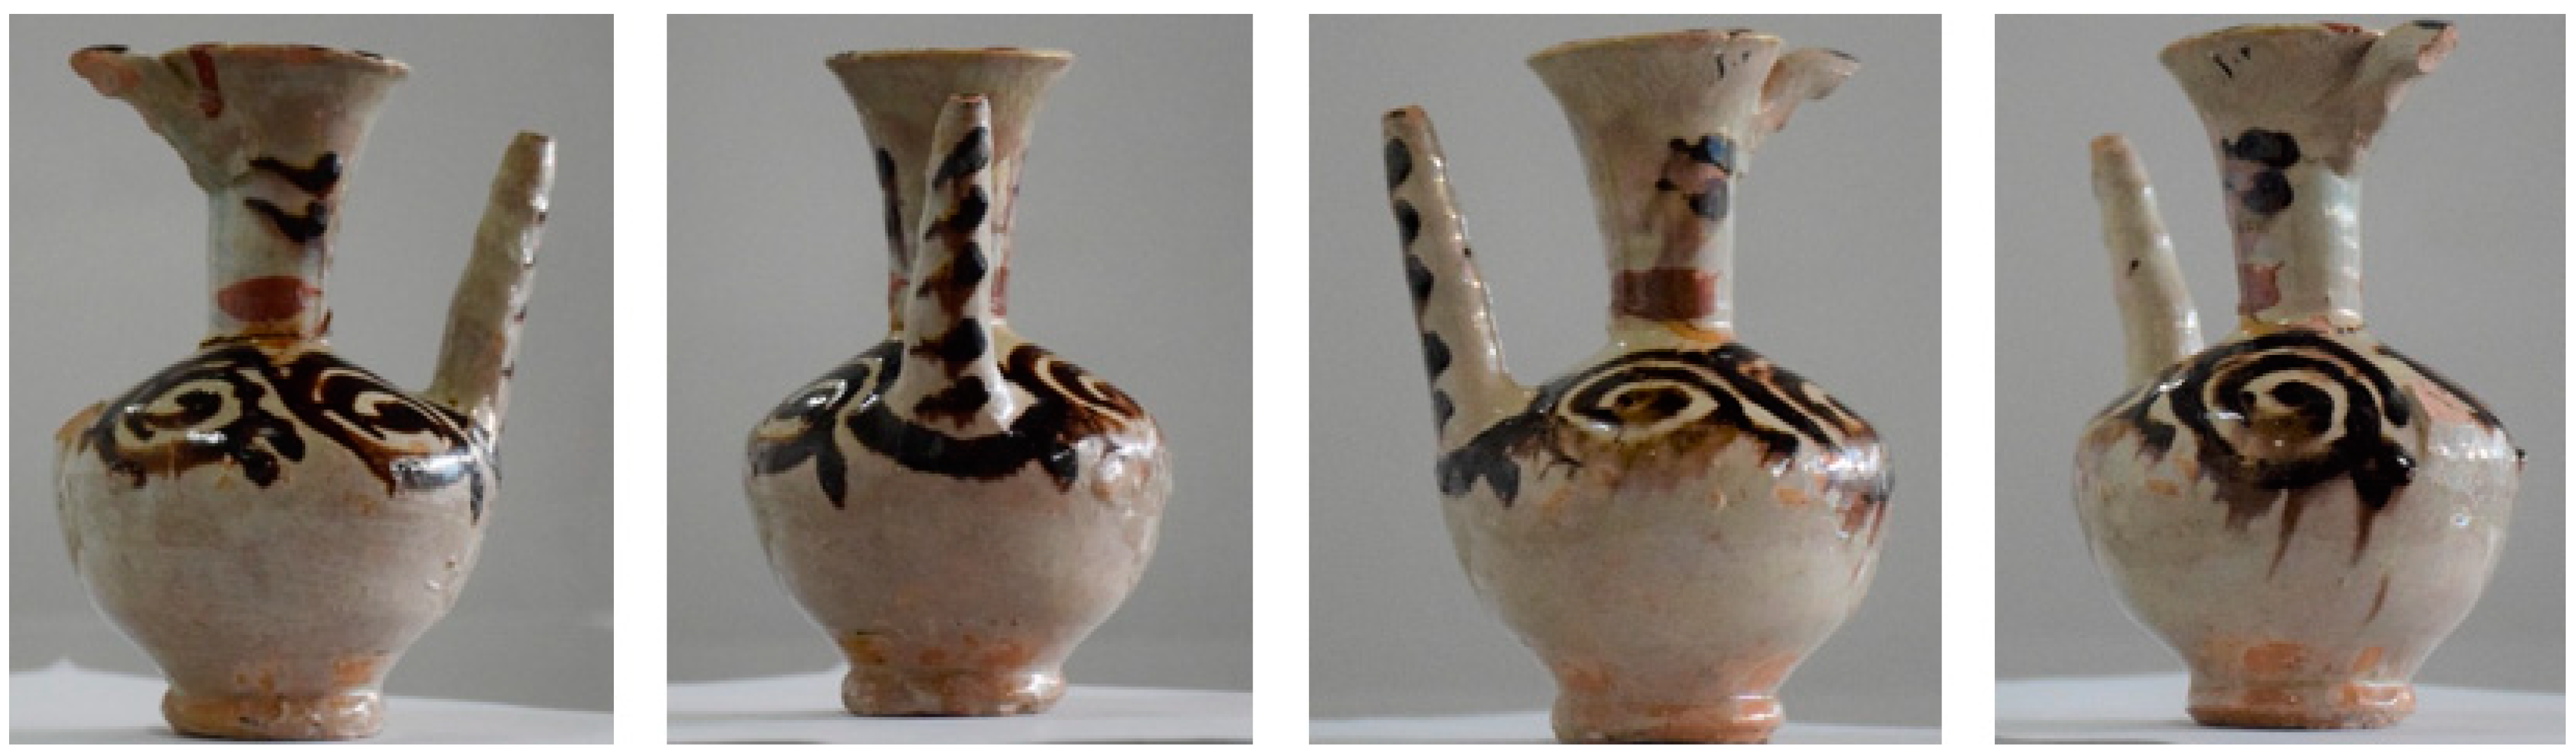
3.3. Description of the Objects of the Experiment

The Afrasiyab museum has exhibits from the city’s excavation site. A trading city on the Silk Road, Samarkand was known from the 5th century BC, and was destroyed in 1220 by the invasion of Genghis Khan [46]. Currently, excavation sites covering an area of nearly 200 hectares are located within the administrative area of Samarkand (Uzbekistan). Selected exhibits from this museum have been described and presented using VR exposure [47]. Two very different objects were selected for the comparative analysis of digital three-dimensional models. The first object is a small glazed jug from the turn of the 11th–12th centuries [48]. The shape of the jug is typical of this period and region of origin, it is only 14.1 cm high and 8.9 cm in diameter. A characteristic feature of the jug is a long narrow funnel and a handle placed on the opposite side, of which, in this example, only the upper part of Figure 3a has been preserved. The second object is a reconstructed pottery kiln, 276 cm high, 219 cm wide and 110 cm deep. This object stands against the wall of the exhibition hall and is only accessible from the front, Figure 3b. To make its interior visible, a longitudinal section of the entire facility was made, and for exhibition purposes, jugs of various types and sizes were hung in several rows on the furnace wall, and several bowls and plates were placed inside.

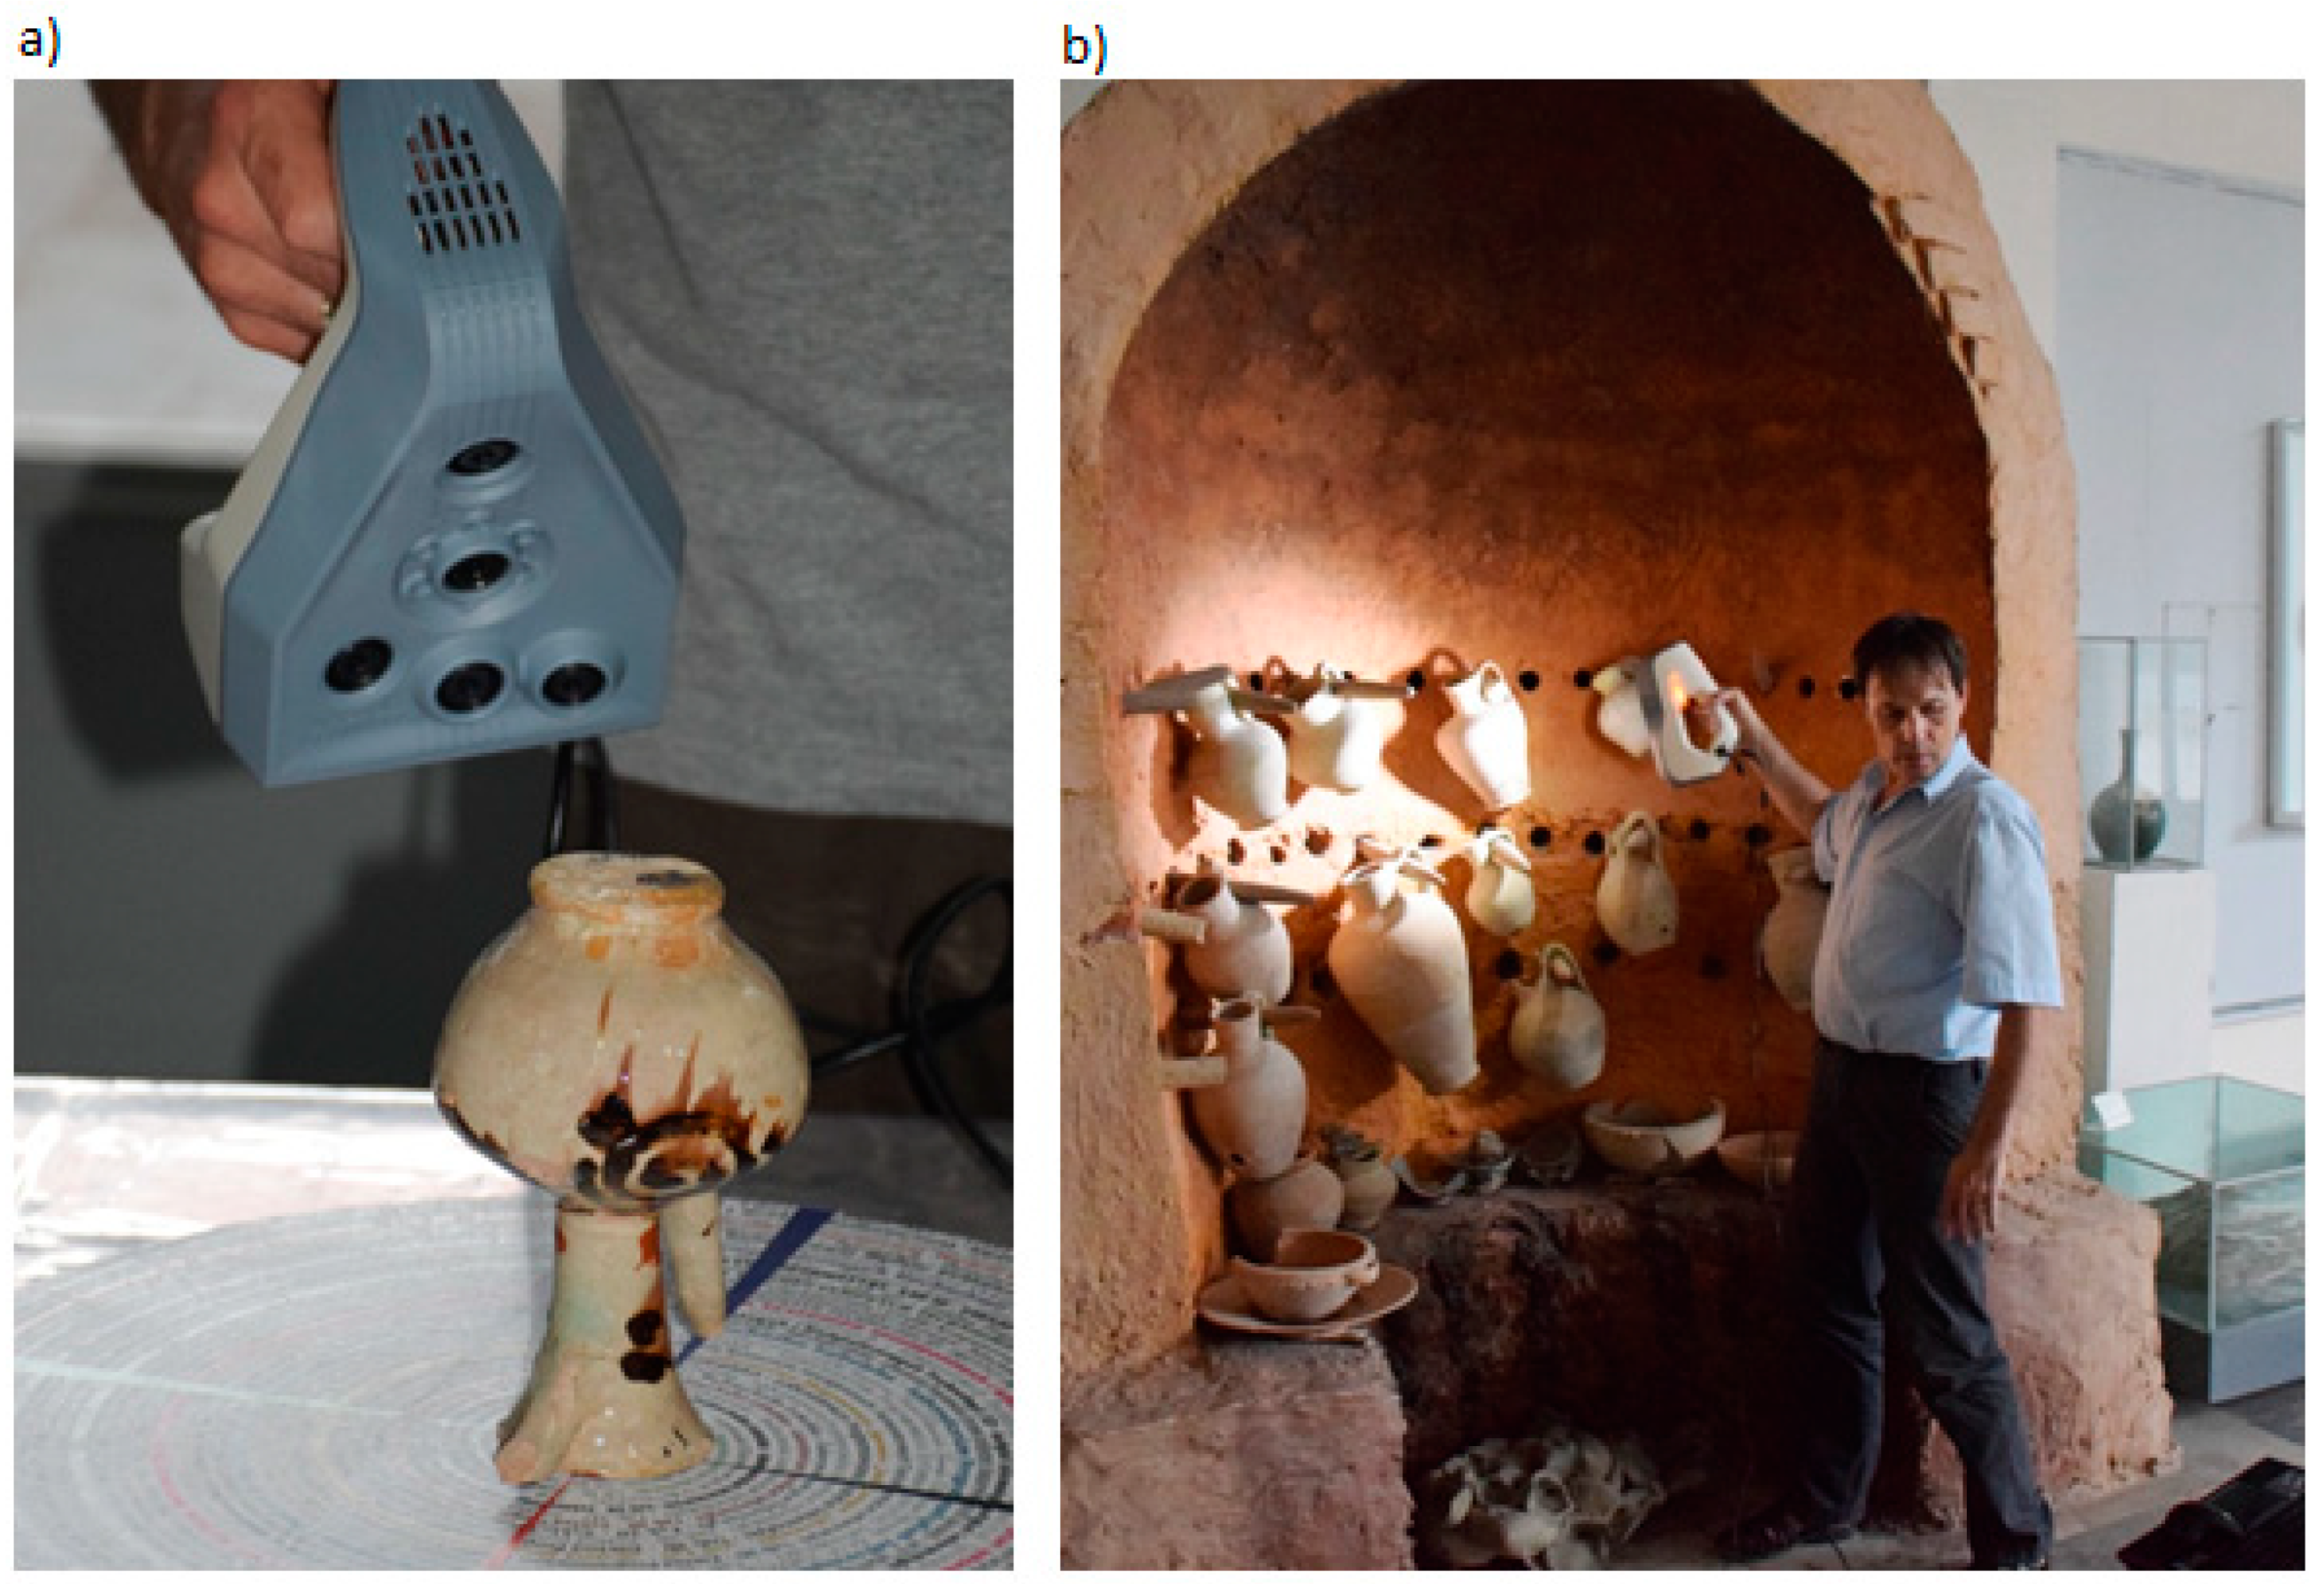
3.4. 3D SLS Scanning and Postprocessing of the Jug and the Oven

3D scanning was performed in situ. Two handheld 3D SLSs were used for scanning: Artec Spider for digitising the jug and Artec Eva for scanning the furnace, beside a laptop with a 4-core processor and 16 GB of operating memory, Figure 4. Thanks to this, trouble-free and failure-free operation of scanners and quick processing of downloaded data was ensured. The dedicated software for Artec Studio scanners, version 12 Professional, was responsible for all activities related to data acquisition. The process of scanning the furnace, due to its large size and the complicated shapes of the vessels there, was significantly more difficult.
Artec Studio software version 15 Professional and a computer equipped with an Intel Core i7 (3.4 GHz) processor, 64 GB RAM and an NVIDIA GeForce GTX 1080 graphics card with 8 GB internal memory were used to process the data obtained in the process of scanning the jug and stove. The stages of data processing in the form of 3D SLS point clouds on the example of a jug are shown in Figure 5.
The final result of the post-processing is a mesh model of the jug and stove with the texture applied, which are exported to files in the .obj format. This format stores data about the spatial model, ie geometry, as well as information about its colour and texture (which is impossible when saving to the .stl format). The texture has been exported to a separate file and saved as a .jpg format. Models in .obj formations are described using polygons, Bezier curves and NURBS surfaces, which allows for seamless exchange and transfer between different applications for 3D graphics, minimising the risk of damage.

3.5. Structure from Motion Jug and Stove

The process of photographic documentation of the jug and the stove was carried out in situ by partners from Uzbekistan using a non-metric compact camera (D5300 digital SLR camera, Nikon, Tokio, Japan, equipped with a Nikkor lens with a focal length of 18–140). When taking pictures, the camera was moved in such a way that the following pictures cover more than 60% of the previous picture. Pictures were taken holding the camera in hand (without a tripod) at different distances and angles. They were saved in the .jpg format and had dimensions of 4496 × 4000 pixels and a resolution of 300 dpi (horizontally and vertically). Pictures of the jug were taken with the following camera parameters: exposure time 1/60–100 s, focal length 48–56 mm, maximum aperture 4.4–4.5. 49 photos were taken with a total size of 176 MB. In turn, 31 photos of the furnace (total size 112 MB) were taken with similar settings. The smaller number of photos was due to the fact that the stove was adjacent to the wall and was only visible from the front (Figure 3b).
The data processing (2D photographic images of the jug and the oven) to create three-dimensional mesh models and textures was carried out using the free Meshroom [42,43] v2020.1.1 version available under open-source license. The works were carried out on the same computer equipment as for the 3D SLS method. The steps of the data processing on the example of a jug are shown in Figure 6.

3.6. Comparison of Data Acquisition Methods and Creating 3D Models

Acquiring data about a three-dimensional object using methods with completely different operating principles means that the user/museologist who would like to use them in practice must properly understand what is available and how it can be processed. Table 2 presents the main features and properties describing the process of data acquisition and processing to obtain digital 3D models of objects using Structured-light 3D Scanning (3D SLS) and Structure from Motion (SfM).

4. Results

The obtained results are divided into digitised objects (jug, oven), showing the visual effects of the generated 3D models, after using the 3D SLS and SfM methods, before and after their processing, and the tables present detailed parameter values describing mesh models and textures.

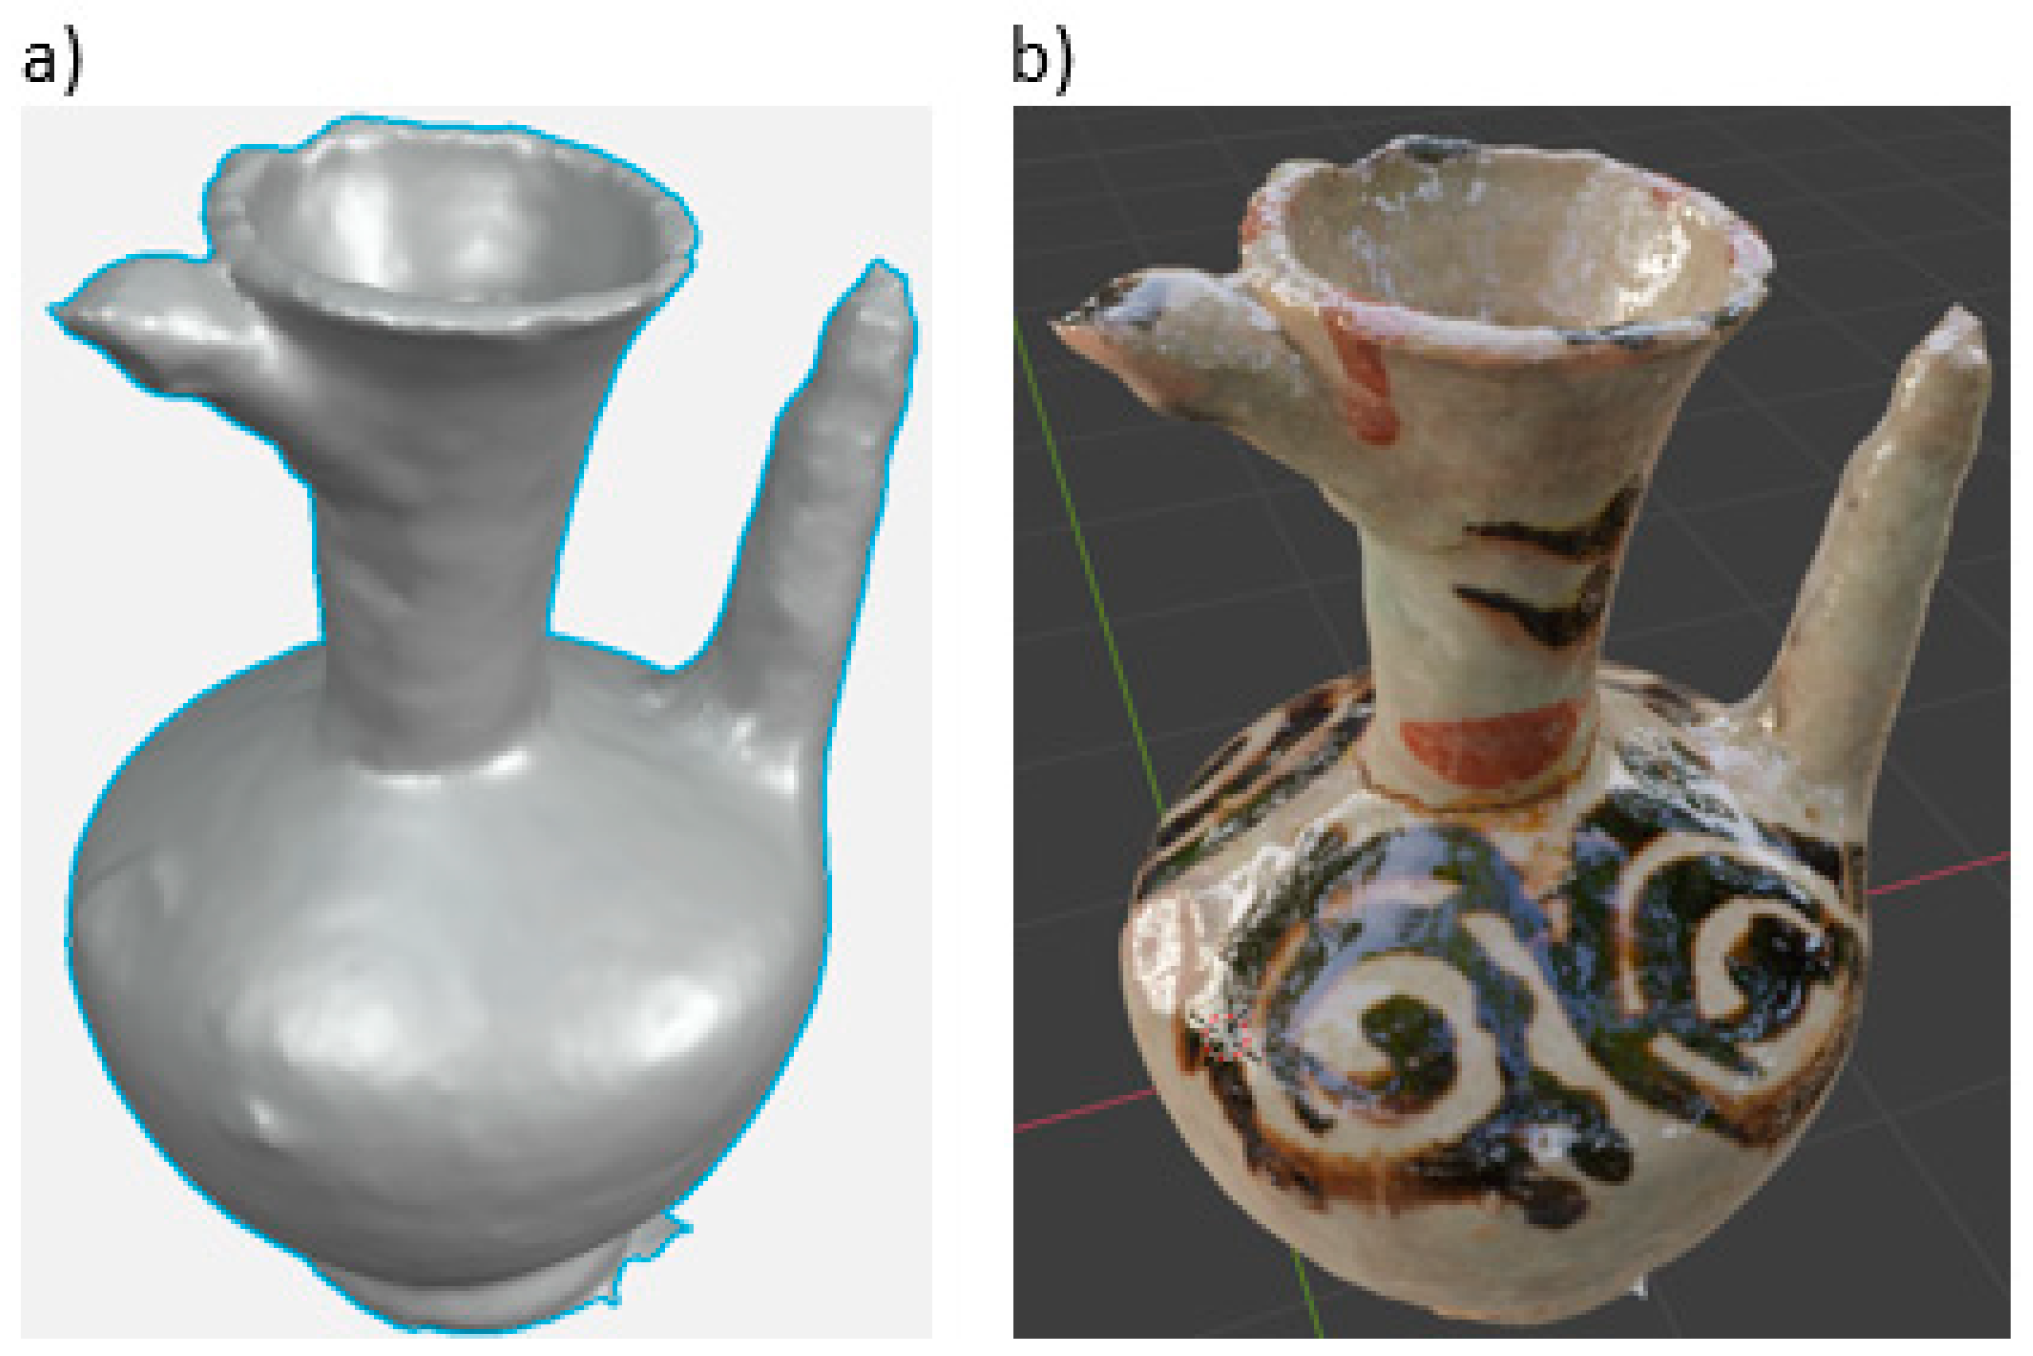
4.1. Digital 3D Models of the Jug

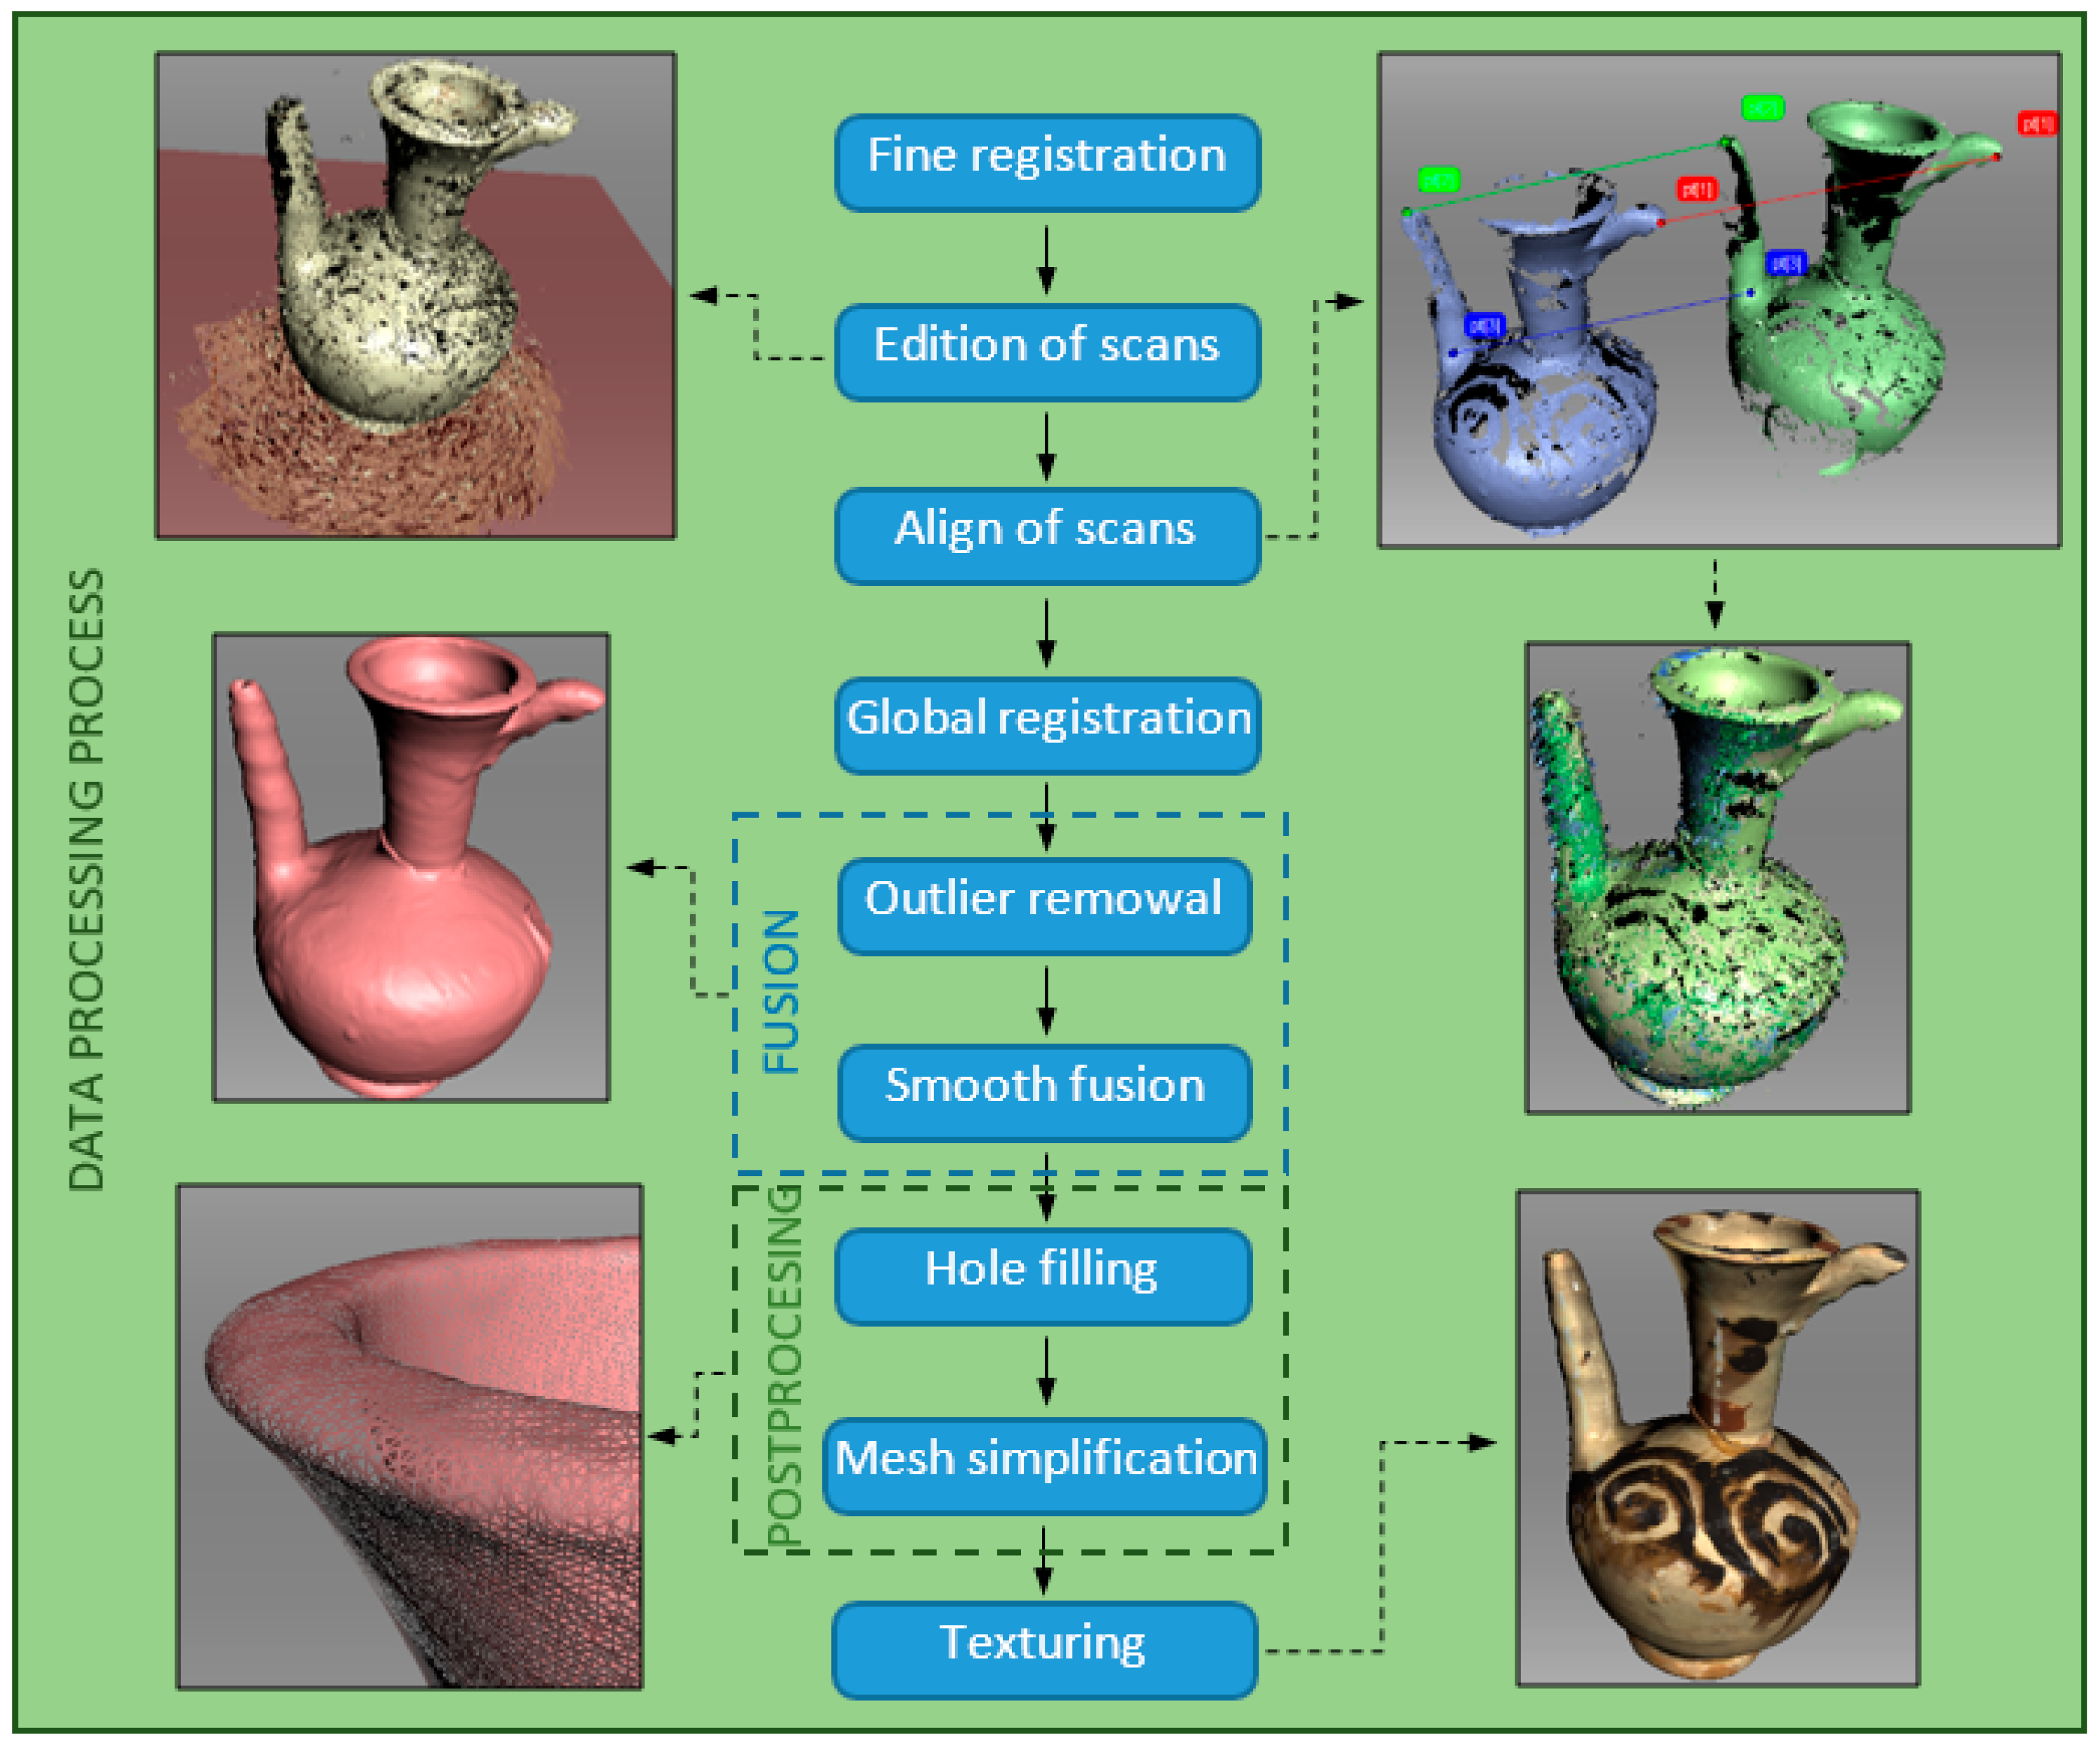
4.1.1. 3D SLS and Postprocessing

When scanning the jug (Artec Spider), three scans were made at different positions of the object on a manually rotated table covered with a special texture ensuring proper positioning of subsequent points of the surface taken from the object (Figure 4a). The resulting files containing all point clouds and object texture information were 1.12 GB in size. Information on individual scans is presented in Table 3.
After carrying out all stages of the postprocessing (Figure 5), a mesh model with 214,870 vertices and 429,736 faces was obtained. The size of the .obj file was 30.1 MB, while the texture for surface mapping with dimensions of 4096 × 4096 pixels and the horizontal and vertical resolution of 96 dpi saved in the .jpg format was 7.1 MB. The results of the SLS scanning of the jug are shown in Figure 7a,b.
Due to the large number of vertices and faces in the model grid and the large size of the .obj file (Table 4), the mesh was reduced using the free Blender program. For this purpose, the Decimate tool was used, which allows to change the coordinates of the vertices, and thus the walls, in relation to the original model. The Decimate tool permits one to modify the mesh of the model using one of the methods: Collapse, Un-Subdivide and Planar. Based on the experience gained earlier, the authors used the Collapse method. The actions performed led to a tenfold reduction of the model mesh, resulting in 21,488 vertices and 42,972 faces (Figure 7c,f). This resulted in the size of the .obj file being reduced to 4.31 MB. The texture has also been changed from 4096 × 4096 px to 2048 × 2048 px. The file size after .jpg optimisation was 953 kB. Despite the use of such large simplifications, they did not significantly deteriorate the quality of the model and its texture. It is true that there is no spiral in Figure 7d, which is visible in the base drawing (Figure 7a), but after applying the texture, the differences between the drawings are generally not visible (Figure 7b,e), and it is the 3D models covered with textures which are presented in virtual museums.

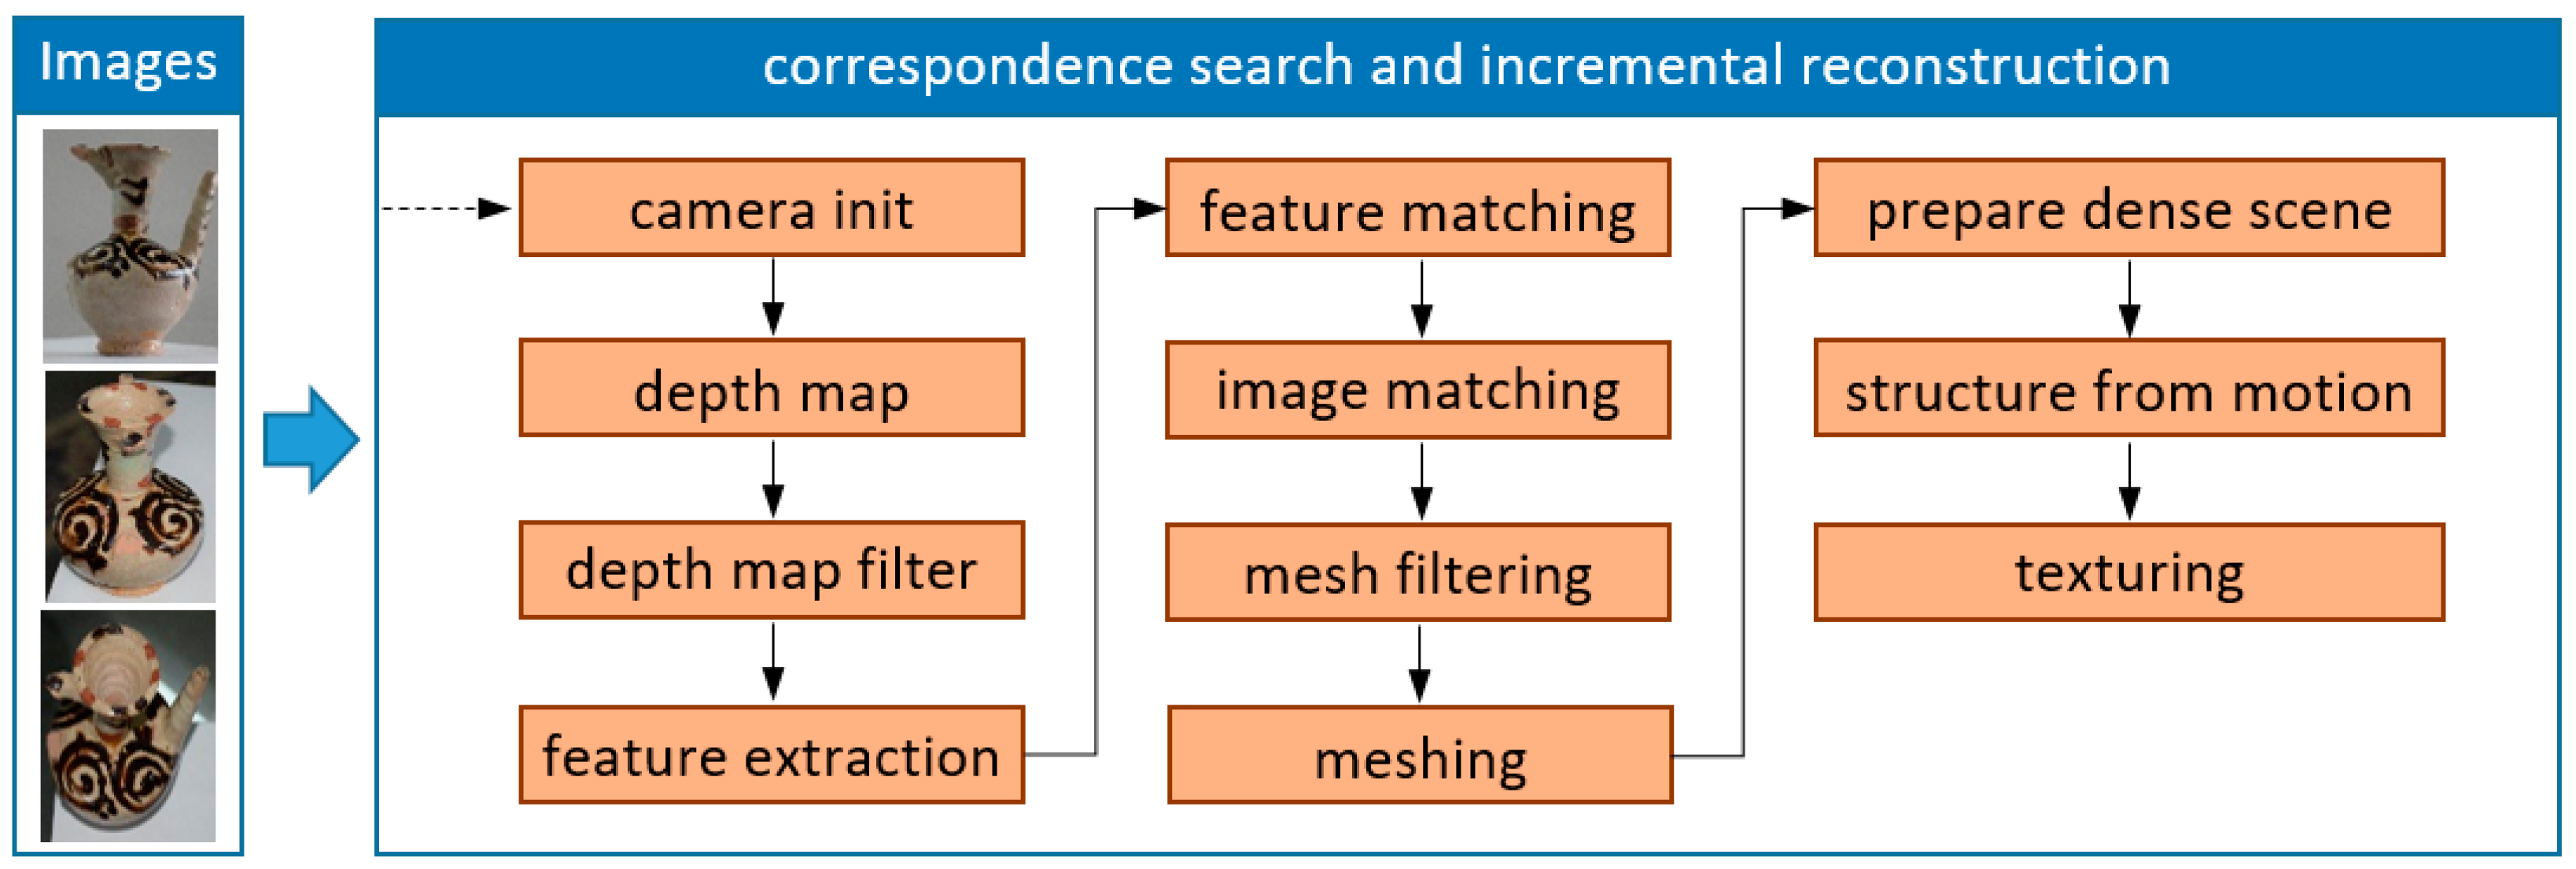
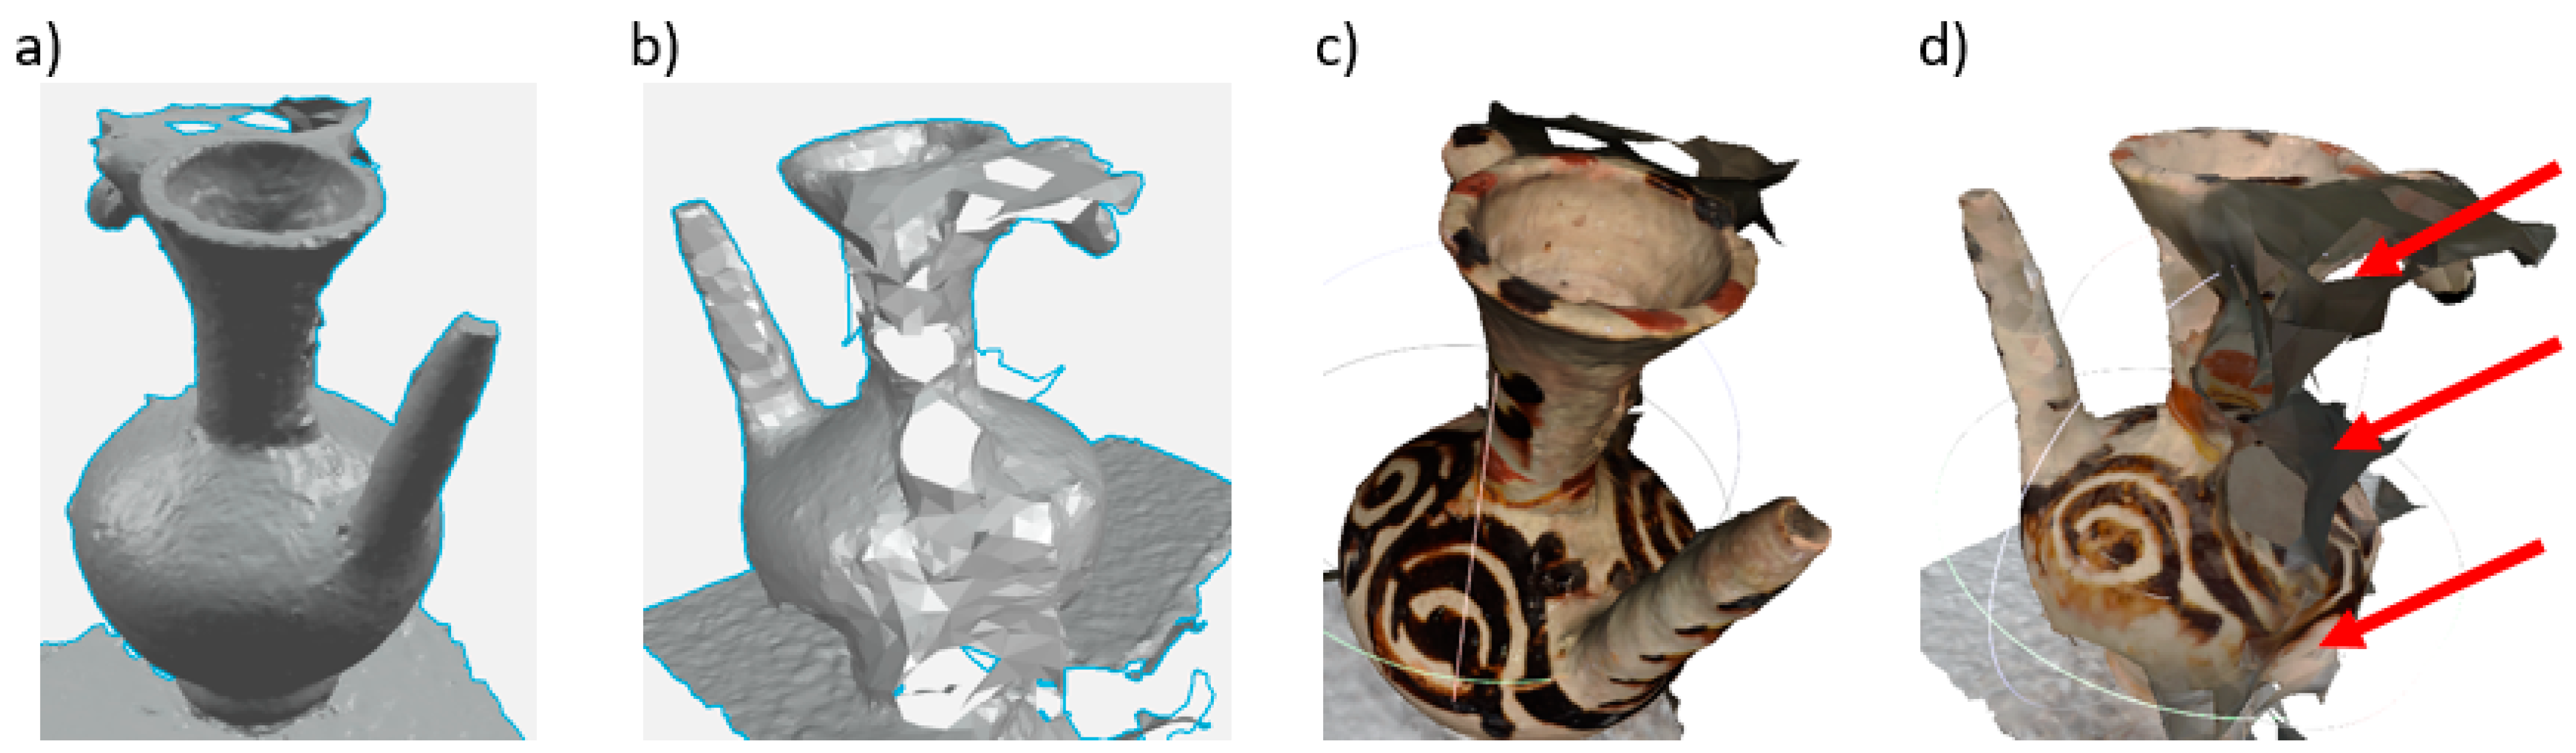
4.1.2. SfM and Postprocessing

The procedure shown in Figure 6 for creating a 3D model of the jug by the SfM method was used in two variants.
Option 1—use of original photos, without digital processing, see Figure 8.
After 49 photos were uploaded to Meshroom and verified by the software, only 28 photos were qualified for further analysis. After performing all steps of the procedure, the mesh model with the applied texture was obtained. The model was exported to a .obj file and the texture to a .jpg file. The appearance of the digital 3D model obtained from the original photos (untreated) is shown in Figure 9. It is clearly visible that on one side of the model the geometric surfaces and the texture were very well recreated (Figure 9a,c). This can be seen on the surface of the spout, neck and body of the jug. The edges of the spout are even and not jagged. On the other side of the model, however, there are many surface discontinuities, the mesh is heavily deformed (no smoothing, there are many outliers from the background of the photos, as shown by the arrows in Figure 9d). Outliers have been incorporated into the mesh causing additional distortions of the geometric surfaces of the model.
Option 2—using photos after processing, Figure 10.
The processing of the obtained photos consisted of cropping them and correcting the contrast and brightness in order to obtain objects with similar colours. Framing was carried out in such a way that the jug was located.
In this case, after loading 49 photos into Meshroom, only eight of them were rejected. Thus, the process of creating a 3D model was carried out using 41 photos. The obtained mesh model is shown in Figure 11. It is not difficult to notice that the obtained three-dimensional mesh model of the jug was significantly improved, all sides of the object were correctly recreated. Only some surface irregularities appeared on the spout and the walls of the neck and funnel (as shown by arrows in Figure 11b,d).
The improvement of the roughness of the jug surface was achieved by a smoothing process (Smoth modifier) performed with the use of the free Blender software, Figure 12.

4.1.3. Comparison of SLS and SfM Technologies

Collective parameters of digital 3D models (geometry and texture) of a pitcher made in SLS and SfM technology are presented in Table 4.
The analysis of the results in Table 4 and the visualisation from Figure 7 shows that in the case of the 3D model obtained from SLS after the 10-fold mesh reduction and 2-fold reduction of the texture dimension the visual quality of the model was maintained and the total file size decreased by more than eight times. This makes it possible to present such a model on websites. In the case of digital objects from SfM technology, the situation is different. The resulting primary model (with photo processing) has the total size (mesh model and texture) more than twice smaller than the SLS model. The surface smoothing process (with the mesh count unchanged) improved the visual quality of the model, but there was a significant increase in the size of its mesh model (by over 60%). Despite the still inferior visual quality of this model, its total size is approximately five times larger than that of the SLS model. Thus it seems that its suitability for presentation on the web becomes more problematic.

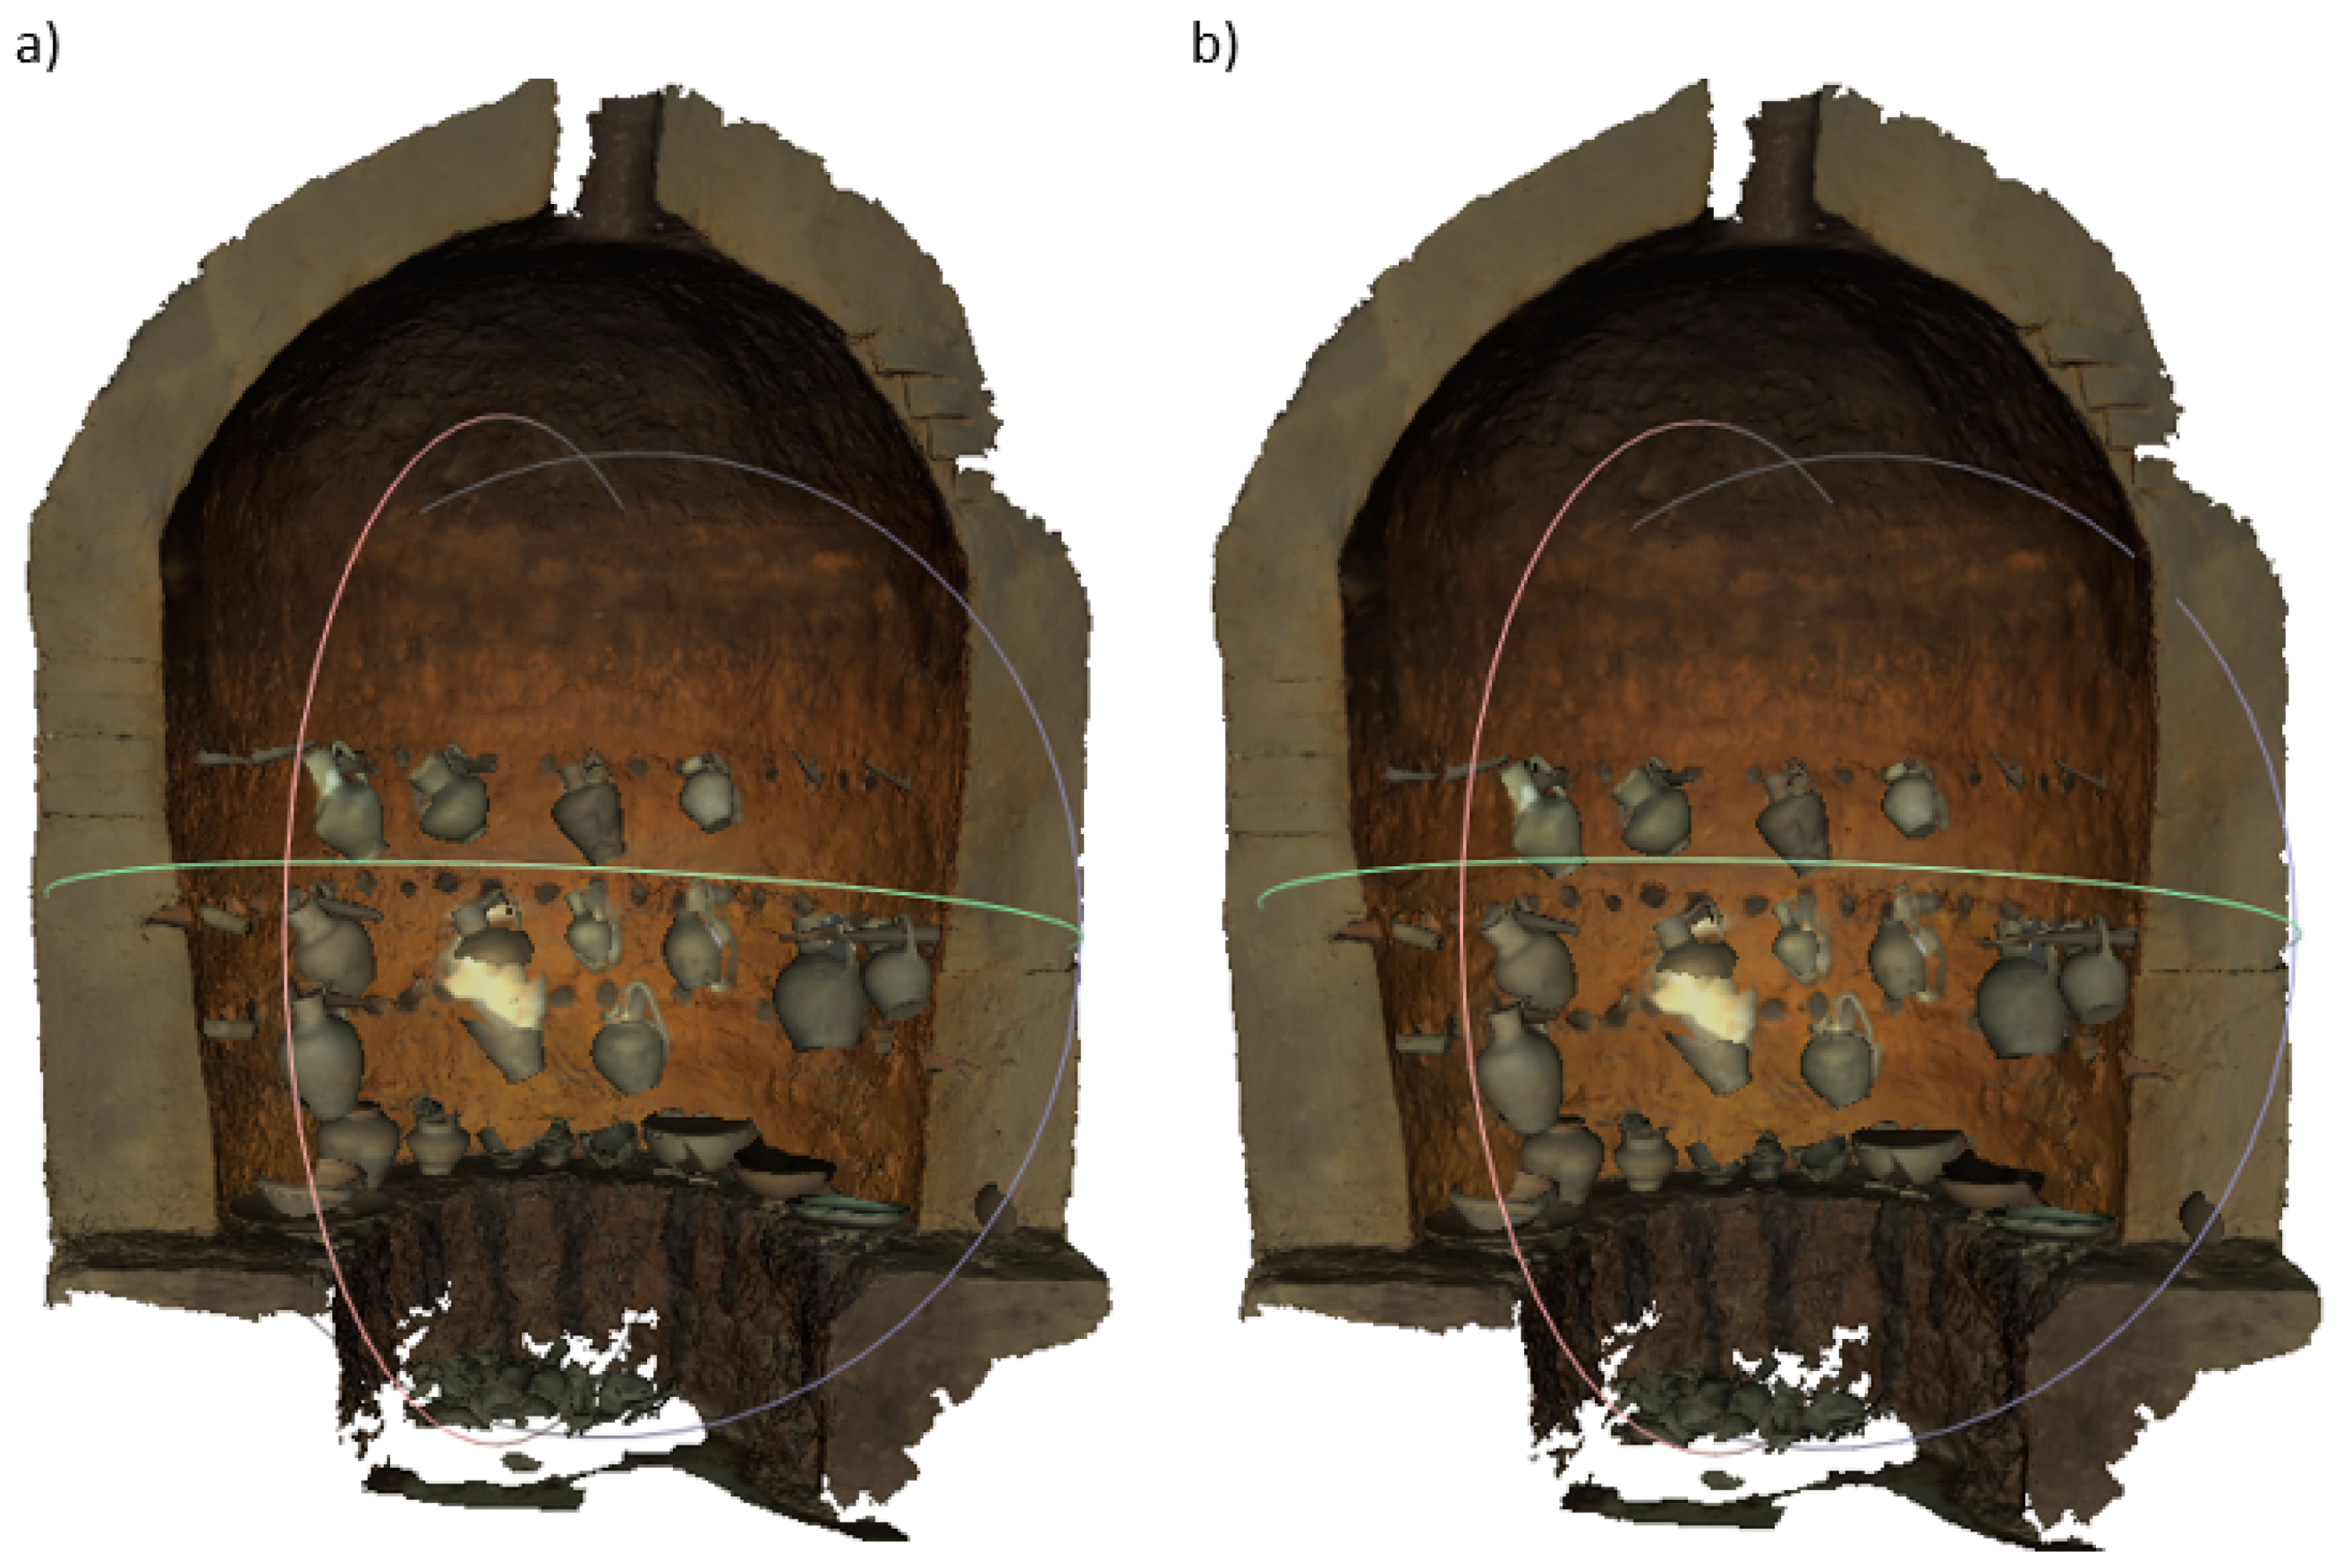
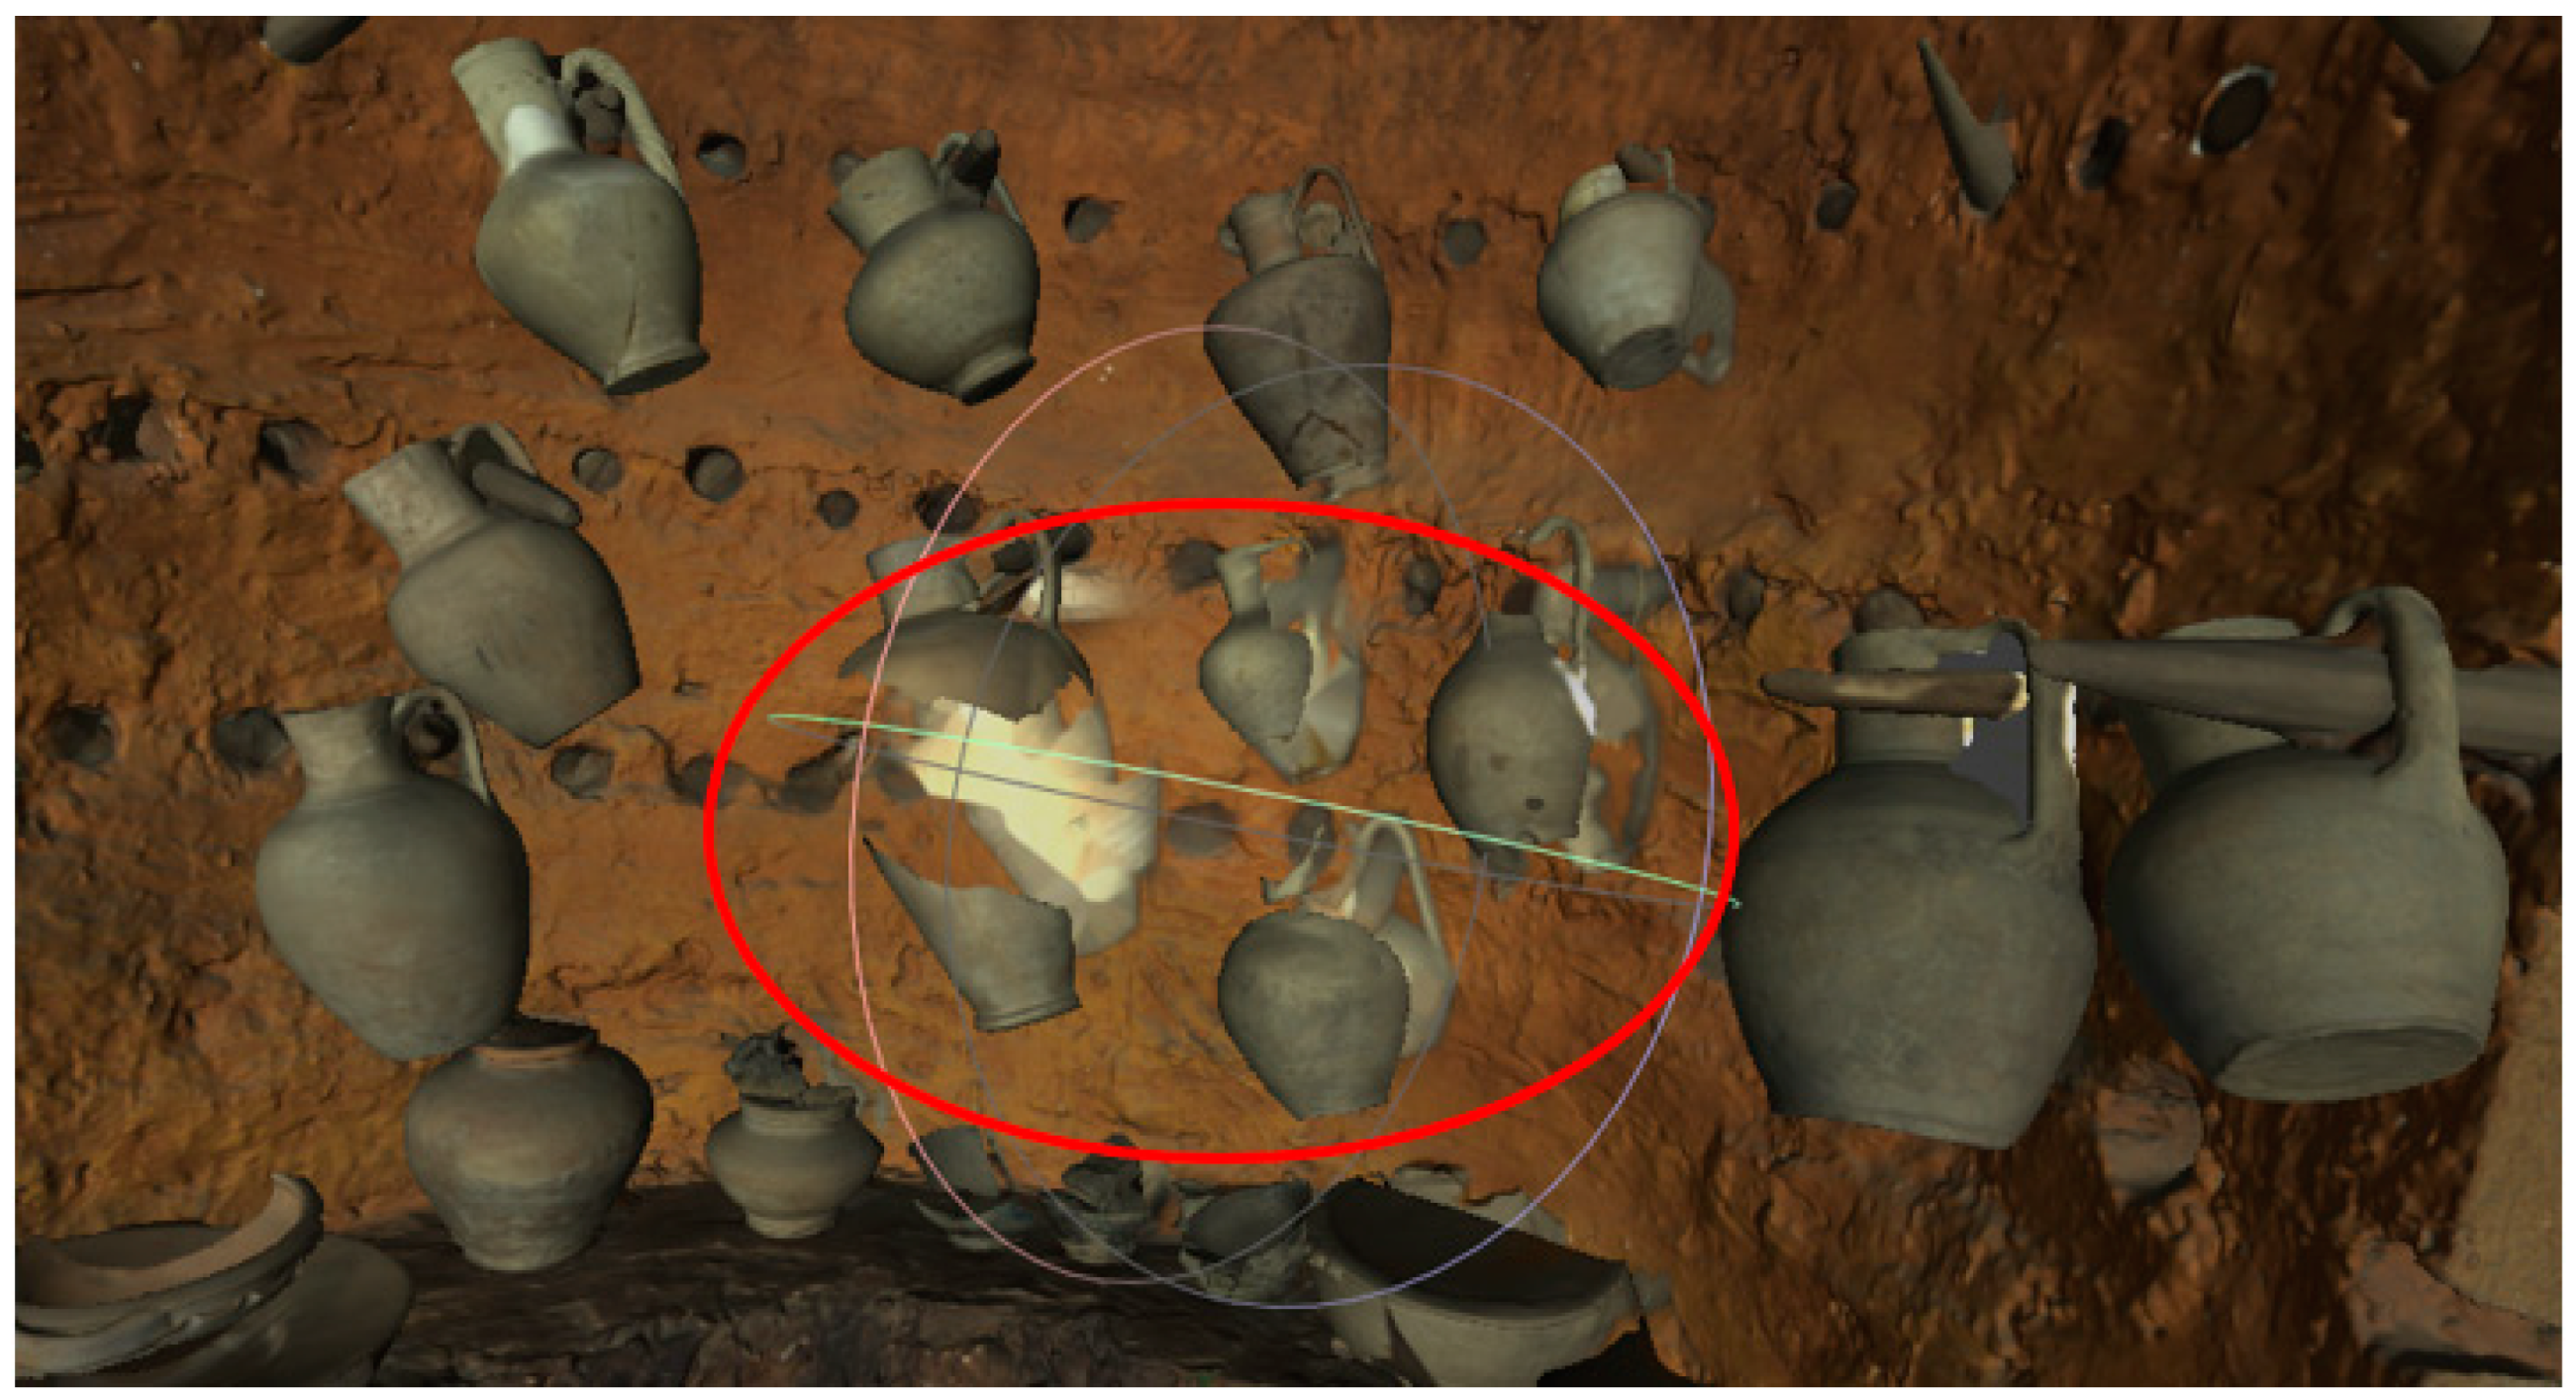
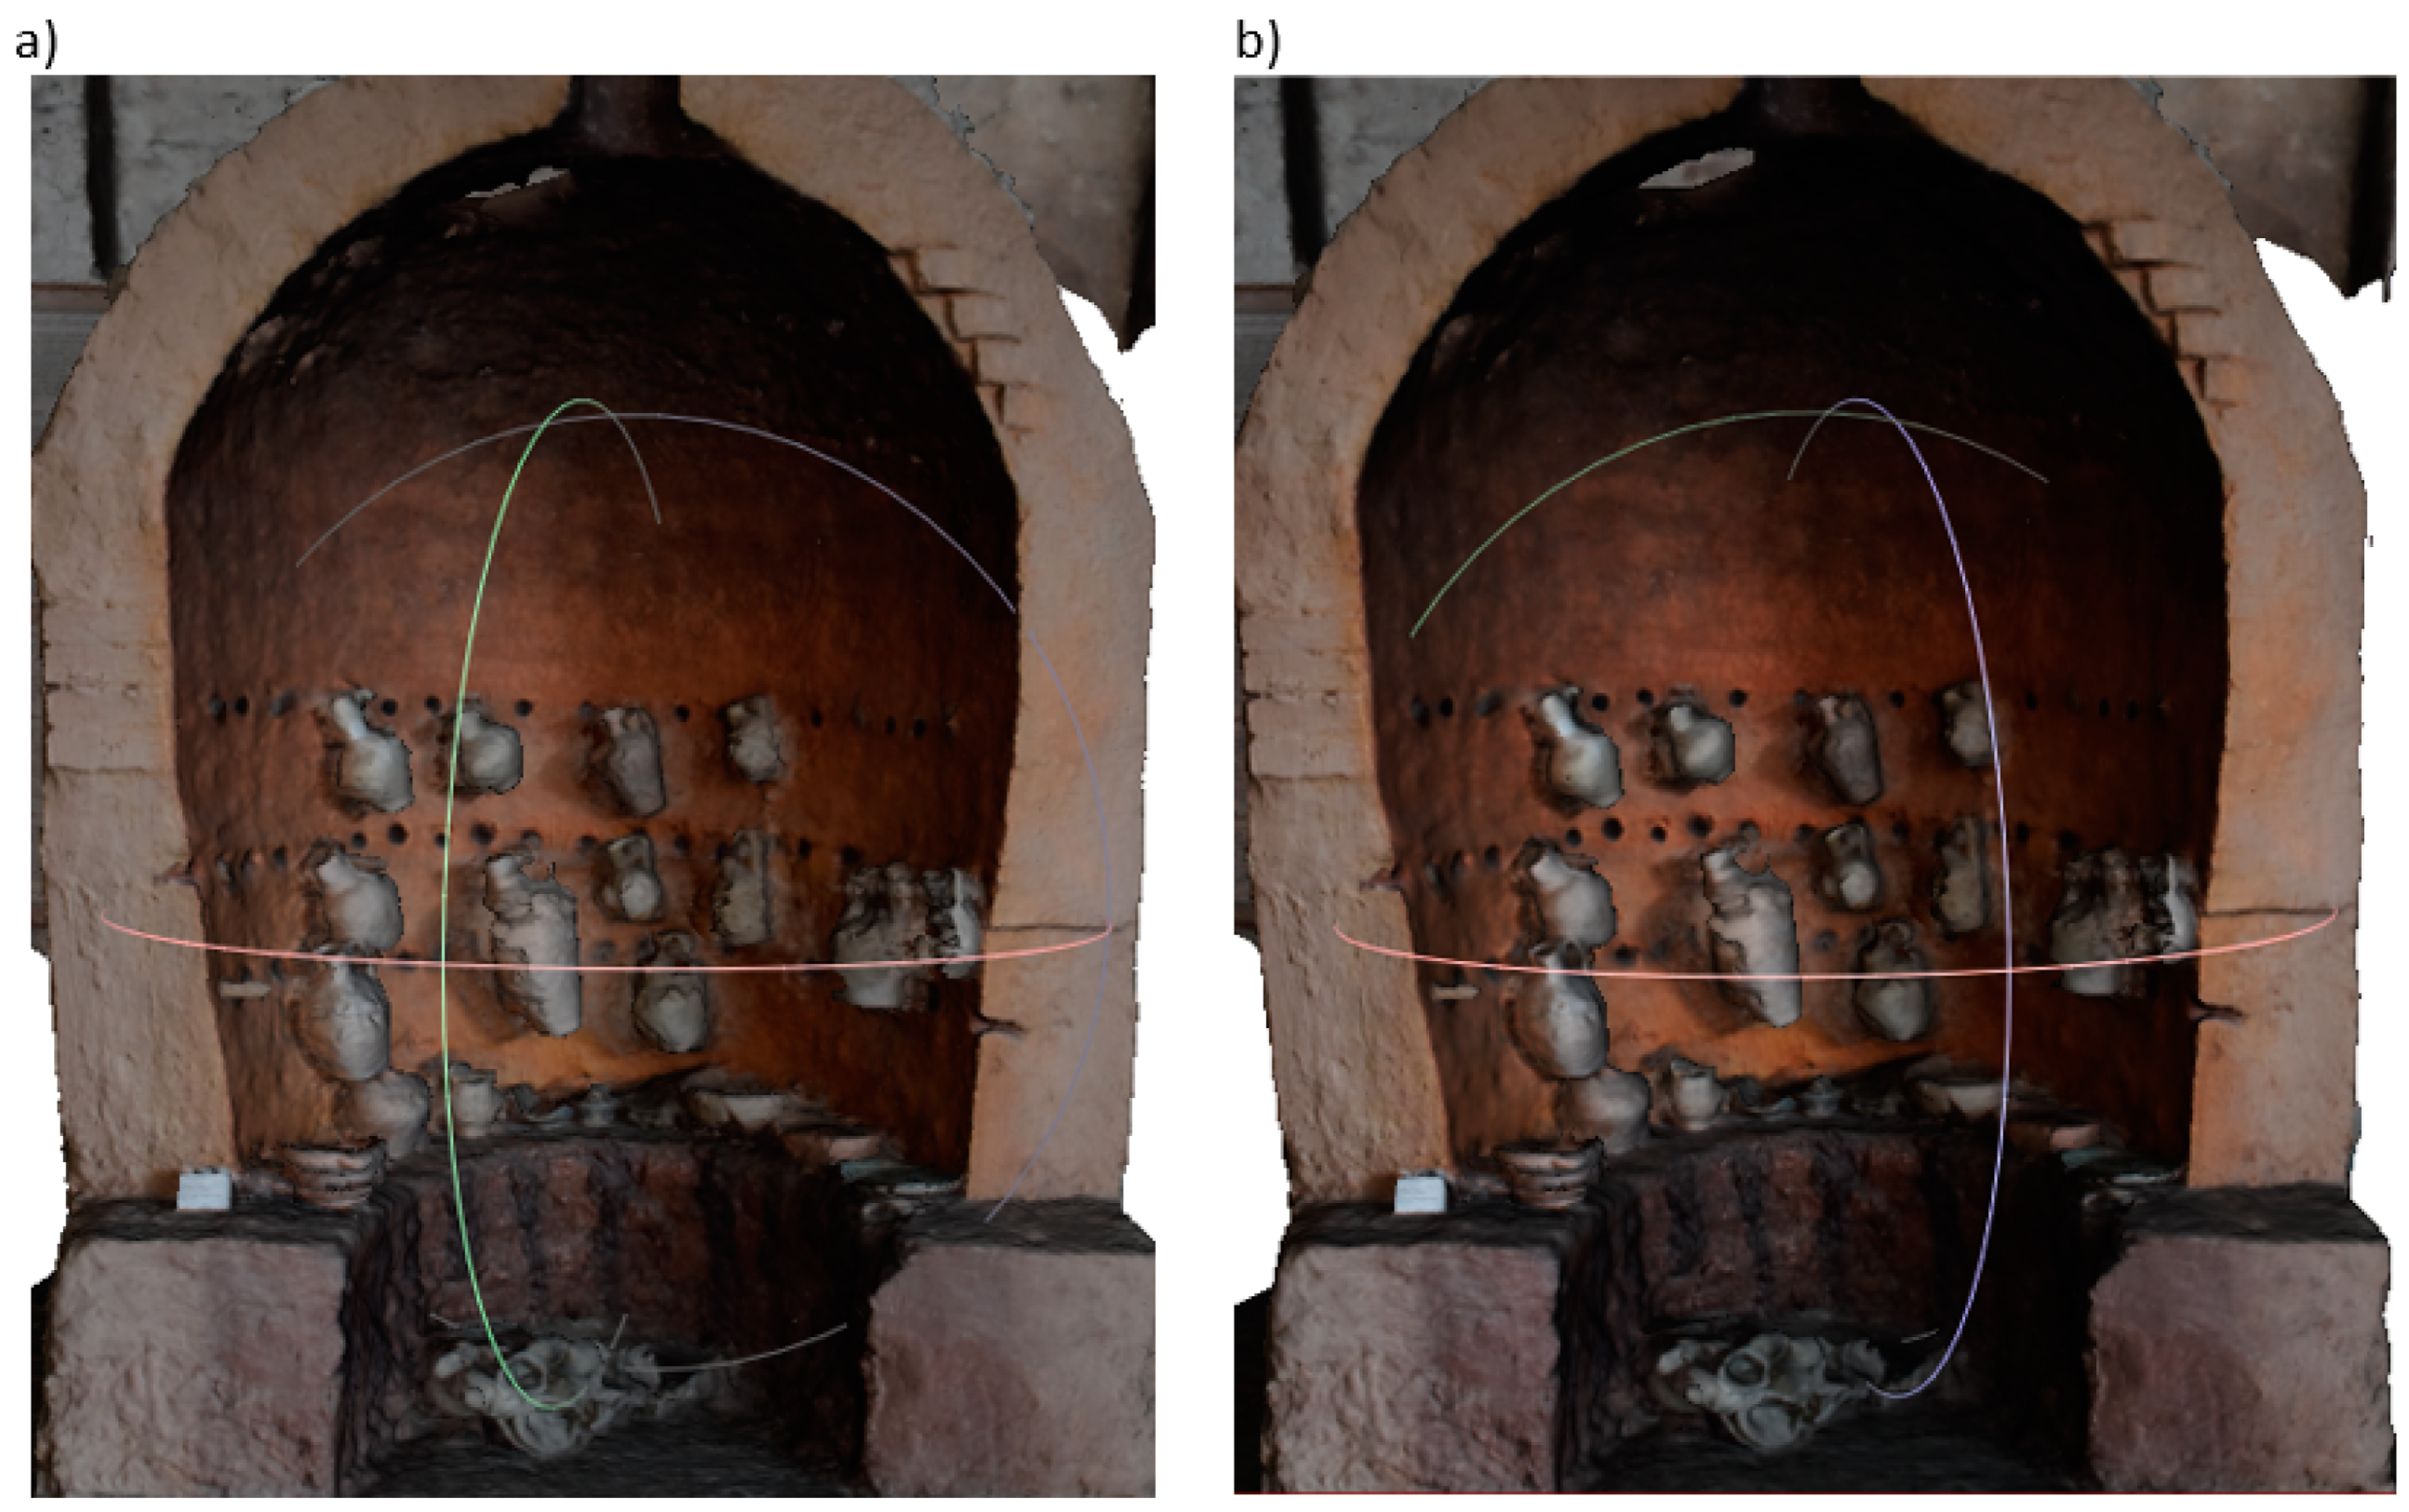
4.2. Digital Oven 3D Models

4.2.1. 3D SLS and Postprocessing

After digitising with the Artec Eva scanner (Figure 4b) 28 scans were obtained. Their large number was due to the size of the furnace (approximately 2.8 × 2.2 m). The size of the files with the scans obtained was 7.2 GB. In total, 13,967 frames were received, over 416 million polygons, over 221 million vertices and 1029 datapoints about texture. After carrying out the data processing process in accordance with the diagram shown in Figure 5, a 3D mesh model with applied texture was obtained. As in the case of the jug model, it was exported to a file in .obj format, and the texture was saved in the file in .jpg format. A view of the furnace and its components is shown in Figure 13a and Figure 14.
Most of the elements that were placed in the centre of the furnace were very well recreated. The 3D models are of very good quality. However, there is an area (shown by the ellipse in Figure 14) where the three-dimensional models have not been properly formed. The presented case results from the fact that in the scanning process the identification of consecutively collected points in relation to the previously recorded points was lost. Such a situation can be identified in the process of point cloud processing. However, for the purposes of this article, this has not been done to show the visual consequences of this situation.
The optimisation of the 3D model of the furnace consisted in simplifying the mesh and texture: the mesh was reduced ten times and the dimensions of the texture used were reduced four times. The data obtained were recorded in Table 5, the realistic model is shown in Figure 13b. After applying mesh optimisation, no significant qualitative differences were noticed compared to the original model.

4.2.2. SfM and Postprocessing

The procedure shown in Figure 6 was also used to create a three-dimensional model of the furnace by the SfM method. Out of 31 original photos loaded (without processing), Meshroom, after verification, used all photos for further analysis. The obtained three-dimensional model of the furnace is shown in Figure 15a and its elements in Figure 16a.
While the quality of the obtained model of the furnace itself is quite good, the models of vessels in it are not satisfactory. They are definitely different from the models obtained by the 3D SLS method. For this, the 3D model underwent a surface smoothing process in Blender. After carrying out this operation, the unevenness on the surfaces of the furnace itself (Figure 15b), as well as on the surfaces of the elements inside it, decreased (Figure 16b).

4.2.3. Comparison of SLS and SfM Technologies

The collective parameters of digital 3D models of the furnace made in SLS and SfM technology are presented in Table 5.
The results included in Table 5 show that the optimisation of the 3D model obtained from the SLS method, consisting in a 10-fold reduction of the mesh size and 4-fold reduction of the texture dimension, with a virtually invisible visual change of the object, resulted in a reduction of the total file size over 6.5 times. With regard to the digital model from the SfM method, the improvement in object visibility after smoothing resulted in an almost 2-fold increase in the .obj file size. It should be added that the size of this file is almost 3.5 times larger than the SLS file, and the appearance of this model is of lower quality anyway.
Table 6 and Table 7 present the time-consuming nature of data acquisition and processing when creating digital 3D models of a jug and a stove using the SfM and 3D SLS methods. Table 8 lists the costs of devices and software used in the SfM and 3D SLS methods.
The analysis of the results in Table 6 concerning the generation of a 3D model of a small jug shows that the time taken by the SfM method is almost twice as long as that of the 3D SLS methods. If more photos were taken, the time would increase to about 3 times. Knowing that raw photos need to be pre-processed, time can be saved by generating a 3D model from these photos and cropping them can follow straight away. In the case of a large object—a furnace (Table 7), it can be seen that the SfM method is about 15 times less time-consuming than the 3D SLS methods. In the method, scanning a large, complex surface takes a long time, as opposed to taking photos. When photographing the furnace, there was no need to create a shooting station, and moreover, the furnace was positioned against the wall, so only one accessible side was photographed. All this meant that the shooting time was 4 times shorter than that of a small jug. The program generating a 3D model from photos requires approximately the same time to generate the model, regardless of whether the object in the photos is large or small. Initial processing of scans from the 3D SLS method, consisting in separating point clouds from each other, when information about reference points was lost in the scanning process, and their recording as separate post-drafts must be performed manually. This operation is very time-consuming, but allows to keep all the data obtained during the scan.
The results from Table 8 show that the costs of professional equipment for the 3D SLS method compared to the purchase of a camera are huge (over 35 times) and many museum institutions will not be able to afford them. However, it should be remembered that acquiring a point cloud of the scanned object ensures the archiving of raw data, which constitute the so-called perpetual archiving of a museum artefact.

5. Conclusions and Further Work

The article presents a comparison of the results of safe and non-contact digitisation of objects from museum exhibitions using two different methods: the 3d Structural-Light Scanning (3D SLS) and the Structure from Motion (SfM) methods. It has been shown that it is possible to select programs and tools, as well as devices enabling the creation of low-cost 3D mesh models using the SfM method, using free software (Meshroom, Blender) and commonly owned devices and computer equipment (camera, laptop).
Using modern information technologies, it has been shown that it is possible to carry out works when employees of partner units are located in different geographic locations in Lublin (Poland) and Samarkand (Uzbekistan). Each team can focus on activities related to professional preparation, sharing their knowledge at the same time, in order to gain new competences in the future in the field of creating digital copies of real models or tangible cultural heritage. By combining the competences of both teams, a synergy effect occurs, which makes it easier to solve emerging problems.
In the light of the research consisting in the creation of digital 3D models of museum objects using the 3D SLS and SfM methods and a comparative analysis of the obtained results, it became possible to formulate the following conclusions:
(1)
Scanning with the 3D SLS method with the use of Artec Spider and Artec Eva scanners is perfect for mapping museum objects due to the lack of contact with them (the emitted light is neutral for the scanned objects, thanks to which it is possible to scan very delicate, old and valuable objects). It enables effective in situ data acquisition, which significantly simplifies the digitisation process and the necessary formalities to carry it out.
(2)
Performing the proper postprocessing of the data obtained in the 3D SLS scanning process allows to obtain a faithful 3D mesh model with the applied texture, which can be exported to a file in .obj format with a size many times smaller than the original data obtained.
(3)
Optimisation of the 3D model mesh using the 3D SLS method and reducing it by up to 10 times while reducing the texture dimension by a factor of 2 does not result in the loss of good visual quality of these objects. This remark applies to very small objects (a 14 cm high jug and a 270 cm high oven). It should be added that the total size of model and texture files is reduced by about 6 to 8 times. As a result, these models are well suited for placement on museum websites.
(4)
The low-cost SfM method has an unquestionable advantage (over 35 times), which can be an attractive alternative when creating digital 3D models of museum objects. The results of the comparative studies, however, show some of its shortcomings, which means that the obtained three-dimensional digital models are usually of lower visual quality. In addition, due to the improvement of their quality (e.g., surface smoothing), their size increases significantly and is about 3–5 times larger than the size of model files and texture files from the 3D SLS method after optimisation. This may mean that inserting such large model files on museum websites may discourage potential users due to the long download times.
(5)
The use of the SfM method to create digital 3D models of objects of medium or small size (e.g., a jug with a height of 14 cm) gives much better results when the process of cropping the photo is carried out so that the object is in the centre of the photo. The amount of noise generated in the background of the photo is reduced.
(6)
Although the 3D models generated by the SfM method were obtained from a small number of photos, about 30–50 (photos taken by partners from Uzbekistan), the quality of these models turned out to be quite good. This is especially true of a small jug—an object in its main axisymmetric shape. So attention should be paid to getting much more photos of the subject (from 80 to 140).
(7)
The time of the SfM method when applied to small objects can be reduced (more than 4 times) with careful photographing, paying attention that the object is well-framed, without unnecessary background of the surroundings.
(8)
The classic SfM method does not provide for placing markers next to the photographed object, so the obtained digital 3D models do not have information about their dimensions. Thus, these models are not fully suitable for the professional archiving of historical objects, but may be useful for popularising and making available tangible cultural heritage.
The authors see the need to continue the work in terms of:
(1)
Conducting comparative studies of creating digital 3D models of museum objects using the SfM method with the use of other non-commercial and commercial programs.
(2)
Development of methods and algorithms for comparing the obtained 3D models, which make it possible to calculate the differences between the shape of digital artefacts obtained from both methods and to change the shape of the surface of smoothed and optimised objects in relation to the basic model obtained by the 3D SLS method.
(3)
Searching for better methods of post-processing 3D models from SfM to improve their visual quality while reducing their size.
(4)
Developing a list of good practices for the preparation of a collection of photographs of museum objects for the purposes of the SfM method for museum worker.

Author Contributions

Conceptualization, J.M. and M.B.; methodology, J.M., M.B., M.P.-Ł. and A.S.; software, A.S., M.B.; validation, M.B. and A.S.; formal analysis, J.M.; investigation, J.M.; resources, J.M., M.B. and M.P.-Ł.; data curation, J.M., M.B. and M.P.-Ł.; writing—original draft preparation, J.M. and M.B.; writing—review and editing, J.M., M.B. and M.P.-Ł.; visualization, M.B.; supervision, M.B. and M.P.-Ł.; project administration, J.M. and M.B.; funding acquisition, J.M. All authors have read and agreed to the published version of the manuscript.

Funding

This article has been supported by the Polish National Agency for Academic Exchange under Grant No. PPI/APM/2019/1/00004 titled “3D DIGITAL SILK ROAD”.

Institutional Review Board Statement

Not applicable.

Informed Consent Statement

Not applicable.

Data Availability Statement

Not applicable.

Acknowledgments

The authors would like to thank Samariddin Mustafokulov—Director of the Afrasiyab Museum in Samarkand for making it possible for us to 3D scan museum resources in 2017 and Daniyarov Fayzullo—the new Director of the Afrasiyab Museum, as well as the employees of the Museum for providing a collection of photos of objects from the exhibition.

Conflicts of Interest

The authors declare no conflict of interest.

References

  1. Bendicho, V.M.L.-M.; Marchante-Ortega, Á.; Vincent, M.; Martín-Buitrago, Á.J.C.; Pintado, J.O. Uso combinado de la fotografía digital nocturna y de la fotogrametría en los procesos de documentación de petroglifos: El caso de Alcázar de San Juan (Ciudad Real, España). Virtual Archaeol. Rev. 2017, 8, 64–74. [Google Scholar] [CrossRef] [Green Version]
  2. Bianco, S.; Ciocca, G.; Marelli, D. Evaluating the Performance of Structure from Motion Pipelines. J. Imaging 2018, 4, 98. [Google Scholar] [CrossRef] [Green Version]
  3. COVID-19 and Tourism: Assessing the Economic Consequences, United Nations Conference on Trade and Development. 2020. Available online: https://unctad.org/system/files/official-document/ditcinf2020d3_en.pdf (accessed on 1 May 2021).
  4. Miłosz, M.; Montusiewicz, J.; Kęsik, J. 3d information technologies in cultural heritage preservation and popularization-a series 602 of seminars for museologists made by computer scientists. In Proceedings of the EDULEARN 20 Proceedings; IATED: Walencja, Spain, 2020; pp. 544–549. [Google Scholar] [CrossRef]
  5. Polish National Agency for Academic Exchange under Grant No. PPI/APM/2019/1/00004 Titled “3D DIGITAL SILK ROAD”. Available online: https://nawa.gov.pl/en (accessed on 5 June 2021).
  6. Miłosz, M.; Kęsik, J.; Montusiewicz, J. 3D Scanning and Visualization of Large Monuments of Timurid Architecture in Cen-tral Asia—A Methodical Approach. J. Comput. Cult. Herit. 2020, 14, 1–31. [Google Scholar] [CrossRef]
  7. Montusiewicz, J.; Barszcz, M.; Dziedzic, K. Photorealistic 3D Digital Reconstruction of a Clay Pitcher. Adv. Sci. Technol. Res. J. 2019, 13, 255–263. [Google Scholar] [CrossRef]
  8. Horn, C.; Ling, J.; Bertilsson, U.; Potter, R. By All Means Necessary—2.5D and 3D Recording of Surfaces in the Study of Southern Scandinavian Rock Art. Open Archaeol. 2018, 4, 81–96. [Google Scholar] [CrossRef]
  9. Balletti, C.; Ballarin, M. An Application of Integrated 3D Technologies for Replicas in Cultural Heritage. ISPRS Int. J. Geo-Inf. 2019, 8, 285. [Google Scholar] [CrossRef] [Green Version]
  10. Montusiewicz, J.; Barszcz, M.; Dziedzic, K.; Nowicki, T. The Method of Decomposition of Architectural Objects for the prep-aration of 3D Virtual Models and Replication. Adv. Sci. Technol. Res. J. 2021, 15, 247–257. [Google Scholar] [CrossRef]
  11. Wachowiak, M.J.; Karas, B.V. 3D Scanning and Replication for Museum and Cultural Heritage Applications. J. Am. Inst. Conserv. 2009, 48, 141–158. [Google Scholar] [CrossRef]
  12. Younan, S.; Treadaway, C. Digital 3D models of heritage artefacts: Towards a digital dream space. Digit. Appl. Archaeol. Cult. Herit. 2015, 2, 240–247. [Google Scholar] [CrossRef]
  13. Balletti, C.; Guerra, F.; Scocca, V.; Gottardi, C. 3D integrated methodologies for the documentation and the virtual recon-struction of an archaeological site. In Proceedings of the International Archives of the Photogrammetry, Remote Sensing and Spatial Information Sciences, 3D Virtual Reconstruction and Visualization of Complex Architectures, Avila, Spain, 25–27 February 2015; Volume XL-5/W4, pp. 215–222. [Google Scholar]
  14. Douglass, M.; Lin, S.; Chodoronek, M. The Application of 3D Photogrammetry for In-Field Documentation of Archaeologi-cal Features. Adv. Archaeol. Pract. 2015, 3, 136–152. [Google Scholar] [CrossRef]
  15. Howland, M.D.; Kuester, F.; Levy, T.E. Photogrammetry in the field: Documenting, recording, and presenting archaeology. Mediter. Archaeol. Archaeom. 2014, 4, 101–108. [Google Scholar]
  16. Grechi, G.; Fiorucci, M.; Marmoni, G.; Martino, S. 3D Thermal Monitoring of Jointed Rock Masses through Infrared Thermography and Photogrammetry. Remote Sens. 2021, 13, 957. [Google Scholar] [CrossRef]
  17. Kong, D.; Saroglou, C.; Wu, F.; Sha, P.; Li, B. Development and application of UAV-SfM photogrammetry for quantitative characterization of rock mass discontinuities. Int. J. Rock Mech. Min. Sci. 2021, 141, 1–19. [Google Scholar] [CrossRef]
  18. Lambers, K.; Eisenbeiss, H.; Sauerbier, M.; Kupferschmidt, D.; Gaisecker, T.; Sotoodeh, S.; Hanusch, T. Combining photo-grammetry and laser scanning for the recording and modeling of the Late Intermediate period site of Pinchango Alto, Pal-pa, Peru. J. Archaeol. Sci. 2017, 34, 1702–1712. [Google Scholar] [CrossRef] [Green Version]
  19. Bruno, F.; Bruno, S.; De Sensi, G.; Luchi, M.-L.; Mancuso, S.; Muzzupappa, M. From 3D reconstruction to virtual reality: A complete methodology for digital archaeological exhibition. J. Cult. Herit. 2010, 11, 42–49. [Google Scholar] [CrossRef]
  20. Lerma, J.L.; Muir, C. Evaluating the 3D documentation of an early Christian upright stone with carvings from Scotland with multiples images. J. Archaeol. Sci. 2014, 46, 311–318. [Google Scholar] [CrossRef]
  21. Wei, O.C.; Chin, C.S.; Majid, Z.; Setan, H. 3D documentation and preservation of historical monument using terrestrial laser scanning. Geoinf. Sci. J. 2010, 10, 73–90. [Google Scholar]
  22. David, A.; Kaminski, J. 3D scanning and presentation of ethnographic collections—Potentials and challenges. J. Mus. Ethnogr. 2014, 27, 78–97. [Google Scholar]
  23. Higueras, M.; Calero, A.I.; Collado-Montero, F.J. Digital 3D modeling using photogrammetry and 3D printing applied to the restoration of a Hispano-Roman architectural ornament. Digit. Appl. Archaeol. Cult. Herit. 2021, 20, 1–11. [Google Scholar]
  24. Solter, A.; Gajski, D. Project “towards the virtual museum”—Exploring tools and methods for 3D digitalization and visual-ization. Opvscvla Archaeol. 2018, 39–40, 117–124. [Google Scholar]
  25. Tucci, G.; Cini, D.; Nobile, A. Effective 3D digitization of archaeological artifacts for interactive virtual museum. ISPRS Int. Arch. Photogramm. Remote Sens. Spat. Inf. Sci. 2012, XXXVIII-5, 413–420. [Google Scholar] [CrossRef] [Green Version]
  26. Neamtu, C.; Comes, R. Methodology to create digital and virtual 3d artefacts in archaeology. J. Anc. Hist. Archaeol. 2016, 3, 65–74. [Google Scholar] [CrossRef] [Green Version]
  27. Capacete-Caballero, X.; Caulfield-Sriklad, D.; McKay, F. Enhancing the display of the fashion artefact through digital mul-ti-media approaches. In Proceedings of the 1st International Conference on Digital Fashion, London, UK, 16–17 May 2013; pp. 336–345. [Google Scholar]
  28. Iglhaut, J.; Cabo, C.; Puliti, S.; Piermattei, L.; O’Connor, J.; Rosette, J. Structure from Motion Photogrammetry in Forestry: A Review. Curr. For. Rep. 2019, 5, 155–168. [Google Scholar] [CrossRef] [Green Version]
  29. Dappa, E.; Higashigaito, K.; Fornaro, J.; Leschka, S.; Wildermuth, S.; Alkadhi, H. Cinematic rendering—An alternative to volume rendering for 3D computed tomography imaging. Insights Imaging 2016, 7, 849–856. [Google Scholar] [CrossRef] [PubMed] [Green Version]
  30. De Moraes Jorge, A.P.; Monteiro, E.R.; Hoogenboom, B.J.; Oliveira, A.; Quintela, M.V.P. Computer photo-grammetry as a postural assessment in Schwartz-Jampel syndrome: A case report. J. Bodyw. Mov. Ther. 2021, 26, 72–76. [Google Scholar] [CrossRef] [PubMed]
  31. Westoby, M.J.; Brasington, J.; Glasser, N.F.; Hambrey, M.J.; Reynolds, J.M. “Structure-from-Motion” photogrammetry: A low-cost, effective tool for geoscience applications. Geomorphology 2012, 179, 300–314. [Google Scholar] [CrossRef] [Green Version]
  32. Silva-Bolíva, J.; Cataño-Ospina, A.M.; Arenas-Becerra, L.Y. Photogrammetry for the reconstruction of realistic visual landscapes that serve for the creation of scenographies in audiovisual and multimedia products. J. Phys. Conf. Ser. 2019, 1418, 23–25. [Google Scholar] [CrossRef]
  33. Verhoeven, G.; Doneus, M.; Briese, C.; Vermeulen, F. Mapping by matching: A computer vision-based approach to fast and accurate georeferencing of archaeological aerial photographs. J. Archaeol. Sci. 2012, 39, 2060–2070. [Google Scholar] [CrossRef]
  34. Caspari, G. Mapping and Damage Assessment of “Royal” Burial Mounds in the Siberian Valley of the Kings. Remote Sens. 2020, 12, 773. [Google Scholar] [CrossRef] [Green Version]
  35. Jin, D.; Li, J.; Gong, J.; Li, Y.; Zhao, Z.; Li, Y.; Li, D.; Yu, K.; Wang, S. Shipborne Mobile Photogrammetry for 3D Mapping and Landslide Detection of the Water-Level Fluctuation Zone in the Three Gorges Reservoir Area, China. Remote Sens. 2021, 13, 1007. [Google Scholar] [CrossRef]
  36. Fregonese, L.; Adami, A. The 3D Model of St. Mark’s Basilica in Venice. In Digital Transformation of the Design, Construction and Management Processes of the Built Environment. Research for Development; Daniotti, B., Gianinetto, M., Della Torre, S., Eds.; Springer: Cham, Switzerland, 2020; pp. 343–354. [Google Scholar]
  37. Bastonero, P.; Donadio, E.; Chiabrando, F.; Spano, A.T. Fusion of 3D models derived from TLS and image-based techniques for CH enhanced documentation. ISPRS Ann. Photogramm. Remote Sens. Spat. Inf. Sci. 2014, II-5, 73–80. [Google Scholar] [CrossRef] [Green Version]
  38. Pepe, M.; Costantino, D. UAV Photogrammetry and 3D Modelling of Complex Architecture for Maintenance Purposes: The Case Study of the Masonry Bridge on the Sele River, Italy. Period. Polytech. Civ. Eng. 2020, 65, 191–203. [Google Scholar] [CrossRef]
  39. Graham, C.A.; Akoglu, K.G.; Lassen, A.W.; Simon, S. Epic dimensions: A comparative analysis of 3d acquisition methods. ISPRS Int. Arch. Photogramm. Remote Sens. Spat. Inf. Sci. 2017, XLII-2/W5, 287–293. [Google Scholar] [CrossRef] [Green Version]
  40. Kersten, T.P.; Lindstaedt, M.; Starosta, D. Comparative geometrical accuracy investigations of hand-held 3D scanning systems—An update. Int. Arch. Photogramm. Remote Sens. Spat. Inf. Sci. 2018, 42. [Google Scholar] [CrossRef] [Green Version]
  41. Doumit, J.; Kiselev, E. Structure from motion technology from micro scale objects cartography. Earth Sci. 2017, 42–47. [Google Scholar]
  42. Hellmuth, R.; Wehner, F.; Giannakidis, A. Datasets of captured images of three different devices for photogrammetry cal-culation comparison and integration into a laserscan point cloud of a built environment. Data Brief 2020, 33, 106321. [Google Scholar] [CrossRef] [PubMed]
  43. Aldao, E.; González-Jorge, H.; Pérez, J.A. Metrological comparison of LiDAR and photogrammetric systems for defor-mation monitoring of aerospace parts. Measurement 2021, 174, 109037. [Google Scholar] [CrossRef]
  44. Schonberger, J.L.; Frahm, J.-M. Structure-from-Motion Revisited. In Proceedings of the 2016 IEEE Conference on Computer Vision and Pattern Recognition (CVPR), Las Vegas, NV, USA, 27–30 June 2016; pp. 4104–4113. [Google Scholar]
  45. Wu, C. Visualsfm: A Visual Structure from Motion System. 2011. Available online: http://ccwu.me/vsfm/ (accessed on 1 May 2021).
  46. Fedorov-Davydov, G.A. Archaeological research in Central Asia of the Muslim period. World Archaeol. 1983, 14, 393–405. [Google Scholar] [CrossRef]
  47. Milosz, M.; Skulimowski, S.; Kęsik, J.; Montusiewicz, J. Virtual and interactive museum of archaeological artefacts from Afrasiyab—An ancient city on the silk road. Digit. Appl. Archaeol. Cult. Herit. 2020, 18, e00155. [Google Scholar] [CrossRef]
  48. 3D Digital Silk Road. Retrieved 27 January 2020. Available online: http://silkroad3d.com/ (accessed on 5 June 2021).
Figure 1. Taking a series of photos in the Structure from Motion method.
Applsci 11 05321 g001
Figure 2. The process of operation of the software for the SfM method.
Applsci 11 05321 g002
Figure 3. Objects from the Afrasiyab museum: (a) 11th/12th century glazed jug, (b) reconstruction of the 9th–12th century pottery kiln.
Applsci 11 05321 g003
Figure 4. Scanning objects with SLS: (a) jug—Artec Spider, (b) model of kiln—Artec Eva.
Applsci 11 05321 g004
Figure 5. Stages of data processing obtained in the scanning process.
Applsci 11 05321 g005
Figure 6. Stages of data processing in the SfM method.
Applsci 11 05321 g006
Figure 7. The appearance of a digital 3D model of a jug with 3D SLS: (a,b) primary model—without and with texture, (d,e) model after additional processing—without and with texture, (c,f) mesh view before and after optimization.
Applsci 11 05321 g007
Figure 8. Sample photos of the jug without processing received from partners from Uzbekistan.
Applsci 11 05321 g008
Figure 9. The appearance of a digital model of a jug with SfM: (a,b) without texture—side one and two, (c,d) with texture—side one and two.
Applsci 11 05321 g009
Figure 10. Sample photos after post-processing.
Applsci 11 05321 g010
Figure 11. The appearance of the digital model of the jug obtained by the SfM method after photo processing: (a,b) without texture—page one and two, (c,d) with texture—page one and two.
Applsci 11 05321 g011
Figure 12. The appearance of the digital 3D model of the jug obtained by the SfM method after smoothing the surface: (a) without texture, (b) with texture.
Applsci 11 05321 g012
Figure 13. Three-dimensional model of the furnace (a) original model, (b) after optimalisation.
Applsci 11 05321 g013
Figure 14. A 3D model with the texture of objects inside the furnace.
Applsci 11 05321 g014
Figure 15. Three-dimensional model of the furnace obtained by the SfM method: (a) original version, (b) after smoothing the surface.
Applsci 11 05321 g015
Figure 16. 3D model with the texture of the dishes in the furnace: (a) original version, (b) after smoothing the surface.
Applsci 11 05321 g016
Table 1. Specification of Artec Eva and Spider scanners *.
ParametersArtec Eva ScannerArtec Spider Scanner
Texture capture capabilityyesyes
Scanning technologystructured white lightflashing light, blue light
(not laser)
Resolution 3D, up to0.2 mm0.1 mm
Point precision 3D, up to0.1 mm0.05 mm
3D precision at a distance, up to0.03%/100 cm0.03%/100 cm
Linear field of view,
height × width
214 mm × 148 mm
to 536 mm × 371 mm
90 mm × 70 mm
to 180 mm × 140 mm
Working distance0.4–1 m0.17–0.35 m
Weight0.85 kg0.85 kg
Minimum requirements of the computer cooperating with the scannerI5 (recommended I7), 8–12 GB RAM, NVIDIA GeForce 400 seriesI5 (recommended I7), 8–12 GB RAM, NVIDIA GeForce 400 series
* The data come from the manufacturer, but the actual values do not differ from those given, which has been confirmed by our many years of use of this equipment.
Table 2. Comparison of procedures for generating 3D models by the 3D SLS and SfM methods.
NoFeatures3D SLSSfMComments
1Device3D ScannerMovie-camera/camera/smartphone
2Shape data acquisition3D scanningShooting
3Texture data acquisitionRGB information *2D photos* selective uptake
4Digitisation of transparent objectsNoPartially
5Data formPoint cloud2D photos
6Data sizeSeveral GBSeveral to several hundred MB ** Camera dependent
7SoftwareSpecialised,
device-dedicated
Device-dedicated/Open source
8Computer hardwareHigh computing powerLow computing power
93D model building methodPoint cloud
triangulation
Triangulation using image analysis
103D model generationManual, assistedAutomated
11CostsHigh/Very HighLow
12AvailabilityLowWidespread
13Time consumptionLow/MediumLow/MediumObject-size dependent
14Acquisition of dimensionsYesNo/Yes ** Necessity to place tags
15Model qualityVery goodSmall/medium
16Making it photorealisticTexture mappingTexture mapping
17Possibility to export to standard formatsYesYes
18Possibility to modify modelsYesYes
19Competence in using the equipmentSpecialist/HighCommon/Medium
20IT competencesSpecialist/HighCommon/Medium
Table 3. Data on scans for an object like a jug.
Scan No.SurfacePolygonsVerticesFrameTexture
1106023,169,77313,514,745106059
22809,848,0525,612,08428028
349612,634,6447,145,096496115
Total183645,652,46926,271,9251836202
Table 4. Parameters of the digital 3D model and the texture of the jug.
Model MeshTexture
VerticesFaces.obj File Size
[MB]
.jpg File Size
[MB]
Size
[Pixels]
Resolution
[dpi]
3D SLS method
Original model214,870429,73630.17.1 MB4096 × 409696 × 96
Processed model21,48842,9724.31953 kB2048 × 204896 × 96
SfM method
Without processing photos119,694238,71216.15.31 MB4096 × 409696 × 96
After processing photos102,369204,48613.03.82 MB4096 × 409696 × 96
After smoothing the model’s surface102,369204,48621.43.82 MB4096 × 409696 × 96
Table 5. Parameters of the digital 3D model and the texture of the furnace.
Model MeshTexture
VerticesFaces.obj File Size
[MB]
.jpg File Size
[MB]
Size
[Pixels]
Resolution
[dpi]
3D SLS method
Original model2,110,1464,199,23131130.48192 × 819296 × 96
After optimisation218,819419,92246.71.122048 × 204896 × 96
SfM method
Original model717,7451,434,92598.912.54096 × 409696 × 96
After smoothing the model’s surface717,7451,434,92516012.54096 × 409696 × 96
Table 6. Time-consuming production of the 3D model of the jug using the SfM and 3D SLS methods.
SfM/Meshroom Programmin3D SLS/Artec Studio Professional 15 Programmin
Data Acquisition 12 5
Data processingMaking a 3D model from raw photos—an automated process20Converting a point cloud into a 3D mesh model—manual process70
Photo processing90
Making a 3D model from processed photos20
Smoothing the model in Blender8Optimising the 3D model mesh in Blender10
Total150Total85
Table 7. Time-consuming production of 3D models of the furnace using the SfM and 3D SLS methods.
SfM/Meshroom Programmin3D SLS/Artec Studio Professional 15 Programmin
Data Acquisition 3 55
Data processingMaking a 3D model from raw photos—an automated process20Converting a point cloud into a 3D mesh model—manual process480
Smoothing the model in Blender15Optimising the 3D model mesh in Blender15
Total38Total550
Table 8. List of hardware and software costs.
SfM *3D SLS **
Cost
DeviceNikon camera with Nikkor970Artec Spider Scanner19,700
Artec Eva Scanner13,700
SoftwareMeshroomfreeArtec Studio 15 Professional2000
BlenderfreeBlenderfree
* excluding computer hardware for data processing. ** excluding computer hardware for scanning and data processing.
Publisher’s Note: MDPI stays neutral with regard to jurisdictional claims in published maps and institutional affiliations.

