Article

Use of Immunofluorescence Technique to Perform a Quantitative Analysis of Masseter Muscle Fibers in Unilateral Posterior Crossbite: A Pilot Study

by
Giovanna Vermiglio
1,
Mariagrazia Piancino
2,
Michele Runci Anastasi
3,
Giacomo Picciolo
1,
Antonio Centofanti
1,*,
Giuseppe Santoro
1,
Mariachiara Malandrino
4,
Giuseppina Cutroneo
1 and
Giuseppe Anastasi
1
1
Department of Biomedical and Dental Science and Morphofunctional Imaging, University of Messina, 98122 Messina, Italy
2
Department of Surgical Sciences, Dental School, Orthodontics, University of Turin, 10124 Torino, Italy
3
Centro Neurolesi “Bonino-Pulejo”, I.R.C.C.S (Istituto di Ricovero e Cura a Carattere Scientifico), 98100 Messina, Italy
4
School of Maxillofacial Surgery, University of Turin, 10124 Torino, Italy
*
Author to whom correspondence should be addressed.
Appl. Sci. 2021, 11(12), 5350; https://doi.org/10.3390/app11125350
Submission received: 12 May 2021 / Revised: 4 June 2021 / Accepted: 7 June 2021 / Published: 9 June 2021
(This article belongs to the Special Issue Immunohistochemical Expression Volume II)

Abstract

:
Unilateral posterior crossbite is a type of malocclusion that involves morpho-functional characteristics of masticatory muscle, such as the masseter: electrophysiological data have shown that the affected side works less than the contralateral muscle, which shows a normal or increased activity, probably in order to compensate for the affected side. The aim of present work was to measure the diameter and the cross-sectional area of ipsilateral and contralateral muscle fibers to verify if hypertrophy and/or hypotrophy take place in this malocclusion. We used immunofluorescence pictures to measure, using ImageJ software, the diameter and the cross-sectional area of fibers from control and crossbite groups; after that, the data were processed to perform statistical analyses. Results show that the fiber diameters of contralateral muscle are larger than the diameters of ipsilateral and control fibers, and that this difference is statistically significant. No statistically significant difference was found between the fiber diameters of the ipsilateral and control muscles. All these data suggest that, during unilateral posterior crossbite, morphological changes take place in the contralateral masseter muscle, which undergoes hypertrophy, probably to compensate for the low activity of the affected muscle.

1. Introduction

Unilateral posterior crossbite is a type of malocclusion characterized by an altered buccal–lingual relationship [1,2]. This malocclusion represents a pathological condition that involves morpho-functional characteristics of masticatory muscles [3,4]. Electrophysiological studies have demonstrated that the masseter muscle of the affected side, named ipsilateral, works less than the healthy side, named contralateral, and that the contralateral side can exhibit a normal or increased activity [1,5].
Both the high activity on one side and the low activity on the other side determine several morphological changes, which seem to be typical of hypertrophic and hypotrophic processes, respectively [6]. Moreover, in the most severe cases of malocclusion, the existence of an atrophic condition in the ipsilateral masseter muscle has been demonstrated [6]. The ipsilateral masseter muscle is shown to have thin and small fibers and an increased extracellular matrix, as occurs in muscle hypotrophy and in the early stages of muscle atrophy; the contralateral side has been shown to have hypertrophic fibers that are bigger when compared to the ipsilateral ones [4,6].
Histochemical investigations performed on the masseter muscles of unilateral posterior crossbite patients have also shown that the ipsilateral side muscle is characterized by low myonuclei and satellite cell numbers and a low expression of muscular proteins, such as sarcoglycans and integrins. Instead, the contralateral muscle fibers were shown to have higher myonuclei and satellite cell numbers and a higher expression of sarcoglycans and integrins compared to ipsilateral muscle [6,7,8]. Although all these data support the existence of a hypertrophic response in the contralateral side and a hypotrophic/atrophic process on the ipsilateral side, no data about the evaluation of fiber diameters on both sides exists in the literature.
On this basis, the aim of the present study is to perform a measurement of fiber diameters for both ipsilateral and contralateral masseter muscles in unilateral posterior crossbite, and to verify if a statistically significant differences in fibers diameters between both muscles exist.

2. Materials and Methods

2.1. Patients and Ethics

Seven surgical patients, 4 men and 3 women, aged 30.5 ± 5.5 years (mean ± standard deviation), with unilateral posterior crossbite were randomly recruited for the study and all of them gave informed consent. They represented the “crossbite group”.
The inclusion criteria for the crossbite patient group were: (i) severe class III malocclusion with right posterior crossbite of two or more posterior teeth; (ii) complete permanent dentition; (iii) no erupting teeth; (iv) no caries; and (v) no temporo-mandibular disorders. The exclusion criteria were history of connective tissue disorders, myopathies, endocrine disorders, autoimmune disease, and bone disease.
Five surgical control patients, 2 men and 3 women, aged 30.5 ± 5.5 years (mean ± standard deviation), with no malocclusion were randomly recruited for the study and they represented the “control group”. The inclusion criteria were: (i) no malocclusion disease; (ii) complete permanent dentition; (iii) no erupting teeth; (iv) no caries; and (v) no temporo-mandibular disorders. The exclusion criteria were history of connective tissue disorders, myopathies, endocrine disorders, autoimmune disease, and bone disease.
The investigation conformed with guidelines established by the University Internal Review Board for use of Human Subjects and with the principles outlined in the Helsinki Declaration of 1975. Ethics committee approval: “Morphological and molecular evaluation of the masseter muscle in orthognathic surgical patients” approved on 18/06/2018 prot. N.0063261, document n. CS2/372 of “Comitato Etico Interaziendale A.O.U. Città della Salute e della Scienza di Torino-A.O. Ordine Mauriziano-A.S.L. Città di Torino”.

2.2. Muscle Biopsies

Biopsies were obtained from the superficial portion of both masseter muscles of patients undergoing orthognathic surgery. All biopsies were obtained by the same surgeon via an intraoral incision through the mucosa and buccinator muscle, approximately 3 × 3 × 3 mm³ [9].

2.3. Immunofluorescence

The biopsies were fixed in 4% paraformaldehyde in 0.2 M phosphate buffer, pH 7.4, for 2 h at room temperature. They were then washed extensively with 0.2 M phosphate buffer, pH 7.4, and then with phosphate-buffered saline (PBS). The samples were dehydrated in alcohol (from 50% to 100%) and included in paraffin as the protocol. After that, 12-μm sections were prepared in a manual microtome and were placed on polylysine glass slides.
After deparaffinization, to block non-specific binding sites and to permeabilize the membranes, the sections were preincubated with 1% bovine serum albumin (BSA), 0.3% Triton X-100 in PBS at room temperature for 15 min as protocol [9,10,11,12]. Finally, the sections were incubated with primary antibody. The following primary antibody was used: mouse monoclonal anti-gamma sarcoglycan antibody, diluted at 1:100 (E-8, sc-515628, Santa Cruz Biotechnology Inc., Santa Cruz, CA, USA); the antibody was detected using Texas Red-conjugated IgG anti-mouse (Jackson ImmunoResearch Laboratories, Inc., West Grove, PA, USA).
Slides were finally washed in PBS and sealed with mounting medium. The sections were then analyzed and images acquired using a Zeiss LSM 5 DUO (Carl Zeiss, Jena, Germany) confocal laser scanning microscope. All images were digitalized at a resolution of 8 bits into an array of 2.048 × 2.048 pixels. Optical sections of fluorescent specimens were obtained using a helium–neon (HeNe) laser (Carl Zeiss, Jena, Germany) (wavelength, 543 nm) at a 62-s scanning speed with up to eight averages; 1.50-μm sections were obtained using a pinhole of 250. For each reaction, at least 100 individual fibers were examined. Contrast and brightness were established by examining the most brightly labeled pixels and choosing the settings that allowed clear visualization of the structural details while maintaining the highest pixel intensity (~200). Each image was acquired within 62 s in order to minimize photodegradation.

2.4. Image Analysis

We calculated the diameter of masseter muscles and the cross-sectional area of fibers of the control and crossbite groups. To do that, we used immunofluorescence pictures from anti-gamma sarcoglycan reactions to highlight the sarcolemma of each fiber. To perform the measurements, we selected random confocal microscope pictures of right and left masseter muscles fibers from the control group and of both contralateral and ipsilateral masseter muscles of the crossbite group. In detail, to establish the diameters, we measured 60 longitudinal fibers of the control group (30 fibers for the left and 30 for the right sides) and 60 fibers for each muscle from the crossbite group; to establish the cross-sectional area we measured 60 transversal fibers of control group (30 fibers for the left and 30 for the right sides) and 60 transversal fibers for each muscle of the crossbite group.

ImageJ Application

All steps of image processing were performed using ImageJ software. The following steps aims to calculate muscle fibre diameters and cross-sectional areas:
Step 1. Open the fluorescent image for gamma sarcoglycan with ImageJ, click on analyze to set the scale.
Step 2. Click on Image, adjust and brightness/contrast to minimize the background.
Step 3. Use the linear bar to perform two different measurements: (a) longitudinal fiber diameters; (b) transversal fiber cross-sectional area. In each longitudinal fiber, the diameter was taken from three different points: top, middle and bottom diameters. The values of the transversal fibers were used to establish the cross-sectional area using the formula “πr2
Step 4. All the measurement data are downloaded in excel format and they are processed for statistical analyses.

2.5. Statistical Analysis

We added the values of the top, middle and bottom diameters to obtain a mean for each longitudinal fiber. After that, we added the means of 60 fibers (30 fibers from the left and 30 fibers from the right masseter muscles) to obtain a mean for the control group and we added the means of 60 fibers to obtain the means for both the contralateral and ipsilateral muscles of the crossbite group. Finally, we compared the means using Student’s t-test with the following combinations: control vs. contralateral; control vs. ipsilateral; and contralateral vs. ipsilateral. The data were also used to calculate the standard deviation, distribution, and frequency. The results were used to create graphics.

3. Results

3.1. Immunofluorescence

Immunofluorescence results show the expression of gamma sarcoglycan along the sarcolemma and within the fibers in control muscles and in both contralateral and ipsilateral masseter muscles (Figure 1). The intensity of fluorescence was higher in the contralateral muscles (Figure 1B) than in the control muscle (Figure 1A) and the ipsilateral side (Figure 1C), supporting our previous results showing a higher expression of sarcoglycans and integrins in contralateral masseter muscles when compared to ipsilateral ones [6].

3.2. ImageJ and Statistics

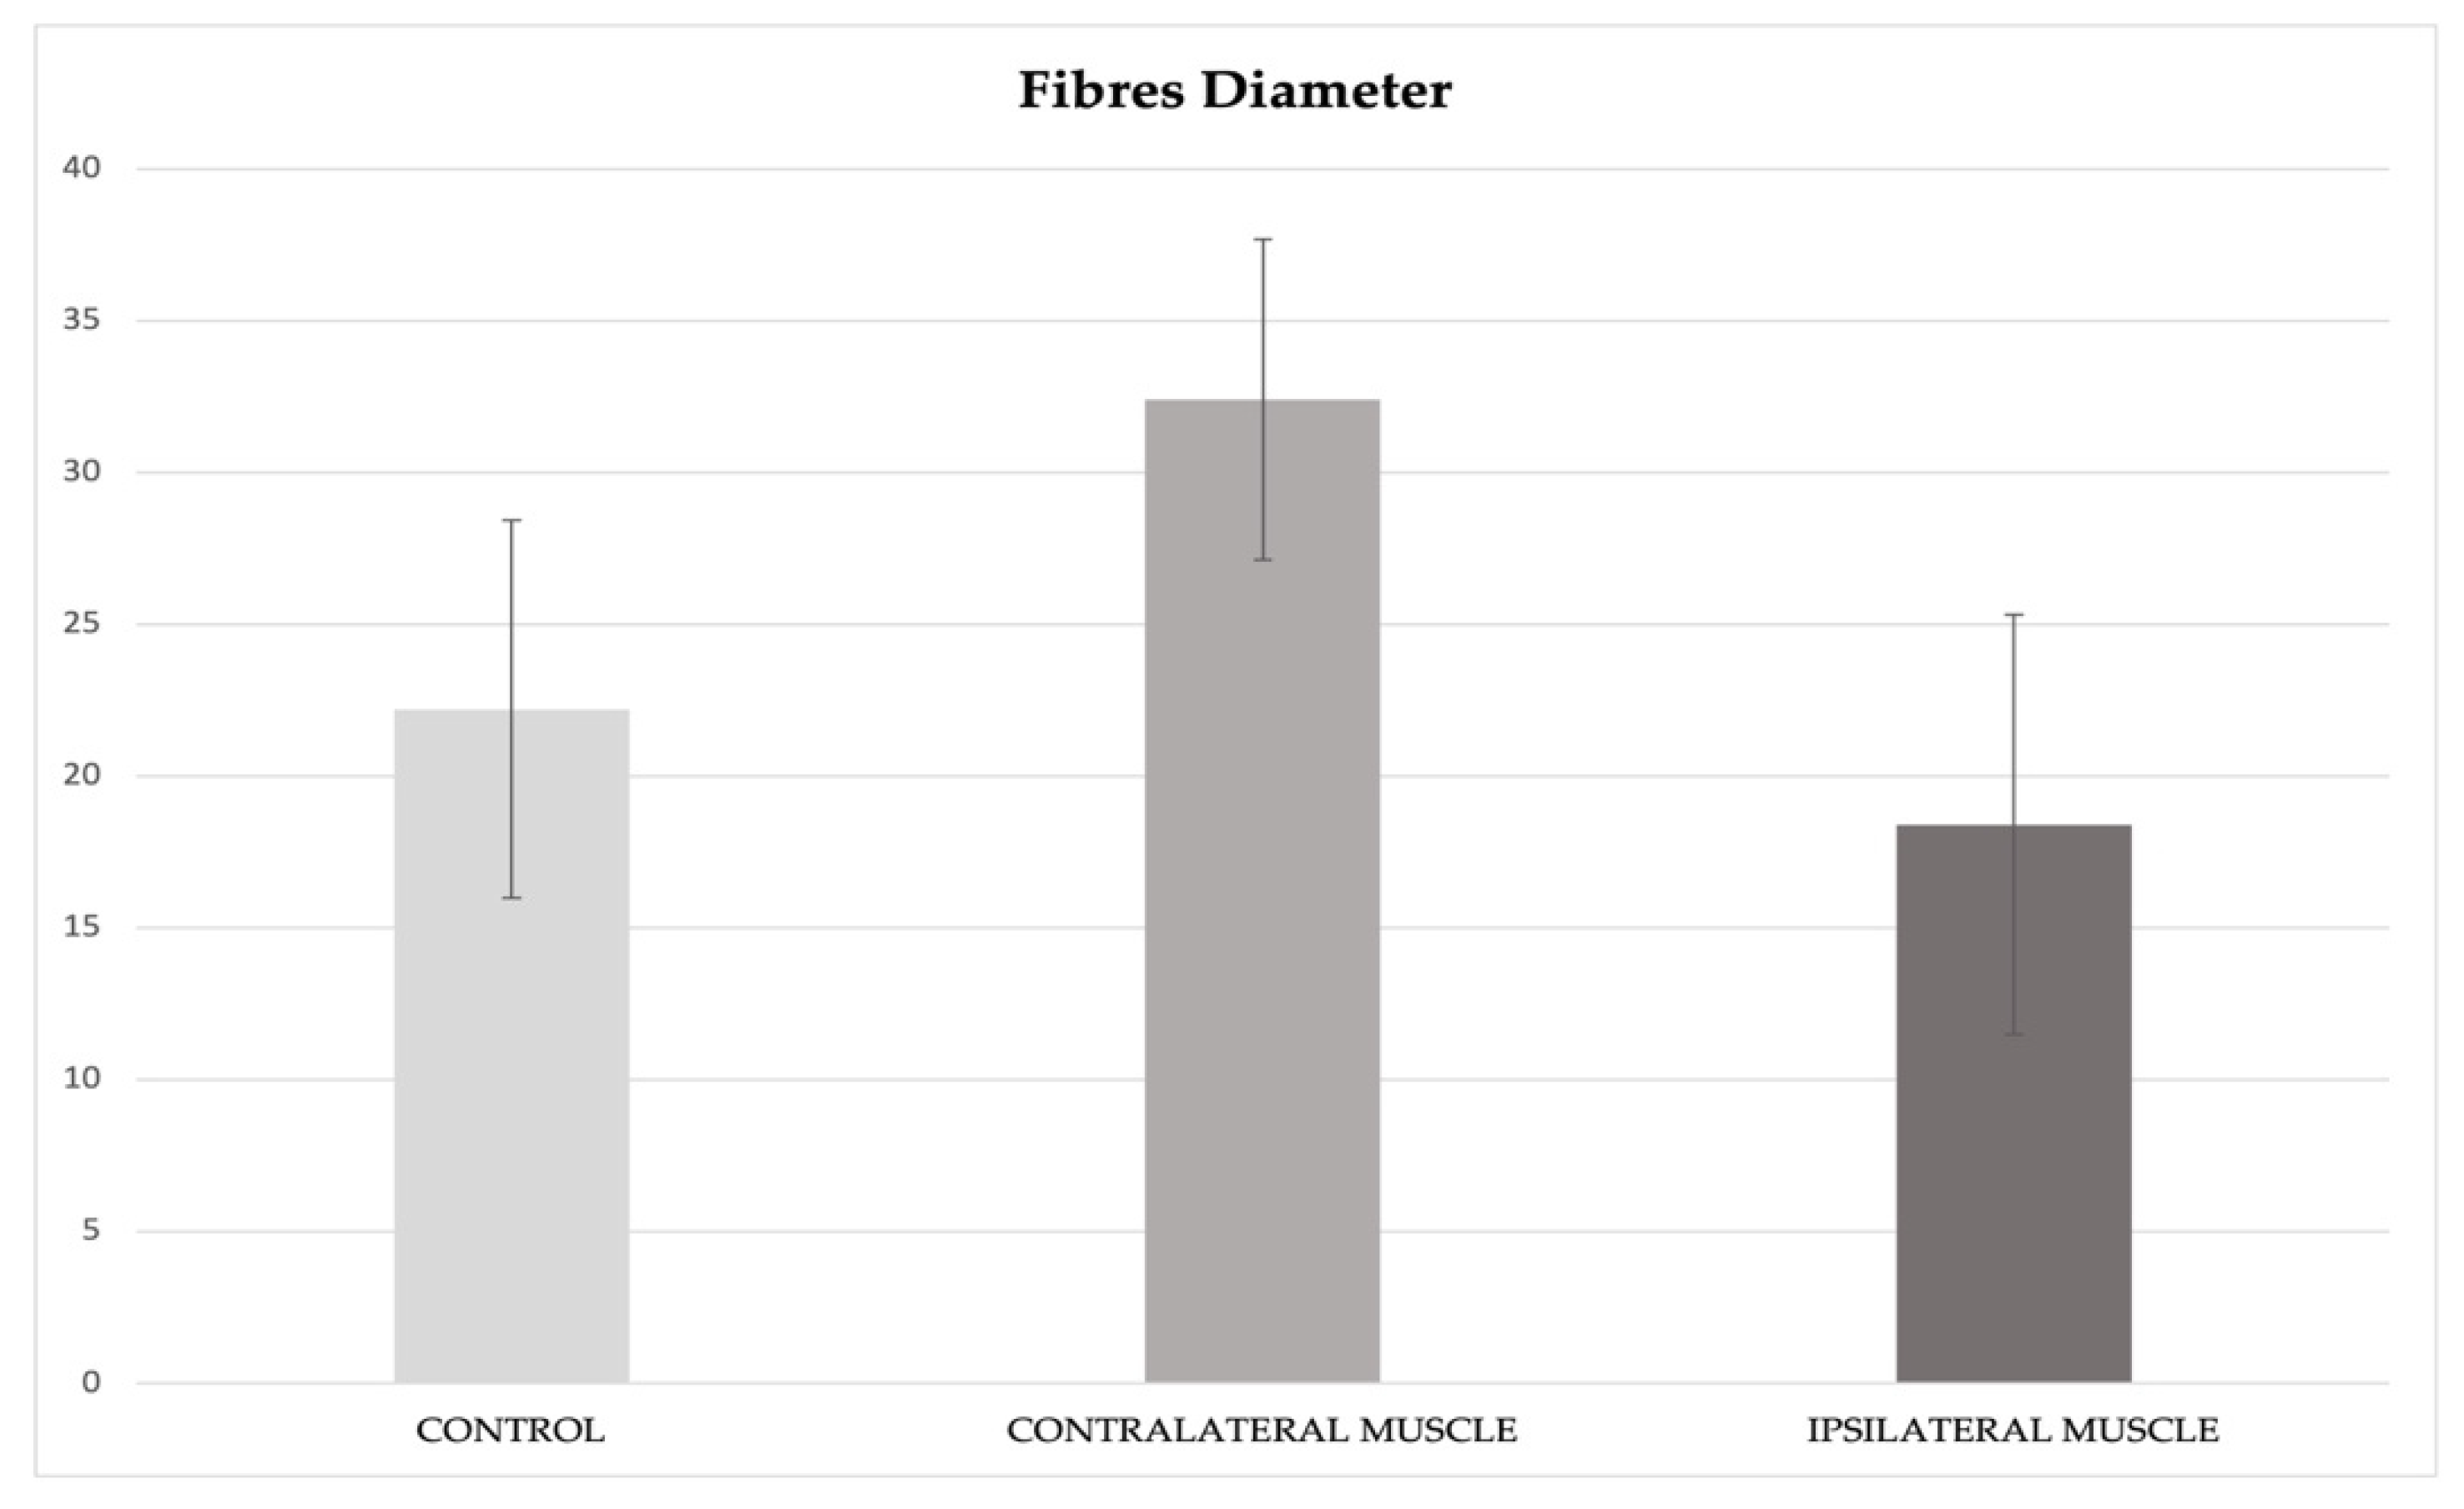
Results show that the mean of the fiber diameters for the control group was 22.2 µm; the mean of fiber diameters for the ipsilateral muscle of crossbite group was 18.4 µm and the mean for the contralateral muscle of crossbite group was 32.4 µm. The means of fiber diameters were inserted into a histogram (Figure 2). The standard deviations for control, contralateral, and ipsilateral were 5.5, 2.2, and 5.4, respectively.
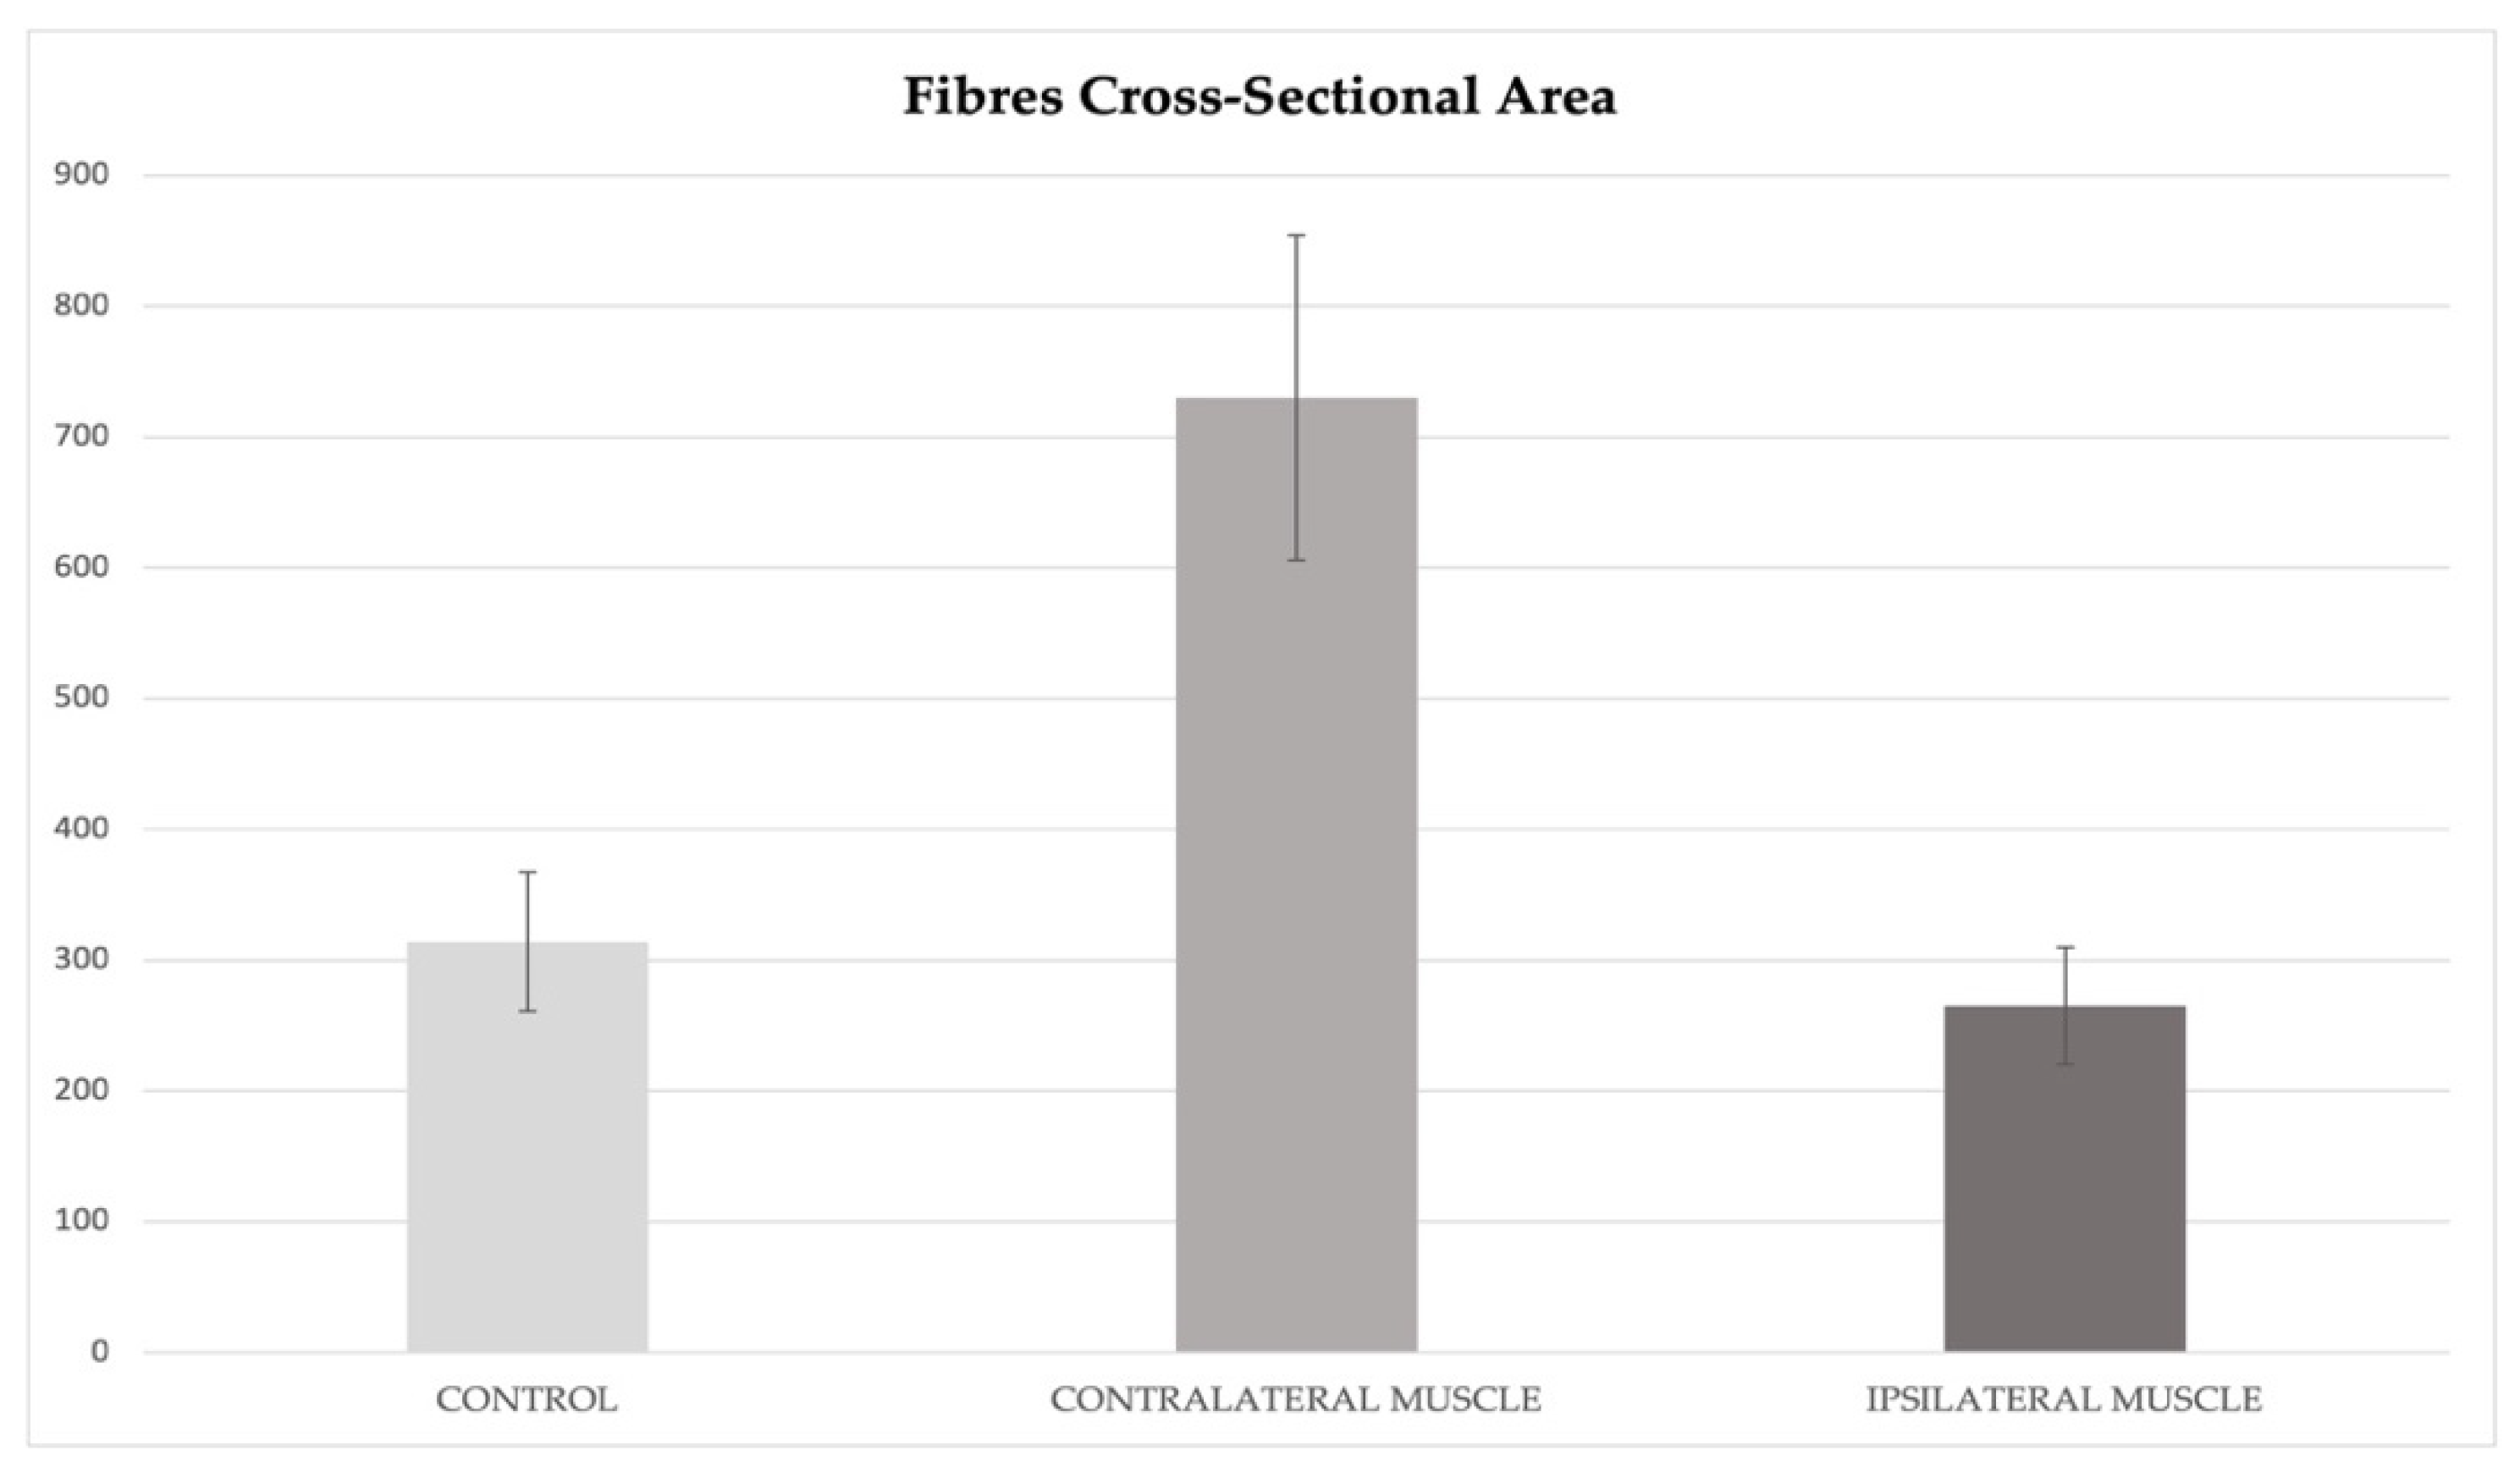
The means of cross-sectional area for control group, ipsilateral and contralateral muscles of the crossbite group are, respectively, 314 µm2, 265 µm2, and 730 µm2. The means of fiber cross-sectional areas were inserted into a histogram (Figure 3). The standard deviations for control, contralateral, and ipsilateral were 13.3, 20.9, and 9.6, respectively.
Student’s t-test results show that the differences were statistically significant in the following comparisons: control–contralateral with a p-value = 0.04 and contralateral–ipsilateral with a p-value = 0.02. The difference between control and ipsilateral is not statistically significant, with a p-value = 0.08. The same statistical results were found for the cross-sectional area: the differences were statistically significant in the following comparisons: control–contralateral with a p-value = 0.02 and contralateral–ipsilateral with a p-value = 0.01. The difference between control and ipsilateral is not statistically significant with the p-value = 0.1.
The frequency data of diameter show as the most of the fiber diameter values are between 20 and 30 µm for the control group, between 10 and 20 µm for the ipsilateral muscle (crossbite group) and between 30 and 40 µm for the contralateral muscle (crossbite group) (Figure 4).
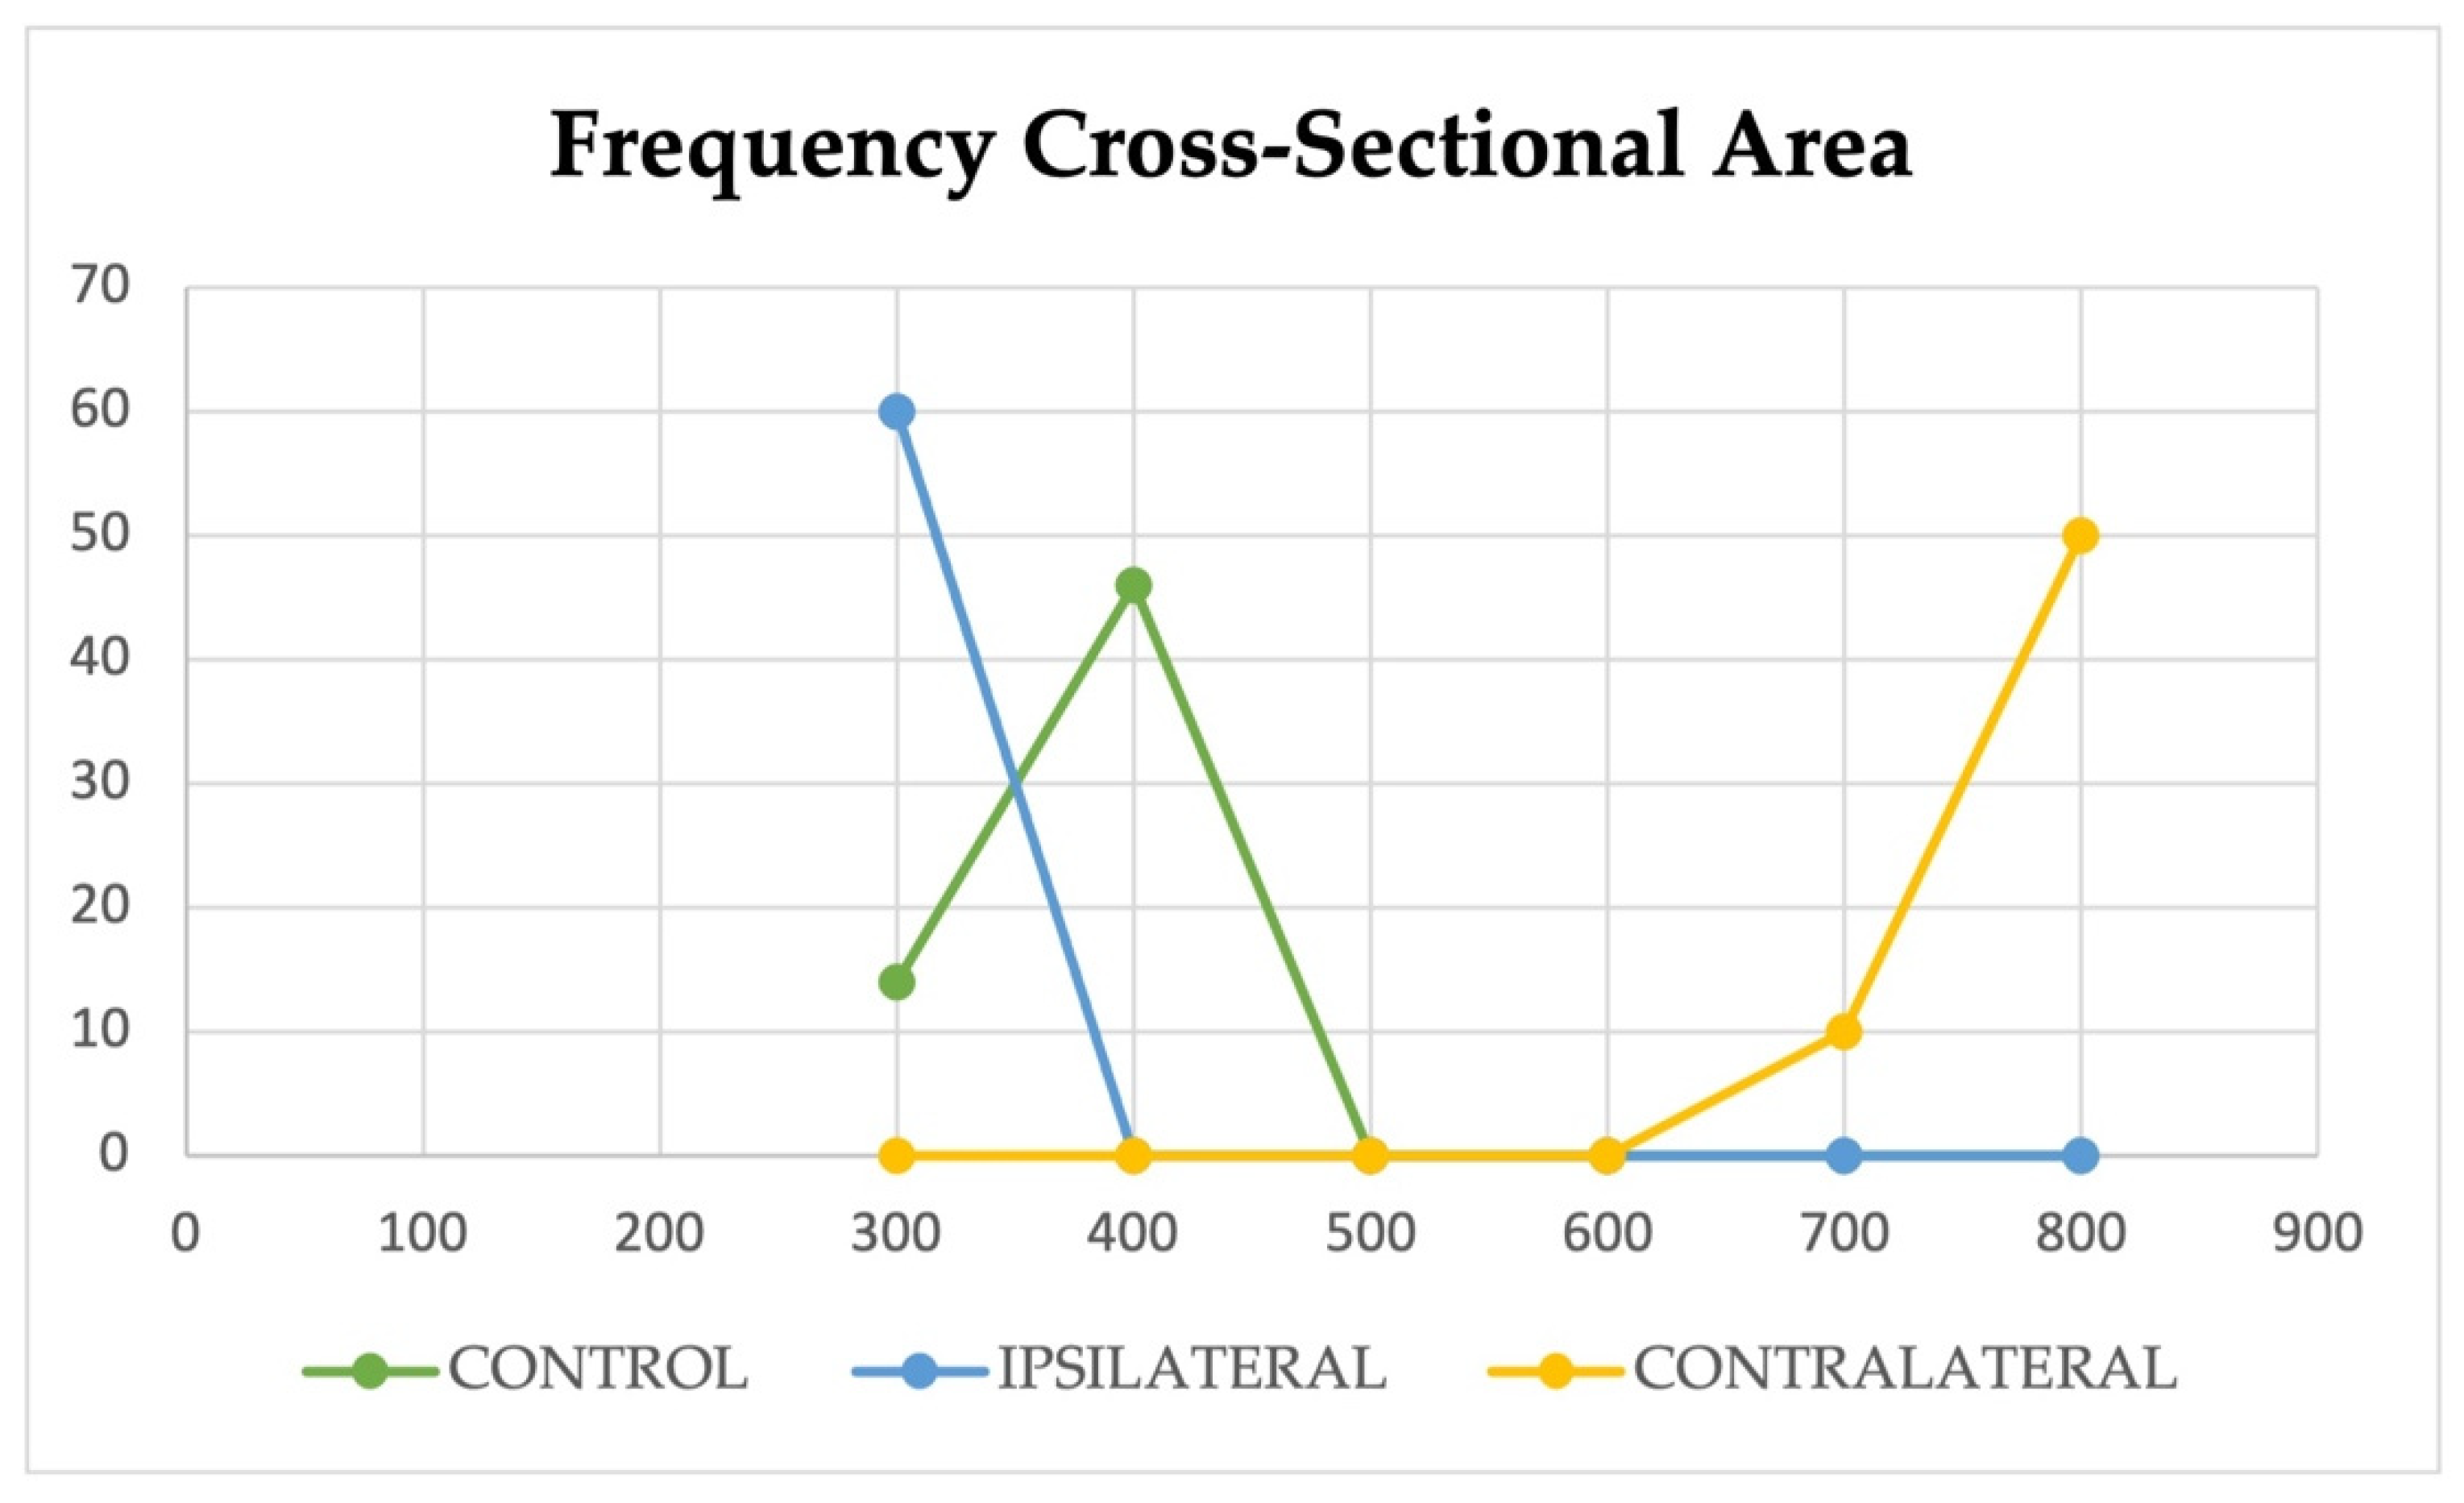
The frequency data of cross-sectional area values show that most of the cross-sectional area values are between 300 and 400 µm2 for the control group, between 200 and 300 µm2 for the ipsilateral muscle (crossbite group) and between 700 and 800 µm2 for the contralateral muscle (crossbite group) (Figure 5).
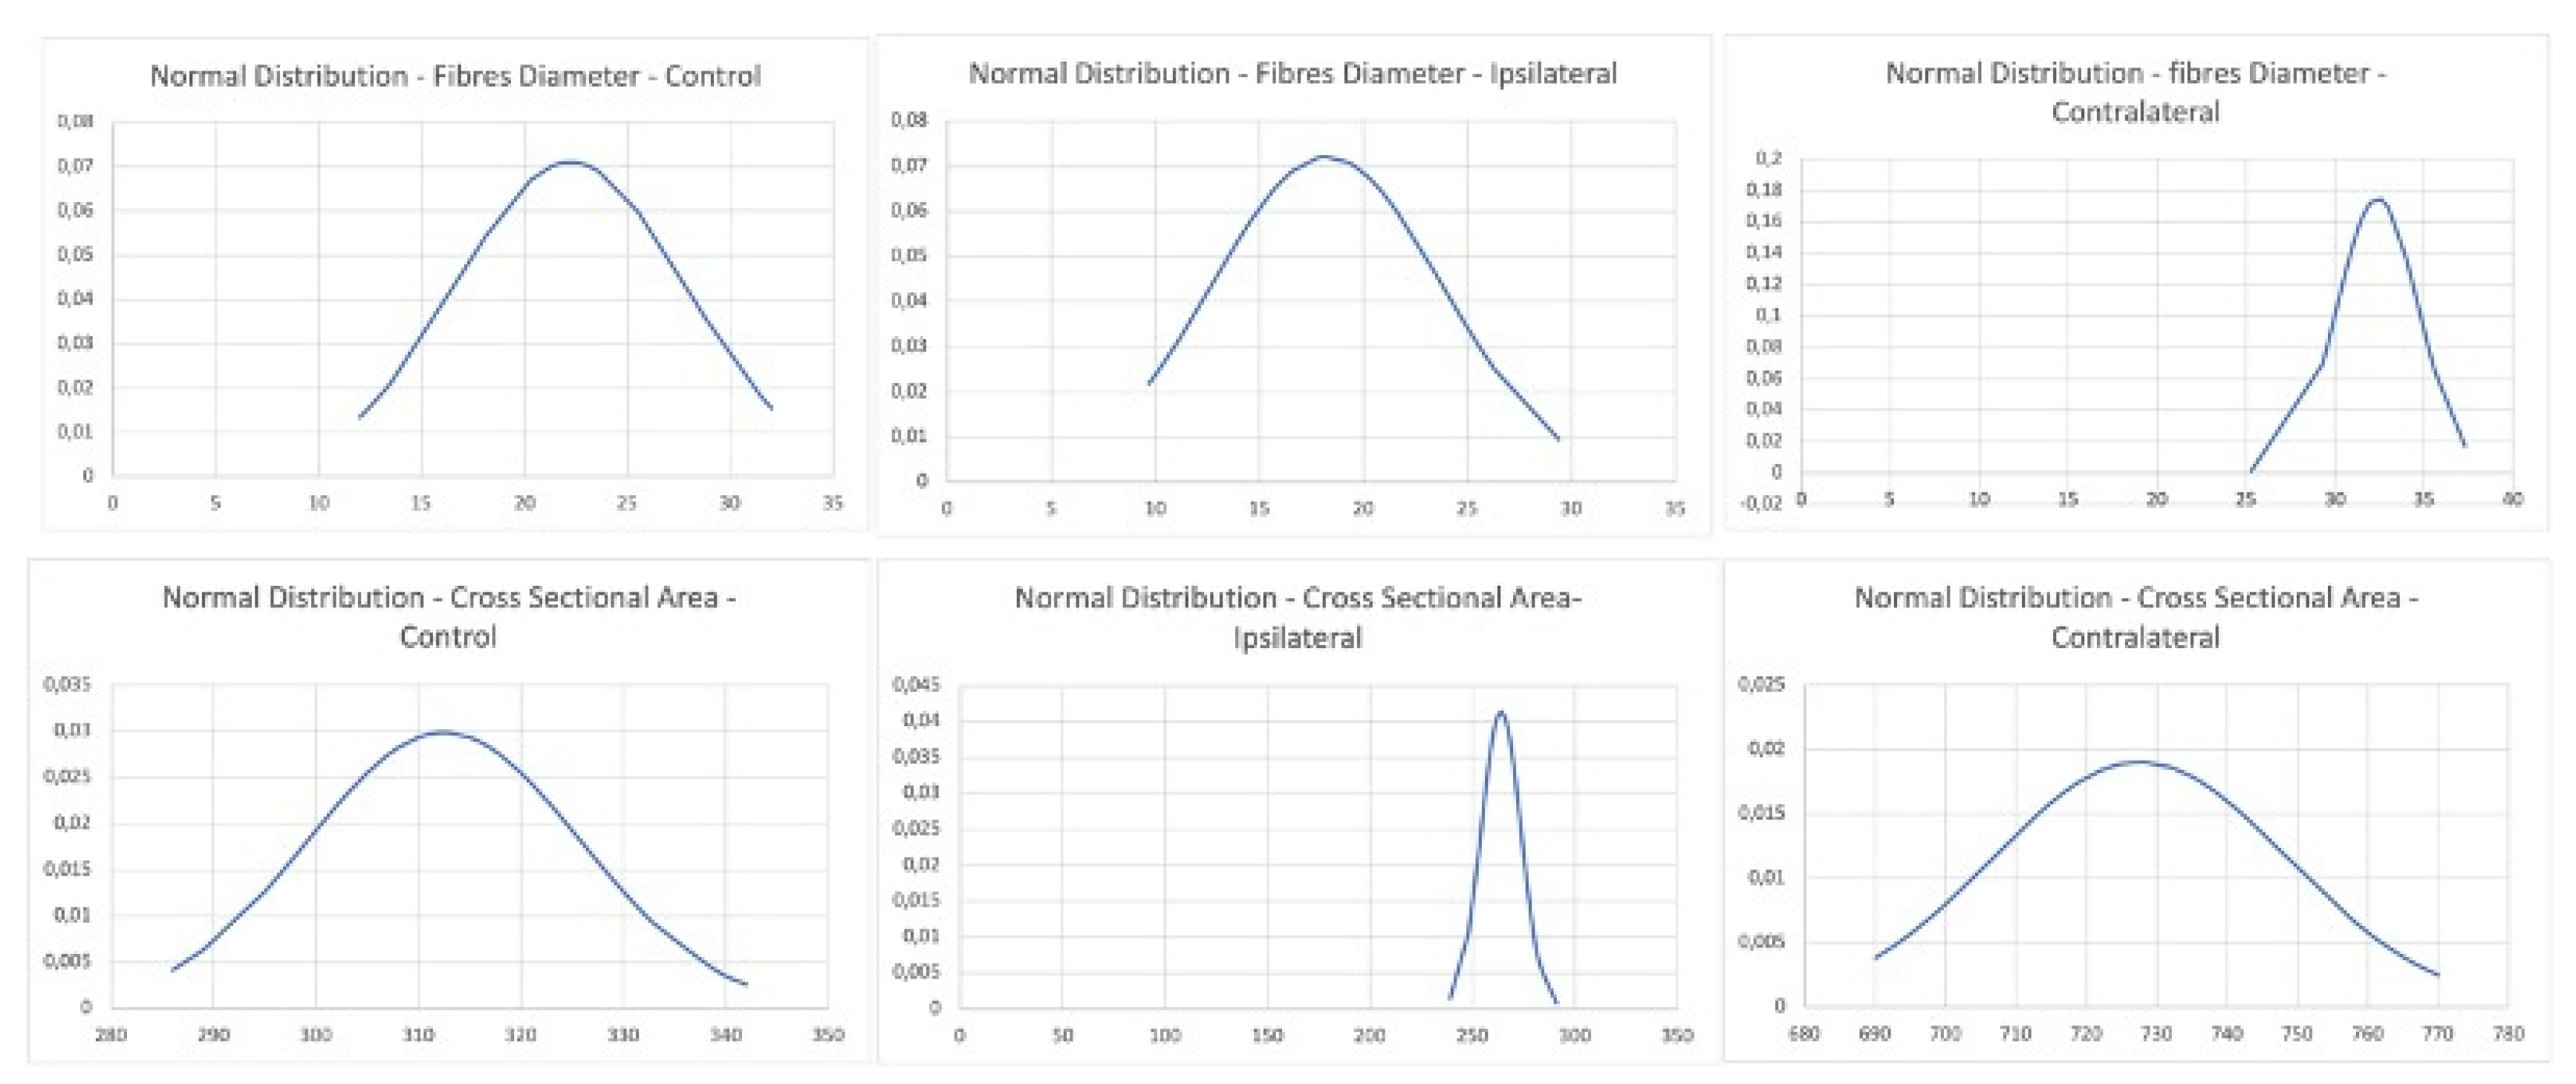
The distribution analysis showed a normal distribution of diameter and cross-sectional area values for the control group and for both the ipsilateral and contralateral muscles of the crossbite group. The Gaussian curves are illustrated in Figure 6.

4. Discussion

Unilateral posterior crossbite is a malocclusion disease characterized by an inverse relationship between the lower and upper dental cusps [1,13,14,15,16]. Electrophysiological studies have demonstrated that, when chewing on the affected side, the ipsilateral muscle shows reduced activity and the contralateral muscle activity is normal or increased [2,17,18,19]. The increased work of the contralateral muscle depends on trying to compensate for the affected side. All changes in muscle function determine the morphological changes that seem to correlate with the hypertrophic and atrophic responses of contralateral and ipsilateral muscles, respectively [6,7,8,20,21].
Although several functional and morphological data support the existence of hypertrophy and hypotrophy or atrophy [22], no investigations about masseter muscle fiber diameters during unilateral posterior crossbite exist in the literature. The aim of the present study was to perform a measurement of fiber diameter, both for both the ipsilateral and contralateral sides, using immunofluorescence pictures and ImageJ software.
Immunofluorescence results showed the expression of gamma sarcoglycan along the sarcolemma and within fibers in the control muscle, and both in contralateral and ipsilateral masseter muscles. The intensity of fluorescence was higher in the control muscles and in the contralateral muscles than in the ipsilateral muscles, supporting our previous results that showed a higher expression of sarcoglycans and integrins in contralateral masseter muscles when compared to ipsilateral ones [6]. Sarcoglycans and integrins are proteins systems that play a crucial role in sarcolemma stabilization during muscle contraction. As such, their increase or decrease correlate with a good or impaired muscle activity, respectively [23,24,25,26].
Despite this, the fluorescence staining pattern was good for marking the fibers of all muscles in order to perform diameter measurements. It is widely accepted in the literature that a hypertrophic adult muscle has a larger fiber diameter than a normal muscle. Hypertrophy in contralateral masseter muscle has been indirectly linked to the existence of a higher number of myonuclei and satellite cells. The higher workload would cause the satellite cells to proliferate and donate myonuclei to pre-existing fibers, determining the hypertrophy of muscle; moreover, the high expressions of sarcoglycans and integrins are explained by the myonuclear domain theory: more myonuclei results in more muscle protein synthesis. The expression of myogenesis markers in contralateral muscle has also been determined, supporting that new fiber formation takes place.
In contrast, a hypotrophic muscle has very thin muscle fibers due to the loss of contractile elements; this loss become more severe in atrophy. The hypotrophic condition in the ipsilateral masseter muscle were indirectly demonstrated by a low number of myonuclei and satellite cells; moreover, both sarcoglycans and integrins were found to be reduced in ipsilateral muscle and could also be explained by the myonuclear domain theory. In atrophic masseter muscle, it was also found to be increased in the extracellular matrix.
All these morphological data represent an indirect way to establish the existence of hypertrophic and/or hypotrophic/atrophic responses in masseter muscle. Through radiological investigation, it is possible to establish the entire muscle volume for both sides. Despite this, the aforementioned methods do not allow to know whether the increase in volume depends on an increase of fiber thickness or on new fiber formation; they also do not allow to know the diameter of individual fibers.
Fiber size measurements have already been performed on masseter muscle in several occlusion states [27,28,29], but no data exist about the differences in size that occur between contralateral and ipsilateral muscles during unilateral posterior crossbite.
Our results have shown a statistically significant difference between the mean diameters of contralateral and ipsilateral fibers. Moreover, our results show a statistically significant difference between control and ipsilateral muscles; however, no statistically significant difference was found between the control and ipsilateral groups. This is in accordance with the cross-sectional area values measured in the three groups.
On this basis, we can confirm that, in unilateral posterior crossbite, the contralateral muscle undergoes a hypertrophic response, probably due to the attempt of compensating for the affected muscle. This results in the significant volumetric increase of fibers compared to normal muscle fiber sizes. On the other side, the ipsilateral muscle is characterized by fibers that are smaller than normal fibers, but this difference is not significant. Moreover, the difference between the contralateral and ipsilateral fiber size is significant. On this basis, we can assert that this significant difference depends more on a volumetric increase than on a reduction in volume of the ipsilateral muscle fibers. This could be explained by the fact that a muscle goes into hypertrophy faster than hypotrophy. In fact, adult skeletal muscle possesses a “muscle memory” that makes it more ready to face an increase in volume than a loss of contractile elements, a process that requires much longer.

5. Conclusions

During unilateral posterior crossbite, the first morphological changes seems to involve the contralateral masseter muscle, which undergoes hypertrophy, as evidenced by the statistically significant increase in their fiber diameters when compared to both control and ipsilateral muscles. On this basis, we can suggest that contralateral muscle hypertrophy is a response to the higher workload this muscle it is subjected to, in order to compensate for the already demonstrated low activity of the affected muscle [1].

Author Contributions

Data Curation, G.C. and A.C.; Formal Analysis, G.P.; Founding acquisition, M.M.; Investigation, M.M. and G.A.; Methodology, G.V. and G.S.; Resources, M.R.A.; Supervision, G.C. and M.P.; Validation, M.P. and A.C.; Visualization, M.R.A. and G.P.; Writing—Original draft, G.V.; Writing—Review and Editing, G.A. All authors have read and agreed to the published version of the manuscript.

Funding

This research received no external funding.

Institutional Review Board Statement

“Morphological and molecular evaluation of the masseter muscle in orthognathic surgical patients” approved on 18 June 2018 prot. N.0063261, document n. CS2/372 of “Comitato Etico Interaziendale A.O.U. Città della Salute e della Scienza di Torino-A.O. Ordine Mauriziano-A.S.L. Città di Torino”. The study was conducted according to the guidelines of the Declaration of Helsinki, and approved by the Institutional Review Board.

Informed Consent Statement

Informed consent was obtained from all subjects involved in the study.

Data Availability Statement

MDPI Research Data Policies at https://www.mdpi.com/ethics.

Conflicts of Interest

The authors declare no conflict of interest.

References

  1. Piancino, M.G.; Farina, D.; Talpone, F.; Merlo, A.; Bracco, P. Muscular activation during reverse and non-reverse chewing cycles in unilateral posterior crossbite. Eur. J. Oral Sci. 2009, 117, 122–128. [Google Scholar] [CrossRef]
  2. Piancino, M.G.; Comino, E.; Talpone, F.; Vallelonga, T.; Frongia, G.; Bracco, P. Reversesequencing chewing patterns evaluation in anterior versus posterior unilateral crossbite patients. Eur. J. Orthod. 2012, 34, 536–541. [Google Scholar] [CrossRef] [Green Version]
  3. Bani, D.; Bani, T.; Bergamini, M. Morphologic and biochemical changes of the masseter muscles induced by occlusal wear: Studies in a rat model. J. Dent. Res. 1999, 78, 1735–1744. [Google Scholar] [CrossRef]
  4. De Souza Guerra, C.; Pereira, C.L.; Mardegan Issa, J.P.; Galisteu Luiz, K.; Del Bel Guimarães, E.A.; Gerlach, R.F.; Iyomasa, M. Histological, histochemical, and protein changes after induced malocclusion by occlusion alteration of Wistar rats. Biomed. Res. Int. 2014, 2014, 563463. [Google Scholar] [CrossRef]
  5. Iodice, G.; Danzi, G.; Cimino, R.; Paduano, S.; Michelotti, A. Association between posterior crossbite, skeletal, and muscle asymmetry: A systematic review. Eur. J. Orthod. 2016, 38, 638–651. [Google Scholar] [CrossRef] [PubMed] [Green Version]
  6. Cutroneo, G.; Vermiglio, G.; Centofanti, A.; Rizzo, G.; Runci, M.; Favaloro, A.; Piancino, M.G.; Bracco, P.; Ramieri, G.; Bianchi, F.; et al. Morphofunctional compensation of masseter muscles in unilateral posterior crossbite patients. Eur. J. Histochem. 2016, 60, 2605. [Google Scholar] [CrossRef]
  7. Cutroneo, G.; Piancino, M.G.; Ramieri, G.; Bracco, P.; Vita, G.; Isola, G.; Vermiglio, G.; Favaloro, A.; Anastasi, G.; Trimarchi, F. Expression of muscle-specific integrins in masseter muscle fibers during malocclusion disease. Int. J. Mol. Med. 2012, 30, 235–242. [Google Scholar] [CrossRef] [PubMed] [Green Version]
  8. Vermiglio, G.; Centofanti, A.; Ramieri, G.; Tepedino, M.; Runci Anastasi, M.; Micali, A.G.; Arco, A.; Piancino, M.G. Immunofluorescence Evaluation of Myf5 and MyoD in Masseter Muscle of Unilateral Posterior Crossbite Patients. J. Funct. Morphol. Kinesiol. 2020, 5, 80. [Google Scholar] [CrossRef]
  9. De Ponte, F.S.; Cutroneo, G.; Falzea, G.; Rizzo, G.; Catalfamo, L.; Favaloro, A.; Vermiglio, G.; Runci, M.; Centofanti, A.; Anastasi, G. Histochemical and morphological aspects of fresh frozen bone: A preliminary study. Eur. J. Histochem. 2016, 60, 2642. [Google Scholar] [CrossRef]
  10. De Ponte, F.S.; Favaloro, A.; Siniscalchi, E.; Centofanti, A.; Runci, M.; Cutroneo, G.; Catalfamo, L. Sarcoglycans and integrins in bisphosphonate treatment: Immunohistochemical and scanning electron microscopy study. Oncol. Rep. 2013, 30, 2639–2646. [Google Scholar] [CrossRef] [PubMed]
  11. DE Ponte, F.S.; Catalfamo, L.; Micali, G.; Runci, M.; Cutroneo, G.; Vermiglio, G.; Centofanti, A.; Rizzo, G. Effect of bisphosphonates on the mandibular bone and gingival epithelium of rats without tooth extraction. Exp. Ther. Med. 2016, 11, 1678–1684. [Google Scholar] [CrossRef] [Green Version]
  12. Militi, A.; Cutroneo, G.; Favaloro, A.; Matarese, G.; Di Mauro, D.; Lauritano, F.; Centofanti, A.; Cervino, G.; Nicita, F.; Bramanti, A.; et al. An immunofluorescence study on VEGF and extracellular matrix proteins in human periodontal ligament during tooth movement. Heliyon 2019, 5, e02572. [Google Scholar] [CrossRef] [Green Version]
  13. Suzuki, Y.; Saitoh, K.; Imamura, R.; Ishii, K.; Negishi, S.; Imamura, R.; Yamaguchi, M.; Kasai, K. Relationship between molar occlusion and masticatory movement in lateral deviation of the mandible. Am. J. Orthod. Dentofacial Orthop. 2017, 151, 1139–1147. [Google Scholar] [CrossRef] [PubMed]
  14. Caroccia, F.; Moscagiuri, F.; Falconio, L.; Festa, F.; D’Attilio, M. Early Orthodontic Treatments of Unilateral Posterior Crossbite: A Systematic Review. J. Clin. Med. 2020, 10, 33. [Google Scholar] [CrossRef]
  15. Lopatienė, K.; Trumpytė, K. Relationship between unilateral posterior crossbite and mandibular asymmetry during late adolescence. Stomatologija 2018, 20, 90–95. [Google Scholar] [PubMed]
  16. Brizuela, M.; Palla, A.; Dilip, K.N. Posterior Crossbite Review; StatPearls [Internet]; StatPearls Publishing: Treasure Island, FL, USA, 2021. [Google Scholar]
  17. Piancino, M.G.; Talpone, F.; Dalmasso, P.; Debernardi, C.; Lewin, A.; Bracco, P. Reversesequencing chewing patterns before and after treatment of children with a unilateral posterior crossbite. Eur. J. Orthod. 2006, 28, 480–484. [Google Scholar] [CrossRef] [Green Version]
  18. Nie, Q.; Kanno, Z.; Xu, T.; Lin, J.; Soma, K. Clinical study of frontal chewing patterns in various crossbite malocclusions. Am. J. Orthod. Dentofacial. Orthop. 2010, 138, 323–329. [Google Scholar] [CrossRef] [PubMed]
  19. Sever, E.; Marion, L.; Ovsenik, M. Relationship between masticatory cycle morphology and unilateral crossbite in the primary dentition. Eur. J. Orthod. 2011, 33, 620–627. [Google Scholar] [CrossRef] [Green Version]
  20. Zammit, P.; Heslop, L.; Hudon, L.; Rosenblatt, J.D.; Tajbakhsh, S.; Buckingham, M.; Beauchamp, J.R.; Partridge, A. Kinetics of myoblast proliferation show that resident satellite cells are competent to fully regenerate skeletal muscle fibers. Exp. Cell. Res. 2002, 281, 39–49. [Google Scholar] [CrossRef] [PubMed]
  21. Bottinelli, R.; Reggiani, C. Human skeletal muscle fibres: Molecular and functional diversity. Prog. Biophys. Mol. Biol. 2000, 73, 195–262. [Google Scholar] [CrossRef]
  22. Bruschetta, D.; Anastasi, G.; Andronaco, V.; Cascio, F.; Rizzo, G.; Di Mauro, D.; Bonanno, L.; Izzo, V.; Buda, D.; Vermiglio, G.; et al. Human calf muscles changes after strength training as revealed by diffusion tensor imaging. J. Sports Med. Phys. Fit. 2019, 59, 853–860. [Google Scholar] [CrossRef]
  23. Cutroneo, G.; Centofanti, A.; Speciale, F.; Rizzo, G.; Favaloro, A.; Santoro, G.; Bruschetta, D.; Milardi, D.; Micali, A.; Di Mauro, D.; et al. Sarcoglycan complex in masseter and sternocleidomastoid muscles of baboons: An immunohistochemical study. Eur. J. Histochem. 2015, 59, 2509. [Google Scholar] [CrossRef] [PubMed] [Green Version]
  24. Raoul, G.; Rowlerson, A.; Sciote, J.; Codaccioni, E.; Stevens, L.; Maurage, C.A.; Duhamel, A.; Ferri, J. Masseter myosin heavy chain composition varies with mandibular asymmetry. J. Craniofac. Surg. 2011, 22, 1093–1098. [Google Scholar] [CrossRef] [PubMed] [Green Version]
  25. Ventura Spagnolo, E.; Mondello, C.; Di Mauro, D.; Vermiglio, G.; Asmundo, A.; Filippini, E.; Alibrandi, A.; Rizzo, G. Analysis on sarcoglycans expression as markers of septic cardiomyopathy in sepsis-related death. Int. J. Legal Med. 2018, 132, 1685–1692. [Google Scholar] [CrossRef]
  26. Arco, A.; Favaloro, A.; Gioffrè, M.; Santoro, G.; Speciale, F.; Vermiglio, G.; Cutroneo, G. Sarcoglycans in the normal and pathological breast tissue of humans: An immunohistochemical and molecular study. Cells Tissues Organs 2012, 195, 550–562. [Google Scholar] [CrossRef]
  27. Ringqvist, M. Size and distribution of histochemical fibre types in masseter muscle of adults with different states of occlusion. J. Neurol. Sci. 1974, 22, 429–438. [Google Scholar] [CrossRef]
  28. Sciote, J.J.; Horton, M.J.; Rowlerson, A.M.; Ferri, J.; Close, J.M.; Raoul, G. Human masseter muscle fiber type properties, skeletal malocclusions, and muscle growth factor expression. J. Oral Maxillofac. Surg. 2012, 70, 440–448. [Google Scholar] [CrossRef] [Green Version]
  29. Sciote, J.J.; Raoul, G.; Ferri, J.; Close, J.; Horton, M.J.; Rowlerson, A. Masseter function and skeletal malocclusion. Rev. Stomatol. Chir. Maxillofac. Chir. Orale 2013, 114, 79. [Google Scholar] [CrossRef] [Green Version]
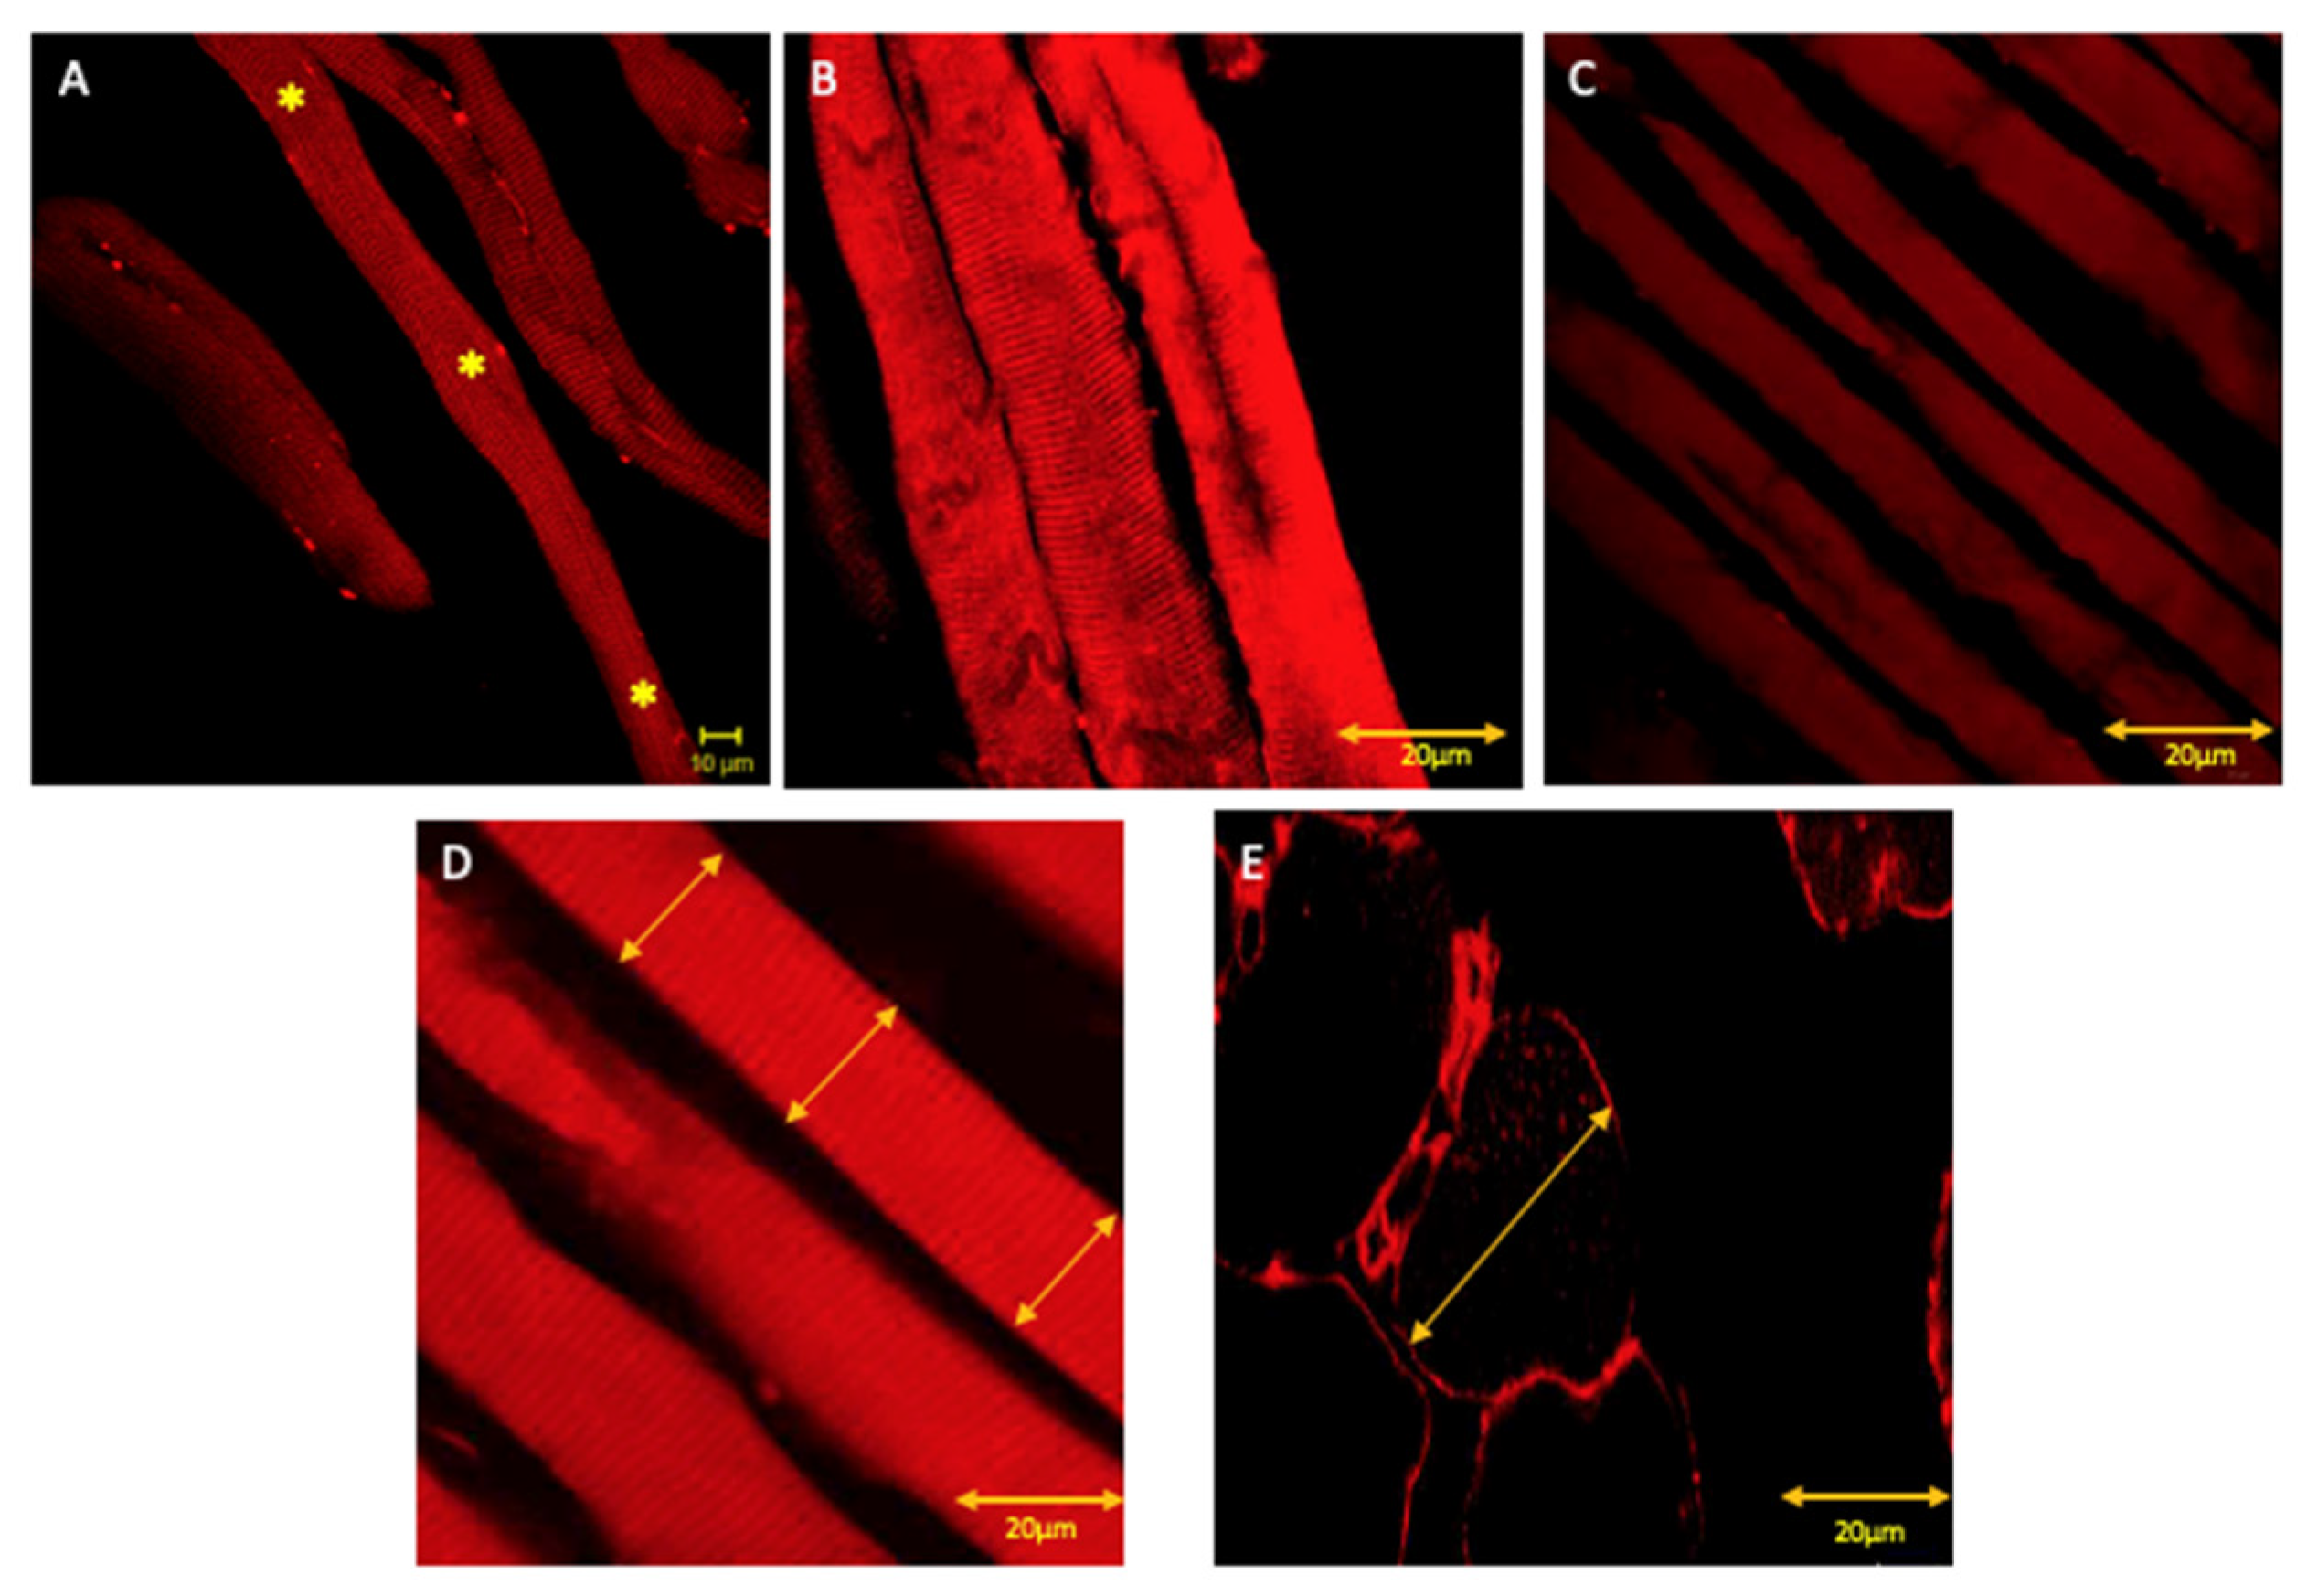
Figure 1. Compound panel of immunofluorescence reaction anti gamma sarcoglycan (red channel) (*where the measurements were taken). Pictures show that all tested muscles express gamma sarcoglycan, although the contralateral masseter fibers (B) show an increased staining pattern for gamma sarcoglycan compared to the control (A) and ispilateral muscles (C). Stars mark the top, middle and bottom diameters; the yellow arrows in (D) and (E) show how the diameter and the cross-sectional area measurements were performed, respectively.
Applsci 11 05350 g001
Figure 2. Histogram showing the mean values of fiber diameters in control, contralateral and ipsilateral muscles: means were 22.2 µm, 32.4 µm, and 18.4 µm, respectively. The bar error corresponds to the standard deviation. The differences are statistically significant in the following comparisons: control–contralateral with a p-value = 0.04 and contralateral–ipsilateral with a p-value = 0.02. The difference between control and ipsilateral is not statistically significant with a p-value = 0.08.
Applsci 11 05350 g002
Figure 3. Histogram showing the mean values of fibers cross-sectional area in the control, contralateral and ipsilateral muscles: the means were 314 µm2, 730 µm2, and 265 µm2, respectively. The bar error corresponds to the standard deviation. The differences are statistically significant in the following comparisons: control–contralateral with a p-value = 0.02 and contralateral–ipsilateral with a p-value = 0.01. The difference between the control and ipsilateral is not statistically significant with a p-value = 0.1.
Applsci 11 05350 g003
Figure 4. The graphic shows the frequency of diameter values. The y-axis shows the number of fibers and the x-axis shows the ranges of diameter values expressed in µm. Most of the fiber diameters are between 20 and 30 µm for the control group, between 10 and 20 µm for the ipsilateral muscle (crossbite group) and between 30 and 40 µm for the contralateral muscle (crossbite group).
Applsci 11 05350 g004
Figure 5. The graphic shows the frequency of cross-sectional area values. The y-axis shows the number of fibers and the x-axis shows the ranges of cross-sectional area values expressed in µm2. Most of the cross-sectional area values are between 300 and 400 µm2 for the control group, between 200 and 300 µm2 for the ipsilateral muscle (crossbite group) and between 700 and 800 µm2 for the contralateral muscle (crossbite group).
Applsci 11 05350 g005
Figure 6. Compound panel of Gaussian curves showing the normal distribution of fiber diameters and cross-sectional area values for the control and for both ipsilateral and contralateral muscles of the crossbite group.
Applsci 11 05350 g006
Publisher’s Note: MDPI stays neutral with regard to jurisdictional claims in published maps and institutional affiliations.